Skip to article sections
Purpose

Despite growing research on online product return behaviour (OPRB), customer behaviour remains complex and unpredictable. Some customers return products assertively with clear complaints, while others exhibit hesitation and silent dissatisfaction. This study distinguishes between assertive and non-assertive returners and examines the intrinsic (e.g. performance and reliability) and extrinsic (e.g. warranty and product information mismatch) product attributes influencing their behaviours.

Design/methodology/approach

Drawing on a large, global dataset of Amazon customer reviews – a reliable source of customer-perceived insights – we employ Latent Dirichlet Allocation topic modelling and (semi)-unsupervised machine learning models (e.g. gradient boosting and self-training) to analyse these reviews. These methods allow us to uncover behavioural patterns and explore the key product characteristics influencing OPRB.

Findings

We find that intrinsic attributes (performance and reliability), extrinsic attributes (warranty), high price and sales rank are key drivers of assertive OPRB. Durability has a heterogeneous effect, while low price and information mismatch are linked to non-assertive OPRB. Additionally, assertive OPRB can be triggered by joint effects between two product attributes.

Practical implications

The findings provide manufacturers with insights to prioritise quality issues in design and production, while e-commerce managers and operations professionals can manage returns more strategically and better address customer dissatisfaction.

Originality/value

This study contributes to attribution, prospect and planned behaviour theories by explaining how intrinsic and extrinsic attributes cause differences in assertive vs non-assertive OPRB, emphasising the role of customer feedback in product development and operational optimisation.

Buy, return and repeat are common in online retail operations, where customers often face high product uncertainties due to the lack of prior physical examination (Hong and Pavlou, 2014). Product returns amounted to $743 billion, accounting for 14.5% of sales in the US (National Retail Federation, 2023). Manufacturers and retailers are spending 4–6% of their revenue on return management, largely due to all hidden costs associated with return processes such as reverse logistics, repackaging, refurbishment, and inventory clearances (Frei et al., 2020; Wang et al., 2024). Furthermore, product return activities are also accountable for substantial environment footprints with returned textiles alone generating up to 5.6 million tonnes of CO2-equivalent greenhouse gas emissions (European Environment Agency, 2024). Product returns are thus seen as a significant burden for both businesses and the environment.

Given product returns is a costly yet integral part of online marketplaces, understanding online product return behaviour (OPRB) and its underlying drivers is essential for developing an effective product return mitigation strategy. While research on OPRB in production and operations management has expanded significantly (Akçay et al., 2013; Fernandez-Lores et al., 2024; Griffis et al., 2012; Rao et al., 2014; Shang et al., 2017a; Simpson et al., 2019), variations in how different customer segments assess product value after purchase continue to persist (Abdulla et al., 2019). Additionally, there are no defined control mechanisms available to regulate or guide customer’s OPRB (Frei et al., 2020). This diversity continues to result in complex and often unpredictable OPRB, presenting ongoing challenges for retailers and researchers alike in understanding and preventing OPRB effectively.

As OPRB is multi-faceted and highly individualistic, it is essential to recognise personal characteristics that distinguish each customer rather than viewing them as a uniform group. Particularly, prior research has revealed notable difference in OPRB across demographics such as age groups (Das and Kunja, 2024) and cultural differences (Serravalle et al., 2022). However, there is a lack of OPRB studies that segment customer types based on intangible drivers such as psychological influences. Wachter et al. (2012) is among the few who identified three types of return behaviours: the planned/unethical, eager and reluctant/educated returners based on consumer ethical belief.

While the driving forces behind the planned/unethical OPRB have been well-studied in the context of impulsive buying and abusive returns (e.g. Abdulla et al., 2025; Ketzenberg et al., 2020; Shang et al., 2017a), the underlying motivation that differentiates two legitimate/ethical OPRB (i.e. eager vs reluctant) remains underexplored. It is important to acknowledge and address the distinction between these two behaviours, treating them accordingly. Especially when consumers are reluctant to express dissatisfaction or make product return decision, they may quietly switch to alternatives. That means sellers miss opportunities to convert dissatisfaction into satisfaction, and ultimately losing revenues from future sales, as Richins (1983) warned.

To gain deeper insights into OPRB, large marketplaces such as Amazon, Walmart or Alibaba often ask customers their return reasons. However, this interaction style is passive and lacks details (Cheng et al., 2024). In contrast, online reviews offer rich insights to examine OPRB, since customers proactively share their experience. Negative reviews provide valuable feedback, as dissatisfied customers are more genuine to share their experiences to ease dissatisfaction (Zeelenberg and Pieters, 2004). Studies found that negative reviews have stronger detrimental impact to sales and returns rate than positive ones, making sellers less attractive to customers (Chevalier and Mayzlin, 2006; Minnema et al., 2016; Ramanathan et al., 2017; Tóth et al., 2019). Managing these reviews is essential for addressing OPRB.

Not all reviews mentioning returns reflect actual return behaviour, and firms should avoid treating them uniformly. Some customers clearly articulate their returns, while others report issues but indicate they did/could not return the product. Even when return intentions are expressed (e.g. I’m considering), a well-documented gap often exists between intentions and actual behaviour, known as the intended-actual behaviour inconsistency (Arts et al., 2011; Sheeran, 2002). Building on Richins’ study (1983) on consistent interpersonal interaction styles, this gap can be explained by how assertive and non-assertive influence OPRB. As these interaction styles help explains different types of customer dissatisfaction and loyalty behaviour (e.g. Crutsinger et al., 2010), they may also illuminate the distinction in driving forces between eager and reluctant returners. Assertive OPRB associate with eager returners is characterised by customers’ ability to stand up for their rights, actively seeking remedies like product returns. In contrast, non-assertive OPRB associate with reluctant returners reflects hesitation, where customers rationalise keeping the product through upward counterfactuals and maintain a positive stance toward the sellers, signalling hope for resolution without initiating a return. These styles require different firm responses. For instance, customers struggling with usability may leave a review before returning, seeking support rather than product replacement. Addressing these concerns via clearer manuals or responsive helpdesks can be more cost-effective than redesigning interfaces. Despite its importance, we know little about how specific product attributes shape assertive vs non-assertive OPRB, leaving firms without clear operational guidance.

Prior research has emphasised the value of customer reviews in studying OPRB (Griffis et al., 2012; Minnema et al., 2016; Sahoo et al., 2018; Shang et al., 2017b). However, these studies have primarily relied on ratings, quantitative measures, or recommendation systems, overlooking the rich textual information in reviews that can reveal customers’ true motivations behind OPRB. Furthermore, these studies pay little focus on how customers perceive and react to product quality attributes through OPRB. Intrinsic attributes (inherent physical and functional properties) and extrinsic factors (reputation, packaging) may shape customer evaluations differently (Huang et al., 2009; Wells et al., 2011) and they are commonly discussed in customer reviews (Duong et al., 2025). However, current research on product returns often overlooks how both intrinsic, extrinsic attributes and individual customer characteristics influence post-purchase decisions. Analysing customer perceptions of these attributes during post-purchase evaluation could inform effective OPRB prevention strategies. To the best of our knowledge, Cheng et al. (2024), Duong et al. (2025), and Mor et al. (2024) have taken important steps in this direction, and our study builds upon and advances their contributions. A key distinction of our research is the introduction and examination of assertive versus hesitant OPRB providing deeper insight into how customers engage with firms, which has not been studied previously.

More specifically, unlike Mor et al. (2024) and Cheng et al. (2024), who identify product- and category-specific issues, we conceptualise return motivations through intrinsic and extrinsic attributes and test the robustness of our theoretical framework across multiple categories to offer a broader, more scalable understanding of OPRB. Additionally, our more comprehensive keyword approach ensures that no critical return-related factors are overlooked. We also examine the joint effects of these attributes on different types of OPRB using interaction strengths, revealing hidden patterns that impact product design, quality control, and supply chain optimisation – an area not previously explored by either Cheng et al. (2024), Duong et al. (2025), or Mor et al. (2024). Lastly, different with Cheng et al. (2024), who use black-box Natural Language Processing (NLP) models to extract sentiment-based return reasons from Amazon’s transactional data and reviews, we incorporate behavioural aspects (assertiveness vs non-assertiveness) to uncover deeper return patterns. While they refine Amazon’s return codes, they overlook hesitant customers, missing key behavioural drivers. In contrast, our human-machine collaboration leverages interpretable supervised and semi-supervised machine learning (ML), ensuring transparency and practical applicability, especially for SMEs that cannot rely on black-box models.

Taken together, this study aims to shed light on whether and, if so, how product and service attributes influence customer motivation to exhibit assertive and non-assertive OPRB. To achieve this aim, two research questions will be answered:

RQ1.

Which and how do intrinsic and extrinsic product attributes differently impact assertive versus non-assertive OPRB?

RQ2.

What actionable recommendations can retailers and manufacturers implement to enhance product return management?

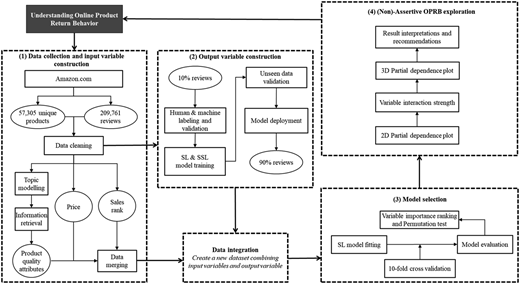
A comprehensive, interpretable, data-driven framework is proposed (as shown in Figure 2). We (1) extract extrinsic and intrinsic product attributes served as driving forces of the assertive and non-assertive OPRB by applying topic modelling into online reviews, (2) develop an interpretable ML-based model of each OPRB, and finally (3) analyse the non-linear impacts of key drivers on each return type for managerial insights. A large amount of textual review data collected from Amazon are used to validate our research.

Our results illustrate that various product attributes exhibit distinct magnitudes in influencing different interaction styles. Specifically, we found that online customers prominently value warranty, performance, reliability, high price and sales rank over the other attributes in switching from to assertive OPRB. Conversely, low price and information mismatch may emerge some intention, but customers are less motivated to take assertive action. Durability possesses a heterogeneous effect depending on when the issue happens around the return window or with secondary features issues. In addition, we discover that these factors not only and singularly influence assertiveness; rather, it is their combined interactions that collectively affect it.

This study makes several key theoretical contributions to the understanding of OPRB. First, it reframes OPRB as an active feedback loop in operational optimisation, illustrating how return behaviours can enhance reverse logistics and closed-loop supply chains. Second, by offering an individual-level analysis, it integrates intrinsic product attributes, extrinsic factors, and interpersonal characteristics to provide a more nuanced understanding of customer return motives. Lastly, the study extends three key behavioural theories – Attribution Theory (AT), Prospect Theory (PT), and the Theory of Planned Behaviour (TPB) – to explore the cognitive, emotional, and situational factors influencing assertive and non-assertive OPRB, thereby enriching the theoretical foundations of return behaviour research.

This study offers actionable insights for e-commerce managers, manufacturers, and operations professionals by highlighting the importance of differentiating between assertive and non-assertive OPRB. Our findings enable managers to tailor return mitigation strategies that reduce financial losses, improve customer retention, and optimise operational processes. The study also emphasises the often-overlooked non-assertive returners, recommending proactive, low-cost solutions to address dissatisfaction. Additionally, by leveraging online review data, managers can detect emerging product issues and dissatisfaction, allowing for early intervention and minimising return-related costs across diverse retail contexts.

The paper is organised as follows. We first discuss the theoretical background and conceptual framework. Then, we propose the methodology framework including the data preparation. We next discuss the results and provide actionable recommendations of the findings. Finally, we highlight the implications and conclude with the discussions of contributions.

OPRB is the process of customers making decisions on whether to keep or return a purchase. According to expectation confirmation theory (ECT) (Anderson, 1973), this behaviour can be unravelled as customers usually form their initial expectation through given information from sellers (e.g. quality cues). A discrepancy between expected and perceived product quality leads to disconfirmation, causing cognitive dissonance and dissatisfaction, which may result in returns (Hong and Pavlou, 2014; Powers and Jack, 2013). The Cognitive Dissonance Theory (CDT) postulates that customers employ various viable dissonance-reduced strategies to alleviate psychology tensions, and product returns is only one of them (Walsh et al., 2016). In fact, not all dissatisfied customers will choose to initiate a return, but opting for alternative strategies, such as seeking positive information to justify for their purchase decision and supress the feeling of regret, or quietly switching to other businesses (Lee, 2015). Hence, customers may display different interaction styles through online reviews.

Customer interaction styles refer to the consistent behaviour patterns individuals exhibit during marketplace transactions (Crutsinger et al., 2010). Understanding different customer interaction styles at the post-purchase stage, particularly when dissatisfaction arises, is essential for businesses aiming to enhance customer satisfaction and loyalty. Richins (1983) was the first studied two opposing interaction styles – assertiveness and non-assertiveness. Assertive OPRB refers to the ability to stand up for one’s rights, including insisting upon a remedy for defective products such as product returns. On the other hand, non-assertive OPRB is referred to the hesitation to fight for one’s rights, including generating upward counterfactual thoughts to justify for the product return procrastination or cancelation. In this case, customers maintain a positive attitude towards sellers, making returns less likely.

In this context, prior research suggests that the ECT and CDT do not fully capture the cognitive and emotional motives behind different types of OPRB’s customer interaction styles, particularly when customers decide to return products irrespective to their performance (e.g. planned returns) (Das and Kunja, 2024). Therefore, recent studies have increasingly developed integrated approaches combing multiple behavioural theories to elucidate OPRB from diverse perspectives (Abdulla et al., 2025; Martínez-López et al., 2022b; Zhang et al., 2022).

Likewise, our study also establishes theoretical foundation and develops the conceptual framework by integrating three behavioural models – AT, TPB and PT – to attain the comprehensive analysis of the driving motives behind assertive and non-assertive returners.

The AT fits well in our research context, as it has been widely used to analyse the voice of customers when they deliberately make complaints of product/service failures through negative reviews (e.g. Chang et al., 2015; Weitzl et al., 2018). The theory posits that customers often allocate responsibilities for their dissatisfaction across three dimensions: attribution of locus, controllability and stability), which ultimately influence their actions (Weiner, 2000). Locus attribution refers to the origin of the dissatisfaction, which can stem either from the customers themselves (low locus) or from the company (high locus). Customers are more inclined to engage in assertive OPRB when they attribute the issues to external factors (e.g. poor product quality, misleading advertisement), as compared to when the dissatisfaction is linked to internal factors (e.g. not reading product specifications carefully) (Chang et al., 2015). Controllability pertains to customer belief whether the problem could have been controlled and prevented by the involved company. If customers perceive the problem as unavoidable (e.g. delayed shipping due to a snowstorm), they are less likely to assign the blame. However, if they believe the company has controllability and the problem could have been avoided (e.g. delayed shipping due to low stock level), they will become angry and feel more inclined to penalise the company for their negligence (Hess et al., 2007). Finally, stability attribution considers the extent to which the customer perceives the cause of the dissatisfaction as a temporary, one-time error (e.g. a defective item) or relatively a stable, permanent problem (e.g. a common issue among consumers or constant failure). Browning et al. (2013) stated that a stable cause, such as chronic product failure, heighten customer dissatisfaction, compelling them to seek redress from the company.

Nevertheless, while AT primarily address the cognitive aspect of return decision making, it neglects emotional responses and situational contexts as important factors driving OPRB. To address these emotional dimensions, we thus incorporate PT which focuses on the value function (i.e. loss aversion) to investigate how individuals perceive losses more intensely than gains (Kahneman and Tversky, 2013). This tendency could help better explain why some consumers might be more inclined to engage in assertive OPRB when they perceive significant loss, rather than merely attributing their dissatisfaction to responsibility.

To build the theoretical grounding of non-assertive OPRB, the TPB offers critical insight. In contexts where the behaviour/intention of returning a product is associated with stress, feeling of guilt, customer beliefs and social pressures, prior research has used TPB to evaluate the self-efficacy that indicates the consumer’s self-confidence in his/her ability to exhibit behavioural intention (Ertekin, 2018; Kianpour et al., 2017; Panda et al., 2024). TPB posits that behavioural intention is a key proxy of actual behaviour; however, existing research frequently highlights an intention-behaviour gap, where stated intentions do not consistently translate into actions (Arts et al., 2011; Sheeran, 2002). This gap is especially salient in non-assertive OPRB, where consumers may express dissatisfaction or even an intention to return, yet ultimately refrain from following through with the action.

Drawing on the typology developed by Orbell and Sheeran (1998) and Sheeran (2002), non-assertive returners can be categorised as inclined abstainers, those who express a positive return intention (e.g. “will/would return”) but ultimately do not follow through, and disinclined abstainers, who express a negative return intention (e.g. “might/would not return”) and later act consistently with that intention. Empirical evidence from both studies suggests that these non-assertive profiles occur frequently. Hence, there might be cognitive and psychological barriers that often prevent dissatisfied customers to return purchased products. The prevalence of these patterns contributes to a widening the product return intention-behaviour gap.

The Temporal Construal Theory (Trope and Liberman, 2003) may help explain this hesitation. Customers may form abstract, future-oriented return intentions when emotional arousal is high, but as time passes and the return window narrows, these intentions become less urgent or actionable. Thus, many non-assertive returners such as inclined abstainers may genuinely intend to act yet delay or abandon the behaviour. Additionally, the Cognitive Miser Theory (Fiske and Taylor, 1991) posits that consumers generally prefer low-effort decisions. In cases of disinclined abstainers, this implies that unless the dissatisfaction reaches a threshold that justifies the effort of returning, customers are likely to defer or avoid the behaviour altogether. This insight is expected to add depth to our understanding of why some dissatisfied customers, despite experiencing a significant loss or blame the company for product/service failures, still yet to return the product (i.e. non-assertive, reluctant returners).

By integrating these three behavioural theories, our multifaceted approach seeks to gain deeper insights into the cognitive, emotional and social motives behind assertive and non-assertive OPRB, ultimately enabling the development of more tailored, consumer-centric return mitigation strategies.

In this section, a literature review is conducted to mapped out what drives product returns as the potential drivers for (non)-assertive OPRB. Das and Kunja (2024) have classified reasons of product returns into two distinct groups: company-centric reasons and customer-centric reasons. Lately, Duong et al. (2025) further categorise company-centric OPRB drivers into intrinsic and extrinsic product attributes. Intrinsic attributes refer to product-related factors that cannot be altered without changing the product’s physical properties (e.g. shape, size, colour, materials and engine power) (Richardson et al., 1994). Conversely, extrinsic attributes, while also perceived as product-related factors, only form the product environment rather than its physical properties (e.g. seller reputation, return policies, packaging, country of origin) (Richardson et al., 1994). Table 1 presents key studies of OPRB drivers, categorised by both product intrinsic and extrinsic attributes and customers’ individual characteristics.

Our literature review shows that extrinsic attributes have garnered the most research focus, probably because they offer the most cost-effective, flexible and accessible way for the sellers to exert influence and control over OPRB mitigation. Indeed, while scholars continue to refine the return policy leniency to effectively reduce product returns without hurting sales or encouraging abusive behaviour (Abdulla et al., 2025; Dong et al., 2025), an increasing number of studies aim to explore new extrinsic drivers. For instance, various promotional tactics have been examined for their impact on OPRB, including promotion framing approach (Lee and Yi, 2019), keep reward strategy (Gelbrich et al., 2017), purchase-risk notices (Martínez-López et al., 2022b), instant refund offer (Martínez-López et al., 2022a), physical distribution services (Rao et al., 2014), pricing and refund (Shang et al., 2017a), and packaging design (Wallenburg et al., 2021). Additionally, the OPRB impact of different persuasive technologies have also gained traction, for example, digital product fitting technology (Gustafsson et al., 2021), web technologies (De et al., 2013), mobile channels (Zhang et al., 2022), and gamification (Panda et al., 2024). Seller reputation, payment types and order fulfilment processes are also amongst active OPRB drivers (Mishra and Dutta, 2024; Sahoo et al., 2018; Walsh et al., 2016). Despite being a stronger determinant of product quality uncertainty (Szybillo and Jacoby, 1974), the influence of intrinsic product attributes on OPRB has been studied less compared to extrinsic product attributes. Cheng et al. (2024), Duong et al. (2025), and Mor et al. (2024) are among pioneering studies that apply ML models into online customer reviews to capture product attributes. However, they treated both eager (i.e. assertive) and reluctant (i.e. non-assertive) returners in aggregate, potentially overlooking the heterogeneity of OPRB. Therefore, our study aims to fill the gaps by grouping return-related issues into intrinsic and extrinsic attributes and examining the impacts of both attributes on (non)-assertive OPRB.

In the signalling theory, products are perceived as a collection of cues (or attributes) that customers actively seek out and rely on to form a composite judgement of product quality before making a purchase decision (Van Nguyen et al., 2020; Wells et al., 2011). Any shortcomings in those product attributes could trigger OPRB during the post-purchasing stage. Previous studies have identified a number of product attributes influencing decision making. From a customer perspective, Garvin (1987) defines 8 key attributes that make a qualified product, including performance, features, durability, reliability, aesthetic, conformance, perceived quality, and serviceability. Later, Brucks et al. (2000) studied the impact of 6 dimensions on price and brand of durable goods which are ease of use, versatility, durability, serviceability, performance, and prestige.

Taken together, our conceptual framework will examine 13 key product attributes, which base on intrinsic and extrinsic attribute classification, to adequately capture the driving forces behind the assertive and non-assertive OPRB, as outlined in Figure 1 below. Their description can be found in Online Appendix A.

2.3.1 Intrinsic attributes

We examine seven intrinsic attributes essential to a product: primary features, secondary features, performance, durability, reliability, physical appearance, and ease of use. Since literature has found these attributes as key determinants of customer satisfaction (e.g. Wen et al., 2014), they are also expected to play key roles in OPRB according to ECT and CDT.

According to Nelson (1970), we can further classify intrinsic product attributes into search and experience attributes. Search attributes refer to product features that consumers can directly assess based on sensorial observations (e.g. auditory, gustative, tactile, visual or olfactory sense), whereas in contrast, experience attributes pertain to those only discoverable after using the product. In this regard, physical appearance, primary features and secondary features are more closely aligned with search attributes, while product performance, reliability, durability, and ease of use are associated with experience attributes.

Customers form return intentions based not only on dissatisfaction but also on how they cognitively process the cause of that dissatisfaction. Search attributes generally demand less cognitive effort and are easier to ascertain before making the purchase. Furthermore, the widespread adoption of online technologies (e.g. product pictures, virtual try-ons, or detailed product descriptions) has been found to aid customer evaluation of search attributes, leading to lower product returns (De et al., 2013; Hong and Pavlou, 2014). Drawing on AT, when dissatisfaction arises from search intrinsic attributes such as appearance, primary, or secondary features, customers may attribute the cause to themselves rather than the seller. For example, failing to notice a product dimension or misunderstanding a feature may elicit internal attributions and even self-regret for not scrutinising the product description more carefully. From the perspective of TPB, such internal attribution lowers the perceived severity of the issue and reduces perceived behavioural control, making customers less likely to act on their dissatisfaction. Instead, they may form ambivalent or weak intentions to return the product (e.g. “maybe I should” or “probably won’t”), which may not translate into assertive OPRB. These consumers are more likely to fall into the categories of inclined abstainers or disinclined abstainers, both characteristic of non-assertive OPRB. Thus, we anticipate that such customers, with dissatisfaction stemming from search intrinsic attributes, are more likely to exhibit non-assertive behaviour and reluctant to initiate the return. We aim to test the following hypothesis:

H1.

Customers dissatisfied with search intrinsic attributes, including physical appearance (a), primary features (b) and secondary features (c), tend to engage in non-assertive OPRB.

On the other hand, customers often relate experience attributes to product fit uncertainty (e.g. expected performance) which has been identified as the stronger drivers of OPRB (Hong and Pavlou, 2014). Unlike search attributes, experience attributes can only be fully evaluated after usage in which customers are usually aware of during the pre-purchase stage. As a result, they often invest more personal effort, time, and trust in checking these attributes beforehand, such as reading reviews or scrutinising specifications. This process often leads to greater product attachment (Cheng et al., 2012; Cho et al., 2022; Wei et al., 2023). When the product fails to meet expectations after purchase, customers perceive a violation of expectations. PT posits that customers tend to frame these kinds of unmet expectations as losses, which bring a disproportionately stronger psychological impact compared to equivalent gains (e.g. ownership of the products). The perceived losses are not limited to financial value but also include cognitive and emotional costs, as customers’ pre-purchase investment has been both rationally and affectively wasted.

Moreover, because these product issues only become apparent after use, customers are less likely to blame themselves or see the failure as a result of their own oversight during the pre-purchase stage. According to AT, such failures are typically seen as external, stable, and uncontrollable. In other words, flaws that stem from the product or the seller, not the buyer. This external attribution makes the failure feel more serious and unfair, which in turn strengthens the customer’s sense of justification and entitlement to take action. In this light, returning the product is not only a practical way to resolve the issue, but also a justified and reasonable response to disappointment.

Therefore, the combination of heightened loss aversion (PT) and external blame assignment (AT) increases the likelihood of assertive OPRB. Accordingly, we propose the following hypothesis:

H2.

Customers dissatisfied with experience intrinsic attributes, including product performance (a), durability (b), reliability (c), and ease of use (d) are more likely to exhibit assertive OPRB.

2.3.2 Extrinsic attributes

Extrinsic product attributes considered in this study are product information mismatch, logistics services, after-sales services, and warranty. In online marketplaces, these factors primarily serve as the signal of sellers’ services and indirectly indicate product quality. Prior studies on consumer purchase behaviours have contradict findings on the impact of extrinsic attributes on quality perception compared to intrinsic attributes (Espejel et al., 2007; Lee and Lou, 2011; Szybillo and Jacoby, 1974). Consequently, this study conceptualises the influence of extrinsic attributes on (non)-assertive OPRB distinctly.

Product information mismatch refers to the discrepancy of information perceived by customers between the pre-purchase stage (i.e. provided by sellers) and post-purchase stage (i.e. perceived through actual product experience) (Martínez-López et al., 2022b). Among extrinsic cues, firm-initiated marketing instruments (e.g. textual descriptions, photos, video, paid search, affiliate advertisings, newsletters, catalogues) are the most relevant and widely used to convey product information to consumers. From the perspective of AT, since the company (i.e. the external toward customers) is responsible for choosing and controlling its marketing instruments, any misleading or unclear information that leads customers to buy problematic products can trigger strong dissatisfaction and distrust. This is because customers expect sellers to provide honest and reliable information, at the very least through clear disclaimers. Shulman et al. (2015) found that these instruments affect product returns through dual contradicting mechanisms. They can serve as informational cues leading to a better-informed purchase decision and lower returns; whereas it can also play as advertising cues that increase expected values. According to PT, when the actual gains (i.e. actual value) are outweighed by heightened aversion loss effect, it ultimately leads to higher returns. Which of these two mechanisms will dominate depends on the context (i.e. product types and communication types), as Schulz et al. (2019) stated. El Kihal and Shehu (2022) and Martínez-López et al. (2022a) recently studied the impact of various marketing instruments such as paid advertisement, free shipping campaigns, catalogues, newsletter and visual ecommerce (e.g. manipulated product pictures) increase return rates. Therefore, we posit that the customers will blame the company for the product information mismatch and be inclined to seek redress through assertive OPRB.

After-sales services refer to customer experience on the seller’s supports during post-sales (e.g. helpdesk, instruction and communication). Customer perception on after-sales service quality can be studied through the SERVQUAL model (Parasuraman et al., 1988). The model highlights five key customer expectations – tangibles (i.e. capacity), reliability, responsiveness, assurance, and empathy (i.e. caring). Failing these will result in a significant degradation in satisfaction, loyalty, and retention (Sousa and Voss, 2009). Similarly, warranty refers to the guaranteed services offering that the defective product can be troubleshot by manufacturers or a warranty company (Brucks et al., 2000; Garvin, 1987). Customers typically turn to warranty services when they encounter product issues that they are unable to resolve, considering warranty as their last resort before returning. According to AT, when customers experience substandard support, they begin to assign stable, external, and uncontrollable causes to the product failure. For instance, if a support agent is unhelpful or the product still malfunctions even after being repaired under warranty, customers are more likely to see the problem not as a temporary glitch but as a persistent flaw embedded in the product brand. The stability dimension in AT plays a central role here: the perception that the issue cannot or will not be resolved intensifies dissatisfaction and strengthens their decision to take corrective action. Moreover, because both after-sales and warranty services are considered final attempts at resolution, failures in these channels signal that all other avenues have been exhausted. This enhances the customer’s sense of entitlement and justification to act assertively (e.g. by writing a negative review and/or initiating a return). Thus, these post-purchase support failures do not just reflect poor service; they reshape how customers cognitively and emotionally frame the problem, turning frustration into assertive OPRB.

Taken together, we examine the following hypothesis:

H3.

Customers with dissatisfaction caused by product information mismatch (a), after-sales services (b) and warranty (c) are more inclined to exhibit assertive OPRB.

Logistics service quality attribute refers to the fulfilment stage of the product, of which packaging and delivery performance are key factors influencing customer satisfaction (Rao et al., 2011, 2014; Wallenburg et al., 2021). Modern online marketplaces are unique in the way that online retailers are not autonomously in charge of the order fulfilment process, but it often outsources to third-party logistics providers operating through inter- or multi-modal networks, limiting the retailer’s direct control. Therefore, the ambiguity around who is at fault (retailer vs logistics/platform provider) may reduce customers’ willingness to assign blame. According to TPB, this ambiguity may lower customers’ perceived behavioural control and self-efficacy, as they may feel uncertain about whom to contact or how to initiate a return. Additionally, the involvement of multiple actors may increase social hesitation, particularly if customers fear being perceived as unfairly blaming the wrong party. Temporal Construal Theory suggests that when a solution feels vague or difficult to picture, this phenomenon can be seen as distant making the solution less urgent or actionable. In this context, customers may delay or abandon their intention to return altogether, even if they are dissatisfied. Therefore, we expect that dissatisfaction with logistics-related attributes in online marketplace will widen the intention-behaviour gap, increasing the likelihood of non-assertive OPRB. Thus, we examine the following hypothesis:

H4.

Customers dissatisfied with logistics services tend to engage with non-assertive OPRB.

2.3.3 Selling price

Selling price refers to the numerical price of the product that customers review. It is common sense that higher price products usually associate with higher customer expectations for quality, reliability, and service. Research shows that customers are more likely to return high-priced products than low-price products to reimburse their expenses (Rao et al., 2014). According to PT, customers evaluate product performance relative to a reference point. Typically, their expectations are tied to amount spent and they tend to weigh losses more heavily than equivalent gains. As such, when a high-priced product fails to meet expectations, the deviation from this reference point is perceived as a substantial loss, triggering a stronger psychological response than it would for a lower-priced item. Additionally, when assessing the product price, customers often perceive financial risk if the product does not meet their expectations (Anderson et al., 2009). Minimising it can enhance the product utility attributed to customers, thereby increasing their willingness to make a purchase. Finch (2007) examined product ambiguity as a dimension of perceived financial risk, in addition to numerical prices. High product ambiguity implies the high likelihood of unforeseen product failure perceived by customers and higher potential loss. Customers are more loss-averse in the face of ambiguity and are thus more likely to engage in defensive behaviours, such as assertive OPRB in the context of high-priced and ambiguous products. Hence, we test the following hypothesis:

H5.

Customers dissatisfied with higher-priced products are more likely to exhibit assertive OPRB.

2.3.4 Sales rank

Sales rank indicates the popularity of a product in a marketplace. Customers may utilise sales rank to ensure the credibility of the claimed product quality (Erdem and Swait, 1998). Previous studies have found that sales rank is a key quantitative indicator of product quality that helps customers reduce their product search cost and increase their welfare (Jin et al., 2023; Ursu, 2018). However, customers may over-rely on that signal, which can be unreliable, neglecting the comprehensive research on product specification. One such manipulation is the “brushing” effect, where sellers artificially inflate their sales rank by placing fake orders to simulate popularity and perceived credibility (Jin et al., 2023). From the lens of AT (Weiner, 2000), when customers later discover that a highly ranked product fails to meet expectations, they are likely to attribute the failure to external and controllable causes such as seller deception or platform negligence. Because sales rank is platform-generated and prominently displayed, customers often assume it is credible. Therefore, when their trust in such signals is betrayed, they may not only feel misled by the sellers but also question the fairness and integrity of the marketplace. The perceived controllability and high locus of causality increase the level of dissatisfaction and heighten the sense of injustice. This drives the corrective actions (e.g. returns, complaints, or negative reviews that characterise assertive OPRB) to address their cognitive dissonance. Accordingly, we propose the following hypothesis:

H6.

Customers dissatisfied with higher-ranked products are more likely to exhibit assertive OPRB.

Figure 2 illustrates the overview of the proposed methodology. It consists of four main steps: (1) Data collection and input variable construction in Section 3.2 and 3.3; (2) Output variable labelling and validation in Section 3.4; (3) Model selection in Section 3.5; (4) Customer return behaviour exploration, see Section 3.6.

We collect two large datasets of product and review, sponsored by Amazon for a period of 22 months (Ni et al., 2019). We focus on electronics and electronics accessories as they account for the largest sales across Amazon categories (Carroll, 2021). As we only use reviews with return-related keywords, a list of return-related keywords based on Amazon return policy and research expertise is compiled. Asterisks (*) are used alongside each term to expand the search scope. For instance, “ship*” would locate reviews featuring words like “shipping”, “shipped”. Reviews that contain any of these keywords are identified as OPRB.

  1. Return*

  2. RMA” (Return Merchandise Authorisation), “RA” (Return Authorisation), “RGA” (Return Good Authorisation).

  3. Send*/sent back”, “ship* back”, “post* back”, “bring*/brought back”, “reship*”

  4. Refund”, “restock*”, “exchang*”, “product recall”, “reimburs*”, repay*”, “warranty”, “repair”, “replac*”, “guarantee”, “money* back”.

We retain only negative (1–3 stars) reviews. Furthermore, to ensure the authenticity of a review, we only select reviews in which Amazon verified their purchase. As a result, 209,761 reviews with 57,305 unique products are used for analysis. As both datasets contain unstructured textual and noisy data, pre-processing techniques are performed in Online Appendix B1.

3.3.1 Product quality attributes

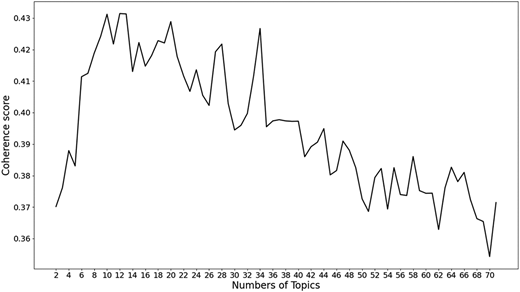
To explore and measure product quality attributes mentioned in reviews, we first apply Latent Dirichlet Allocation (LDA)-based topic modelling. LDA, a widely recognised unsupervised ML method, is utilised to statistically reveal the latent semantic topics within a set of textual documents (Blei et al., 2003). Since LDA requires the number of topics in advance, we adopt the common Cv coherence score to evaluate due to its high human interpretability (Röder et al., 2015). The higher the Cv coherence score is, the better the LDA model fits with data. To find the optimal number of topics, we tune 70 topics ranging from 2 to 71 and calculate Cv accordingly. As a result, in Figure 3, we optimise 12 topics with the highest Cv = 0.4314.

Next, we need to examine whether these 12 topics reflect the product attributes in our conceptual framework. This task consists of 2 steps:

  1. Providing the context for LDA topics labelling

We utilise both representative keywords extracted by LDA, and grammatical phrases extracted by information retrieval (IR) techniques to provide a holistic view on how a product attribute is mentioned in each topic.

The IR technique uses the Part-of-Speech tags (e.g. noun, verb and adjective) and their dependencies to extract phrases, complying with three common grammatical rules of Noun-Verb-Noun, Adjective-Noun, and Noun-Adposition-Noun. For example, such phrases – “product is defective” (Noun-Verb-Noun) and “poor handling” (Adjective-Noun) can be extracted from this review: “the product is defective, possible due to the poor handling”. These phrases can help the labelling more accurately and effectively.

  1. Human validation: Allocating product quality attributes to LDA topics

To validate the meaningfulness of the 12 extracted topics, as annotators, we label LDA topics using the context of LDA topics through extracted keywords and phrases in the step (a). Cohen’s kappa score, measured the interrater reliability, is 0.712 indicating a substantial agreement. After that, we cross-check the results to decide the final label for each topic.

We found that topic 1, 3 and 6 shared the same performance attribute while topic 5 and 7 shared the same secondary features attribute. Therefore, we merge them together. The examples of IR-based phrases extracted for each LDA topic, and the assigned label can be found in Table B2.1, Online Appendix B2.

We extracted five intrinsic attributes which are durability, performance, primary features, secondary features, reliability, and four extrinsic attributes which are product information mismatch, warranty, logistics service quality, and after-sales services. Since physical appearance and ease of use are not found, we believe these two attributes are not important. The representative keywords and phrases for each attribute are presented in Table 2. The examples of representative reviews for each LDA topic can be found in Online Appendix B2.

3.3.2 Selling price and sales rank

Selling price and sales rank are measured by extracting the product numeric price and sales rank attached to that review through their product ID defined by Amazon. We further normalise the sales rank by taking its natural logarithm since its distribution is skewed as proposed by Chevalier and Mayzlin (2006). In this study, the sales rank attribute is reverse-coded, meaning that a higher sales rank value indicates lower product popularity.

In this section, we present the process of labelling and validating a review. Customers can confirm their past OPRB through some expressions (e.g. “I have returned”, “I sent it back” or “I did return”) which is denoted as assertive OPRB (class 1). Since we only retain certified reviews by Amazon, this ensures the authenticity in truly capturing actual OPRB (Mardumyan and Siret, 2023).

The remaining reviews are denoted as non-assertive OPRB (class 0). Through inspection, there are two main groups that aligns with the definition of non-assertiveness from Richins (1983). First group is negated expressions, indicated by such expressions like “can/do/did NOT return” and the second group is positive expressions, such as saying “would/will/going to return”. As these reviews describe a future event which are associated with hesitated behaviours, they carry the risk of intended actual behaviour inconsistency (Sheeran, 2002).

3.4.1 Labelling and validating labels by human and machine annotators

Detecting the assertive OPRB in reviews is a challenging task because the diversity of natural language requires a heavily manual human effort which becomes infeasible for a large dataset. However, human labelling can establish a ground truth for ML models, especially semi-supervised ones, to proliferate accurately the label for the whole datasets. The process of labelling class 0 and 1 for the training sample is presented as below:

  1. To balance between the human fatigue and sufficient labels for model training, we randomly select 20,976 (10%) reviews for labelling (Ligthart et al., 2021).

  2. We first created ground truths with human annotator. As annotators, we label a 10% sample with class 0 and class 1. As a result, the inter-annotator agreement using Cohen’s kappa score is 0.9145 indicating a perfect agreement.

  3. We cross-check human labels with automated machine labels. This is because the labelling principle can be automatically applied using NLP models – certainty detection, past event detection and negation detection (see Online Appendix B3 for the detailed process). We use Fleiss’s kappa coefficient to measure the inter-annotator agreement among human and the machine. The score is 0.6563 indicating a substantial agreement among annotators.

Although there are substantial-to-perfect agreements, it is necessitated to address the discrepancies among machine and human labels. Therefore, we assign a final label to each review through discussing and mutual consent among annotators.

3.4.2 Training and validating using (semi-)supervised machine learning

In this section, we aim to discover the optimal ML model in classifying assertiveness and non-assertiveness from the 20,976 labelled samples in Section 3.4.1.

Set of predictors: The training stage requires a set of predictors that can accurately classify the labelled sample. We extract the set of predictors from our collected dataset. The description and measurement of these predictors are presented in Table B3.1, Online Appendix B3.

ML models: Supervised learning (SL) model can be used to train on the labelled dataset and classify the remaining unlabelled dataset. However, it commonly requires a large amount of training set to achieve a good performance. To overcome that shortcoming, semi-supervised learning (SSL) can handle a small set of labelled data in conjunction with a larger set of unlabelled data. This approach is appropriate for determining assertive OPRB where real labels are limited. Without loss of generality, we compare all 8 models: 5 SL models including logistics regression (LR), decision tree (DT), random forest (RF), gradient boosting (GB), support vector machine (SVM), and 3 SSL models including self-training (ST), co-training (CT) with two same subsets of predictors (one view) and CT with two different subsets of predictors (two views). The detail description of the training process can be found in Online Appendix B3.

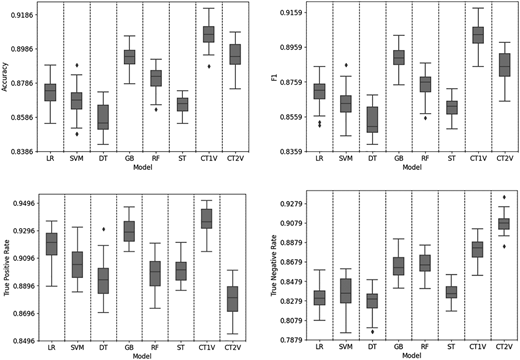
We adopt four common metrics – Accuracy (Acc), F1, True Positive Rate (TPR) and True Negative Rate (TNR) to evaluate the classification performance of the selected predictors on the testing sets. We ensure all ML models are optimised with the most appropriate parameters by using hyperparameter tuning while 10-fold cross validation are used to detect the potential of overfitting issue (Table B3.2, Online Appendix B3).

Results: In Figure 4, CT1V outperforms the other models in terms of accuracy (0.89–0.92) and F1 scores (0.88–0.91). We further calculate p-values and mean differences using the t-test analysis to check the significance of the performance between CT1V and the other models. If p-value of a pair ≤0.01, the difference between the two members in the pair is considered as significant. As shown in Table B3.2 in Online Appendix B3, the p-values between CT1V and other models on accuracy and F1 scores are lower than 0.01, which reaffirms the significant improvement of CT1V in detecting assertive vs non-assertive OPRB.

We also examine the performance of Class 1 and Class 0 individually in Figure 4 and Table B3.2 in Online Appendix B3. Regarding Class 1, CT1V has overly high TPR scores (0.91–0.95) and is superior compared with the others by looking at its mean difference. In terms of class 0, CT1V has good TNR scores (0.85–0.90) and is still superior in compared with the others by looking at its mean difference except CT2V. However, CT2V has a lower ability to classify the positive class which is important to identify the customers’ reason for assertive and non-assertive OPRB. Therefore, we select CT1V to classify the remaining unlabelled dataset.

3.4.3 Unseen data validation

To further validate the robustness of the optimal CT1V model on the unseen dataset, we test its labelling performance on another random 10% reviews from the unlabelled dataset (20,976 reviews). We apply the trained model to predict the labels for the samples and validate through their human-generated labels obtained by the research team. The classification results are presented in Table 3. The model performance stays consistent with the results in Section 3.4.2.

3.4.4 Model deployment for the full dataset

Since, CT1V has proven its ability in classifying non-assertive and assertive OPRB by learning from a small sample of labelled data (10%), we train the model with the whole labelled dataset (20,976 reviews) and classify the remaining unlabelled dataset (188,785 reviews). The final dataset contains 106,110 reviews with class 1 and 103,651 reviews with class 0.

The nature of the output variable is a binary ML classification task with the general formula in Eq. (1):

(1)

where xi refers to the set of input variables, ym is the actual binary value of target variable and ŷm is the estimated output of mth review resulted from ML algorithms, either class 0 or class 1. We compare 5 discussed models including LR, SVM, DT, GB, and RF. To evaluate the goodness of fit among different models, we adopt the Area Under the Curve (AUC) and F1 scores. To determine the determinant variables, we apply two variable importance ranking (VIR) techniques – SHapley Additive exPlanations (SHAP) and permutation which are flexible to any ML models (Breiman, 2001; Lundberg and Lee, 2017). Their statistical significance can be confirmed by using permutation test for ML classification problem (Chou et al., 2023; Ojala and Garriga, 2010) (see Online Appendix B4 for the detailed rationale and procedure).

In this section, we explore OPRB through interpretable ML models. The goodness of fit of all selected models is attached with the performance of ML models as discussed in Section 3.5. We apply Partial Dependence Plot (PDP) which is a graphical visualisation to illustrate the marginal effect of a variable (2D) or the joint effect of two variables (3D) on the output variable. PDP serves as an effective interpretation tool to peek inside the black-box ML models for the nature of input-output relationships and actionable insights. However, as PDP cannot fully represent the details of individual effects, centred Individual Conditional Expectation (ICE) plots – a PDP extension – is applied to depict how instances of an input variable behave and expose the hidden heterogeneous pattern (Goldstein et al., 2015). Finally, to determine strongly interacted variables for 3D PDP, we follow the Friedman H-statistic application from Chou et al. (2023) to test the interactions strength among multiple variables. Since we aim to identify the highly interactive pairs and H-statistic is computational expensive, we only measure the interaction strength of a selected variable and the other variables individually.

We examine F1 and AUC scores of the five SL models in Section 3.5 to evaluate the goodness of fit. We first find the optimal split for training and testing data (60:40, 70:30, 80:20 and 90:10) and apply 10-fold stratified, repeated-3-time cross validation to check the overfitting. As a result, GB with 90:10 is selected since they have the best performance among five SL models and the lowest overfitting level (see Online Appendix C1). The descriptive statistics for the 90% training and 10% testing data are reported in Table 4. As all Variance Inflation Factor (VIF) scores of both training and testing sets are lower than the common threshold value of 10, this indicates no multicollinearity issue.

The fitness of the input variables in explaining the output variable using GB model are acceptable average scores (Table 5). This indicates that overall product attributes have significant and generalised impacts on output variable (Abrahams et al., 2015).

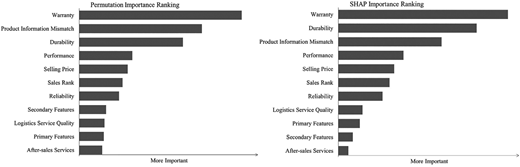
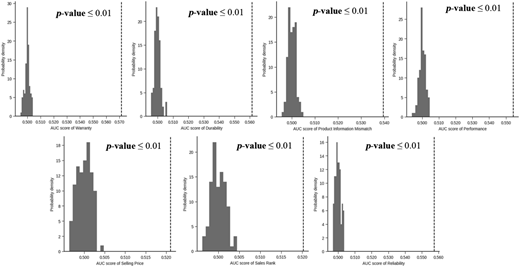
Figure 5 shows the consistency in the ranking of both techniques – SHAP and permutation VIR – in strong (warranty, durability and product information mismatch), moderate (performance, reliability, selling price and sales rank), and weak groups (primary features, secondary features, logistics service quality and after-sales services). Furthermore, Figure 6 indicates that all seven strong or moderate variables are significantly associated with the output variable (p-value ≤0.01), which guides the focus of the following sections.

We shall now delve into comprehending how each of the foremost 7 variables influencing assertive and non-assertive OPRB (RQ1), thereby facilitating actionable recommendations for retailers and manufacturers (RQ2).

4.2.1 Search intrinsic attributes

Physical appearance is not detected, while both primary and secondary features show weak effects on (non)-assertive OPRB (see Online Appendix C2), hence H1 is not supported. A possible explanation is that customers may not perceive these issues as serious or blameworthy enough to express (non)-assertive OPRB. Specifically, appearance tends to be aesthetic rather than functional, while minor product features issues may be internally attributed or tolerated by customers.

4.2.2 Experience intrinsic attributes

  • Performance

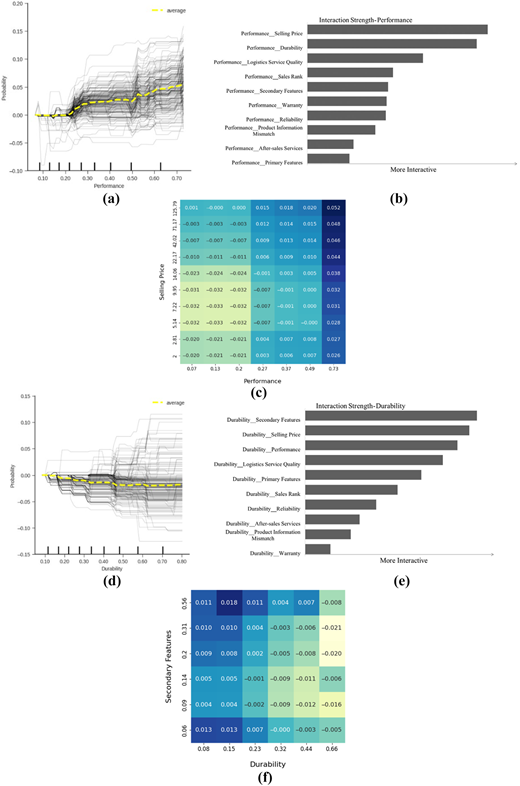
In Figure 7(a), performance has a positive impact to assertive OPRB, thus supporting H2a. When they become main topics, they have average upward trends (≥0.2 for performance). For example, one customer notes: “The picture was not any better than if I used coax cable. I returned …”, illustrating how unmet expectations around product performance led to clear assertive OPRB. This reflects an upward counterfactual mindset, where customers compare their actual experience against a more favourable hypothetical outcome. From the perspective of PT, this contrast evokes a heightened sense of loss due to the gap between expected and perceived utility, prompting assertive action to recoup that loss. This reaction also aligns with the contrast zone of the assimilation-contrast theory (Anderson, 1973; Wang et al., 2011), where perceived discrepancies intensify dissatisfaction rather than being rationalised.

Performance also strongly interacts with selling price (Figure 7(b)). Figure 7(c) illustrates an unexpected phenomenon which demonstrates the heterogeneous effect of low-price product in Figure 10(a). When low-priced products (≤$20) exhibit performance issues, customers are decisive to return them. Through inspecting reviews, we found that customers wish they had purchased higher quality products with higher price (upward counterfactual thought). This makes them feel remorseful and assertively return products.

  • Durability

The phenomenon of durability effect observed in Figure 7(d) is intriguing. Although the average PDP of durability shows a mild downward trend (i.e. non-assertiveness), there is a divergence of individual data points when durability starts becoming the main topic in a review (≥0.3). This shows a strong and heterogenous interaction of the variable in which customers vary their OPRB when discussing durability. Therefore, this finding partially supports H2b. For the individual upward trends, this can be explained by the literature that emerging durability issues abruptly end customers’ positive emotion forecast and drive customers assertive OPRB (Wood and Bettman, 2007). From the lens of PT, this behaviour can be attributed to heightened perceived losses as customers invest time and cognitive effort evaluating the long-term use of a product and often form attachments to items expected to last. When those expectations are violated, the psychological loss is amplified, motivating customers to act assertively to recover value. In terms of the individual downward trends of durability, upon further examination of some reviews, we found that when customers refer to durability, their concern is also closely associated with other factors such as the return window, lowering their control over the return behaviour as per TPB. For example, a customer states that “Product worked great for exactly 50 days and now it is dead. Of course, it is outside the return window”. Therefore, durability is still a hidden factor driving dissatisfaction.

Durability strongly interacts with secondary features (Figure 7(e)). When secondary features and the durability are shared in a review, the probability decrease ∼3% (Figure 7(f)), marking the individual downward trends in Figure 7(d). Reviews typically show that customers express concerns about the durability of secondary features or how these features impact overall product durability. As a result, secondary features are generally perceived as adding value rather than complicating the product, which is different with the product commitment literature (Harding et al., 2019). From the perspective of TPB, this perception lowers the dissatisfied customer’s sense of self-efficacy. They feel less confident that returning the product is necessary, possibly leaning towards low-effort non-returning decision. Because secondary functions are seen as bonuses, their failure is often tolerated, widening the intention-behaviour gap by reducing the likelihood of follow-through on return intentions.

  • Reliability

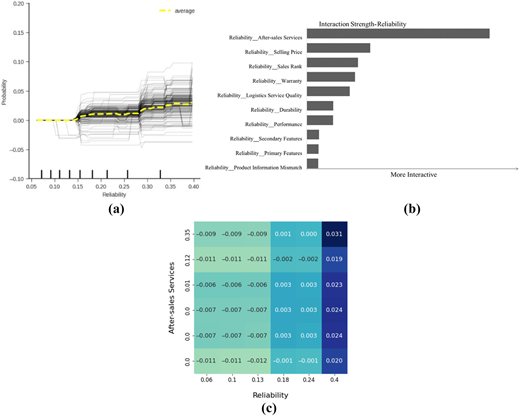
Reliability poses a positive impact towards assertive OPRB (Figure 8(a)), thereby supporting H2c. Customers often express dissatisfaction in a direct and assertive manner, as seen in comments like, “Unreliable HDMI output  the HDMI output had serious defects. Returned it”. This manifests the seriousness when confronting the reliability issues. Such statements highlight the seriousness with which reliability issues are perceived. From the lens of PT and AT, reliability failures are interpreted as functional losses with high locus, heightening the sense of personal loss and increasing the likelihood of assertive OPRB.

Reliability strongly interacts with after-sales services (Figure 8(b)). The joint effect is non-linear but upward tendencies (Figure 8(c)). This is because customers who face reliability issues usually seek support from customer helpdesk, technicians, or instructions provided by sellers to troubleshoot their problem. For example: “… tried using the online manual system, but it gave me errors … At least Amazon allowed me to return it”; “… Tried to reach Roku customer service … I finally hung up. Returned product”. Service failures such as no responses, non-effective solutions, or misleading instructions make them give up on the product which reflects a stable issue according to AT.

  • Ease of use

Since ease of use is not detected, H2d is not supported. This might be explained that usability issues are often perceived as subjective and dependent on the customer’s own technical knowledge. Some novice users may not identify the problem specifically as a usability issue, but rather misattribute it to broader functional defects, thereby diluting its impact on (non)-assertive OPRB.

4.2.3 Extrinsic attributes

  • Product information mismatch

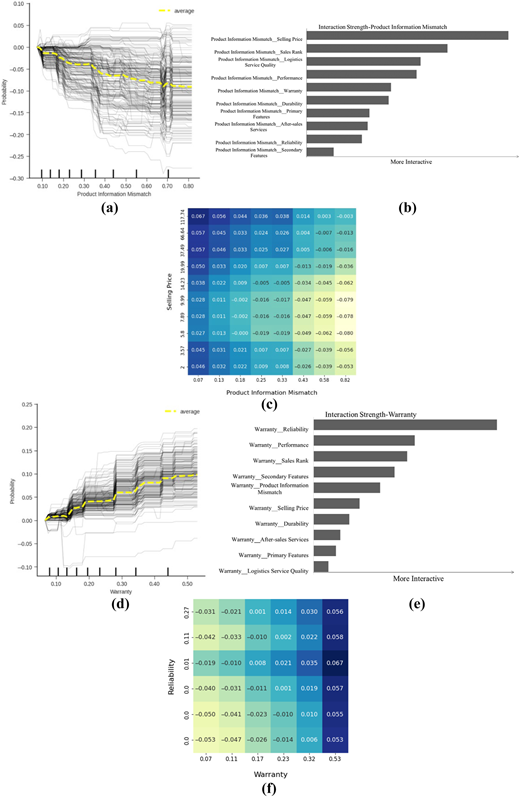
In Figure 9(a), the average PDP of product information shows the downward trend when it starts becoming the main topic in a review (≥0.1), thereby H3a is not supported. This finding is contrary to the previous findings that exaggerated/distorted product information are the factor triggering OPRB (Martínez-López et al., 2022b). The average downward trend (i.e. favour towards non-assertiveness) can be explicable as the information mismatches may not be as serious as the other quality issues (e.g. performance, reliability). For example, a hard drive, where its USB plug is incompatible with MacBook Pro, would have been simply dealt with a USB-C adaptor. TPB suggests that customers may perceive limited control over the return process if they feel the issue stems from their own mistake, such as not fully reviewing product details. Consequently, this low confidence forms an abstract vision for return intention and less likely to turn into action (i.e. inclined abstainers), supressing the assertiveness. Low locus from AT perspective suggests that customers might attribute the mismatch to internal factors (e.g. their lack of attention to compatibility details) rather than the seller’s fault, reducing the likelihood of assertive OPRB.

Product information mismatch and selling price interact the most with each other (Figure 9(b)). When customers are strongly concerned about product information mismatch (≥0.7) for low-price products (≤$20), customers strongly express non-assertive OPRB (Figure 9(c)). This aligns with the individual downwards in Figure 10(a) that it is generally impractical to invest time and energy in returning a low-value product, particularly if the product remains functional. Hence, customers are less assertive to take action as the hassle of returning may outweigh the value of refund. Customers understood they get what they paid for.

  • After-sales services

Since after-sales services show a weak impact on (non)-assertive OPRB (see Online Appendix C2), H3b is not supported. This may be because customers view after-sales services as minor and unrelated to product functionality. They become more relevant when linked to functional issues, such as product defects, as discussed under the reliability attribute.

  • Warranty

Figure 9(d) depicts the impact of warranty, indicating a positive correlation between the frequency warranty-related discussion and assertive OPRB. Notably, the average probability increases significantly to approximately 10%, hence H3c is supported. This is in line with our discussion in Section 2.3.1 that substandard warranty services are the potential cause for assertive OPRB. For example, consider this review “… sent the unit back to Samsung for repairs. After repair the unit stopped playing Blu-ray disks after 2 months …”. In this case, poor warranty can be seen as a relatively stable permanent product and service quality problem according to AT. Hence, this chronic failure heightens customer negative experience and increases assertive OPRB.

Additionally, warranty is strongly interacted with reliability than any other attributes (Figure 9(e)). This combined effect increases the probability significantly (10%) (Figure 9(f)). Our study found that customers prominently use the warranty services if the products have reliable issues as a last resort. This finding contradicts previous studies suggesting that customers may still develop product attachment despite product defects (Wei et al., 2023). There is a portion of customers who try to repair/replace the product with reliability issues rather than return it. Hence, unsatisfactory warranty services for reliability issues are the cause of assertive OPRB (e.g. a review “… within warranty I sent it to Sony/united radio for repairs. It worked for 1 week upon it is return and then failed again. The reliability of this receiver is the worst …”).

  • Logistics service quality

Since logistics service quality shows a weak impact on (non)-assertive OPRB (see Online Appendix C2), H3d is not supported. Like after-sales services, this may be because customers see logistics services as background processes that do not directly affect their perception unless it impacts product quality. However, this attribute does not strongly interact with any moderate or strong intrinsic variables.

4.2.4 Selling price

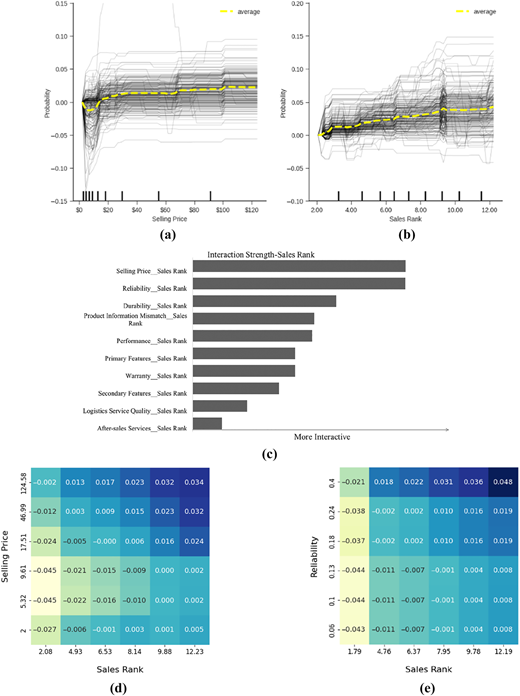
In Figure 10(a), as the price surpasses $20 and reaches to $30, there is an upward shift in probability (up to 10%), indicating an increased sensitivity as they feel more loss as per PT. Hence, this finding supports H5. This trend becomes flattened when the price of the product is higher than $30. If these products fail, it will significantly trigger disconfirmation of belief, according to ECT theory, leading to assertive OPRB. Therefore, the retailers who have a variety of product price range would benefit from a customised mitigation strategy.

4.2.5 Sales rank

The higher the sales rank value is, the less popular the product as discussed in Section 3.3.2. In Figure 10(b), lesser-known products are unsurprisingly linked to stronger assertive OPRB, as customers tend to associate them with poor quality due to their low popularity, thereby rejecting H6. As opposed to previous literature (Jin et al., 2023), the discussed brushing effect may not exist between assertive and non-assertive OPRB. Another possible explanation is that Amazon and other marketplace platforms are recently mitigating this scamming effect. We also found strong interactions between sales rank and reliability, as well as between sales rank and selling price (Figure 10(c)). It is common sense that defective, high-priced products from less popular sellers strongly increase the assertive OPRB likelihood (Figure 10(e and f)).

Table 6 presents a summary of the findings, including hypothesis outcomes, study implications, and practical recommendations.

We run three separated robustness checks (see Online Appendix C3):

  1. Test 1 – Using electronics reviews in different time periods. We collected 1,711 reviews for class 1 and 1,314 reviews for class 0 from 22 time periods earlier than the main dataset. Applying the same methodology, we found that the results are consistent with the main model in which the top 7 determinant variables are still important to the output variable.

  2. Test 2 – Using reviews for fashion items in same time periods. We collected 1,426 reviews for class 1 and 1,892 reviews for class 0 from the same 22 time periods with the main dataset. We found that most variables have consistent impacts with the main model. Interestingly, physical appearance has become the 2nd important variable. This indicates that physical appearance is an assertive OPRB’s driver because OPRB through aesthetic incongruity is heightened due to mismatching with other items or event uses (Patrick and Hagtvedt, 2011; Rao et al., 2014).

  3. Test 3 - Using reviews for grocery items in different time periods. We collected 633 reviews for class 1 and 1,899 reviews for class 0 from 22 time periods earlier than the main dataset. We found that most variables have consistent impacts with the main model. However, primary features become the determinant assertive OPRB’s driver. This attribute is defined by product ingredients, or compounds which is perceived by customers to assess product quality uncertainties (Hong and Pavlou, 2014). Hence, any complaint on this attribute is the result of poor product quality leading to decisive behaviours.

Our key contribution to the Production and Operations Management domain lies in reframing OPRB not merely as a passive consequence of operational decisions but as an active and critical feedback loop in operational optimisation. While previous research has explored how operational factors such as logistics, product quality, or information transparency affect return rates (e.g. Rao et al., 2014), our study takes a bidirectional perspective. We illustrate how product and service issues influence assertive and non-assertive OPRB, proposing ways to enhance operational processes in manufacturing and retailing. This perspective aligns with the evolving recognition of customers as co-managers and co-creators of operational value, where OPRB and customer feedback become embedded in continuous quality improvement cycles (Bendoly and Oliva, 2024). We advance previous studies by integrating intrinsic and extrinsic product attributes, and interpersonal characteristics (e.g. assertiveness) to capture the nuanced behavioural patterns driving return decisions. This fine-grained approach fills a gap in the literature, which often treats OPRB in aggregate, overlooking individual psychological and contextual differences.

To theoretically ground our study, we extend the existing literature by integrating three behavioural theories – AT, PT, and the TPB – to explain the psychological, emotional, and situational mechanisms behind assertive and non-assertive OPRB. While each of these theories has been applied in consumer behaviour literature, our study contributes by adapting and connecting them in novel ways to fit the unique context of post-purchase return decisions in e-commerce.

First, we advance AT by applying it not only to the moment of dissatisfaction but also to the return decision that follows. Existing research has typically used the theory to understand complaint behaviour; we extend it by demonstrating how consumers’ attribution of responsibility – across high locus (e.g. low product performance and reliability), controllability and low stability (e.g. warranty and after-sales service failure) – not only explains their affective reactions but also predicts the assertiveness of their return actions. In doing so, we reposition attribution as a bridge between cognitive dissonance and behavioural expression, particularly in the context of digital retail environments where blame is frequently externalised toward sellers and platforms. Furthermore, we imply how platform-level lenient return policies (e.g. free refunds, no restocking fees) can reinforce external attribution for, making it easier for customers to hold sellers accountable and justify returns. A reverse approach can be effective to deal with this phenomenon.

Second, we refine the application of PT by linking the concept of loss aversion with perceived product value and post-purchase regret. Rather than focusing solely on financial losses, our study suggests that assertive OPRB are triggered by perceived functional losses – such as unmet expectations about product performance, reliability or durability. By applying this theory in the product return context, we show how emotional framing of losses influences customer assertiveness, extending the utility of PT into operational domains such as warranty design, product functionality, and after-sales service.

Third, we expand the TPB by exploring how structural, normative, and psychological barriers can potentially widen the intention-behaviour gaps – even among dissatisfied customers. Our study highlights how behavioural control (e.g. insufficiently reviewed product information, strict return policy design and process), and low sense of self-efficacy (e.g. durability issues with secondary features) shape non-assertive OPRB. This contribution helps clarify why customers sometimes choose not to return products despite being dissatisfied – a gap in much of the existing OPRB literature. We thus extend the theory’s relevance to the post-purchase phase, where hesitations are moderated not only by internal beliefs but also by the operational environment.

This study provides actionable insights for e-commerce managers, manufacturers, and operations professionals seeking to manage returns more strategically in digital retail settings. One of the key managerial contributions lies in the clear differentiation between assertive and non-assertive forms of OPRB. Treating all returns as uniform overlooks the distinct psychological and operational drivers underlying each type. Our findings enable managers to segment returners and tailor mitigation strategies that reduce financial loss, preserve customer relationships, and enhance operational efficiency. By uncovering how specific intrinsic and extrinsic product attributes influence both assertive and non-assertive OPRB, our study reframes return behaviour as a rich source of operational feedback.

From a product perspective, we identify intrinsic product attributes – namely performance, durability, and reliability – as key triggers for assertive returns, particularly when expectations are not met for high-priced items. Managers can leverage these insights to prioritise design improvements, quality assurance, and product testing, especially in categories where functionality is central to perceived value. Addressing these issues upstream in the product lifecycle can prevent dissatisfaction from manifesting in costly assertive return actions.

At the same time, extrinsic product attributes such as product information mismatch, substandard warranty coverage, and inadequate after-sales services are shown to affect both assertive and non-assertive OPRB. Managers can reduce return rates and enhance trust by improving the clarity, accuracy, and accessibility of product information. Strengthening warranty services and after-sales support not only helps customers resolve issues post-purchase but also reduces the perception of risk and builds loyalty.

Importantly, our study reveals that non-assertive returners – those who are dissatisfied but choose not to return – are often overlooked, despite representing a silent threat to customer retention. These customers are particularly sensitive to issues with durability, secondary features, and product information mismatch. For this group, low-cost, pre-emptive solutions such as highlighting secondary feature durability in marketing content or providing purchase-risk notices can effectively mitigate dissatisfaction without incurring high operational costs.

Finally, by focusing on core product and service attributes derived from multiple sellers’ large and diverse online review data, this study provides insights that capture not only reviewing but also non-reviewing customers, broadly applicable across diverse e-commerce and retail environments. The generalisability of our findings and recommendations enhances their relevance to a wide range of stakeholders, including manufacturers, supply chain professionals, product developers, and after-sales service teams operating across diverse industry contexts.

This study aims to investigate the impact of product quality attributes on the transition of customer motivation from the OPRB non-assertiveness to assertiveness in the e-commerce context. We developed a data-driven ML approach to examine the discrepancy using Amazon product review data on the major department of electronics. We identified the determinant attributes and evaluated their effects using VIR and permutation test. Our findings suggest that warranty, durability, price, product information, performance, sales rank and reliability are the determinants of assertive and non-assertive OPRB. Additionally, through PDP and H-statistics analysis, these attributes’ interactions also jointly impact the OPRB.

This study has some limitations. Firstly, this study uses customer reviews from online marketplace, which may introduce self-selection bias. Reviewing returners may differ from non-reviewing returners in terms of personality, engagement, or satisfaction levels, which may limit the generalisability of the findings to the population of non-reviewing returners. Although Cheng et al. (2024) has demonstrated that review patterns at the product level can reliably and accurately predict return records and reasons, including those of non-reviewing customers, this inference remains indirect and should be interpreted with caution. We have attempted to mitigate this limitation by incorporating product-level variables such as sales rank, which can capture broader market-level return patterns including those of non-reviewing customers. Future research could further address these limitations by integrating complementary data sources such as direct transactional records or validation surveys and experiments, particularly with non-reviewing customers, to enhance generalisability and uncover additional nuances of (non)assertive OPRB. Secondly, while ML methods such as topic modelling and classification allow for the discovery of complex patterns and interactions, these approaches naturally involve decisions (for example, topic number selection and classification thresholds) that may affect model interpretability. To mitigate it, robustness checks were conducted to ensure the stability of findings, topic coherence was validated using a combined human-machine approach, and model performance was evaluated across various ML techniques and metrics to confirm consistency. Thirdly, LDA assumes that each review is dominated by many topics which are realistic. However, the PDP and variable interaction models can only examine the dual effect as its best. Future studies are suggested to decipher the interactions among three or more attributes. Lastly, since we do not include the demographic of customers, we assume all customers are homogeneous towards price sensitivity. This can be included by empirical study in the future.

The supplementary material for this article can be found online.
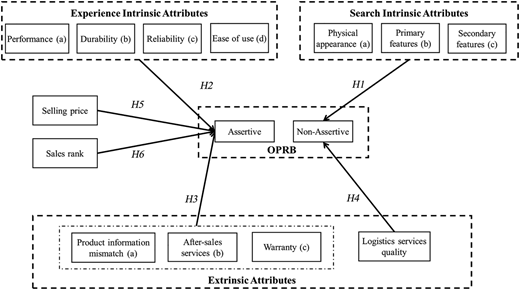
Abdulla
,
H.
,
Ketzenberg
,
M.
and
Abbey
,
J.D.
(
2019
), “
Taking stock of consumer returns: a review and classification of the literature
”,
Journal of Operations Management
, Vol. 
65
No. 
6
, pp. 
560
-
605
, doi: .
Abdulla
,
H.
,
Ketzenberg
,
M.
,
Abbey
,
J.D.
and
Heim
,
G.R.
(
2025
), “
The point of no return? Restrictive changes to lenient return policies and consumer reactions to them
”,
Journal of Operations Management
, Vol. 
71
No. 
1
, pp. 
81
-
108
, doi: .
Abrahams
,
A.S.
,
Fan
,
W.
,
Wang
,
G.A.
,
Zhang
,
Z.
and
Jiao
,
J.
(
2015
), “
An integrated text analytic framework for product defect discovery
”,
Production and Operations Management
, Vol. 
24
No. 
6
, pp. 
975
-
990
, doi: .
Akçay
,
Y.
,
Boyacbox
,
T.
and
Zhang
,
D.
(
2013
), “
Selling with money-back guarantees: the impact on prices, quantities, and retail profitability
”,
Production and Operations Management
, Vol. 
22
No. 
4
, pp. 
777
-
791
, doi: .
Anderson
,
R.E.
(
1973
), “
Consumer dissatisfaction: the effect of disconfirmed expectancy on perceived product performance
”,
Journal of Marketing Research
, Vol. 
10
No. 
1
, p.
38
, doi: .
Anderson
,
E.T.
,
Hansen
,
K.
and
Simester
,
D.
(
2009
), “
The option value of returns: theory and empirical evidence
”,
Marketing Science
, Vol. 
28
No. 
3
, pp. 
405
-
423
, doi: .
Arts
,
J.W.C.
,
Frambach
,
R.T.
and
Bijmolt
,
T.H.A.
(
2011
), “
Generalizations on consumer innovation adoption: a meta-analysis on drivers of intention and behavior
”,
International Journal of Research in Marketing
, Vol. 
28
No. 
2
, pp. 
134
-
144
, doi: .
Bendoly
,
E.
and
Oliva
,
R.
(
2024
), “
Holding North: recognizing identity and advancing contribution in operations management
”,
Journal of Operations Management
, Vol. 
70
No. 
4
, pp. 
518
-
522
, doi: .
Blei
,
D.M.
,
Ng
,
A.Y.
and
Jordan
,
M.I.
(
2003
), “
Latent Dirichlet allocation
”,
Journal of Machine Learning Research
, Vol. 
3
, pp. 
4
-
5
.
Breiman
,
L.
(
2001
), “
Random forests
”,
Machine Learning
, Vol. 
45
No. 
1
, pp. 
5
-
32
, doi: .
Browning
,
V.
,
So
,
K.K.F.
and
Sparks
,
B.
(
2013
), “
The influence of online reviews on consumers' attributions of service quality and control for service standards in hotels
”,
Journal of Travel and Tourism Marketing
, Vol. 
30
Nos
1-2
, pp. 
23
-
40
, doi: .
Brucks
,
M.
,
Zeithaml
,
V.A.
and
Naylor
,
G.
(
2000
), “
Price and brand name as indicators of quality dimensions for consumer durables
”,
Journal of the Academy of Marketing Science
, Vol. 
28
No. 
3
, pp. 
359
-
374
, doi: .
Carroll
,
N.
(
2021
), “
UK Amazon: influence and ambition in the grocery sector market report 2021
”,
Mintel
,
available at:
 https://store.mintel.com/report/amazon-influence-and-ambition-in-the-grocery-sector-uk-january-2021 (
accessed
 17 May 2024).
Chang
,
H.H.
,
Tsai
,
Y.C.
,
Wong
,
K.H.
,
Wang
,
J.W.
and
Cho
,
F.J.
(
2015
), “
The effects of response strategies and severity of failure on consumer attribution with regard to negative word-of-mouth
”,
Decision Support Systems
, Vol. 
71
, pp. 
48
-
61
, doi: .
Cheng
,
S.Y.Y.
,
White
,
T.B.
and
Chaplin
,
L.N.
(
2012
), “
The effects of self-brand connections on responses to brand failure: a new look at the consumer–brand relationship
”,
Journal of Consumer Psychology
, Vol. 
22
No. 
2
, pp. 
280
-
288
, doi: .
Cheng
,
H.-F.
,
Krikon
,
E.
and
Murdock
,
V.
(
2024
), “
Why do customers return products? Using customer reviews to predict product return behaviors
”,
Proceedings of the 2024 ACM SIGIR Conference on Human Information Interaction and Retrieval
,
New York, NY, USA
,
ACM
, pp. 
12
-
22
, doi: .
Chevalier
,
J.A.
and
Mayzlin
,
D.
(
2006
), “
The effect of word of mouth on sales: online book reviews
”,
Journal of Marketing Research
, Vol. 
43
No. 
3
, pp. 
345
-
354
, doi: .
Cho
,
W.
,
Min
,
D.-J.
and
Dresner
,
M.
(
2022
), “
The impact of predicted quality and customer cost on quality assurance behavior
”,
International Journal of Operations and Production Management
, Vol. 
42
No. 
4
, pp. 
409
-
439
, doi: .
Chou
,
Y.
,
Chuang
,
H.H.
,
Chou
,
P.
and
Oliva
,
R.
(
2023
), “
Supervised machine learning for theory building and testing: opportunities in operations management
”,
Journal of Operations Management
, Vol. 
69
No. 
4
, pp. 
643
-
675
, doi: .
Crutsinger
,
C.
,
Knight
,
D.
and
Kim
,
H.
(
2010
), “
Teens' consumer interaction styles: the impact of assertive and aggressive behaviour on attitudes towards marketing practices
”,
International Journal of Consumer Studies
, Vol. 
34
No. 
2
, pp. 
196
-
203
, doi: .
Das
,
L.
and
Kunja
,
S.R.
(
2024
), “
Why do consumers return products? A qualitative exploration of online product return behaviour of young consumers
”,
Journal of Retailing and Consumer Services
, Vol. 
78
, 103770, doi: .
De
,
P.
,
Hu
,
Y.J.
and
Rahman
,
M.S.
(
2013
), “
Product-oriented web technologies and product returns: an exploratory study
”,
Information Systems Research
, Vol. 
24
No. 
4
, pp. 
998
-
1010
, doi: .
Dong
,
X.
,
Quariguasi Frota Neto
,
J.
and
Potter
,
A.
(
2025
), “
Unboxing product returns: what drives return policy leniency in the fashion industry?
”,
International Journal of Operations and Production Management
, Vol. 45 No. 8, pp. 1461-1480, doi: .
Duong
,
Q.H.
,
Zhou
,
L.
,
Van Nguyen
,
T.
and
Meng
,
M.
(
2025
), “
Understanding and predicting online product return behavior: an interpretable machine learning approach
”,
International Journal of Production Economics
, Vol. 
280
, 109499, doi: .
El Kihal
,
S.
and
Shehu
,
E.
(
2022
), “
It's not only what they buy, it's also what they keep: linking marketing instruments to product returns
”,
Journal of Retailing
, Vol. 
98
No. 
3
, pp. 
558
-
571
, doi: .
Erdem
,
T.
and
Swait
,
J.
(
1998
), “
Brand equity as a signaling phenomenon
”,
Journal of Consumer Psychology
, Vol. 
7
No. 
2
, pp. 
131
-
157
, doi: .
Ertekin
,
N.
(
2018
), “
Immediate and long-term benefits of in-store return experience
”,
Production and Operations Management
, Vol. 
27
No. 
1
, pp. 
121
-
142
, doi: .
Espejel
,
J.
,
Fandos
,
C.
and
Flavián
,
C.
(
2007
), “
The role of intrinsic and extrinsic quality attributes on consumer behaviour for traditional food products
”,
Managing Service Quality
, Vol. 
17
No. 
6
, pp. 
681
-
701
, doi: .
European Environment Agency
(
2024
), “Many returned and unsold textiles end up destroyed in Europe”,
European Environment Agency
, 4 March, available at: https://www.eea.europa.eu/en/newsroom/news/many-returned-and-unsold-textiles (
accessed 10 April 2025
).
Fernandez-Lores
,
S.
,
Crespo-Tejero
,
N.
,
Fernández-Hernández
,
R.
and
García-Muiña
,
F.E.
(
2024
), “
Online product returns: the role of perceived environmental efficacy and post-purchase entrepreneurial cognitive dissonance
”,
Journal of Business Research
, Vol. 
174
, 114462, doi: .
Finch
,
B.J.
(
2007
), “
Customer expectations in online auction environments: an exploratory study of customer feedback and risk
”,
Journal of Operations Management
, Vol. 
25
No. 
5
, pp. 
985
-
997
, doi: .
Fiske
,
S.T.
and
Taylor
,
S.E.
(
1991
),
Social Cognition: McGraw-Hill Series in Social Psychology, Social Cognition
,
Mcgraw-Hill Book
,
New York
.
Frei
,
R.
,
Jack
,
L.
and
Brown
,
S.
(
2020
), “
Product returns: a growing problem for business, society and environment
”,
International Journal of Operations and Production Management
, Vol. 
40
No. 
10
, pp. 
1613
-
1621
, doi: .
Garvin
,
D.A.
(
1987
), “
Competing on the eight dimensions of quality
”,
Harvard Business Review
, pp. 
101
-
109
.
Gelbrich
,
K.
,
Gäthke
,
J.
and
Hübner
,
A.
(
2017
), “
Rewarding customers who keep a product: how reinforcement affects customers' product return decision in online retailing
”,
Psychology and Marketing
, Vol. 
34
No. 
9
, pp. 
853
-
867
, doi: .
Goldstein
,
A.
,
Kapelner
,
A.
,
Bleich
,
J.
and
Pitkin
,
E.
(
2015
), “
Peeking inside the black box: visualizing statistical learning with plots of individual conditional expectation
”,
Journal of Computational and Graphical Statistics
, Vol. 
24
No. 
1
, pp. 
44
-
65
, doi: .
Griffis
,
S.E.
,
Rao
,
S.
,
Goldsby
,
T.J.
and
Niranjan
,
T.T.
(
2012
), “
The customer consequences of returns in online retailing: an empirical analysis
”,
Journal of Operations Management
, Vol. 
30
No. 
4
, pp. 
282
-
294
, doi: .
Gustafsson
,
E.
,
Jonsson
,
P.
and
Holmström
,
J.
(
2021
), “
Reducing retail supply chain costs of product returns using digital product fitting
”,
International Journal of Physical Distribution and Logistics Management
, Vol. 
51
No. 
8
, pp. 
877
-
896
, doi: .
Harding
,
R.D.
,
Hildebrand
,
D.
,
Kramer
,
T.
and
Lasaleta
,
J.D.
(
2019
), “
The impact of acquisition mode on expected speed of product mastery and subsequent consumer behavior
”,
Journal of Consumer Research
, Vol. 
46
No. 
1
, pp. 
140
-
158
, doi: .
Hess
,
R.L.
,
Ganesan
,
S.
and
Klein
,
N.M.
(
2007
), “
Interactional service failures in a pseudorelationship: the role of organizational attributions
”,
Journal of Retailing
, Vol. 
83
No. 
1
, pp. 
79
-
95
, doi: .
Hong
,
Y.
and
Pavlou
,
P.A.
(
2014
), “
Product fit uncertainty in online markets: nature, effects, and antecedents
”,
Information Systems Research
, Vol. 
25
No. 
2
, pp. 
328
-
344
, doi: .
Huang
,
P.
,
Lurie
,
N.H.
and
Mitra
,
S.
(
2009
), “
Searching for experience on the web: an empirical examination of consumer behavior for search and experience goods
”,
Journal of Marketing
, Vol. 
73
No. 
2
, pp. 
55
-
69
, doi: .
Jin
,
C.
,
Yang
,
L.
and
Hosanagar
,
K.
(
2023
), “
To brush or not to brush: product rankings, consumer search, and fake orders
”,
Information Systems Research
, Vol. 
34
No. 
2
, pp. 
532
-
552
, doi: .
Kahneman
,
D.
and
Tversky
,
A.
(
2013
), “Prospect theory: an analysis of decision under risk”, in
Handbook of the Fundamentals of Financial Decision Making: Part I
, pp. 
99
-
127
, doi: .
Ketzenberg
,
M.E.
,
Abbey
,
J.D.
,
Heim
,
G.R.
and
Kumar
,
S.
(
2020
), “
Assessing customer return behaviors through data analytics
”,
Journal of Operations Management
, Vol. 
66
No. 
6
, pp. 
622
-
645
, doi: .
Kianpour
,
K.
,
Jusoh
,
A.
,
Mardani
,
A.
,
Streimikiene
,
D.
,
Cavallaro
,
F.
,
Nor
,
K.Md.
and
Zavadskas
,
E.
(
2017
), “
Factors influencing consumers' intention to return the end of life electronic products through reverse supply chain management for reuse, repair and recycling
”,
Sustainability
, Vol. 
9
No. 
9
, 1657, doi: .
Lee
,
D.H.
(
2015
), “
An alternative explanation of consumer product returns from the postpurchase dissonance and ecological marketing perspectives
”,
Psychology and Marketing
, Vol. 
32
No. 
1
, pp. 
49
-
64
, doi: .
Lee
,
M.
and
Lou
,
Y.-C.
(
2011
), “
Consumer reliance on intrinsic and extrinsic cues in product evaluations: a conjoint approach
”,
Journal of Applied Business Research (JABR)
, Vol. 
12
No. 
1
, p.
21
, doi: .
Lee
,
S.
and
Yi
,
Y.
(
2019
), “
Retail is detail! Give consumers a gift rather than a bundle’: promotion framing and consumer product returns
”,
Psychology and Marketing
, Vol. 
36
No. 
1
, pp. 
15
-
27
, doi: .
Ligthart
,
A.
,
Catal
,
C.
and
Tekinerdogan
,
B.
(
2021
), “
Analyzing the effectiveness of semi-supervised learning approaches for opinion spam classification
”,
Applied Soft Computing
, Vol. 
101
, 107023, doi: .
Lundberg
,
S.
and
Lee
,
S.-I.
(
2017
), “A unified approach to interpreting model predictions”, in
Advances in Neural Information Processing Systems
, pp. 
4766
-
4775
.
Mardumyan
,
A.
and
Siret
,
I.
(
2023
), “
When review verification does more harm than good: how certified reviews determine customer–brand relationship quality
”,
Journal of Business Research
, Vol. 
160
, 113756, doi: .
Martínez-López
,
F.J.
,
Feng
,
C.
,
Li
,
Y.
and
López-López
,
D.
(
2022a
), “
Using instant refunds to improve online return experiences
”,
Journal of Retailing and Consumer Services
, Vol. 
68
, 103067, doi: .
Martínez-López
,
F.J.
,
Li
,
Y.
,
Feng
,
C.
,
Liu
,
H.
and
Sansó-Mata
,
M.
(
2022b
), “
‘What I’ve received doesn't match what I saw online’: effects of purchase-risk notices on reducing online returns
”,
Information and Management
, Vol. 
59
No. 
8
, 103720, doi: .
Minnema
,
A.
,
Bijmolt
,
T.H.A.
,
Gensler
,
S.
and
Wiesel
,
T.
(
2016
), “
To keep or not to keep: effects of online customer reviews on product returns
”,
Journal of Retailing
, Vol. 
92
No. 
3
, pp. 
253
-
267
, doi: .
Mishra
,
A.
and
Dutta
,
P.
(
2024
), “
Return management in e-commerce firms: a machine learning approach to predict product returns and examine variables influencing returns
”,
Journal of Cleaner Production
, Vol. 
477
, 143802, doi: .
Mor
,
A.
,
Orsenigo
,
C.
,
Soto Gomez
,
M.
and
Vercellis
,
C.
(
2024
), “
Shaping the causes of product returns: topic modeling on online customer reviews
”, Electronic Commerce Research, pp.
1
-
35
, doi: .
National Retail Federation
(
2023
), “
2023 consumer returns in the retail industry
”,
National Retail Federation
,
22 December, available at:
 https://nrf.com/research/2023-consumer-returns-retail-industry (
accessed
 6 August 2024).
Nelson
,
P.
(
1970
), “
Information and consumer behavior
”,
Journal of Political Economy
, Vol. 
78
No. 
2
, pp. 
311
-
329
, doi: .
Ni
,
J.
,
Li
,
J.
and
McAuley
,
J.
(
2019
), “
Justifying recommendations using distantly-labeled reviews and fine-grained aspects
”,
Proceedings of the 2019 Conference on Empirical Methods in Natural Language Processing and the 9th International Joint Conference on Natural Language Processing (EMNLP-IJCNLP)
,
Stroudsburg, PA, USA
,
Association for Computational Linguistics
, pp. 
188
-
197
, doi: .
Ojala
,
M.
and
Garriga
,
G.C.
(
2010
), “
Permutation tests for studying classifier performance
”,
Journal of Machine Learning Research
, Vol. 
11
No. 6, pp. 1833-1863.
Orbell
,
S.
and
Sheeran
,
P.
(
1998
), “
Inclined abstainers': a problem for predicting health‐related behaviour
”,
British Journal of Social Psychology
, Vol. 
37
No. 
2
, pp. 
151
-
165
, doi: .
Panda
,
D.
,
Raut
,
S.K.
,
Rana
,
S.
and
Shamsudin
,
M.N.
(
2024
), “
Leveraging gamification to enhance persuasive behaviour and streamline online product returns: an approach grounded in multiple case studies
”,
Journal of Business and Industrial Marketing
, Vol. 
39
No. 
12
, pp. 
2684
-
2698
, doi: .
Parasuraman
, A.B.L.L.
,
Zeithaml
,
V.A.
and
Berry
,
L.L.
(
1988
), “SERVQUAL: a multiple-item scale for measuring consumer perception of service quality”,
Journal of Retailing
, Vol. 
64
No. 
1
, pp. 12-40.
Patrick
,
V.M.
and
Hagtvedt
,
H.
(
2011
), “
Aesthetic incongruity resolution
”,
Journal of Marketing Research
, Vol. 
48
No. 
2
, pp. 
393
-
402
, doi: .
Powers
,
T.L.
and
Jack
,
E.P.
(
2013
), “
The influence of cognitive dissonance on retail product returns
”,
Psychology and Marketing
, Vol. 
30
No. 
8
, pp. 
724
-
735
, doi: .
Ramanathan
,
U.
,
Subramanian
,
N.
and
Parrott
,
G.
(
2017
), “
Role of social media in retail network operations and marketing to enhance customer satisfaction
”,
International Journal of Operations and Production Management
, Vol. 
37
No. 
1
, pp. 
105
-
123
, doi: .
Rao
,
S.
,
Goldsby
,
T.J.
,
Griffis
,
S.E.
and
Iyengar
,
D.
(
2011
), “
Electronic logistics service quality (e-LSQ): its impact on the customer's purchase satisfaction and retention
”,
Journal of Business Logistics
, Vol. 
32
No. 
2
, pp. 
167
-
179
, doi: .
Rao
,
S.
,
Rabinovich
,
E.
and
Raju
,
D.
(
2014
), “
The role of physical distribution services as determinants of product returns in Internet retailing
”,
Journal of Operations Management
, Vol. 
32
No. 
6
, pp. 
295
-
312
, doi: .
ReturnLogic
(
2022
), “
This is why you should consider warranty requests as a return type
”, ReturnLogic, available at: https://www.returnlogic.com/blog/why-you-should-consider-warranty-requests-as-a-return-type/ (
accessed 19 March 2025
).
Richardson
,
P.S.
,
Dick
,
A.S.
and
Jain
,
A.K.
(
1994
), “
Extrinsic and intrinsic cue effects on perceptions of store brand quality
”,
Journal of Marketing
, Vol. 
58
No. 
4
, pp. 
28
-
36
, doi: .
Richins
,
M.L.
(
1983
), “
An analysis of consumer interaction styles in the marketplace
”,
Journal of Consumer Research
, Vol. 
10
No. 
1
, p.
73
, doi: .
Röder
,
M.
,
Both
,
A.
and
Hinneburg
,
A.
(
2015
), “
Exploring the space of topic coherence measures
”,
WSDM 2015 – Proceedings of the 8th ACM International Conference on Web Search and Data Mining
, pp. 
399
-
408
, doi: .
Sahoo
,
N.
,
Dellarocas
,
C.
and
Srinivasan
,
S.
(
2018
), “
The impact of online product reviews on product returns
”,
Information Systems Research
, Vol. 
29
No. 
3
, pp. 
723
-
738
, doi: .
Schulz
,
P.
,
Shehu
,
E.
and
Clement
,
M.
(
2019
), “
When consumers can return digital products: influence of firm- and consumer-induced communication on the returns and profitability of news articles
”,
International Journal of Research in Marketing
, Vol. 
36
No. 
3
, pp. 
454
-
470
, doi: .
Serravalle
,
F.
,
Vannucci
,
V.
and
Pantano
,
E.
(
2022
), “
Take it or leave it?’: evidence on cultural differences affecting return behaviour for Gen Z
”,
Journal of Retailing and Consumer Services
, Vol. 
66
, 102942, doi: .
Shang
,
G.
,
Ghosh
,
B.P.
and
Galbreth
,
M.R.
(
2017a
), “
Optimal retail return policies with wardrobing
”,
Production and Operations Management
, Vol. 
26
No. 
7
, pp. 
1315
-
1332
, doi: .
Shang
,
G.
,
Pekgün
,
P.
,
Ferguson
,
M.
and
Galbreth
,
M.
(
2017b
), “
How much do online consumers really value free product returns? Evidence from eBay
”,
Journal of Operations Management
, Vols
53-56
No. 
1
, pp. 
53
-
56
, doi: .
Sheeran
,
P.
(
2002
), “
Intention—behavior relations: a conceptual and empirical review
”,
European Review of Social Psychology
, Vol. 
12
No. 
1
, pp. 
1
-
36
, doi: .
Shulman
,
J.D.
,
Cunha
,
M.
and
Saint Clair
,
J.K.
(
2015
), “
Consumer uncertainty and purchase decision reversals: theory and evidence
”,
Marketing Science
, Vol. 
34
No. 
4
, pp. 
590
-
605
, doi: .
Simpson
,
D.
,
Power
,
D.
,
Riach
,
K.
and
Tsarenko
,
Y.
(
2019
), “
Consumer motivation for product disposal and its role in acquiring products for reuse
”,
Journal of Operations Management
, Vol. 
65
No. 
7
, pp. 
612
-
635
, doi: .
Sousa
,
R.
and
Voss
,
C.A.
(
2009
), “
The effects of service failures and recovery on customer loyalty in e‐services
”,
International Journal of Operations and Production Management
, Vol. 
29
No. 
8
, pp. 
834
-
864
, doi: .
Szybillo
,
G.J.
and
Jacoby
,
J.
(
1974
), “
Intrinsic versus extrinsic cues as determinants of perceived product quality
”,
Journal of Applied Psychology
, Vol. 
59
No. 
1
, pp. 
74
-
78
, doi: .
Tóth
,
Z.
,
Liu
,
M.
,
Luo
,
J.
and
Braziotis
,
C.
(
2019
), “
The role of social media in managing supplier attractiveness
”,
International Journal of Operations and Production Management
, Vol. 
40
No. 
5
, pp. 
625
-
646
, doi: .
Trope
,
Y.
and
Liberman
,
N.
(
2003
), “
Temporal construal
”,
Psychological Review
, Vol. 
110
No. 
3
, pp. 
403
-
421
, doi: .
Ursu
,
R.M.
(
2018
), “
The power of rankings: quantifying the effect of rankings on online consumer search and purchase decisions
”,
Marketing Science
, Vol. 
37
No. 
4
, pp. 
530
-
552
, doi: .
Van Nguyen
,
T.
,
Zhou
,
L.
,
Chong
,
A.Y.L.
,
Li
,
B.
and
Pu
,
X.
(
2020
), “
Predicting customer demand for remanufactured products: a data-mining approach
”,
European Journal of Operational Research
, Vol. 
281
No. 
3
, pp. 
543
-
558
, doi: .
Wachter
,
K.
,
Vitell
,
S.J.
,
Shelton
,
R.K.
and
Park
,
K.
(
2012
), “
Exploring consumer orientation toward returns: unethical dimensions
”,
Business Ethics: A European Review
, Vol. 
21
No. 
1
, pp. 
115
-
128
, doi: .
Wallenburg
,
C.M.
,
Einmahl
,
L.
,
Lee
,
K.B.
and
Rao
,
S.
(
2021
), “
On packaging and product returns in online retail—mailing boxes or sending signals?
”,
Journal of Business Logistics
, Vol. 
42
No. 
2
, pp. 
291
-
308
, doi: .
Walsh
,
G.
,
Albrecht
,
A.K.
,
Kunz
,
W.
and
Hofacker
,
C.F.
(
2016
), “
Relationship between online retailers' reputation and product returns
”,
British Journal of Management
, Vol. 
27
No. 
1
, pp. 
3
-
20
, doi: .
Wang
,
K.Y.
,
Liang
,
M.
and
Peracchio
,
L.A.
(
2011
), “
Strategies to offset dissatisfactory product performance: the role of post-purchase marketing
”,
Journal of Business Research
, Vol. 
64
No. 
8
, pp. 
809
-
815
, doi: .
Wang
,
M.
,
Shang
,
G.
,
Rong
,
Y.
and
Galbreth
,
M.R.
(
2024
), “
Order basket contents and consumer returns
”,
Decision Sciences
, Vol. 
56
No. 
2
, pp. 
144
-
170
, doi: .
Wei
,
J.
,
Jiang
,
M.
,
Li
,
Y.N.
,
Li
,
W.
and
Mead
,
J.A.
(
2023
), “
The impact of product defect severity and product attachment on consumer negative emotions
”,
Psychology and Marketing
, Vol. 
40
No. 
5
, pp. 
1026
-
1042
, doi: .
Weiner
,
B.
(
2000
), “
Attributional thoughts about consumer behavior
”,
Journal of Consumer Research
, Vol. 
27
No. 
3
, pp. 
382
-
387
, doi: .
Weitzl
,
W.
,
Hutzinger
,
C.
and
Einwiller
,
S.
(
2018
), “
An empirical study on how webcare mitigates complainants' failure attributions and negative word-of-mouth
”,
Computers in Human Behavior
, Vol. 
89
, pp. 
316
-
327
, doi: .
Wells
,
V.
,
Valacich
,
J.S.
and
Hess
,
T.J.
(
2011
), “
What signal are you sending? How website quality influences perceptions of product quality and purchase intentions
”,
MIS Quarterly
, Vol. 
35
No. 
2
, p.
373
, doi: .
Wen
,
C.
,
Prybutok
,
R.V.
,
Blankson
,
C.
and
Fang
,
J.
(
2014
), “
The role of E-quality within the consumer decision making process
”,
International Journal of Operations and Production Management
, Vol. 
34
No. 
12
, pp. 
1506
-
1536
, doi: .
Wood
,
S.L.
and
Bettman
,
J.R.
(
2007
), “
Predicting happiness: how normative feeling rules influence (and even reverse) durability bias
”,
Journal of Consumer Psychology
, Vol. 
17
No. 
3
, pp. 
188
-
201
, doi: .
Yoo
,
S.H.
(
2014
), “
Product quality and return policy in a supply chain under risk aversion of a supplier
”,
International Journal of Production Economics
, Vol. 
154
, pp. 
146
-
155
, doi: .
Zeelenberg
,
M.
and
Pieters
,
R.
(
2004
), “
Beyond valence in customer dissatisfaction: a review and new findings on behavioral responses to regret and disappointment in failed services
”,
Journal of Business Research
, Vol. 
57
No. 
4
, pp. 
445
-
455
, doi: .
Zhang
,
Y.
,
Voorhees
,
C.M.
,
Lin
,
C.
,
Chiang
,
J.
,
Hult
,
G.T.M.
and
Calantone
,
R.J.
(
2022
), “
Information search and product returns across mobile and traditional online channels
”,
Journal of Retailing
, Vol. 
98
No. 
2
, pp. 
260
-
276
, doi: .
Published by Emerald Publishing Limited. This article is published under the Creative Commons Attribution (CC BY 4.0) licence. Anyone may reproduce, distribute, translate and create derivative works of this article (for both commercial and non-commercial purposes), subject to full attribution to the original publication and authors. The full terms of this licence may be seen at Link to the terms of the CC BY 4.0 licence.

Supplementary data

Data & Figures

Figure 1
A network diagram illustrating the relationships between intrinsic and extrinsic attributes affecting O P R B.At the top of the diagram, there are two groups of attributes: “Experience Intrinsic Attributes” and “Search Intrinsic Attributes,” each represented by dashed rectangular boxes. The “Experience Intrinsic Attributes” box contains four small boxes labeled from left to right as “Performance (a),” “Durability (b),” “Reliability (c),” and “Ease of use (d).” On the right side, the “Search Intrinsic Attributes” box contains three small boxes labeled from left to right as “Physical appearance (a),” “Primary features (b),” and “Secondary features (c).” In the center, another dashed rectangle is labeled “O P R B,” which contains two small boxes labeled “Assertive” on the left and “Non-Assertive” on the right. Two downward arrows H 2 and H 1, from the groups “Experience Intrinsic Attributes” and “Search Intrinsic Attributes,” are connected with the assertive box and non-assertive box, respectively. Two rectangular boxes on the left side of the central group are stacked vertically and labeled “Selling price” at the top and “Sales rank” at the bottom. Two rightward arrows, H 5 and H 6, from the selling price and sales rank boxes, respectively, are connected with the assertive box. At the bottom, another dashed rectangle is labeled “Extrinsic Attributes,” which contains two sections. The left section contains three small boxes enclosed in a dash-dotted rectangle labeled from left to right as “Product information mismatch (a),” “After-sales services (b),” and “Warranty (c).” The right section has one small box labeled “Logistics services quality.” Two upward arrows H 3 and H 4, from the left and right sections, are connected with the assertive box and non-assertive box, respectively.

Conceptual framework. Source: Authors’ own creation

Figure 1
A network diagram illustrating the relationships between intrinsic and extrinsic attributes affecting O P R B.At the top of the diagram, there are two groups of attributes: “Experience Intrinsic Attributes” and “Search Intrinsic Attributes,” each represented by dashed rectangular boxes. The “Experience Intrinsic Attributes” box contains four small boxes labeled from left to right as “Performance (a),” “Durability (b),” “Reliability (c),” and “Ease of use (d).” On the right side, the “Search Intrinsic Attributes” box contains three small boxes labeled from left to right as “Physical appearance (a),” “Primary features (b),” and “Secondary features (c).” In the center, another dashed rectangle is labeled “O P R B,” which contains two small boxes labeled “Assertive” on the left and “Non-Assertive” on the right. Two downward arrows H 2 and H 1, from the groups “Experience Intrinsic Attributes” and “Search Intrinsic Attributes,” are connected with the assertive box and non-assertive box, respectively. Two rectangular boxes on the left side of the central group are stacked vertically and labeled “Selling price” at the top and “Sales rank” at the bottom. Two rightward arrows, H 5 and H 6, from the selling price and sales rank boxes, respectively, are connected with the assertive box. At the bottom, another dashed rectangle is labeled “Extrinsic Attributes,” which contains two sections. The left section contains three small boxes enclosed in a dash-dotted rectangle labeled from left to right as “Product information mismatch (a),” “After-sales services (b),” and “Warranty (c).” The right section has one small box labeled “Logistics services quality.” Two upward arrows H 3 and H 4, from the left and right sections, are connected with the assertive box and non-assertive box, respectively.

Conceptual framework. Source: Authors’ own creation

Close Figure 1
Figure 2
A flowchart outlining steps to analyze online product return behavior using data and model construction.At the top left, the textbox “Understanding Online Product Return Behavior” is prominently displayed. It contains four sections, and each is enclosed in dashed rectangles. A downward arrow from this textbox leads to the first section. The first section, on the left side, is labeled “(1) Data collection and input variable construction,” which starts from a textbox “Amazon dot com” as the data source. This textbox is divided into two ovals labeled “57,305 unique products” and “209,761 reviews.” The combined result from these two leads to another textbox, “Data cleaning,” which is further divided into a textbox “Topic modelling” on the left, an oval in the center that is “Price,” and an oval on the right that is “Sales rank.” A downward arrow from topic modelling leads to another box, “Information retrieval,” followed by an oval, “Product quality attributes.” A rightward arrow from this leads to another box labeled “Data merging,” which is also connected by “Price” and “Sales rank.” A rightward arrow from “Data cleaning” leads to the second section, which is titled “(2) Output variable construction.” It starts from the oval “10 percent reviews,” followed by the textbox “Human and machine labeling and validation,” and “S L and S S L model training.” An arrow from this box leads to another textbox positioned on the top right of the second section, which is labeled “Unseen data validation.” A downward arrow from this leads to “Model deployment,” followed by an oval “90 percent reviews.” The first and second sections lead to a dashed rectangle of “Data integration,” followed by the text “Create a new dataset combining input variables and output variable.” A rightward arrow from the data integration leads to the third section, which is titled “(3) Model selection.” It contains two textboxes labeled “S L model fitting” and “10-fold cross validation.” The combined result from these leads to another textbox labeled “Model evaluation,” followed by another textbox labeled “Variable importance ranking and Permutation test,” positioned at the top. An upward arrow from the third section leads to the fourth section, which is labeled “(4) Non-Assertive O P R B exploration.” It contains four textboxes arranged vertically and connected by upward arrows. The labels of the textboxes from bottom to top are “2 D Partial dependence plot,” “Variable interaction strength,” “3 D Partial dependence plot,” and “Result interpretations and recommendations.” A leftward arrow from the fourth section is connected to the main textbox “Understanding Online Product Return Behavior.”

Proposed methodological framework. Source: Authors’ own creation

Figure 2
A flowchart outlining steps to analyze online product return behavior using data and model construction.At the top left, the textbox “Understanding Online Product Return Behavior” is prominently displayed. It contains four sections, and each is enclosed in dashed rectangles. A downward arrow from this textbox leads to the first section. The first section, on the left side, is labeled “(1) Data collection and input variable construction,” which starts from a textbox “Amazon dot com” as the data source. This textbox is divided into two ovals labeled “57,305 unique products” and “209,761 reviews.” The combined result from these two leads to another textbox, “Data cleaning,” which is further divided into a textbox “Topic modelling” on the left, an oval in the center that is “Price,” and an oval on the right that is “Sales rank.” A downward arrow from topic modelling leads to another box, “Information retrieval,” followed by an oval, “Product quality attributes.” A rightward arrow from this leads to another box labeled “Data merging,” which is also connected by “Price” and “Sales rank.” A rightward arrow from “Data cleaning” leads to the second section, which is titled “(2) Output variable construction.” It starts from the oval “10 percent reviews,” followed by the textbox “Human and machine labeling and validation,” and “S L and S S L model training.” An arrow from this box leads to another textbox positioned on the top right of the second section, which is labeled “Unseen data validation.” A downward arrow from this leads to “Model deployment,” followed by an oval “90 percent reviews.” The first and second sections lead to a dashed rectangle of “Data integration,” followed by the text “Create a new dataset combining input variables and output variable.” A rightward arrow from the data integration leads to the third section, which is titled “(3) Model selection.” It contains two textboxes labeled “S L model fitting” and “10-fold cross validation.” The combined result from these leads to another textbox labeled “Model evaluation,” followed by another textbox labeled “Variable importance ranking and Permutation test,” positioned at the top. An upward arrow from the third section leads to the fourth section, which is labeled “(4) Non-Assertive O P R B exploration.” It contains four textboxes arranged vertically and connected by upward arrows. The labels of the textboxes from bottom to top are “2 D Partial dependence plot,” “Variable interaction strength,” “3 D Partial dependence plot,” and “Result interpretations and recommendations.” A leftward arrow from the fourth section is connected to the main textbox “Understanding Online Product Return Behavior.”

Proposed methodological framework. Source: Authors’ own creation

Close Figure 2
Figure 3
A line graph showing coherence score trends for different numbers of topics.The horizontal axis is labeled “Numbers of Topics,” which ranges from 2 to 70 with an interval of 2. The vertical axis is labeled “Coherence score,” which ranges from 0.36 to 0.43 with an interval of 0.01. The curve in the graph presents a highly fluctuating pattern, with multiple sharp peaks and troughs as the number of topics increases. Initially, the coherence score rises steadily, but after reaching a certain point, the curve begins to exhibit significant fluctuations. It starts from (2, 0.371) and passes through peaks (12, 0.4314), (20.167, 0.429) and (34.072, 0.427), and ends at (71.116, 0.372). Note: All numerical data values are approximated.

Coherence scores tuning from 2 to 70 topics. Source: Authors’ own creation

Figure 3
A line graph showing coherence score trends for different numbers of topics.The horizontal axis is labeled “Numbers of Topics,” which ranges from 2 to 70 with an interval of 2. The vertical axis is labeled “Coherence score,” which ranges from 0.36 to 0.43 with an interval of 0.01. The curve in the graph presents a highly fluctuating pattern, with multiple sharp peaks and troughs as the number of topics increases. Initially, the coherence score rises steadily, but after reaching a certain point, the curve begins to exhibit significant fluctuations. It starts from (2, 0.371) and passes through peaks (12, 0.4314), (20.167, 0.429) and (34.072, 0.427), and ends at (71.116, 0.372). Note: All numerical data values are approximated.

Coherence scores tuning from 2 to 70 topics. Source: Authors’ own creation

Close Figure 3
Figure 4
A series of four boxplots comparing model performance metrics across various machine learning models.The illustration displays a grid of four boxplots, each showing the distribution of different performance metrics across a set of machine learning models. In each plot, the horizontal axis represents the machine learning models, which are labeled from left to right as “L R,” “S V M,” “D T,” “G B,” “R F,” “S T,” “C T 1 V,” and “C T 2 V.” These models are evaluated across four different performance metrics: “Accuracy,“ “F 1 score,” “True Positive Rate,” and “True Negative Rate.” The vertical axis represents the value of the corresponding metric for each model in that plot. In the top-left boxplot, the vertical axis is labeled “Accuracy,” which ranges from 0.8386 to 0.9186 with an interval of 0.02. Each model is represented by a vertical box, with a horizontal line inside the box indicating the median accuracy for that model. The whiskers extend from the top and bottom boxes, representing the range of accuracy values for each model. Outliers, represented by diamond-shaped markers, are located outside the whiskers. The median of the boxes ranges between 0.856 and 0.908. The outliers are present above and below the whiskers for the model S V M, an outlier is present below the bottom whisker for the model R F, and an outlier is present below the bottom whisker for the model C T 1 V. In the top-right boxplot, the vertical axis is labeled “F 1,” which ranges from 0.8359 to 0.9159 with an interval of 0.02. Each model is represented by a vertical box, with a horizontal line inside the box indicating the median accuracy for that model. The whiskers extend from the top and bottom boxes, representing the range of accuracy values for each model. Outliers, represented by diamond-shaped markers, are located outside the whiskers. The median of the boxes ranges between 0.85 and 0.904. Two outliers are present below the bottom whisker for the model L R, an outlier is present above the top whisker for the model S V M, and an outlier is present below the bottom whisker for the model R F. In the bottom-left boxplot, the vertical axis is labeled “True Positive Rate,” which ranges from 0.8496 to 0.9496 with an interval of 0.02. Each model is represented by a vertical box, with a horizontal line inside the box indicating the median accuracy for that model. The whiskers extend from the top and bottom boxes, representing the range of accuracy values for each model. Outliers, represented by diamond-shaped markers, are located outside the whiskers. The median of the boxes ranges between 0.882 and 0.937. An outlier is present above the top whisker for the model D T. In the bottom-right boxplot, the vertical axis is labeled “True Negative Rate,” which ranges from 0.7879 to 0.9279 with an interval of 0.02. Each model is represented by a vertical box, with a horizontal line inside the box indicating the median accuracy for that model. The whiskers extend from the top and bottom boxes, representing the range of accuracy values for each model. Outliers, represented by diamond-shaped markers, are located outside the whiskers. The median of the boxes ranges between 0.831 and 0.909. An outlier is present below the bottom whisker for the model D T, and the outliers are present above and below the whiskers for the model C T 2 V. Note: All numerical data values are approximated.

Accuracy, F1, True Positive Rate and True Negative Rate scores. Source: Authors’ own creation

Figure 4
A series of four boxplots comparing model performance metrics across various machine learning models.The illustration displays a grid of four boxplots, each showing the distribution of different performance metrics across a set of machine learning models. In each plot, the horizontal axis represents the machine learning models, which are labeled from left to right as “L R,” “S V M,” “D T,” “G B,” “R F,” “S T,” “C T 1 V,” and “C T 2 V.” These models are evaluated across four different performance metrics: “Accuracy,“ “F 1 score,” “True Positive Rate,” and “True Negative Rate.” The vertical axis represents the value of the corresponding metric for each model in that plot. In the top-left boxplot, the vertical axis is labeled “Accuracy,” which ranges from 0.8386 to 0.9186 with an interval of 0.02. Each model is represented by a vertical box, with a horizontal line inside the box indicating the median accuracy for that model. The whiskers extend from the top and bottom boxes, representing the range of accuracy values for each model. Outliers, represented by diamond-shaped markers, are located outside the whiskers. The median of the boxes ranges between 0.856 and 0.908. The outliers are present above and below the whiskers for the model S V M, an outlier is present below the bottom whisker for the model R F, and an outlier is present below the bottom whisker for the model C T 1 V. In the top-right boxplot, the vertical axis is labeled “F 1,” which ranges from 0.8359 to 0.9159 with an interval of 0.02. Each model is represented by a vertical box, with a horizontal line inside the box indicating the median accuracy for that model. The whiskers extend from the top and bottom boxes, representing the range of accuracy values for each model. Outliers, represented by diamond-shaped markers, are located outside the whiskers. The median of the boxes ranges between 0.85 and 0.904. Two outliers are present below the bottom whisker for the model L R, an outlier is present above the top whisker for the model S V M, and an outlier is present below the bottom whisker for the model R F. In the bottom-left boxplot, the vertical axis is labeled “True Positive Rate,” which ranges from 0.8496 to 0.9496 with an interval of 0.02. Each model is represented by a vertical box, with a horizontal line inside the box indicating the median accuracy for that model. The whiskers extend from the top and bottom boxes, representing the range of accuracy values for each model. Outliers, represented by diamond-shaped markers, are located outside the whiskers. The median of the boxes ranges between 0.882 and 0.937. An outlier is present above the top whisker for the model D T. In the bottom-right boxplot, the vertical axis is labeled “True Negative Rate,” which ranges from 0.7879 to 0.9279 with an interval of 0.02. Each model is represented by a vertical box, with a horizontal line inside the box indicating the median accuracy for that model. The whiskers extend from the top and bottom boxes, representing the range of accuracy values for each model. Outliers, represented by diamond-shaped markers, are located outside the whiskers. The median of the boxes ranges between 0.831 and 0.909. An outlier is present below the bottom whisker for the model D T, and the outliers are present above and below the whiskers for the model C T 2 V. Note: All numerical data values are approximated.

Accuracy, F1, True Positive Rate and True Negative Rate scores. Source: Authors’ own creation

Close Figure 4
Figure 5
Two horizontal bar graphs compare permutation and S H A P importance rankings, showing warranty as the most important.The two bar graphs are titled “Permutation Importance Ranking” on the left and “S H A P Importance Ranking” on the right, each showing the relative importance of various factors. In the “Permutation Importance Ranking” graph, the factors are ranked from top to bottom as follows: “Warranty,” “Product Information Mismatch,” “Durability,” “Performance,” “Selling Price,” “Sales Rank,” “Reliability,” “Secondary Features,” “Logistics Service Quality,” “Primary Features,” and “After-sales Services.” In contrast, the “S H A P Importance Ranking” graph ranks the factors in a different order: “Warranty,” “Durability,” “Product Information Mismatch,” “Performance,” “Selling Price,” “Sales Rank,” “Reliability,” “Logistics Service Quality,” “Primary Features,” “Secondary Features,” and “After-sales Services.” A rightward arrow at the bottom of both graphs is labeled “More Important.” Both graphs agree that “Warranty” is the most important factor, holding the first position in both rankings. The size of the horizontal bars increases from the bottom to the top in both graphs, but the bottom four bars in the right graph are slightly shorter than the bottom four bars in the left graph. The middle four bars are slightly longer in the right graph than in the left graph. The top three bars are the longest in both graphs.

Variable importance ranking. Source: Authors’ own creation

Figure 5
Two horizontal bar graphs compare permutation and S H A P importance rankings, showing warranty as the most important.The two bar graphs are titled “Permutation Importance Ranking” on the left and “S H A P Importance Ranking” on the right, each showing the relative importance of various factors. In the “Permutation Importance Ranking” graph, the factors are ranked from top to bottom as follows: “Warranty,” “Product Information Mismatch,” “Durability,” “Performance,” “Selling Price,” “Sales Rank,” “Reliability,” “Secondary Features,” “Logistics Service Quality,” “Primary Features,” and “After-sales Services.” In contrast, the “S H A P Importance Ranking” graph ranks the factors in a different order: “Warranty,” “Durability,” “Product Information Mismatch,” “Performance,” “Selling Price,” “Sales Rank,” “Reliability,” “Logistics Service Quality,” “Primary Features,” “Secondary Features,” and “After-sales Services.” A rightward arrow at the bottom of both graphs is labeled “More Important.” Both graphs agree that “Warranty” is the most important factor, holding the first position in both rankings. The size of the horizontal bars increases from the bottom to the top in both graphs, but the bottom four bars in the right graph are slightly shorter than the bottom four bars in the left graph. The middle four bars are slightly longer in the right graph than in the left graph. The top three bars are the longest in both graphs.

Variable importance ranking. Source: Authors’ own creation

Close Figure 5
Figure 6
A set of seven histograms showing A U C scores for various factors, with p-values marked.The first plot is labeled “p-value less than or equal to 0.01.” The horizontal axis is labeled “A U C score of Warranty,” which ranges from 0.500 to 0.570 with an interval of 0.01. The vertical axis is labeled “Probability density,” which ranges from 0 to 30 with an interval of 5. The histogram shows a high concentration of values at 0.500, with a sharp decline as the A U C score moves away from 0.500. Most data points are concentrated on the lower end of the scale. A vertical dashed line is plotted just after 0.570 on the horizontal axis. The second plot is labeled “p-value less than or equal to 0.01.” The horizontal axis is labeled “A U C score of Durability,” which ranges from 0.500 to 0.560 with an interval of 0.01. The vertical axis is labeled “Probability density,” which ranges from 0 to 20 with an interval of 5. Similar to the first plot, the distribution peaks at 0.500, with a noticeable drop in frequency as the A U C score increases. It has a comparatively thicker peak than the first plot. A vertical dashed line is plotted just after 0.560 on the horizontal axis. The third plot is labeled “p-value less than or equal to 0.01.” The horizontal axis is labeled “A U C score of Product Information Mismatch,” which ranges from 0.500 to 0.540 with an interval of 0.01. The vertical axis is labeled “Probability density,” which ranges from 0 to 20 with an interval of 5. The histogram shows a concentration of values at 0.500, similar to the second plot, but has a thicker section around the peak. A vertical dashed line is plotted just before 0.540 on the horizontal axis. The fourth plot is labeled “p-value less than or equal to 0.01.” The horizontal axis is labeled “A U C score of Performance,” which ranges from 0.500 to 0.550 with an interval of 0.01. The vertical axis is labeled “Probability density,” which ranges from 0 to 25 with an interval of 5. The histogram shows a peak at 0.500, which is very similar to the first plot but has a slightly thicker section around the bottom of the peak. A vertical dashed line is plotted around 0.555 on the horizontal axis. The fifth plot is labeled “p-value less than or equal to 0.01.” The horizontal axis is labeled “A U C score of Selling Price,” which ranges from 0.500 to 0.520 with an interval of 0.005. The vertical axis is labeled “Probability density,” which ranges from 0 to 18 with an interval of 2. This histogram shows a similar distribution pattern to the previous ones, with the majority of values concentrated at 0.500, but it has a comparatively thicker section that has the highest peaks. A vertical dashed line is plotted around 0.522 on the horizontal axis. The sixth plot is labeled “p-value less than or equal to 0.01.” The horizontal axis is labeled “A U C score of Sales Rank,” which ranges from 0.500 to 0.520 with an interval of 0.005. The vertical axis is labeled “Probability density,” which ranges from 0 to 20 with an interval of 5. The histogram shows a peak at 0.500 with a gradual drop-off as the A U C score increases, but it is slightly thinner than the fifth plot. A vertical dashed line is plotted just after 0.520 on the horizontal axis. The seventh plot is labeled “p-value less than or equal to 0.01.” The horizontal axis is labeled “A U C score of Reliability,” which ranges from 0.500 to 0.560 with an interval of 0.01. The vertical axis is labeled “Probability density,” which ranges from 0 to 16 with an interval of 2. The histogram shows a concentration of values at 0.500, with a decreasing frequency as the A U C score increases, but it is thinner than the sixth plot. A dashed vertical line is plotted around 0.557 on the horizontal axis.

Permutation test scores. Source: Authors’ own creation

Figure 6
A set of seven histograms showing A U C scores for various factors, with p-values marked.The first plot is labeled “p-value less than or equal to 0.01.” The horizontal axis is labeled “A U C score of Warranty,” which ranges from 0.500 to 0.570 with an interval of 0.01. The vertical axis is labeled “Probability density,” which ranges from 0 to 30 with an interval of 5. The histogram shows a high concentration of values at 0.500, with a sharp decline as the A U C score moves away from 0.500. Most data points are concentrated on the lower end of the scale. A vertical dashed line is plotted just after 0.570 on the horizontal axis. The second plot is labeled “p-value less than or equal to 0.01.” The horizontal axis is labeled “A U C score of Durability,” which ranges from 0.500 to 0.560 with an interval of 0.01. The vertical axis is labeled “Probability density,” which ranges from 0 to 20 with an interval of 5. Similar to the first plot, the distribution peaks at 0.500, with a noticeable drop in frequency as the A U C score increases. It has a comparatively thicker peak than the first plot. A vertical dashed line is plotted just after 0.560 on the horizontal axis. The third plot is labeled “p-value less than or equal to 0.01.” The horizontal axis is labeled “A U C score of Product Information Mismatch,” which ranges from 0.500 to 0.540 with an interval of 0.01. The vertical axis is labeled “Probability density,” which ranges from 0 to 20 with an interval of 5. The histogram shows a concentration of values at 0.500, similar to the second plot, but has a thicker section around the peak. A vertical dashed line is plotted just before 0.540 on the horizontal axis. The fourth plot is labeled “p-value less than or equal to 0.01.” The horizontal axis is labeled “A U C score of Performance,” which ranges from 0.500 to 0.550 with an interval of 0.01. The vertical axis is labeled “Probability density,” which ranges from 0 to 25 with an interval of 5. The histogram shows a peak at 0.500, which is very similar to the first plot but has a slightly thicker section around the bottom of the peak. A vertical dashed line is plotted around 0.555 on the horizontal axis. The fifth plot is labeled “p-value less than or equal to 0.01.” The horizontal axis is labeled “A U C score of Selling Price,” which ranges from 0.500 to 0.520 with an interval of 0.005. The vertical axis is labeled “Probability density,” which ranges from 0 to 18 with an interval of 2. This histogram shows a similar distribution pattern to the previous ones, with the majority of values concentrated at 0.500, but it has a comparatively thicker section that has the highest peaks. A vertical dashed line is plotted around 0.522 on the horizontal axis. The sixth plot is labeled “p-value less than or equal to 0.01.” The horizontal axis is labeled “A U C score of Sales Rank,” which ranges from 0.500 to 0.520 with an interval of 0.005. The vertical axis is labeled “Probability density,” which ranges from 0 to 20 with an interval of 5. The histogram shows a peak at 0.500 with a gradual drop-off as the A U C score increases, but it is slightly thinner than the fifth plot. A vertical dashed line is plotted just after 0.520 on the horizontal axis. The seventh plot is labeled “p-value less than or equal to 0.01.” The horizontal axis is labeled “A U C score of Reliability,” which ranges from 0.500 to 0.560 with an interval of 0.01. The vertical axis is labeled “Probability density,” which ranges from 0 to 16 with an interval of 2. The histogram shows a concentration of values at 0.500, with a decreasing frequency as the A U C score increases, but it is thinner than the sixth plot. A dashed vertical line is plotted around 0.557 on the horizontal axis.

Permutation test scores. Source: Authors’ own creation

Close Figure 6
Figure 7
A six-panel figure comparing performance and durability interactions using plots and heatmaps.The figure consists of six panels, examining the interaction strengths of product attributes related to performance and durability through line plots and heatmaps. Panel (a): The line plot visualizes the relationship between performance, labeled on the horizontal axis, ranging from 0.10 to 0.70 with an interval of 0.10, and probability on the vertical axis, from negative 0.10 to 0.20 with an interval of 0.05. The plot features multiple thin gray lines, each representing individual models or data traces of how probability varies with performance. These lines show variability across the entire horizontal axis range. A prominent yellow dashed line, labeled “average” in the legend at the top right, represents the mean trend of the gray traces. This line starts near zero probability at (0.07, 0) and shows a gentle upward trend, particularly from performance values around 0.30 onward, indicating that higher performance values are associated with a slight increase in probability, which ends at (0.724, 0.056). The thin lines are present above and below the dashed yellow line in the same pattern. Panel (b): A horizontal bar chart ranking performance interaction strengths with product attributes. This chart is titled “Interaction Strength–Performance.” The labels in the chart, listed from top to bottom, are “Performance underscore Selling Price,” “Performance underscore Durability,” “Performance underscore Logistics Service Quality,” “Performance underscore Sales Rank,” “Performance underscore Secondary Features,” “Performance underscore Warranty,” “Performance underscore Reliability,” “Performance underscore Product Information Mismatch,” “Performance underscore After-sales Services,” and “Performance underscore Primary Features.” A rightward arrow at the bottom of the graph is labeled “More Interactive.” In terms of interaction strength, “Performance underscore Selling Price” shows the strongest interaction, followed by “Performance underscore Durability.” The size of bars decreases from top to bottom, and the bar for the factor “Performance underscores primary features” is the shortest. Panel (c): A heatmap of interaction values between performance and selling price with blue-to-green shading. “Performance” is labeled on the horizontal axis, and “Selling Price” is labeled on the vertical axis, where each cell is numerically labeled and color-coded to represent the level of interaction. The horizontal axis values from left to right are 0.07, 0.13, 0.20, 0.27, 0.37, 0.49, and 0.73, and the vertical axis values from bottom to top are 2, 2.81, 5.14, 7.22, 9.95, 14.06, 22.17, 42.02, 71.17, and 125.79. At the lowest “Selling Price” of 2, the interaction values across increasing “Performance” levels are negative 0.020, negative 0.021, negative 0.021, 0.003, 0.006, 0.007, and 0.026. At 2.81, the values are reading negative 0.020, negative 0.021, negative 0.021, 0.004, 0.007, 0.008, and 0.027. At 5.14, the values are negative 0.032, negative 0.033, negative 0.032, negative 0.007, negative 0.001, negative 0.000, and 0.028. At 7.22, the values are negative 0.032, negative 0.033, negative 0.032, negative 0.007, negative 0.001, 0.000, and 0.031. At 9.95, the values are negative 0.031, negative 0.032, negative 0.032, negative 0.007, negative 0.001, 0.000, and 0.032. At 14.06, the values are negative 0.023, negative 0.024, negative 0.024, negative 0.001, 0.003, 0.005, and 0.038. At 22.17, the values are negative 0.010, negative 0.011, negative 0.011, 0.006, 0.009, 0.010, and 0.044. At 42.02, the values are negative 0.007, negative 0.007, negative 0.007, 0.009, 0.013, 0.014, and 0.046. At 71.17, the values are negative 0.003, negative 0.003, negative 0.003, 0.012, 0.014, 0.015, and 0.048. At 125.19, the values are 0.001, negative 0.000, 0.000, 0.015, 0.018, 0.020, and 0.052. Color shading ranges from dark blue for the highest positive interaction values to pale green or yellow for the most negative values. Panel (d): The line plot visualizes the relationship between durability, labeled on the horizontal axis, ranging from 0.10 to 0.80 with an interval of 0.10, and probability on the vertical axis, from negative 0.15 to 0.15 with an interval of 0.05. The plot features multiple thin gray lines, each representing individual models or data traces of how probability varies with durability. These lines show variability across the entire horizontal axis range. A prominent yellow dashed line, labeled “average” in the legend at the top right, represents the mean trend of the gray traces. This line starts near zero probability at (0.081, 0) and shows a gentle downward trend, particularly from durability values around 0.30 onward, indicating that higher durability values are associated with a slight decrease in probability, which ends at (0.80, negative 0.017). The thin lines are present above and below the dashed yellow line in the same pattern. Panel (e): A horizontal bar chart showing how durability interacts with product features, ranked by interaction strength. This horizontal bar chart is titled “Interaction Strength – Durability.” The chart displays the labels, from top to bottom, as “Durability underscore Secondary Features,” “Durability underscore Selling Price,” “Durability underscore Performance,” “Durability underscore Logistics Service Quality,” “Durability underscore Primary Features,” “Durability underscore Sales Rank,” “Durability underscore Reliability,” “Durability underscore After-sales Services,” “Durability underscore Product Information Mismatch,” and “Durability underscore Warranty.” A rightward arrow at the bottom of the graph is labeled “More Interactive.” The strongest interaction is between “Durability underscore Secondary Features,” followed closely by “Durability underscore Selling Price” and “Durability underscore Performance,” suggesting these features most heavily influence or are influenced by durability. The size of bars decreases from top to bottom, and the bar for the factor “Durability underscore Warranty” is the shortest. Panel (f): A heatmap of interaction values between durability and secondary features, labeled by numeric cell values. This heatmap shows the interaction strengths between “Durability,” labeled on the horizontal axis, and “Secondary Features,” labeled on the vertical axis, with each cell displaying a numeric value and a color gradient indicating interaction intensity. The horizontal axis has durability values: 0.08, 0.15, 0.23, 0.32, 0.44, and 0.66, arranged from left to right. The vertical axis has secondary feature values: 0.06, 0.09, 0.14, 0.20, 0.31, and 0.56, arranged from bottom to top. Each cell contains a value representing the interaction strength between a given pair of durability and secondary feature values: Row for Secondary Features 0.06: 0.013, 0.013, 0.007, negative 0.000, negative 0.003, negative 0.005. Row for 0.09: 0.004, 0.004, negative 0.002, negative 0.009, negative 0.012, negative 0.016. Row for 0.14: 0.005, 0.005, negative 0.001, negative 0.009, negative 0.011, negative 0.006. Row for 0.20: 0.009, 0.008, 0.002, negative 0.005, negative 0.008, negative 0.020. Row for 0.31: 0.010, 0.010, 0.004, negative 0.003, negative 0.006, negative 0.021. Row for 0.56: 0.011, 0.018, 0.011, 0.004, 0.007, negative 0.008. Color shading ranges from dark blue for the highest positive interaction values to pale green or yellow for the most negative values. Note: All numerical data values are approximated.

PDP, ICEs and interaction strength of performance and durability. Source: Authors’ own creation

Figure 7
A six-panel figure comparing performance and durability interactions using plots and heatmaps.The figure consists of six panels, examining the interaction strengths of product attributes related to performance and durability through line plots and heatmaps. Panel (a): The line plot visualizes the relationship between performance, labeled on the horizontal axis, ranging from 0.10 to 0.70 with an interval of 0.10, and probability on the vertical axis, from negative 0.10 to 0.20 with an interval of 0.05. The plot features multiple thin gray lines, each representing individual models or data traces of how probability varies with performance. These lines show variability across the entire horizontal axis range. A prominent yellow dashed line, labeled “average” in the legend at the top right, represents the mean trend of the gray traces. This line starts near zero probability at (0.07, 0) and shows a gentle upward trend, particularly from performance values around 0.30 onward, indicating that higher performance values are associated with a slight increase in probability, which ends at (0.724, 0.056). The thin lines are present above and below the dashed yellow line in the same pattern. Panel (b): A horizontal bar chart ranking performance interaction strengths with product attributes. This chart is titled “Interaction Strength–Performance.” The labels in the chart, listed from top to bottom, are “Performance underscore Selling Price,” “Performance underscore Durability,” “Performance underscore Logistics Service Quality,” “Performance underscore Sales Rank,” “Performance underscore Secondary Features,” “Performance underscore Warranty,” “Performance underscore Reliability,” “Performance underscore Product Information Mismatch,” “Performance underscore After-sales Services,” and “Performance underscore Primary Features.” A rightward arrow at the bottom of the graph is labeled “More Interactive.” In terms of interaction strength, “Performance underscore Selling Price” shows the strongest interaction, followed by “Performance underscore Durability.” The size of bars decreases from top to bottom, and the bar for the factor “Performance underscores primary features” is the shortest. Panel (c): A heatmap of interaction values between performance and selling price with blue-to-green shading. “Performance” is labeled on the horizontal axis, and “Selling Price” is labeled on the vertical axis, where each cell is numerically labeled and color-coded to represent the level of interaction. The horizontal axis values from left to right are 0.07, 0.13, 0.20, 0.27, 0.37, 0.49, and 0.73, and the vertical axis values from bottom to top are 2, 2.81, 5.14, 7.22, 9.95, 14.06, 22.17, 42.02, 71.17, and 125.79. At the lowest “Selling Price” of 2, the interaction values across increasing “Performance” levels are negative 0.020, negative 0.021, negative 0.021, 0.003, 0.006, 0.007, and 0.026. At 2.81, the values are reading negative 0.020, negative 0.021, negative 0.021, 0.004, 0.007, 0.008, and 0.027. At 5.14, the values are negative 0.032, negative 0.033, negative 0.032, negative 0.007, negative 0.001, negative 0.000, and 0.028. At 7.22, the values are negative 0.032, negative 0.033, negative 0.032, negative 0.007, negative 0.001, 0.000, and 0.031. At 9.95, the values are negative 0.031, negative 0.032, negative 0.032, negative 0.007, negative 0.001, 0.000, and 0.032. At 14.06, the values are negative 0.023, negative 0.024, negative 0.024, negative 0.001, 0.003, 0.005, and 0.038. At 22.17, the values are negative 0.010, negative 0.011, negative 0.011, 0.006, 0.009, 0.010, and 0.044. At 42.02, the values are negative 0.007, negative 0.007, negative 0.007, 0.009, 0.013, 0.014, and 0.046. At 71.17, the values are negative 0.003, negative 0.003, negative 0.003, 0.012, 0.014, 0.015, and 0.048. At 125.19, the values are 0.001, negative 0.000, 0.000, 0.015, 0.018, 0.020, and 0.052. Color shading ranges from dark blue for the highest positive interaction values to pale green or yellow for the most negative values. Panel (d): The line plot visualizes the relationship between durability, labeled on the horizontal axis, ranging from 0.10 to 0.80 with an interval of 0.10, and probability on the vertical axis, from negative 0.15 to 0.15 with an interval of 0.05. The plot features multiple thin gray lines, each representing individual models or data traces of how probability varies with durability. These lines show variability across the entire horizontal axis range. A prominent yellow dashed line, labeled “average” in the legend at the top right, represents the mean trend of the gray traces. This line starts near zero probability at (0.081, 0) and shows a gentle downward trend, particularly from durability values around 0.30 onward, indicating that higher durability values are associated with a slight decrease in probability, which ends at (0.80, negative 0.017). The thin lines are present above and below the dashed yellow line in the same pattern. Panel (e): A horizontal bar chart showing how durability interacts with product features, ranked by interaction strength. This horizontal bar chart is titled “Interaction Strength – Durability.” The chart displays the labels, from top to bottom, as “Durability underscore Secondary Features,” “Durability underscore Selling Price,” “Durability underscore Performance,” “Durability underscore Logistics Service Quality,” “Durability underscore Primary Features,” “Durability underscore Sales Rank,” “Durability underscore Reliability,” “Durability underscore After-sales Services,” “Durability underscore Product Information Mismatch,” and “Durability underscore Warranty.” A rightward arrow at the bottom of the graph is labeled “More Interactive.” The strongest interaction is between “Durability underscore Secondary Features,” followed closely by “Durability underscore Selling Price” and “Durability underscore Performance,” suggesting these features most heavily influence or are influenced by durability. The size of bars decreases from top to bottom, and the bar for the factor “Durability underscore Warranty” is the shortest. Panel (f): A heatmap of interaction values between durability and secondary features, labeled by numeric cell values. This heatmap shows the interaction strengths between “Durability,” labeled on the horizontal axis, and “Secondary Features,” labeled on the vertical axis, with each cell displaying a numeric value and a color gradient indicating interaction intensity. The horizontal axis has durability values: 0.08, 0.15, 0.23, 0.32, 0.44, and 0.66, arranged from left to right. The vertical axis has secondary feature values: 0.06, 0.09, 0.14, 0.20, 0.31, and 0.56, arranged from bottom to top. Each cell contains a value representing the interaction strength between a given pair of durability and secondary feature values: Row for Secondary Features 0.06: 0.013, 0.013, 0.007, negative 0.000, negative 0.003, negative 0.005. Row for 0.09: 0.004, 0.004, negative 0.002, negative 0.009, negative 0.012, negative 0.016. Row for 0.14: 0.005, 0.005, negative 0.001, negative 0.009, negative 0.011, negative 0.006. Row for 0.20: 0.009, 0.008, 0.002, negative 0.005, negative 0.008, negative 0.020. Row for 0.31: 0.010, 0.010, 0.004, negative 0.003, negative 0.006, negative 0.021. Row for 0.56: 0.011, 0.018, 0.011, 0.004, 0.007, negative 0.008. Color shading ranges from dark blue for the highest positive interaction values to pale green or yellow for the most negative values. Note: All numerical data values are approximated.

PDP, ICEs and interaction strength of performance and durability. Source: Authors’ own creation

Close Figure 7
Figure 8
A three-panel figure showing reliability's effect on probability, interaction strengths, and heatmap values.The figure consists of three panels, examining the interaction strengths of product attributes related to performance and reliability through line plots and heatmaps. Panel (a): The line plot visualizes the relationship between reliability, labeled on the horizontal axis, ranging from 0.05 to 0.40 with an interval of 0.05, and probability on the vertical axis, from negative 0.10 to 0.20 with an interval of 0.05. The plot features multiple thin gray lines, each representing individual models or data traces of how probability varies with reliability. These lines show variability across the entire horizontal axis range. A prominent yellow dashed line, labeled “average” in the legend at the top right, represents the mean trend of the gray traces. This line starts near zero probability at (0.06, 1) and shows a gentle upward trend, particularly from reliability values around 0.15 onward, indicating that higher reliability values are associated with a slight increase in probability, which ends at (0.395, 0.032). The thin lines are present above and below the dashed yellow line in the same pattern. Panel (b): A horizontal bar chart ranking reliability’s interaction strength with product features, led by after-sales services. This horizontal bar chart is titled “Interaction Strength – Reliability.” The chart lists the following labels from top to bottom: “Reliability underscore After-sales Services,” “Reliability underscore Selling Price,” “Reliability underscore Sales Rank,” “Reliability underscore Warranty,” “Reliability underscore Logistics Service Quality,” “Reliability underscore Durability,” “Reliability underscore Performance,” “Reliability underscore Secondary Features,” “Reliability underscore Primary Features,” and “Reliability underscore Product Information Mismatch.” A rightward arrow at the bottom of the graph is labeled “More Interactive.” The longest bar at the top corresponds to “Reliability underscore After-sales Services,” indicating the highest interaction. Next in strength are “Reliability underscore Selling Price,” “Reliability underscore Sales Rank,” and “Reliability underscore Warranty.” The size of bars decreases from top to bottom, and the bar for the factor “Reliability underscores Product Information Mismatch” is the shortest. Panel (c): A heatmap of interaction values between reliability and after-sales services with labeled cells. This heatmap visualizes interaction strengths between “Reliability,” labeled on the horizontal axis, and “After-sales Services,” labeled on the vertical axis. The horizontal axis contains reliability values: 0.06, 0.10, 0.13, 0.18, 0.24, and 0.4. The vertical axis shows after-sales services values, from bottom to top: 0.00, 0.00, 0.00, 0.01, 0.12, and 0.35. Each cell contains a numeric value representing the strength of interaction for the corresponding value pair. Listed row by row (from bottom to top), the values are Row for After-sales Services 0.00: negative 0.011, negative 0.011, negative 0.012, negative 0.001, negative 0.001, 0.020. Row for 0.00: negative 0.007, negative 0.007, negative 0.007, 0.003, 0.003, 0.024. Row for 0.00: negative 0.007, negative 0.007, negative 0.007, 0.003, 0.003, 0.024. Row for 0.01: negative 0.006, negative 0.006, negative 0.006, 0.003, 0.003, 0.023. Row for 0.12: negative 0.011, negative 0.011, negative 0.011, negative 0.002, negative 0.002, 0.019. Row for 0.35: negative 0.009, negative 0.009, negative 0.009, 0.001, 0.000, 0.031. Color shading ranges from dark blue for the highest positive interaction values to pale green or yellow for the most negative values. Note: All numerical data values are approximated.

PDP, ICEs and interaction strength of reliability. Source: Authors’ own creation

Figure 8
A three-panel figure showing reliability's effect on probability, interaction strengths, and heatmap values.The figure consists of three panels, examining the interaction strengths of product attributes related to performance and reliability through line plots and heatmaps. Panel (a): The line plot visualizes the relationship between reliability, labeled on the horizontal axis, ranging from 0.05 to 0.40 with an interval of 0.05, and probability on the vertical axis, from negative 0.10 to 0.20 with an interval of 0.05. The plot features multiple thin gray lines, each representing individual models or data traces of how probability varies with reliability. These lines show variability across the entire horizontal axis range. A prominent yellow dashed line, labeled “average” in the legend at the top right, represents the mean trend of the gray traces. This line starts near zero probability at (0.06, 1) and shows a gentle upward trend, particularly from reliability values around 0.15 onward, indicating that higher reliability values are associated with a slight increase in probability, which ends at (0.395, 0.032). The thin lines are present above and below the dashed yellow line in the same pattern. Panel (b): A horizontal bar chart ranking reliability’s interaction strength with product features, led by after-sales services. This horizontal bar chart is titled “Interaction Strength – Reliability.” The chart lists the following labels from top to bottom: “Reliability underscore After-sales Services,” “Reliability underscore Selling Price,” “Reliability underscore Sales Rank,” “Reliability underscore Warranty,” “Reliability underscore Logistics Service Quality,” “Reliability underscore Durability,” “Reliability underscore Performance,” “Reliability underscore Secondary Features,” “Reliability underscore Primary Features,” and “Reliability underscore Product Information Mismatch.” A rightward arrow at the bottom of the graph is labeled “More Interactive.” The longest bar at the top corresponds to “Reliability underscore After-sales Services,” indicating the highest interaction. Next in strength are “Reliability underscore Selling Price,” “Reliability underscore Sales Rank,” and “Reliability underscore Warranty.” The size of bars decreases from top to bottom, and the bar for the factor “Reliability underscores Product Information Mismatch” is the shortest. Panel (c): A heatmap of interaction values between reliability and after-sales services with labeled cells. This heatmap visualizes interaction strengths between “Reliability,” labeled on the horizontal axis, and “After-sales Services,” labeled on the vertical axis. The horizontal axis contains reliability values: 0.06, 0.10, 0.13, 0.18, 0.24, and 0.4. The vertical axis shows after-sales services values, from bottom to top: 0.00, 0.00, 0.00, 0.01, 0.12, and 0.35. Each cell contains a numeric value representing the strength of interaction for the corresponding value pair. Listed row by row (from bottom to top), the values are Row for After-sales Services 0.00: negative 0.011, negative 0.011, negative 0.012, negative 0.001, negative 0.001, 0.020. Row for 0.00: negative 0.007, negative 0.007, negative 0.007, 0.003, 0.003, 0.024. Row for 0.00: negative 0.007, negative 0.007, negative 0.007, 0.003, 0.003, 0.024. Row for 0.01: negative 0.006, negative 0.006, negative 0.006, 0.003, 0.003, 0.023. Row for 0.12: negative 0.011, negative 0.011, negative 0.011, negative 0.002, negative 0.002, 0.019. Row for 0.35: negative 0.009, negative 0.009, negative 0.009, 0.001, 0.000, 0.031. Color shading ranges from dark blue for the highest positive interaction values to pale green or yellow for the most negative values. Note: All numerical data values are approximated.

PDP, ICEs and interaction strength of reliability. Source: Authors’ own creation

Close Figure 8
Figure 9
A six-panel figure on product info mismatch and warranty interactions using plots, bar charts, and heatmaps.The figure consists of six panels, examining the interaction strengths of product attributes related to product information and warranty through line plots and heatmaps. Panel (a): The line plot visualizes the relationship between product information mismatch, labeled on the horizontal axis, ranging from 0.10 to 0.80 with an interval of 0.10, and probability on the vertical axis, from negative 0.30 to 0.10 with an interval of 0.05. The plot features multiple thin gray lines, each representing individual models or data traces of how probability varies with product information mismatch. These lines show variability across the entire horizontal axis range. A prominent yellow dashed line, labeled “average” in the legend at the top right, represents the mean trend of the gray traces. This line starts near zero probability at (0.072, 0) and shows a gentle downward trend, particularly from product information mismatch values around 0.20 onward, indicating that higher product information mismatch values are associated with a slight decrease in probability, which ends at (0.814, negative 0.088). The thin lines are present above and below the dashed yellow line in the same pattern. Panel (b): A bar chart ranking product information mismatch interactions, led by selling price and sales rank. This horizontal bar chart is titled “Interaction Strength – Product Information Mismatch.” The bars are sorted from top to bottom in descending order of interaction strength. The attribute labels, in order from top to bottom, are “Product Information Mismatch underscore Selling Price,” “Product Information Mismatch underscore Sales Rank,” “Product Information Mismatch underscore Logistics Service Quality,” “Product Information Mismatch underscore Performance,” “Product Information Mismatch underscore Warranty,” “Product Information Mismatch underscore Durability,” “Product Information Mismatch underscore Primary Features,” “Product Information Mismatch underscore After-sales Services,” “Product Information Mismatch underscore Reliability,” and “Product Information Mismatch underscore Secondary Features.” A rightward arrow at the bottom of the graph is labeled “More Interactive.” The longest bar at the top represents “Selling Price,” indicating it has the strongest interaction with Product Information Mismatch. It is followed by “Sales Rank,” “Logistics Service Quality,” and “Performance,” all showing moderate to strong interaction. Mid-tier interactions include “Warranty,” “Durability,” and “Primary Features.” The shortest bars, showing the weakest interactions, are associated with “Reliability” and “Secondary Features.” The size of the bars decreases from top to bottom. Panel (c): A heatmap showing interaction values between product information mismatch and selling price, with labeled cells. This heatmap shows the interaction strengths between “Product Information Mismatch,” labeled on the horizontal axis, and “Selling Price,” labeled on the vertical axis. The horizontal axis includes mismatch values: 0.07, 0.13, 0.18, 0.25, 0.33, 0.43, 0.58, and 0.82. The vertical axis contains selling price levels from bottom to top: 2, 3.57, 5.8, 7.89, 9.99, 14.23, 19.99, 37.49, 66.64, and 117.74. Each cell contains a numeric interaction value, with colors ranging from dark blue (highest positive) to light yellow-green (most negative). From top to bottom, each row (Selling Price) contains the following values: For 117.74: 0.067, 0.056, 0.044, 0.036, 0.038, 0.014, 0.003, negative 0.003. For 66.64: 0.057, 0.045, 0.033, 0.024, 0.026, 0.004, negative 0.007, negative 0.013. For 37.49: 0.057, 0.046, 0.033, 0.025, 0.027, 0.005, negative 0.006, negative 0.016. For 19.99: 0.050, 0.033, 0.020, 0.007, 0.007, negative 0.013, negative 0.019, negative 0.036. For 14.23: 0.038, 0.022, 0.009, negative 0.005, negative 0.005, negative 0.034, negative 0.045, negative 0.062. For 9.99: 0.028, 0.011, negative 0.002, negative 0.016, negative 0.017, negative 0.047, negative 0.059, negative 0.079. For 7.89: 0.028, 0.011, negative 0.002, negative 0.016, negative 0.016, negative 0.047, negative 0.059, negative 0.078. For 5.8: 0.027, 0.013, negative 0.000, negative 0.019, negative 0.019, negative 0.049, negative 0.062, negative 0.080. For 3.57: 0.045, 0.031, 0.021, 0.007, 0.007, negative 0.027, negative 0.039, negative 0.056. For 2: 0.046, 0.032, 0.022, 0.009, 0.008, negative 0.026, negative 0.039, negative 0.053. Panel (d): A line plot of probability versus warranty with gray traces and a rising yellow dashed average line. This line plot shows the relationship between “Warranty,” labeled on the horizontal axis, and “Probability,” labeled on the vertical axis. The horizontal axis ranges from 0.10 to 0.50 with an interval of 0.10, while the vertical axis spans from negative 0.10 to 0.25 with an interval of 0.05. Multiple thin gray lines represent individual product data traces, capturing variation in how probability responds to warranty levels. These lines show variability across the entire horizontal axis range. Superimposed on these traces is a prominent yellow dashed line labeled “average” in the legend at the top-right corner. This line starts near zero probability at (0.062, 0) and shows a gentle upward trend, particularly from performance values around 0.15 onward, indicating that higher warranty values are associated with a slight increase in probability, which ends at (0.531, 0.109). The thin lines are present above and below the dashed yellow line in the same pattern. Panel (e): A horizontal bar chart ranking warranty’s interaction strengths with product features, led by reliability. This horizontal bar chart, titled “Interaction Strength—Warranty,” displays how strongly the attribute “Warranty” interacts with various product features. The bars extend from left to right, and a rightward-pointing arrow indicates increasing interaction strength, which is labeled “More Interactive.” The feature labels listed from top to bottom are “Warranty underscore Reliability,” “Warranty underscore Performance,” “Warranty underscore Sales Rank,” “Warranty underscore Secondary Features,” “Warranty underscore Product Information Mismatch,” “Warranty underscore Selling Price,” “Warranty underscore Durability,” “Warranty underscore After-sales Services,” “Warranty underscore Primary Features,” and “Warranty underscore Logistics Service Quality.” The longest bar at the top represents “Warranty underscore Reliability,” indicating it has the strongest interaction with warranty. It is followed by “Warranty underscore Performance” and “Warranty underscore Sales Rank,” which also show relatively high interaction levels. Mid-range interactions are observed with “Secondary Features,” “Product Information Mismatch,” and “Selling Price.” The shortest bars, indicating the weakest interactions, belong to “After-sales Services,” “Primary Features,” and “Logistics Service Quality.” The size of the bars decreases from top to bottom. Panel (f): A heatmap showing interaction values between warranty and reliability, with numeric cells and a blue-green gradient. This heatmap visualizes the interaction strengths between “Warranty,” labeled on the horizontal axis, and “Reliability,” labeled on the vertical axis. A color gradient ranging from light green (negative values) to dark blue (positive values). The horizontal axis has warranty values: 0.07, 0.11, 0.17, 0.23, 0.32, and 0.53, while the vertical axis includes reliability levels: 0.00, 0.00, 0.00, 0.01, 0.11, and 0.27 (bottom to top). Each cell contains a numeric interaction strength value arranged from bottom to top as follows. For 0.00: negative 0.053, negative 0.047, negative 0.026, negative 0.014, 0.006, 0.053. For 0.00: negative 0.050, negative 0.041, negative 0.023, negative 0.010, 0.010, 0.055. For 0.00: negative 0.040, negative 0.031, negative 0.011, 0.001, 0.019, 0.057. For 0.01: negative 0.019, negative 0.010, 0.008, 0.021, 0.035, 0.067. For 0.11: negative 0.042, negative 0.033, negative 0.010, 0.002, 0.022, 0.058. For 0.27: negative 0.031, negative 0.021, 0.001, 0.014, 0.030, 0.056. Note: All numerical data values are approximated.

PDP, ICEs and interaction strength of product information mismatch and warranty. Source: Authors’ own creation

Figure 9
A six-panel figure on product info mismatch and warranty interactions using plots, bar charts, and heatmaps.The figure consists of six panels, examining the interaction strengths of product attributes related to product information and warranty through line plots and heatmaps. Panel (a): The line plot visualizes the relationship between product information mismatch, labeled on the horizontal axis, ranging from 0.10 to 0.80 with an interval of 0.10, and probability on the vertical axis, from negative 0.30 to 0.10 with an interval of 0.05. The plot features multiple thin gray lines, each representing individual models or data traces of how probability varies with product information mismatch. These lines show variability across the entire horizontal axis range. A prominent yellow dashed line, labeled “average” in the legend at the top right, represents the mean trend of the gray traces. This line starts near zero probability at (0.072, 0) and shows a gentle downward trend, particularly from product information mismatch values around 0.20 onward, indicating that higher product information mismatch values are associated with a slight decrease in probability, which ends at (0.814, negative 0.088). The thin lines are present above and below the dashed yellow line in the same pattern. Panel (b): A bar chart ranking product information mismatch interactions, led by selling price and sales rank. This horizontal bar chart is titled “Interaction Strength – Product Information Mismatch.” The bars are sorted from top to bottom in descending order of interaction strength. The attribute labels, in order from top to bottom, are “Product Information Mismatch underscore Selling Price,” “Product Information Mismatch underscore Sales Rank,” “Product Information Mismatch underscore Logistics Service Quality,” “Product Information Mismatch underscore Performance,” “Product Information Mismatch underscore Warranty,” “Product Information Mismatch underscore Durability,” “Product Information Mismatch underscore Primary Features,” “Product Information Mismatch underscore After-sales Services,” “Product Information Mismatch underscore Reliability,” and “Product Information Mismatch underscore Secondary Features.” A rightward arrow at the bottom of the graph is labeled “More Interactive.” The longest bar at the top represents “Selling Price,” indicating it has the strongest interaction with Product Information Mismatch. It is followed by “Sales Rank,” “Logistics Service Quality,” and “Performance,” all showing moderate to strong interaction. Mid-tier interactions include “Warranty,” “Durability,” and “Primary Features.” The shortest bars, showing the weakest interactions, are associated with “Reliability” and “Secondary Features.” The size of the bars decreases from top to bottom. Panel (c): A heatmap showing interaction values between product information mismatch and selling price, with labeled cells. This heatmap shows the interaction strengths between “Product Information Mismatch,” labeled on the horizontal axis, and “Selling Price,” labeled on the vertical axis. The horizontal axis includes mismatch values: 0.07, 0.13, 0.18, 0.25, 0.33, 0.43, 0.58, and 0.82. The vertical axis contains selling price levels from bottom to top: 2, 3.57, 5.8, 7.89, 9.99, 14.23, 19.99, 37.49, 66.64, and 117.74. Each cell contains a numeric interaction value, with colors ranging from dark blue (highest positive) to light yellow-green (most negative). From top to bottom, each row (Selling Price) contains the following values: For 117.74: 0.067, 0.056, 0.044, 0.036, 0.038, 0.014, 0.003, negative 0.003. For 66.64: 0.057, 0.045, 0.033, 0.024, 0.026, 0.004, negative 0.007, negative 0.013. For 37.49: 0.057, 0.046, 0.033, 0.025, 0.027, 0.005, negative 0.006, negative 0.016. For 19.99: 0.050, 0.033, 0.020, 0.007, 0.007, negative 0.013, negative 0.019, negative 0.036. For 14.23: 0.038, 0.022, 0.009, negative 0.005, negative 0.005, negative 0.034, negative 0.045, negative 0.062. For 9.99: 0.028, 0.011, negative 0.002, negative 0.016, negative 0.017, negative 0.047, negative 0.059, negative 0.079. For 7.89: 0.028, 0.011, negative 0.002, negative 0.016, negative 0.016, negative 0.047, negative 0.059, negative 0.078. For 5.8: 0.027, 0.013, negative 0.000, negative 0.019, negative 0.019, negative 0.049, negative 0.062, negative 0.080. For 3.57: 0.045, 0.031, 0.021, 0.007, 0.007, negative 0.027, negative 0.039, negative 0.056. For 2: 0.046, 0.032, 0.022, 0.009, 0.008, negative 0.026, negative 0.039, negative 0.053. Panel (d): A line plot of probability versus warranty with gray traces and a rising yellow dashed average line. This line plot shows the relationship between “Warranty,” labeled on the horizontal axis, and “Probability,” labeled on the vertical axis. The horizontal axis ranges from 0.10 to 0.50 with an interval of 0.10, while the vertical axis spans from negative 0.10 to 0.25 with an interval of 0.05. Multiple thin gray lines represent individual product data traces, capturing variation in how probability responds to warranty levels. These lines show variability across the entire horizontal axis range. Superimposed on these traces is a prominent yellow dashed line labeled “average” in the legend at the top-right corner. This line starts near zero probability at (0.062, 0) and shows a gentle upward trend, particularly from performance values around 0.15 onward, indicating that higher warranty values are associated with a slight increase in probability, which ends at (0.531, 0.109). The thin lines are present above and below the dashed yellow line in the same pattern. Panel (e): A horizontal bar chart ranking warranty’s interaction strengths with product features, led by reliability. This horizontal bar chart, titled “Interaction Strength—Warranty,” displays how strongly the attribute “Warranty” interacts with various product features. The bars extend from left to right, and a rightward-pointing arrow indicates increasing interaction strength, which is labeled “More Interactive.” The feature labels listed from top to bottom are “Warranty underscore Reliability,” “Warranty underscore Performance,” “Warranty underscore Sales Rank,” “Warranty underscore Secondary Features,” “Warranty underscore Product Information Mismatch,” “Warranty underscore Selling Price,” “Warranty underscore Durability,” “Warranty underscore After-sales Services,” “Warranty underscore Primary Features,” and “Warranty underscore Logistics Service Quality.” The longest bar at the top represents “Warranty underscore Reliability,” indicating it has the strongest interaction with warranty. It is followed by “Warranty underscore Performance” and “Warranty underscore Sales Rank,” which also show relatively high interaction levels. Mid-range interactions are observed with “Secondary Features,” “Product Information Mismatch,” and “Selling Price.” The shortest bars, indicating the weakest interactions, belong to “After-sales Services,” “Primary Features,” and “Logistics Service Quality.” The size of the bars decreases from top to bottom. Panel (f): A heatmap showing interaction values between warranty and reliability, with numeric cells and a blue-green gradient. This heatmap visualizes the interaction strengths between “Warranty,” labeled on the horizontal axis, and “Reliability,” labeled on the vertical axis. A color gradient ranging from light green (negative values) to dark blue (positive values). The horizontal axis has warranty values: 0.07, 0.11, 0.17, 0.23, 0.32, and 0.53, while the vertical axis includes reliability levels: 0.00, 0.00, 0.00, 0.01, 0.11, and 0.27 (bottom to top). Each cell contains a numeric interaction strength value arranged from bottom to top as follows. For 0.00: negative 0.053, negative 0.047, negative 0.026, negative 0.014, 0.006, 0.053. For 0.00: negative 0.050, negative 0.041, negative 0.023, negative 0.010, 0.010, 0.055. For 0.00: negative 0.040, negative 0.031, negative 0.011, 0.001, 0.019, 0.057. For 0.01: negative 0.019, negative 0.010, 0.008, 0.021, 0.035, 0.067. For 0.11: negative 0.042, negative 0.033, negative 0.010, 0.002, 0.022, 0.058. For 0.27: negative 0.031, negative 0.021, 0.001, 0.014, 0.030, 0.056. Note: All numerical data values are approximated.

PDP, ICEs and interaction strength of product information mismatch and warranty. Source: Authors’ own creation

Close Figure 9
Figure 10
A five-panel figure analyzing how selling price and sales rank affect probability and interact with product features.The figure consists of five panels examining the interaction strengths of product attributes related to product information and selling price and sales rank through line plots and heatmaps. Panel (a): The line plot shows the relationship between “Selling Price,” labeled on the horizontal axis, and “Probability,” labeled on the vertical axis. The horizontal axis ranges from 0 dollars to 120 dollars with an interval of 20 dollars, while the vertical axis spans from negative 0.15 to 0.15 with an interval of 0.05. The plot contains multiple thin gray lines, each representing the trend of individual samples or products, capturing the variability in how probability responds to price changes. Superimposed on these traces is a yellow dashed line labeled “average” in the legend at the top-right. This line represents the average probability trend across all traces. It starts from (0.015, 0), drops quickly around, and then gradually increases with a gentle trend, which ends at (1.222, 0.024). The thin lines are present above and below the dashed yellow line in the same pattern. Panel (b): The line plot illustrates the relationship between “Sales Rank,” labeled on the horizontal axis, and “Probability,” labeled on the vertical axis. The horizontal axis ranges from 2.0 to 12.0 with an interval of 2.0, while the vertical axis spans from negative 0.10 to 0.20 with an interval of 0.05. Multiple thin gray lines show individual trace lines for various samples, each depicting how probability changes with sales rank for that case. Overlaying these is a yellow dashed line labeled “average” at the top-right of the chart. This line captures the overall trend, which shows a gradual upward slope, indicating that higher sales rank values are associated with a higher probability on average. The average curve begins from (2.031, 0) and rises steadily, especially between ranks 4 and 10, which ends at (12.184, 0.044). The thin lines are present above and below the dashed yellow line in the same pattern. Panel (c): A horizontal bar chart showing sales rank interaction strengths with product features, topped by selling price and reliability. This horizontal bar chart, titled “Interaction Strength – Sales Rank,” visualizes how strongly Sales Rank interacts with other product features. The bars extend from left to right, and a rightward-pointing arrow indicates increasing interaction strength, which is labeled “More Interactive.” From top to bottom, the feature labels are “Selling Price underscore Sales Rank,” “Reliability underscore Sales Rank,” “Durability underscore Sales Rank,” “Product Information Mismatch underscore Sales Rank,” “Performance underscore Sales Rank,” “Primary Features underscore Sales Rank,” “Warranty underscore Sales Rank,” “Secondary Features underscore Sales Rank,” “Logistics Service Quality underscore Sales Rank,” and “After-sales Services underscore Sales Rank.” The longest bars at the top correspond to “Selling Price” and “Reliability,” indicating the strongest interactions with Sales Rank. “Durability,” “Product Information Mismatch,” and “Performance” follow with moderate interaction strength. Mid-range interactions are observed with “Secondary Features,” “Product Information Mismatch,” and “Selling Price.” The shortest bars, indicating the weakest interactions, belong to “After-sales Services,” “Primary Features,” and “Logistics Service Quality.” Panel (d): A heatmap of interaction values between sales rank and selling price, labeled with numeric values. This heatmap visualizes interaction strengths between “Sales Rank,” labeled on the horizontal axis, and “Selling Price,” labeled on the vertical axis. A color code using a blue-to-green gradient where darker blue indicates stronger positive interaction and lighter or green tones represent weaker or negative interaction. The horizontal axis includes Sales Rank values: 2.08, 4.93, 6.53, 8.14, 9.88, and 12.23. The vertical axis includes selling price values: 2, 5.32, 9.61, 17.51, 46.99, and 124.58, listed from bottom to top. Each cell contains a numeric interaction value: For 2: negative 0.027, negative 0.006, negative 0.001, 0.003, 0.001, 0.005. For 5.32: negative 0.045, negative 0.022, negative 0.016, negative 0.010, 0.000, 0.002. For 9.61: negative 0.045, negative 0.021, negative 0.015, negative 0.009, 0.000, 0.002. For 17.51: negative 0.024, negative 0.005, negative 0.000, 0.006, 0.016, 0.024. For 46.99: negative 0.012, 0.003, 0.009, 0.015, 0.023, 0.032. For 124.58: negative 0.002, 0.013, 0.017, 0.023, 0.032, 0.034. Panel (e): A heatmap showing interaction values between sales rank and reliability, with labeled cells and a blue-green gradient. This heatmap displays the interaction strengths between “Sales Rank,” labeled on the horizontal axis, and “Reliability,” labeled on the vertical axis. A color code using a blue-to-green gradient where darker blue indicates stronger positive interaction and lighter or green tones represent weaker or negative interaction. The horizontal axis shows Sales Rank values: 1.79, 4.76, 6.37, 7.95, 9.78, and 12.19. The vertical axis, from bottom to top, lists reliability values: 0.06, 0.10, 0.13, 0.18, 0.24, and 0.4. Each cell contains the following numeric interaction values: For 0.06: negative 0.043, negative 0.011, negative 0.007, negative 0.001, 0.004, 0.008. For 0.10: negative 0.044, negative 0.011, negative 0.007, negative 0.001, 0.004, 0.008. For 0.13: negative 0.044, negative 0.011, negative 0.007, negative 0.001, 0.004, 0.008. For 0.18: negative 0.037, negative 0.002, 0.002, 0.010, 0.016, 0.019. For 0.24: negative 0.038, negative 0.002, 0.002, 0.010, 0.016, 0.019. For 0.40: negative 0.021, 0.018, 0.022, 0.031, 0.036, 0.048. Note: All numerical data values are approximated.

PDP, ICEs and interaction strength of selling price and sales rank. Source: Authors’ own creation

Figure 10
A five-panel figure analyzing how selling price and sales rank affect probability and interact with product features.The figure consists of five panels examining the interaction strengths of product attributes related to product information and selling price and sales rank through line plots and heatmaps. Panel (a): The line plot shows the relationship between “Selling Price,” labeled on the horizontal axis, and “Probability,” labeled on the vertical axis. The horizontal axis ranges from 0 dollars to 120 dollars with an interval of 20 dollars, while the vertical axis spans from negative 0.15 to 0.15 with an interval of 0.05. The plot contains multiple thin gray lines, each representing the trend of individual samples or products, capturing the variability in how probability responds to price changes. Superimposed on these traces is a yellow dashed line labeled “average” in the legend at the top-right. This line represents the average probability trend across all traces. It starts from (0.015, 0), drops quickly around, and then gradually increases with a gentle trend, which ends at (1.222, 0.024). The thin lines are present above and below the dashed yellow line in the same pattern. Panel (b): The line plot illustrates the relationship between “Sales Rank,” labeled on the horizontal axis, and “Probability,” labeled on the vertical axis. The horizontal axis ranges from 2.0 to 12.0 with an interval of 2.0, while the vertical axis spans from negative 0.10 to 0.20 with an interval of 0.05. Multiple thin gray lines show individual trace lines for various samples, each depicting how probability changes with sales rank for that case. Overlaying these is a yellow dashed line labeled “average” at the top-right of the chart. This line captures the overall trend, which shows a gradual upward slope, indicating that higher sales rank values are associated with a higher probability on average. The average curve begins from (2.031, 0) and rises steadily, especially between ranks 4 and 10, which ends at (12.184, 0.044). The thin lines are present above and below the dashed yellow line in the same pattern. Panel (c): A horizontal bar chart showing sales rank interaction strengths with product features, topped by selling price and reliability. This horizontal bar chart, titled “Interaction Strength – Sales Rank,” visualizes how strongly Sales Rank interacts with other product features. The bars extend from left to right, and a rightward-pointing arrow indicates increasing interaction strength, which is labeled “More Interactive.” From top to bottom, the feature labels are “Selling Price underscore Sales Rank,” “Reliability underscore Sales Rank,” “Durability underscore Sales Rank,” “Product Information Mismatch underscore Sales Rank,” “Performance underscore Sales Rank,” “Primary Features underscore Sales Rank,” “Warranty underscore Sales Rank,” “Secondary Features underscore Sales Rank,” “Logistics Service Quality underscore Sales Rank,” and “After-sales Services underscore Sales Rank.” The longest bars at the top correspond to “Selling Price” and “Reliability,” indicating the strongest interactions with Sales Rank. “Durability,” “Product Information Mismatch,” and “Performance” follow with moderate interaction strength. Mid-range interactions are observed with “Secondary Features,” “Product Information Mismatch,” and “Selling Price.” The shortest bars, indicating the weakest interactions, belong to “After-sales Services,” “Primary Features,” and “Logistics Service Quality.” Panel (d): A heatmap of interaction values between sales rank and selling price, labeled with numeric values. This heatmap visualizes interaction strengths between “Sales Rank,” labeled on the horizontal axis, and “Selling Price,” labeled on the vertical axis. A color code using a blue-to-green gradient where darker blue indicates stronger positive interaction and lighter or green tones represent weaker or negative interaction. The horizontal axis includes Sales Rank values: 2.08, 4.93, 6.53, 8.14, 9.88, and 12.23. The vertical axis includes selling price values: 2, 5.32, 9.61, 17.51, 46.99, and 124.58, listed from bottom to top. Each cell contains a numeric interaction value: For 2: negative 0.027, negative 0.006, negative 0.001, 0.003, 0.001, 0.005. For 5.32: negative 0.045, negative 0.022, negative 0.016, negative 0.010, 0.000, 0.002. For 9.61: negative 0.045, negative 0.021, negative 0.015, negative 0.009, 0.000, 0.002. For 17.51: negative 0.024, negative 0.005, negative 0.000, 0.006, 0.016, 0.024. For 46.99: negative 0.012, 0.003, 0.009, 0.015, 0.023, 0.032. For 124.58: negative 0.002, 0.013, 0.017, 0.023, 0.032, 0.034. Panel (e): A heatmap showing interaction values between sales rank and reliability, with labeled cells and a blue-green gradient. This heatmap displays the interaction strengths between “Sales Rank,” labeled on the horizontal axis, and “Reliability,” labeled on the vertical axis. A color code using a blue-to-green gradient where darker blue indicates stronger positive interaction and lighter or green tones represent weaker or negative interaction. The horizontal axis shows Sales Rank values: 1.79, 4.76, 6.37, 7.95, 9.78, and 12.19. The vertical axis, from bottom to top, lists reliability values: 0.06, 0.10, 0.13, 0.18, 0.24, and 0.4. Each cell contains the following numeric interaction values: For 0.06: negative 0.043, negative 0.011, negative 0.007, negative 0.001, 0.004, 0.008. For 0.10: negative 0.044, negative 0.011, negative 0.007, negative 0.001, 0.004, 0.008. For 0.13: negative 0.044, negative 0.011, negative 0.007, negative 0.001, 0.004, 0.008. For 0.18: negative 0.037, negative 0.002, 0.002, 0.010, 0.016, 0.019. For 0.24: negative 0.038, negative 0.002, 0.002, 0.010, 0.016, 0.019. For 0.40: negative 0.021, 0.018, 0.022, 0.031, 0.036, 0.048. Note: All numerical data values are approximated.

PDP, ICEs and interaction strength of selling price and sales rank. Source: Authors’ own creation

Close Figure 10
Table 1

Related studies of OPRB and its drivers

ArticleOPRB driversUnderpinning theoriesData source and analysis modelProduct category
Extrinsic product attributesIntrinsic product attributesIndividual customer characteristics
Dong et al. (2025) *  STSurveyFashion
Abdulla et al. (2025) *  Organisational trust theory, ATSurveyRetail
Mishra and Dutta (2024) *  Supply Chain DynamicsTransactional data/MLIndustrial equipment
Panda et al. (2024) *  TPBInterviewMultiple
Martínez-López et al. (2022b) *  AT, Consumer Tolerance TheorySurveyFashion
Martínez-López et al. (2022a) *  Procedural justiceSurveyFashion
Zhang et al. (2022) *  AT, IT, Consumer Learning TheoryExperimentFashion
Gustafsson et al. (2021) *  STTransactional data/StatisticsFashion
Wallenburg et al. (2021) *  STTransactional data/StatisticsFashion
Lee and Yi (2019) *  PTSurvey/StatisticsFashion
Sahoo et al. (2018) *  ITOCR/StatisticsFashion
Gelbrich et al. (2017) *  Operant ConditioningInterviewFashion
Walsh et al. (2016) *  ST, CDTSurvey/StatisticsElectronic
Rao et al. (2014) *  Emotion and AdaptationTransactional data/StatisticsJewellery
De et al. (2013) *  ECT, ITTransactional data/StatisticsFashion
Cheng et al. (2024) ** Not SpecifiedTransactional data; OCR/MLMultiple
Duong et al. (2025) ** STOCR/MLMultiple
Mor et al. (2024) ** Not SpecifiedOCR/MLMultiple
Wachter et al. (2012)   *Consumer Ethics ScaleSurveyNot specified
Shang et al. (2017a)  * Not SpecifiedExperimentNot specified
Serravalle et al. (2022) * *Hofstede’s cultural modelsInterviewFashion
Das and Kunja (2024) ***ECT, CDT, TPBInterviewMultiple
This study***Interaction Style Theory, AT, PT, TPBOCR/MLElectronic

Note(s): ST – Signalling Theory; CDT – Cognitive Dissonance Theory; AT – Attribution Theory; PT – Prospect theory; ECT – Expectation Confirmation Theory; IT – Information Theory; TPB – Theory of Planned Behaviour; OCR – Online Customer Reviews

Source(s): Authors’ own creation
Table 2

Representative keywords and phrases per product attribute

TypeAttributeKeywordsPhrases
Experience intrinsicPerformancework, well, router, use, device, connect, try, sound, speaker, headphone, pair, sound quality, camera, screen, monitor, picture, video, qualitysignal strength, lose connection, drop connection, have range, line of sight, picture quality, image quality, dead pixels, audio quality, it makes noise, it has bass, quality of sound
Durabilitymonth, battery, replacement, day, replace, time, weekstop work week, stop charge, suddenly stop, not last long
ReliabilityUse, cable, issue, one, device, time, make, product, barely hear, not connectionit does not work, they have issues, it has flaw, they have defect, it manufactures defect, defective unit
Search intrinsicPrimary featureskeyboard, computer, use, mouse, work, laptop, key, USB, card, scroll wheel, trackpad, space bar, skinkey on keyboard, USB port, hard drive
Secondary featurescase, iPad, cover, tablet, look, one, screen, break, bag, small, look, use, fit, tv, cheap, qualitycase does not fit, bottom of case, part of case, not fit properly, do not fit, big for tablet, size of
ExtrinsicProduct information mismatchproduct, item, not work, one star, work, refund, get, virtually, harnessthey change information, confusing misleading emails, wrong size, product description, description of product, dell tablet not compatible, compatible product
After-sales servicesget, time, try, work, app, remote, device, go, return, set, reimburse, pay attention, not apparent reason, not helpful, platform, totally useless, supportit takes hours, customer service, tech support, set up, instructions for, lack of support
Warrantyunit, drive, product, warranty, purchase, amazon, buy, repair, send, call, protection plan, SquareTradethey send replacement, it have warranty, customer service, year warranty, new one, proof of purchase
Logistics service qualitycable, one, return, mount, fan, screw, come, look, get, box, dimension, hard plastic, stainoriginal packaging, whole package, packing expect shipment, who fulfil order, wrong parts, wrong thing, packing prime envelop, brown packing box
Source(s): Authors’ own creation
Table 3

The classification performance on the unseen dataset

n = 20,976Predicted
ConfirmedUnconfirmed
Confirmed9,651 (TP) 1,596 (FN)
Unconfirmed650 (FP) 9,079 (TN)
Accuracy 89.29% 
F1 88.99% 
TPR 93.31% 
TNR 85.80% 
Source(s): Authors’ own creation
Table 4

Descriptive analysis of training and testing set

VariablesTraining set (N = 188,784 reviews)Testing set (N = 20,977 reviews)
MinMaxMeanStdVIFMinMaxMeanStdVIF
Output variableAssertive return action (95,499)
Non-assertive return action (93,285)
Assertive return action (10,611)
Non-assertive return action (10,366)
Input variable
Performance9.4e−050.98080.18440.23991.85210.00020.97910.18350.23841.8352
Primary features0.00040.99480.20240.21811.15290.00080.99020.20410.21921.1579
Secondary features0.00010.96830.05720.12021.46470.00010.95480.05760.11991.4480
Durability0.00020.95830.05980.10061.77460.00030.94270.05980.10071.7599
Reliability0.00030.98650.11560.18031.28960.00050.97540.11470.17921.2906
Product information mismatch6.2e−050.96170.16980.23201.57890.00020.93880.16830.23141.5652
After-sales services0.00010.97520.06930.12791.28400.00020.95410.07040.12971.2911
Logistics services quality0.00010.98470.07560.13411.21370.00030.97210.07590.13481.2072
Warranty0.00010.96470.06540.12731.29200.00020.95410.06540.12851.2892
Selling price0.37999.9936.04162.5831.41530.37999.9935.87261.6011.4288
Sales rank020.2447.24593.15756.7319017.4807.21893.17586.6089
Source(s): Authors’ own creation
Table 5

The goodness of fit for GB with 90:10 splitting

F1AUC
Training setMean0.58140.6475
Std0.00130.0007
Testing setMean0.55470.6092
Std0.00540.0043
Source(s): Authors’ own creation
Table 6

Summary of findings and recommendations of the study

Attribute typeProduct attributesImpact on switching from non-assertive to assertive OPRBImplications and practical recommendations
Expected relationshipFound relationship
Search intrinsicPhysical appearanceNegativeWeakly impact (Electronics)
Strongly positive (Fashion items)
(H1a is not supported)
This attribute has a limited impact on (non)-assertive OPRB of electronics
Single effect: Product fitting has been proved as a main driver for fashion in previous research. Hence, customers strongly display assertive OPRB as it directly impacts their personal appearance. Sellers can improve their virtual try-out functions through many advanced technologies such as virtual or augmented reality
Primary featuresNegativeWeakly impact (Electronics)
Strongly positive (Grocery)
(H1b is not supported)
This attribute has a limited impact on OPRB of electronics
Single effect on grocery category: Sourcing from reliable suppliers while being transparent in any product ingredient changes may suppress assertive OPRB.
Secondary featuresNegativeWeakly impact (H1c is not supported)This attribute has a limited impact
Experience intrinsicPerformancePositiveModerately positive (H2a is supported)Single effect: Besides improving product performance, which is for long-term, offering upgrading services or products not only can address the upward counterfactual thought and suppressing OPRB assertiveness but also improve sales for the other products or services
Joint effect with selling price: Since customers has higher OPRB assertiveness for low-price products (≤$20) with performance issues, sellers can highlight the superior performance features of their product compared to competitors’. This strategy encourages customers to imagine their alternative products could have been worse, which reduces any conflicting thoughts they might have and ultimately prevents buyer’s remorse
 DurabilityPositiveStrongly heterogeneous (H2b is partially supported)Single effect: Besides improving the product durability, which is for long-term, a cost-benefit analysis of improving product durability information reveals a favourable outcome for sellers. Maintaining transparency in durability information on websites is a low-cost, pre-emptive approach (Martínez-López et al., 2022b) that prevents misconceptions and reduces non-assertive OPRB by ensuring consumers have realistic expectations about product longevity. This can help decrease unnecessary returns caused by misinterpretation of durability claims
Joint effect with secondary features: Addressing concerns related to secondary features is particularly important, as customers exhibit stronger OPRB non-assertiveness when durability issues arise from these components. Sellers should focus on enhancing quality assurance of secondary items and emphasising the value proposition of the multifunctional product by showcasing how durable secondary features contribute to overall longevity. Yoo (2014) found that in a contemporary business environment, rising return requests – particularly for high-end products such as smartphones and tablets – make quality assurance a priority. This demonstrates that the long-term benefits – such as reduced return rates, fewer warranty claims, and higher customer satisfaction – outweigh the costs of quality assurance. Furthermore, durable components and materials reduce the need for replacements, minimising returns and warranty claims if the product outlasts the return period. Additionally, enhancing secondary feature durability is more cost-effective than improving primary features
ReliabilityPositiveModerately positive (H2c is supported)Single effect: Customers tend to make assertive OPRB since product defects are severe. Besides improving product reliability, increasing the level of personalisation before purchase would increase personal attachment and arouse product retention
Joint effect with after-sales services: Many reliabilities issues stem from the user-unfriendly interface. Sellers can upgrade their after-sales services such as 24/7 helpline, frequent responses, training staff would potentially help customers troubleshoot issues, avoiding unnecessary product returns
Ease of usePositiveNone (H2d is not supported)This attribute has no impact
ExtrinsicProduct information mismatchPositiveStrongly negative (H3a is not supported)Single effect and joint effect with selling price: Product information mismatch strongly drives non-assertive OPRB, especially for low-priced products (≤$20). Subscription-based products, whether digital (e.g. Kindle, Prime) or physical (e.g. subscription boxes), demonstrate how accurate information can reduce OPRB. Subscription-based products often have lower return rates due to their focus on long-term customer relationships. Sellers offer lower initial prices, incentivising them to ensure quality and accurate information to build trust. This dynamic foster enduring relationships and lower return rates. While focusing on quality assurance for information display is ideal, some retailers may be tempted to embellish product information to boost sales, potentially triggering OPRB through false advertising. A purchase-risk notices – a pre-emptive approach – uses expectancy-lowering communication to align customer expectations with the actual product, thereby reducing the likelihood of returns (Martínez-López et al., 2022b). When compared to the expenses associated with handling returns and issuing refunds, this method presents a favourable cost-benefit ratio, offering a “cost-friendly” solution to mitigate return rates
After-sales servicesPositiveWeakly impact (H3b is supported only when interacting with reliability)This attribute has a limited individual impact but has a positive impact when interacting with reliability
 WarrantyPositiveStrongly positive (H3c is supported)Single effect: Sellers should focus on improving warranty services since its’ substandard trigger assertive OPRB. Sellers often overlook the importance of warranty services, treating them as separate from regular product returns, which leads to inefficiencies in retail operations. However, both processes share similar steps like problem identification and reverse logistics, differing only in the final step – warranty repairs are delivered back to customers, while returns result in refunds (ReturnLogic, n.d.). Improving warranty services can help minimise costs by reducing the gap between refund expenses and delivery costs, prevent redundant expenses, and enhance customer satisfaction, ultimately reducing the assertive OPRB due to dissatisfaction with warranty outcomes
Joint effect with reliability: From seller’s perspective, warranty entails a risk of having extra costs (e.g. return shipping, repair, and replacement). Sellers should prioritise the reliability improvement among intrinsic attributes. It would alleviate/avoid the extra cost and hassle for warranty later
 Logistics service qualityNegativeWeakly impact (H4 is not supported)This attribute has a limited impact
Selling pricePositiveModerately positive (H5 is supported)Single Effect: For low-priced products (≤$20), a stricter return policy can be effective, as non-assertive customers may find the process too cumbersome, reducing the likelihood of them initiating a return. On the other hand, high-priced items (e.g. MacBooks, TVs) can benefit from a hassle-free return policy (e.g. full refund), as this encourages customer confidence and can boost sales. Customers are generally more motivated to return these higher-priced items if quality issues arise, and the seller is likely to recover a higher salvage value compared to lower-priced products
Sales rankPositiveModerately negative (H6 is not supported)Single effect and joint effect with reliability: It is unsurprising that less well-known, defective products are associated with higher levels of OPRB assertiveness, as customers often stereotype them as being of poor quality due to their low popularity. For those sellers, they have to improve their product quality and brand image simultaneously
Source(s): Authors’ own creation

Supplements

Supplementary data

References

Abdulla
,
H.
,
Ketzenberg
,
M.
and
Abbey
,
J.D.
(
2019
), “
Taking stock of consumer returns: a review and classification of the literature
”,
Journal of Operations Management
, Vol. 
65
No. 
6
, pp. 
560
-
605
, doi: .
Abdulla
,
H.
,
Ketzenberg
,
M.
,
Abbey
,
J.D.
and
Heim
,
G.R.
(
2025
), “
The point of no return? Restrictive changes to lenient return policies and consumer reactions to them
”,
Journal of Operations Management
, Vol. 
71
No. 
1
, pp. 
81
-
108
, doi: .
Abrahams
,
A.S.
,
Fan
,
W.
,
Wang
,
G.A.
,
Zhang
,
Z.
and
Jiao
,
J.
(
2015
), “
An integrated text analytic framework for product defect discovery
”,
Production and Operations Management
, Vol. 
24
No. 
6
, pp. 
975
-
990
, doi: .
Akçay
,
Y.
,
Boyacbox
,
T.
and
Zhang
,
D.
(
2013
), “
Selling with money-back guarantees: the impact on prices, quantities, and retail profitability
”,
Production and Operations Management
, Vol. 
22
No. 
4
, pp. 
777
-
791
, doi: .
Anderson
,
R.E.
(
1973
), “
Consumer dissatisfaction: the effect of disconfirmed expectancy on perceived product performance
”,
Journal of Marketing Research
, Vol. 
10
No. 
1
, p.
38
, doi: .
Anderson
,
E.T.
,
Hansen
,
K.
and
Simester
,
D.
(
2009
), “
The option value of returns: theory and empirical evidence
”,
Marketing Science
, Vol. 
28
No. 
3
, pp. 
405
-
423
, doi: .
Arts
,
J.W.C.
,
Frambach
,
R.T.
and
Bijmolt
,
T.H.A.
(
2011
), “
Generalizations on consumer innovation adoption: a meta-analysis on drivers of intention and behavior
”,
International Journal of Research in Marketing
, Vol. 
28
No. 
2
, pp. 
134
-
144
, doi: .
Bendoly
,
E.
and
Oliva
,
R.
(
2024
), “
Holding North: recognizing identity and advancing contribution in operations management
”,
Journal of Operations Management
, Vol. 
70
No. 
4
, pp. 
518
-
522
, doi: .
Blei
,
D.M.
,
Ng
,
A.Y.
and
Jordan
,
M.I.
(
2003
), “
Latent Dirichlet allocation
”,
Journal of Machine Learning Research
, Vol. 
3
, pp. 
4
-
5
.
Breiman
,
L.
(
2001
), “
Random forests
”,
Machine Learning
, Vol. 
45
No. 
1
, pp. 
5
-
32
, doi: .
Browning
,
V.
,
So
,
K.K.F.
and
Sparks
,
B.
(
2013
), “
The influence of online reviews on consumers' attributions of service quality and control for service standards in hotels
”,
Journal of Travel and Tourism Marketing
, Vol. 
30
Nos
1-2
, pp. 
23
-
40
, doi: .
Brucks
,
M.
,
Zeithaml
,
V.A.
and
Naylor
,
G.
(
2000
), “
Price and brand name as indicators of quality dimensions for consumer durables
”,
Journal of the Academy of Marketing Science
, Vol. 
28
No. 
3
, pp. 
359
-
374
, doi: .
Carroll
,
N.
(
2021
), “
UK Amazon: influence and ambition in the grocery sector market report 2021
”,
Mintel
,
available at:
 https://store.mintel.com/report/amazon-influence-and-ambition-in-the-grocery-sector-uk-january-2021 (
accessed
 17 May 2024).
Chang
,
H.H.
,
Tsai
,
Y.C.
,
Wong
,
K.H.
,
Wang
,
J.W.
and
Cho
,
F.J.
(
2015
), “
The effects of response strategies and severity of failure on consumer attribution with regard to negative word-of-mouth
”,
Decision Support Systems
, Vol. 
71
, pp. 
48
-
61
, doi: .
Cheng
,
S.Y.Y.
,
White
,
T.B.
and
Chaplin
,
L.N.
(
2012
), “
The effects of self-brand connections on responses to brand failure: a new look at the consumer–brand relationship
”,
Journal of Consumer Psychology
, Vol. 
22
No. 
2
, pp. 
280
-
288
, doi: .
Cheng
,
H.-F.
,
Krikon
,
E.
and
Murdock
,
V.
(
2024
), “
Why do customers return products? Using customer reviews to predict product return behaviors
”,
Proceedings of the 2024 ACM SIGIR Conference on Human Information Interaction and Retrieval
,
New York, NY, USA
,
ACM
, pp. 
12
-
22
, doi: .
Chevalier
,
J.A.
and
Mayzlin
,
D.
(
2006
), “
The effect of word of mouth on sales: online book reviews
”,
Journal of Marketing Research
, Vol. 
43
No. 
3
, pp. 
345
-
354
, doi: .
Cho
,
W.
,
Min
,
D.-J.
and
Dresner
,
M.
(
2022
), “
The impact of predicted quality and customer cost on quality assurance behavior
”,
International Journal of Operations and Production Management
, Vol. 
42
No. 
4
, pp. 
409
-
439
, doi: .
Chou
,
Y.
,
Chuang
,
H.H.
,
Chou
,
P.
and
Oliva
,
R.
(
2023
), “
Supervised machine learning for theory building and testing: opportunities in operations management
”,
Journal of Operations Management
, Vol. 
69
No. 
4
, pp. 
643
-
675
, doi: .
Crutsinger
,
C.
,
Knight
,
D.
and
Kim
,
H.
(
2010
), “
Teens' consumer interaction styles: the impact of assertive and aggressive behaviour on attitudes towards marketing practices
”,
International Journal of Consumer Studies
, Vol. 
34
No. 
2
, pp. 
196
-
203
, doi: .
Das
,
L.
and
Kunja
,
S.R.
(
2024
), “
Why do consumers return products? A qualitative exploration of online product return behaviour of young consumers
”,
Journal of Retailing and Consumer Services
, Vol. 
78
, 103770, doi: .
De
,
P.
,
Hu
,
Y.J.
and
Rahman
,
M.S.
(
2013
), “
Product-oriented web technologies and product returns: an exploratory study
”,
Information Systems Research
, Vol. 
24
No. 
4
, pp. 
998
-
1010
, doi: .
Dong
,
X.
,
Quariguasi Frota Neto
,
J.
and
Potter
,
A.
(
2025
), “
Unboxing product returns: what drives return policy leniency in the fashion industry?
”,
International Journal of Operations and Production Management
, Vol. 45 No. 8, pp. 1461-1480, doi: .
Duong
,
Q.H.
,
Zhou
,
L.
,
Van Nguyen
,
T.
and
Meng
,
M.
(
2025
), “
Understanding and predicting online product return behavior: an interpretable machine learning approach
”,
International Journal of Production Economics
, Vol. 
280
, 109499, doi: .
El Kihal
,
S.
and
Shehu
,
E.
(
2022
), “
It's not only what they buy, it's also what they keep: linking marketing instruments to product returns
”,
Journal of Retailing
, Vol. 
98
No. 
3
, pp. 
558
-
571
, doi: .
Erdem
,
T.
and
Swait
,
J.
(
1998
), “
Brand equity as a signaling phenomenon
”,
Journal of Consumer Psychology
, Vol. 
7
No. 
2
, pp. 
131
-
157
, doi: .
Ertekin
,
N.
(
2018
), “
Immediate and long-term benefits of in-store return experience
”,
Production and Operations Management
, Vol. 
27
No. 
1
, pp. 
121
-
142
, doi: .
Espejel
,
J.
,
Fandos
,
C.
and
Flavián
,
C.
(
2007
), “
The role of intrinsic and extrinsic quality attributes on consumer behaviour for traditional food products
”,
Managing Service Quality
, Vol. 
17
No. 
6
, pp. 
681
-
701
, doi: .
European Environment Agency
(
2024
), “Many returned and unsold textiles end up destroyed in Europe”,
European Environment Agency
, 4 March, available at: https://www.eea.europa.eu/en/newsroom/news/many-returned-and-unsold-textiles (
accessed 10 April 2025
).
Fernandez-Lores
,
S.
,
Crespo-Tejero
,
N.
,
Fernández-Hernández
,
R.
and
García-Muiña
,
F.E.
(
2024
), “
Online product returns: the role of perceived environmental efficacy and post-purchase entrepreneurial cognitive dissonance
”,
Journal of Business Research
, Vol. 
174
, 114462, doi: .
Finch
,
B.J.
(
2007
), “
Customer expectations in online auction environments: an exploratory study of customer feedback and risk
”,
Journal of Operations Management
, Vol. 
25
No. 
5
, pp. 
985
-
997
, doi: .
Fiske
,
S.T.
and
Taylor
,
S.E.
(
1991
),
Social Cognition: McGraw-Hill Series in Social Psychology, Social Cognition
,
Mcgraw-Hill Book
,
New York
.
Frei
,
R.
,
Jack
,
L.
and
Brown
,
S.
(
2020
), “
Product returns: a growing problem for business, society and environment
”,
International Journal of Operations and Production Management
, Vol. 
40
No. 
10
, pp. 
1613
-
1621
, doi: .
Garvin
,
D.A.
(
1987
), “
Competing on the eight dimensions of quality
”,
Harvard Business Review
, pp. 
101
-
109
.
Gelbrich
,
K.
,
Gäthke
,
J.
and
Hübner
,
A.
(
2017
), “
Rewarding customers who keep a product: how reinforcement affects customers' product return decision in online retailing
”,
Psychology and Marketing
, Vol. 
34
No. 
9
, pp. 
853
-
867
, doi: .
Goldstein
,
A.
,
Kapelner
,
A.
,
Bleich
,
J.
and
Pitkin
,
E.
(
2015
), “
Peeking inside the black box: visualizing statistical learning with plots of individual conditional expectation
”,
Journal of Computational and Graphical Statistics
, Vol. 
24
No. 
1
, pp. 
44
-
65
, doi: .
Griffis
,
S.E.
,
Rao
,
S.
,
Goldsby
,
T.J.
and
Niranjan
,
T.T.
(
2012
), “
The customer consequences of returns in online retailing: an empirical analysis
”,
Journal of Operations Management
, Vol. 
30
No. 
4
, pp. 
282
-
294
, doi: .
Gustafsson
,
E.
,
Jonsson
,
P.
and
Holmström
,
J.
(
2021
), “
Reducing retail supply chain costs of product returns using digital product fitting
”,
International Journal of Physical Distribution and Logistics Management
, Vol. 
51
No. 
8
, pp. 
877
-
896
, doi: .
Harding
,
R.D.
,
Hildebrand
,
D.
,
Kramer
,
T.
and
Lasaleta
,
J.D.
(
2019
), “
The impact of acquisition mode on expected speed of product mastery and subsequent consumer behavior
”,
Journal of Consumer Research
, Vol. 
46
No. 
1
, pp. 
140
-
158
, doi: .
Hess
,
R.L.
,
Ganesan
,
S.
and
Klein
,
N.M.
(
2007
), “
Interactional service failures in a pseudorelationship: the role of organizational attributions
”,
Journal of Retailing
, Vol. 
83
No. 
1
, pp. 
79
-
95
, doi: .
Hong
,
Y.
and
Pavlou
,
P.A.
(
2014
), “
Product fit uncertainty in online markets: nature, effects, and antecedents
”,
Information Systems Research
, Vol. 
25
No. 
2
, pp. 
328
-
344
, doi: .
Huang
,
P.
,
Lurie
,
N.H.
and
Mitra
,
S.
(
2009
), “
Searching for experience on the web: an empirical examination of consumer behavior for search and experience goods
”,
Journal of Marketing
, Vol. 
73
No. 
2
, pp. 
55
-
69
, doi: .
Jin
,
C.
,
Yang
,
L.
and
Hosanagar
,
K.
(
2023
), “
To brush or not to brush: product rankings, consumer search, and fake orders
”,
Information Systems Research
, Vol. 
34
No. 
2
, pp. 
532
-
552
, doi: .
Kahneman
,
D.
and
Tversky
,
A.
(
2013
), “Prospect theory: an analysis of decision under risk”, in
Handbook of the Fundamentals of Financial Decision Making: Part I
, pp. 
99
-
127
, doi: .
Ketzenberg
,
M.E.
,
Abbey
,
J.D.
,
Heim
,
G.R.
and
Kumar
,
S.
(
2020
), “
Assessing customer return behaviors through data analytics
”,
Journal of Operations Management
, Vol. 
66
No. 
6
, pp. 
622
-
645
, doi: .
Kianpour
,
K.
,
Jusoh
,
A.
,
Mardani
,
A.
,
Streimikiene
,
D.
,
Cavallaro
,
F.
,
Nor
,
K.Md.
and
Zavadskas
,
E.
(
2017
), “
Factors influencing consumers' intention to return the end of life electronic products through reverse supply chain management for reuse, repair and recycling
”,
Sustainability
, Vol. 
9
No. 
9
, 1657, doi: .
Lee
,
D.H.
(
2015
), “
An alternative explanation of consumer product returns from the postpurchase dissonance and ecological marketing perspectives
”,
Psychology and Marketing
, Vol. 
32
No. 
1
, pp. 
49
-
64
, doi: .
Lee
,
M.
and
Lou
,
Y.-C.
(
2011
), “
Consumer reliance on intrinsic and extrinsic cues in product evaluations: a conjoint approach
”,
Journal of Applied Business Research (JABR)
, Vol. 
12
No. 
1
, p.
21
, doi: .
Lee
,
S.
and
Yi
,
Y.
(
2019
), “
Retail is detail! Give consumers a gift rather than a bundle’: promotion framing and consumer product returns
”,
Psychology and Marketing
, Vol. 
36
No. 
1
, pp. 
15
-
27
, doi: .
Ligthart
,
A.
,
Catal
,
C.
and
Tekinerdogan
,
B.
(
2021
), “
Analyzing the effectiveness of semi-supervised learning approaches for opinion spam classification
”,
Applied Soft Computing
, Vol. 
101
, 107023, doi: .
Lundberg
,
S.
and
Lee
,
S.-I.
(
2017
), “A unified approach to interpreting model predictions”, in
Advances in Neural Information Processing Systems
, pp. 
4766
-
4775
.
Mardumyan
,
A.
and
Siret
,
I.
(
2023
), “
When review verification does more harm than good: how certified reviews determine customer–brand relationship quality
”,
Journal of Business Research
, Vol. 
160
, 113756, doi: .
Martínez-López
,
F.J.
,
Feng
,
C.
,
Li
,
Y.
and
López-López
,
D.
(
2022a
), “
Using instant refunds to improve online return experiences
”,
Journal of Retailing and Consumer Services
, Vol. 
68
, 103067, doi: .
Martínez-López
,
F.J.
,
Li
,
Y.
,
Feng
,
C.
,
Liu
,
H.
and
Sansó-Mata
,
M.
(
2022b
), “
‘What I’ve received doesn't match what I saw online’: effects of purchase-risk notices on reducing online returns
”,
Information and Management
, Vol. 
59
No. 
8
, 103720, doi: .
Minnema
,
A.
,
Bijmolt
,
T.H.A.
,
Gensler
,
S.
and
Wiesel
,
T.
(
2016
), “
To keep or not to keep: effects of online customer reviews on product returns
”,
Journal of Retailing
, Vol. 
92
No. 
3
, pp. 
253
-
267
, doi: .
Mishra
,
A.
and
Dutta
,
P.
(
2024
), “
Return management in e-commerce firms: a machine learning approach to predict product returns and examine variables influencing returns
”,
Journal of Cleaner Production
, Vol. 
477
, 143802, doi: .
Mor
,
A.
,
Orsenigo
,
C.
,
Soto Gomez
,
M.
and
Vercellis
,
C.
(
2024
), “
Shaping the causes of product returns: topic modeling on online customer reviews
”, Electronic Commerce Research, pp.
1
-
35
, doi: .
National Retail Federation
(
2023
), “
2023 consumer returns in the retail industry
”,
National Retail Federation
,
22 December, available at:
 https://nrf.com/research/2023-consumer-returns-retail-industry (
accessed
 6 August 2024).
Nelson
,
P.
(
1970
), “
Information and consumer behavior
”,
Journal of Political Economy
, Vol. 
78
No. 
2
, pp. 
311
-
329
, doi: .
Ni
,
J.
,
Li
,
J.
and
McAuley
,
J.
(
2019
), “
Justifying recommendations using distantly-labeled reviews and fine-grained aspects
”,
Proceedings of the 2019 Conference on Empirical Methods in Natural Language Processing and the 9th International Joint Conference on Natural Language Processing (EMNLP-IJCNLP)
,
Stroudsburg, PA, USA
,
Association for Computational Linguistics
, pp. 
188
-
197
, doi: .
Ojala
,
M.
and
Garriga
,
G.C.
(
2010
), “
Permutation tests for studying classifier performance
”,
Journal of Machine Learning Research
, Vol. 
11
No. 6, pp. 1833-1863.
Orbell
,
S.
and
Sheeran
,
P.
(
1998
), “
Inclined abstainers': a problem for predicting health‐related behaviour
”,
British Journal of Social Psychology
, Vol. 
37
No. 
2
, pp. 
151
-
165
, doi: .
Panda
,
D.
,
Raut
,
S.K.
,
Rana
,
S.
and
Shamsudin
,
M.N.
(
2024
), “
Leveraging gamification to enhance persuasive behaviour and streamline online product returns: an approach grounded in multiple case studies
”,
Journal of Business and Industrial Marketing
, Vol. 
39
No. 
12
, pp. 
2684
-
2698
, doi: .
Parasuraman
, A.B.L.L.
,
Zeithaml
,
V.A.
and
Berry
,
L.L.
(
1988
), “SERVQUAL: a multiple-item scale for measuring consumer perception of service quality”,
Journal of Retailing
, Vol. 
64
No. 
1
, pp. 12-40.
Patrick
,
V.M.
and
Hagtvedt
,
H.
(
2011
), “
Aesthetic incongruity resolution
”,
Journal of Marketing Research
, Vol. 
48
No. 
2
, pp. 
393
-
402
, doi: .
Powers
,
T.L.
and
Jack
,
E.P.
(
2013
), “
The influence of cognitive dissonance on retail product returns
”,
Psychology and Marketing
, Vol. 
30
No. 
8
, pp. 
724
-
735
, doi: .
Ramanathan
,
U.
,
Subramanian
,
N.
and
Parrott
,
G.
(
2017
), “
Role of social media in retail network operations and marketing to enhance customer satisfaction
”,
International Journal of Operations and Production Management
, Vol. 
37
No. 
1
, pp. 
105
-
123
, doi: .
Rao
,
S.
,
Goldsby
,
T.J.
,
Griffis
,
S.E.
and
Iyengar
,
D.
(
2011
), “
Electronic logistics service quality (e-LSQ): its impact on the customer's purchase satisfaction and retention
”,
Journal of Business Logistics
, Vol. 
32
No. 
2
, pp. 
167
-
179
, doi: .
Rao
,
S.
,
Rabinovich
,
E.
and
Raju
,
D.
(
2014
), “
The role of physical distribution services as determinants of product returns in Internet retailing
”,
Journal of Operations Management
, Vol. 
32
No. 
6
, pp. 
295
-
312
, doi: .
ReturnLogic
(
2022
), “
This is why you should consider warranty requests as a return type
”, ReturnLogic, available at: https://www.returnlogic.com/blog/why-you-should-consider-warranty-requests-as-a-return-type/ (
accessed 19 March 2025
).
Richardson
,
P.S.
,
Dick
,
A.S.
and
Jain
,
A.K.
(
1994
), “
Extrinsic and intrinsic cue effects on perceptions of store brand quality
”,
Journal of Marketing
, Vol. 
58
No. 
4
, pp. 
28
-
36
, doi: .
Richins
,
M.L.
(
1983
), “
An analysis of consumer interaction styles in the marketplace
”,
Journal of Consumer Research
, Vol. 
10
No. 
1
, p.
73
, doi: .
Röder
,
M.
,
Both
,
A.
and
Hinneburg
,
A.
(
2015
), “
Exploring the space of topic coherence measures
”,
WSDM 2015 – Proceedings of the 8th ACM International Conference on Web Search and Data Mining
, pp. 
399
-
408
, doi: .
Sahoo
,
N.
,
Dellarocas
,
C.
and
Srinivasan
,
S.
(
2018
), “
The impact of online product reviews on product returns
”,
Information Systems Research
, Vol. 
29
No. 
3
, pp. 
723
-
738
, doi: .
Schulz
,
P.
,
Shehu
,
E.
and
Clement
,
M.
(
2019
), “
When consumers can return digital products: influence of firm- and consumer-induced communication on the returns and profitability of news articles
”,
International Journal of Research in Marketing
, Vol. 
36
No. 
3
, pp. 
454
-
470
, doi: .
Serravalle
,
F.
,
Vannucci
,
V.
and
Pantano
,
E.
(
2022
), “
Take it or leave it?’: evidence on cultural differences affecting return behaviour for Gen Z
”,
Journal of Retailing and Consumer Services
, Vol. 
66
, 102942, doi: .
Shang
,
G.
,
Ghosh
,
B.P.
and
Galbreth
,
M.R.
(
2017a
), “
Optimal retail return policies with wardrobing
”,
Production and Operations Management
, Vol. 
26
No. 
7
, pp. 
1315
-
1332
, doi: .
Shang
,
G.
,
Pekgün
,
P.
,
Ferguson
,
M.
and
Galbreth
,
M.
(
2017b
), “
How much do online consumers really value free product returns? Evidence from eBay
”,
Journal of Operations Management
, Vols
53-56
No. 
1
, pp. 
53
-
56
, doi: .
Sheeran
,
P.
(
2002
), “
Intention—behavior relations: a conceptual and empirical review
”,
European Review of Social Psychology
, Vol. 
12
No. 
1
, pp. 
1
-
36
, doi: .
Shulman
,
J.D.
,
Cunha
,
M.
and
Saint Clair
,
J.K.
(
2015
), “
Consumer uncertainty and purchase decision reversals: theory and evidence
”,
Marketing Science
, Vol. 
34
No. 
4
, pp. 
590
-
605
, doi: .
Simpson
,
D.
,
Power
,
D.
,
Riach
,
K.
and
Tsarenko
,
Y.
(
2019
), “
Consumer motivation for product disposal and its role in acquiring products for reuse
”,
Journal of Operations Management
, Vol. 
65
No. 
7
, pp. 
612
-
635
, doi: .
Sousa
,
R.
and
Voss
,
C.A.
(
2009
), “
The effects of service failures and recovery on customer loyalty in e‐services
”,
International Journal of Operations and Production Management
, Vol. 
29
No. 
8
, pp. 
834
-
864
, doi: .
Szybillo
,
G.J.
and
Jacoby
,
J.
(
1974
), “
Intrinsic versus extrinsic cues as determinants of perceived product quality
”,
Journal of Applied Psychology
, Vol. 
59
No. 
1
, pp. 
74
-
78
, doi: .
Tóth
,
Z.
,
Liu
,
M.
,
Luo
,
J.
and
Braziotis
,
C.
(
2019
), “
The role of social media in managing supplier attractiveness
”,
International Journal of Operations and Production Management
, Vol. 
40
No. 
5
, pp. 
625
-
646
, doi: .
Trope
,
Y.
and
Liberman
,
N.
(
2003
), “
Temporal construal
”,
Psychological Review
, Vol. 
110
No. 
3
, pp. 
403
-
421
, doi: .
Ursu
,
R.M.
(
2018
), “
The power of rankings: quantifying the effect of rankings on online consumer search and purchase decisions
”,
Marketing Science
, Vol. 
37
No. 
4
, pp. 
530
-
552
, doi: .
Van Nguyen
,
T.
,
Zhou
,
L.
,
Chong
,
A.Y.L.
,
Li
,
B.
and
Pu
,
X.
(
2020
), “
Predicting customer demand for remanufactured products: a data-mining approach
”,
European Journal of Operational Research
, Vol. 
281
No. 
3
, pp. 
543
-
558
, doi: .
Wachter
,
K.
,
Vitell
,
S.J.
,
Shelton
,
R.K.
and
Park
,
K.
(
2012
), “
Exploring consumer orientation toward returns: unethical dimensions
”,
Business Ethics: A European Review
, Vol. 
21
No. 
1
, pp. 
115
-
128
, doi: .
Wallenburg
,
C.M.
,
Einmahl
,
L.
,
Lee
,
K.B.
and
Rao
,
S.
(
2021
), “
On packaging and product returns in online retail—mailing boxes or sending signals?
”,
Journal of Business Logistics
, Vol. 
42
No. 
2
, pp. 
291
-
308
, doi: .
Walsh
,
G.
,
Albrecht
,
A.K.
,
Kunz
,
W.
and
Hofacker
,
C.F.
(
2016
), “
Relationship between online retailers' reputation and product returns
”,
British Journal of Management
, Vol. 
27
No. 
1
, pp. 
3
-
20
, doi: .
Wang
,
K.Y.
,
Liang
,
M.
and
Peracchio
,
L.A.
(
2011
), “
Strategies to offset dissatisfactory product performance: the role of post-purchase marketing
”,
Journal of Business Research
, Vol. 
64
No. 
8
, pp. 
809
-
815
, doi: .
Wang
,
M.
,
Shang
,
G.
,
Rong
,
Y.
and
Galbreth
,
M.R.
(
2024
), “
Order basket contents and consumer returns
”,
Decision Sciences
, Vol. 
56
No. 
2
, pp. 
144
-
170
, doi: .
Wei
,
J.
,
Jiang
,
M.
,
Li
,
Y.N.
,
Li
,
W.
and
Mead
,
J.A.
(
2023
), “
The impact of product defect severity and product attachment on consumer negative emotions
”,
Psychology and Marketing
, Vol. 
40
No. 
5
, pp. 
1026
-
1042
, doi: .
Weiner
,
B.
(
2000
), “
Attributional thoughts about consumer behavior
”,
Journal of Consumer Research
, Vol. 
27
No. 
3
, pp. 
382
-
387
, doi: .
Weitzl
,
W.
,
Hutzinger
,
C.
and
Einwiller
,
S.
(
2018
), “
An empirical study on how webcare mitigates complainants' failure attributions and negative word-of-mouth
”,
Computers in Human Behavior
, Vol. 
89
, pp. 
316
-
327
, doi: .
Wells
,
V.
,
Valacich
,
J.S.
and
Hess
,
T.J.
(
2011
), “
What signal are you sending? How website quality influences perceptions of product quality and purchase intentions
”,
MIS Quarterly
, Vol. 
35
No. 
2
, p.
373
, doi: .
Wen
,
C.
,
Prybutok
,
R.V.
,
Blankson
,
C.
and
Fang
,
J.
(
2014
), “
The role of E-quality within the consumer decision making process
”,
International Journal of Operations and Production Management
, Vol. 
34
No. 
12
, pp. 
1506
-
1536
, doi: .
Wood
,
S.L.
and
Bettman
,
J.R.
(
2007
), “
Predicting happiness: how normative feeling rules influence (and even reverse) durability bias
”,
Journal of Consumer Psychology
, Vol. 
17
No. 
3
, pp. 
188
-
201
, doi: .
Yoo
,
S.H.
(
2014
), “
Product quality and return policy in a supply chain under risk aversion of a supplier
”,
International Journal of Production Economics
, Vol. 
154
, pp. 
146
-
155
, doi: .
Zeelenberg
,
M.
and
Pieters
,
R.
(
2004
), “
Beyond valence in customer dissatisfaction: a review and new findings on behavioral responses to regret and disappointment in failed services
”,
Journal of Business Research
, Vol. 
57
No. 
4
, pp. 
445
-
455
, doi: .
Zhang
,
Y.
,
Voorhees
,
C.M.
,
Lin
,
C.
,
Chiang
,
J.
,
Hult
,
G.T.M.
and
Calantone
,
R.J.
(
2022
), “
Information search and product returns across mobile and traditional online channels
”,
Journal of Retailing
, Vol. 
98
No. 
2
, pp. 
260
-
276
, doi: .

Languages

or Create an Account

Close subscription notice
Close access options