Skip to Main Content
Purpose

Demand for last-mile fulfillment services (LMFS) has increased significantly over the last several years, with the increase occurring at different rates over time. Further, the literature presents conflicting findings regarding whether urban or rural consumers display higher demand for LMFS. Thus, to inform fulfillment network decisions, we explore demand for LMFS in the United States (US) over time and in response to a shock.

Design/methodology/approach

We study this topic over the period of 2010–2023, with COVID-19 in 2020 serving as a shock. We utilize data from NielsenIQ's Consumer Panel Dataset and apply discontinuous growth models.

Findings

Urban areas saw a larger and faster increase in demand for LMFS from 2010 through 2019 as compared to rural areas. Following the onset of COVID-19, urban areas experienced a greater increase in demand, and this increase was sustained through 2023. Conditional on a geographic area's ruralness, areas that had the highest levels of demand for LMFS prior to COVID-19 exhibited a smaller increase in 2020.

Originality/value

The literature has mostly employed cross-sectional survey data and presents conflicting findings. To inform practice and last-mile supply chain management literature, we reconcile these conflicts by exploring demand for LMFS over time with transaction data.

Online shopping (e-commerce) has rapidly expanded in the United States (US) over the last several years (US Census Bureau, 2023a), and the expansion was accelerated by a shock (Argyres et al., 2019) generated by the COVID-19 pandemic (Torry, 2020). This increase in online shopping has accordingly intensified the demand for last-mile delivery. Consequently, supply chain management (SCM) research has explored the execution of this critical fulfillment stage (e.g. Castillo et al., 2022; Rose et al., 2025). However, missing from this literature is an understanding of where to focus logistics investment and innovation efforts for last-mile delivery based on consumer demand. Specifically, demand for last-mile fulfillment services (LMFS) may differ in urban versus rural areas, each of which faces unique last-mile challenges (Boyer et al., 2009). For example, rural areas present higher last-mile delivery costs, leading delivery providers to at times cut back on rural delivery availability (Cosgrove, 2023; Matthews, 2022). The potential different demand patterns can thus drive innovation priorities and necessitate tailored strategies for fulfillment network design.

Research exploring how the use of e-commerce and, accordingly, demand for LMFS differs for urban versus rural areas presents conflicting findings. Some studies support an innovation-diffusion perspective – whereby urban consumers should display higher demand for LMFS – and others support an efficiency perspective – whereby rural consumers should display higher demand for LMFS (Farag et al., 2006). This impedes the ability to generate actionable managerial insights. We aim to reconcile these conflicting findings, thereby advancing theory by resolving anomalies (Laudan, 1977). Further, we examine how demand for LMFS evolves over time and in response to a shock, which has been lacking given a cross-sectional focus (e.g. Song, 2022).

Drawing on the innovation-diffusion and efficiency perspectives (Anderson et al., 2003) and Argyres et al.’s (2019) framework for responses to shocks, we adopt middle-range theorizing (Stank et al., 2017) to hypothesize the expected demand for LMFS before and following the onset of COVID-19. The pandemic is an ideal event (Morgeson et al., 2025) to test our theory regarding the effect of a shock, consistent with Merton's (1987) concept of a strategic research event. Accordingly, we address the following research question: How did demand for LMFS evolve in the US from 2010 to 2023, and how did the evolution differ in urban versus rural areas?

We use data from NielsenIQ's Consumer Panel Dataset to measure demand for LMFS. Additionally, we utilize data from the Economic Research Service and the US Census Bureau to assign data to commuting zones – which group counties into regions reflecting local economies (US Department of Agriculture, 2019) – and develop a degree of ruralness measure. We employ a series of discontinuous growth models (Bliese and Lang, 2016) and find that urban consumers increased their demand for LMFS at a faster rate than rural consumers in the US. Additionally, controlling for ruralness, areas with lower demand in 2019 exhibited the greatest increase in 2020.

We make several theoretical contributions. First, we develop literature exploring spatial determinants of demand for LMFS by reconciling (Laudan, 1977) conflicting findings and establishing urban versus rural as a boundary condition (Makadok et al., 2018). Thus, we contribute to the last-mile SCM literature (e.g. Castillo et al., 2022; Rose et al., 2025) by identifying geographical areas in which to focus last-mile fulfillment network development and innovation. Second, we contribute to the literature exploring demand for LMFS by taking a longitudinal perspective, aligned with Miller et al.’s (2018) call to leverage growth models to answer a wider array of questions. We also extend the consumer-centric SCM literature (Esper et al., 2020) by demonstrating how differences in consumer behavior and preferences between urban and rural consumers (Esper and Peinkofer, 2017) inform supply chain strategy. In particular, we respond to a call to better understand how to structure firms' logistics operations according to consumer demands (Gao et al., 2026).

This research provides managerial insights to retailers, last-mile delivery providers, and commercial real estate firms. The findings highlight a need to focus on last-mile expansion and innovation in urban areas. This is especially important given last-mile challenges in urban areas (e.g. congestion (Rose et al., 2016), expensive real estate (Gibson et al., 2018)). Additionally, given a negative relationship between the demand for LMFS in 2019 and the increase in 2020, service providers should devise contingency plans for consumers' responses to shocks.

Consumer-centric SCM recognizes the importance of prioritizing consumers when designing supply chain services (Esper et al., 2020). The value of this perspective has grown with the rise of the Internet (Esper et al., 2020) and heightened consumer expectations (Daugherty et al., 2019), thus driving an increased focus on consumer issues in SCM (Baldi et al., 2024). We contribute by exploring demand for LMFS, with a focus on changes over time and heterogeneity across urban versus rural areas. Thus, this research broadens the context (Makadok et al., 2018) of the consumer-centric SCM literature and responds to a call to understand how to tailor SCM services – in this case, last-mile fulfillment networks – across consumer segments (Esper and Peinkofer, 2017).

Given the growth in e-commerce (US Census Bureau, 2023a), consumer-centric SCM researchers have explored last-mile delivery execution. Many of these studies focus on crowd-sourced delivery, exploring how to optimize cost and service performance (Castillo et al., 2018, 2022) as well as how to influence consumer perceptions through interactions with crowd-sourced drivers and platforms (Masorgo et al., 2023; Ta et al., 2018). Others focus on addressing last-mile challenges and have explored topics such as how to influence consumer adoption of parcel locker services (Rose et al., 2025). This literature is developing a comprehensive understanding of the tactical execution of last-mile delivery. However, the literature lacks an understanding of demand for such services, which might vary across rural versus urban areas and inform where to focus last-mile investments and innovation. This is especially important given varying last-mile challenges (Boyer et al., 2009); urban areas face higher real estate costs (Gibson et al., 2018), congestion, and routing constraints (Rose et al., 2020a), while rural areas face higher costs and longer delivery times (Roberson, 2021).

Some literature explores e-commerce use, which relates to demand for LMFS and, thus, can inform last-mile investment efforts. This literature explores spatial determinants of consumers' e-commerce use focused on the impact of whether consumers are from a rural or urban area and resides in SCM journals – specifically transportation journals – as well as other disciplines. Supplementary Materials Section I summarizes key studies. Anderson et al. (2003) proposed competing hypotheses (1) the innovation-diffusion perspective (e.g. Farag et al., 2006), whereby it is expected that urban consumers will display higher demand for LMFS (i.e. will be more likely to use e-commerce) based partly on education levels and the use of Internet for other purposes (Anderson et al., 2003), and (2) the efficiency perspective (e.g. Farag et al., 2006), whereby it is expected that rural consumers will display higher demand for LMFS as they have “the most to gain” from accessing the variety of goods available online (Anderson et al., 2003, p. 421). Mixed conclusions have been reached (see Supplementary Materials Section I), limiting our ability to effectively draw conclusions. Thus, we address several features of the literature to reconcile inconsistencies and develop actionable insights.

First, this literature mostly relies on survey and/or interview data. Thus, the measure of online shopping behavior (i.e. demand for LMFS) is retrospective and perceptual. Clarke et al. (2015) examined online shopping frequency with four categories: often, sometimes, rarely, and never. Options such as “often” or “sometimes” are left up to interpretation by the respondent (Bocklisch et al., 2012). Further, retrospective measures can be affected by recall bias (Tax et al., 1998). Therefore, validity may suffer because of the response process generating the data (Miller et al., 2021). We utilize transaction data, thereby measuring demand for LMFS more precisely.

Second, urban/rural measures primarily relate to where the consumer lives (e.g. Young et al., 2022). However, consumers often shop near their work (Shi et al., 2019). Consequently, basing the measure on the consumers' area of residence may affect results by not considering the overall area in which they shop. As will be explained, we account for this by conducting analyses at a commuting zone level.

Lastly, prior research is primarily cross-sectional (e.g. Cao et al., 2013; Song, 2022; Zhen et al., 2018). Given behavior can change over time (Miller et al., 2018; Swider et al., 2024), we use longitudinal data (Singer and Willett, 2003; Willett, 1989) to explore demand for LMFS over time. Further, as recognized by Young et al. (2022), an important shock that could shift the demand was the COVID-19 pandemic. Using transaction data, we build upon Young et al. (2022) to further understand how this shock changed demand for LMFS.

We draw from Argyres et al. (2019) and consider the impact of three types of costs relevant in our consumer context (Bigelow et al., 2019): adjustment costs, opportunity costs associated with using LMFS (i.e. shopping online for home delivery), and opportunity costs associated with not using LMFS (i.e. shopping in-person). While adjustment costs in a firm-level context are defined as “the costs and risks of moving from an existing strategic position to each of the alternative positions of imitating, differentiating, or exiting” (Argyres et al., 2015, p. 222), we conceptualize adjustment costs as the costs consumers incur to switch from traditional brick-and-mortar shopping to instead shopping online and using LMFS. We additionally draw from the innovation-diffusion and efficiency hypotheses (Anderson et al., 2003) and contextualize (Craighead et al., 2016; Johns, 2006) elements of these perspectives to engage in middle-range theorizing (Stank et al., 2017).

We first explain how we expect the rate of increase in demand for LMFS in the US during 2010–2019 to be moderated by the urban/rural nature of an area. While there are conflicting theoretical arguments (Anderson et al., 2003), we believe a stronger claim can be made that mechanisms (Astbury and Leeuw, 2010) consistent with the innovation-diffusion perspective will persist (Farag et al., 2006). First, adjustment costs (Argyres et al., 2015) of using LMFS are expected to be lower for urban than rural consumers as urban consumers tend to be younger, which is positively correlated with Internet and smartphone use (Pew Research, 2024). Thus, urban consumers have less difficulty relying on LMFS via shopping online.

Additionally, rural consumers should experience greater opportunity costs for adopting the use of LMFS. The primary opportunity cost is the delivery time incurred as compared to instantly possessing an item via shopping in-person. Rural consumers face longer delivery times, whereas highly concentrated (Rose et al., 2020b) urban consumers benefit from faster delivery (Gibson et al., 2018). The benefit of faster delivery is supported by research showing that faster delivery leads to higher sales (Fisher et al., 2019).

Moreover, urban consumers face higher opportunity costs of not utilizing LMFS (i.e. being a “late mover” (Argyres et al., 2019)). Urban consumers tend to have less time (Farag et al., 2006) but more monetary resources for shopping (Trovall, 2023). Thus, there is a cost of more time/effort spent shopping if urban consumers do not embrace LMFS. Additionally, urban consumers have lower personal vehicle ownership rates (Holian, 2020), reducing willingness to travel to stores (Ellickson et al., 2020) and increasing their burden for searching at brick-and-mortar retailers (Talukdar, 2008). Finally, urban congestion (Rose et al., 2017) makes accessing brick-and-mortar stores more difficult. Thus, using LMFS should improve urban consumers' shopping experience and ease of access (Seiders et al., 2000), heightening the opportunity cost of not utilizing LMFS. We therefore hypothesize:

H1.

In 2010–2019, urban areas increase demand for last-mile fulfillment services at a faster rate than rural areas.

Next, we explain how we expect levels of demand for LMFS prior to COVID-19 to relate to a jump in demand following the onset of the pandemic, conditional on the extent to which an area is urban versus rural. COVID-19-related challenges in the US, such as store closures (Kapner, 2020) and fear of contracting the virus (Mertens et al., 2020), should increase the use of LMFS overall. We expect areas with lower rates of demand for LMFS in 2019 will see larger increases in 2020 for several reasons. First, following the COVID-19 shock, consumers in areas with a previously lower degree of demand for LMFS should see a sharper decrease in the opportunity cost for adopting the use of LMFS due to widespread store closures (Kapner, 2020). Due to such closures, the typical benefit of quicker access to goods via shopping in stores (i.e. the opportunity cost associated with using LMFS of longer wait times for goods) was muted. Second, this shock should increase the opportunity costs associated with not using LMFS, as areas with lower existing demand for LMFS (i.e. lower use of online shopping) would see a greater decrease in the variety of goods they have access to given store closures (Kapner, 2020). Third, adjustment costs for adoption should decline more for areas that, prior to 2020, had lower rates of LMFS use. This is because many Americans were unemployed (US Employment and Training Administration, 2024) with an inability to socialize in-person due to stay-at-home orders (Mervosh et al., 2020), meaning typical adjustment costs related to moving down the e-commerce learning curve should be muted. Therefore, we hypothesize:

H2.

The areas with the lowest levels of demand for last-mile fulfillment services pre-COVID, holding constant an area's degree of ruralness, experience the largest percentage increase in demand after the onset.

Lastly, we explain why we expect urban areas in the US will display a greater jump in demand for LMFS than rural areas following the COVID-19 shock.[1] Urban consumers tend to be younger and have greater familiarity with the Internet (Pew Research, 2024), resulting in lower adjustment costs for using LMFS via online shopping. Further, urban consumers' lower rate of personal vehicle ownership (Holian, 2020) would make them more exposed to contracting COVID-19 from public transit, which should make using LMFS more attractive given that individuals in urban areas were also more concerned about contracting COVID-19 (Chauhan et al., 2021). Further, individuals in urban areas were more in favor of taking measures such as staying home to reduce virus spread (Chauhan et al., 2021). Based on their perspectives regarding the virus and mitigation measures, we expect that COVID-19's onset negatively impacted in-store shopping convenience (Seiders et al., 2000) more for urban consumers, increasing their opportunity costs associated with not using LMFS. We therefore posit:

H3.

Urban areas experience the largest percentage increase in demand for last-mile fulfillment services after the onset of the COVID-19 pandemic.

We rely on annual data from 2010–2023 for households in the US. We start with 2010 as only 4.4% of US retail sales were conducted online (US Census Bureau, 2023a), meaning demand for LMFS had not yet widely spread. Further, it avoids interference from the Great Recession (Rich, 2013). 2023 is the final year as this allows us to address our research questions and is the most recent data available at the time of this study. We obtain data from the NielsenIQ Consumer Panel Dataset, which has been employed in recent SCM research (e.g. Pan et al., 2023; Sodero, 2022). This dataset from a panel of around 60,000 US households provides data for each shopping trip made by a household (e.g. retail channel type, products purchased, total spent) as well as household characteristics (e.g. county of residence, demographics). To ensure adequate data coverage and address issues that could occur by measuring urban-rural at a residence location level (e.g. based on zip code) – which might not adequately reflect the area in which consumers shop (Shi et al., 2019) – our unit of analysis is the commuting zone by year.

Commuting zones group US counties into 741 regions to depict local economies that encompass areas where people live and work (US Department of Agriculture, 2019). Thus, it is likely that consumers shop in the zone in which they live, indicating that assigning a representation of the urban-rural makeup of that zone is an accurate reflection of a household's shopping environment. We thus link households to commuting zones based on the county. We remove commuting zones that do not have observations in every year of the study as zones that are missing a record in a year are unlikely to have many households contributing information in years that do have data, making it unlikely that the data is representative of the zone's population. During initial data analysis (Chatfield, 1985), two observations identified as outliers were removed (89 and 95% of trips were reportedly online). Removing 361 observations resulted in a balanced panel of 8,862 observations across 633 zones.

i indexes each commuting zone and t indexes the measurement occasion (year). Our dependent variable, demand for LMFS, is operationalized as a commuting zone's share of trips that were conducted via the online channel each year.[2] We pool all shopping trips within a commuting zone and calculate the proportion of trips in the online channel as follows:

(1)

We add 0.005 to each proportion (as 194 records are 0) and employ a logit transformation (Smithson and Verkuilen, 2006):

(2)

This transformation is preferred for studying variables that are proportions (Smithson and Verkuilen, 2006). Thus, LogitShareTripsOnline becomes the dependent variable.

The primary predictor of interest is the passage of time, split into two variables to model (1) the 2010–2019 slope and (2) the 2020 jump. The first predictor, Trend10to19, indicates the rate of change in demand for LMFS from 2010 to 2019. To enable testing H2, Trend10to19 is set equal to 0 in 2019–2023 and decreases by 1 unit each year prior to 2019. The second predictor, Jump20to23, is a dummy variable indicating that the observation is from the year 2020 (when COVID-19 hit) or later (i.e. it is equal to 1 in 2020–2023 and 0 otherwise). Supplementary Materials Section II summarizes how these variables are assigned.

The last predictor is a moderator, Rural̅, a continuous variable representing the commuting zone's degree of ruralness. It is sourced from the Economic Research Service (US Department of Agriculture, 2019), which assigns Rural-Urban Continuum codes at a county level ranging from 1 (most urban) to 9 (most rural). We utilize annual population data from the US Census Bureau to assign an annual weighted value of the rural-urban continuum for each commuting zone. Next, we average the rural-urban continuum for each commuting zone across 2010–2023 to ensure effects signify between-subject estimates (Certo et al., 2017). Rural̅ is grand-mean centered to improve interpretability.

Given the nature of Trend10to19, Jump20to23, and Rural̅ – which are exogenous and unlikely to be impacted by upstream predictors which would need to be controlled for (Cinelli et al., 2022) – omitted variable endogeneity concerns are reduced (Ketokivi and McIntosh, 2017). Furthermore, including control variables that reside theoretically downstream of focal predictors should be avoided to ensure theorized predictions map to empirical tests (Carlson and Wu, 2012; Miller and Kulpa, 2022), which necessitates that we be judicious in including controls. We control for one important factor: the presence of an Amazon fulfillment center (Amazon). Given Amazon's dominance in online retailing (Droesch, 2021) and its increasing presence across the US (Daleo, 2022), it is expected that its presence impacts demand for LMFS. We control for Amazon fulfillment centers because their presence reduces delivery time, subsequently increasing online shopping (Fisher et al., 2019). Data is sourced from MWPVL International, which provides information such as addresses and opening dates of Amazon facilities (MWPVL International Inc, 2023) and is employed in prior research (Ahmed et al., 2022). For each observation, Amazon equals 1 if the commuting zone had an Amazon fulfillment center during that year and 0 otherwise. Even if the fulfillment center opened in the fourth quarter, the observation is assigned a 1 given retail seasonality, with sales heavily concentrated toward the end of the year (US Census Bureau, 2023b).

Supplementary Materials Section III presents descriptive statistics. Supplementary Materials Section IV presents model-free evidence (Davis-Sramek et al., 2023) in support of the general upward trend in demand for LMFS and a jump in 2020, continuing through 2023.

We implement a series of discontinuous growth models (Bliese and Lang, 2016). While growth models enable an examination of whether there are changes over time and differences among commuting zones in the pattern of change, discontinuous growth models build upon these to capture a discontinuity affecting the change trajectory (Bliese and Lang, 2016). Accordingly, discontinuous growth models allow us to (1) explore predictors of the trajectory of demand for LMFS (Bliese and Ployhart, 2002) and (2) isolate the periods before and following COVID-19 (Bliese and Lang, 2016).

Following Singer and Willett's (2003) notation, we first specify the following unconditional discontinuous growth model:

(3)
(4)
(5)
(6)

The level-1 model (Equation (3)) represents the change process for commuting zones, including a slope for 2010–2019 (Trend10to19) and a discontinuity starting in 2020 (Jump20to23) (Bliese and Lang, 2016). The level-2 model (Equations 4–6) allows for differences across commuting zones in the level-1 parameters by incorporating random effects (ξ0i, ξ1i, and ξ2i). The composite unconditional model substitutes level-2 into level-1:

(7)

We allow the random effects to covary, and Equation (8) reports the variance-covariance matrix for Equation (7), indicating that the residuals from the level-2 model are normally distributed with a mean of 0 (Singer and Willett, 2003). The variances are along the diagonal, with covariances on the off-diagonals (Singer and Willett, 2003).

(8)

We next present the first-order terms model to test H2, with the following level-1 model:

(9)

The level-2 model includes Equations (4–6) plus fixed components:

(10)
(11)

Equations (10) and (11) specify that the effects of Amazon and Rural̅ do not vary by commuting zone, thereby entering only as fixed effects[3] (Bliese and Lang, 2016). This composite model tests H2:

(12)

Given that the random effects are consistent with the model in Equation (7), Equation (8) represents the variance-covariance matrix for Equation (12). As Trend10to19 equals 0 in 2019 (see Table B in Supplementary Materials Section II), the intercept represents the level of online shopping reliance in 2019 when all other right-hand side variables are zero. Thus, we test H2 by examining the covariance between the random effects for the intercept (ξ0i) and Jump20to23 (ξ2i). H2 predicts σ02 will be negative.

Finally, we present the interactions model to test H1 and H3, which allows the slope and discontinuity to change based on a commuting zone's degree of ruralness (Singer and Willett, 2003). The level-1 model is as follows:

(13)

The level-2 model includes Equations (4)–(6) and (10)–(11) and fixed components:

(14)
(15)

The composite model is as follows:

(16)

The variance-covariance matrix for Equation (16) is represented by Equation (8). H1 predicts γ50 will be negative. H3 predicts γ60 will be negative.

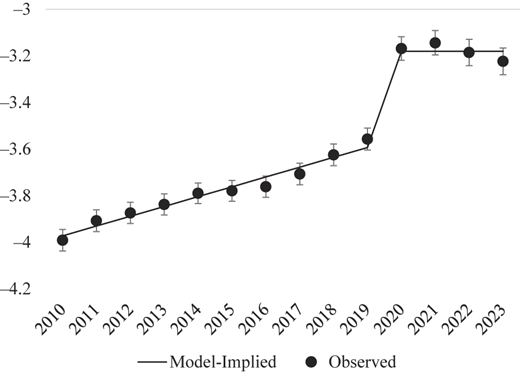
We tested our hypotheses via maximum likelihood estimation with robust standard errors utilizing the mixed command in SAS 9.4. Table 1 presents results. Model 1 reports results from a random intercepts model to calculate the intraclass correlation coefficient (ICC) of 0.309; 30.9% of the variation in the proportion of trips online resides between commuting zones, demonstrating the relevance of explaining such variation. Model 2 reports results from the unconditional discontinuous growth model Equation (7). Translating coefficients to percent form (Allison, 2012), Trend10to19 indicates that with each additional year from 2010–2019, there was a 4.3%[4] increase in the odds of shopping online. Jump20to23 indicates that the shock increased the odds of completing a shopping trip via the online channel by 50.7%. The model-implied change process is shown in Figure 1 along with the average share of trips in the online channel (on a logit scale) across the 633 commuting zones. The model-implied predictions fall within the 95% confidence intervals for the logit of the proportion estimates, suggesting our specification adequately approximates the mean vector, a necessity for growth curve models (Cudeck, 1996). It is noteworthy that the jump experienced in 2020 was sustained through 2023, suggesting a fundamental change occurred with online shopping and demand for LMFS.

Model 3 presents results from Equation (12). Supporting H2, the covariance between the random intercept and Jump20to23 is negative and significant (σ02 = −0.089, z-statistic = −6.49, p < 0.01); conditional on Amazon and Rural̅, there is a significant negative correlation between the level of online shopping reliance in 2019 and the jump that occurred in 2020 and was sustained through 2023. Converting the covariance, the correlation is −0.37. This indicates that commuting zones that displayed lower demand for LMFS in 2019 displayed the greatest jump in 2020.

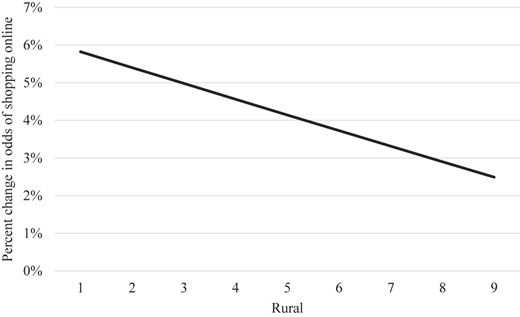
Model 4 reports results from Equation (16). Supporting H1, the interaction between Trend10to19 and Rural̅ is negative and significant (γ50 = −0.004, z-statistic = −2.13, p < 0.05). Figure 2 plots the marginal effect of Trend10to19 across the range of Rural̅. At the minimum of Rural̅ (i.e. the most urban commuting zones), the passage of each year from 2010 to 2019 resulted in a 5.9% increase in the odds of shopping online. In contrast, at the maximum of Rural̅ (i.e. the most rural commuting zones), the passage of each year from 2010–2019 resulted in a 2.5% increase in the odds of shopping online. Accordingly, the marginal effect of Trend10to19 was more than double in the most urban zones compared with the most rural zones, suggesting a managerially relevant moderation effect. This indicates that urban zones increased their demand for LMFS more quickly than rural zones during 2010–2019.

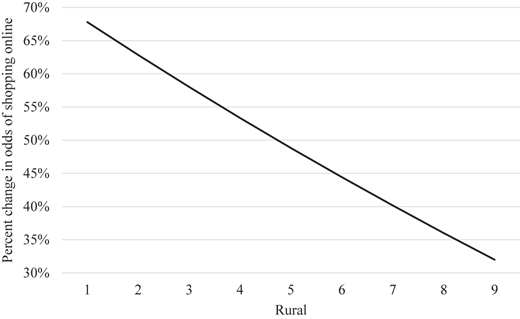
Supporting H3, the interaction between Jump20to23 and Rural̅ is negative and significant (γ60 = −0.030, z-statistic = −2.73, p < 0.01). Figure 3 plots the marginal effect of Jump20to23. At the minimum of Rural̅, the onset of COVID-19 resulted in a 68.4% increase in the odds of shopping online. In contrast, at the maximum of Rural̅, the onset of COVID-19 resulted in a 32.5% increase in the odds of shopping online. This is a practically relevant effect given that the most urban commuting zones saw an increase in the odds of shopping online that was nearly double what was observed in the most rural zones. This indicates that urban zones displayed a greater increase in demand for LMFS in 2020 than rural zones.

Two robustness tests resulted in consistent conclusions (see Supplementary Materials Section V).

In summary, results support all hypotheses. Urban consumers increased demand for LMFS more rapidly than rural consumers from 2010 to 2019 (supporting H1). We theorized this was because they experience fewer adjustment and opportunity costs for LMFS and higher opportunity costs for not using LMFS. Results from Table 1 Model 4 indicate that, from 2010 to 2019, the most urban areas saw a 67.1% increase in online shopping reliance, compared with just 25.3% for the most rural areas. Considering the jump in 2020, urban consumers increased demand for LMFS to a greater degree as urban commuting zones experienced the greatest percentage jump in online shopping reliance (supporting H3). Moreover, urban areas saw a greater jump in demand for LMFS in 2020, with the most urban areas seeing a 68.4% increase in the odds of online shopping beyond 2019 levels, compared with the most rural areas seeing just a 32.5% increase in the odds of online shopping beyond 2019 levels. What makes this especially interesting is that, holding constant rural-urban categorization and the presence of Amazon fulfillment centers, there was a negative relationship between 2019 levels of demand for LMFS and the jump in 2020 (supporting H2). The patterns regarding the increase held through the study timeframe ending in 2023 (see Figure 1).

We extend the literature exploring spatial determinants of e-commerce use and, accordingly, demand for LMFS focused on the differences between urban and rural consumers by reconciling conflicting findings. In doing so, we contribute to the consumer-centric last-mile SCM literature by expanding beyond the tactical execution focus (e.g. Castillo et al., 2022; Rose et al., 2025) to consider demand to prioritize last-mile networks and innovations. Results are consistent with the theory we postulate regarding the moderating impact of ruralness (H1 and H3) which, when coupled with the strength of the data we utilize vis-à-vis prior designs using perceptual survey measures (e.g. Clarke et al., 2015), reconciles anomalous findings (Laudan, 1977) and suggests assuming innovation-diffusion (Anderson et al., 2003) as the base case. Thus, this research builds upon the study of urban versus rural areas as a boundary condition (Makadok et al., 2018) of demand for LMFS.

Second, we take a longitudinal perspective to explore demand for LMFS over time by employing growth modeling, which is not commonly employed in SCM literature (Miller et al., 2018). Using discontinuous growth models (Bliese and Lang, 2016), we explore how an area's ruralness moderated the rate at which demand for LMFS increased over the 2010–2019 period (US Census Bureau, 2023a) as well as during the COVID-19 shock. The nuanced findings highlight the benefits of adopting a longitudinal theorizing perspective that can be tested with growth models (Miller et al., 2018), which we hope inspires wider use of growth models in SCM research.

Finally, we contribute to the growing (e.g. Confente et al., 2021; Kumar et al., 2023; Paluzzi et al., 2025) consumer-centric SCM literature (Esper et al., 2020) by developing a better understanding of the factors affecting demand for LMFS. In turn, the findings inform SCM decisions for retailers, last-mile delivery providers, and commercial real estate firms (see Section 7.2). Additionally, by exploring demand for LMFS over time in urban versus rural areas (H1 and H3), this research explores how to tailor SCM services to consumer segments (Esper and Peinkofer, 2017).

Given we find urban consumers increased demand for LMFS at a faster rate (H1), have shown higher levels of demand, and displayed the greatest demand jump in 2020 (H3), our findings indicate that US retailers should continue building out fulfillment networks near urban areas, as supported by previous research supporting the innovation-diffusion perspective (e.g. Song, 2022; Zhou and Wang, 2014). Similarly, the demand for LMFS in urban areas displayed by our empirical findings informs commercial real estate firms' placement of warehouses. These implications are especially important as cities are not seeing residents leaving like in 2020 (Overberg et al., 2023), indicating the demand seen in urban areas is likely to continue.

As consumers in urban areas are most likely to utilize LMFS, our results also support the need for continued innovation and research addressing urban logistics challenges (e.g. Rose et al., 2020a) and how to best serve urban consumers in the last-mile (e.g. Rose et al., 2025; Vakulenko et al., 2022). For example, retailers and last-mile service providers may continue to expand parcel lockers (Garland, 2025; Ranjbari et al., 2023) in urban areas to encourage more consumers to complete the final leg of the last-mile journey, thereby addressing complexity and congestion (Rose et al., 2020a) that providers endure. Additionally, to overcome real estate costs (Gibson et al., 2018) yet serve urban consumers quickly, retailers can consider utilizing stores as micro e-fulfillment centers (Young, 2022).

We next consider implications of the empirical finding that rural consumers increase demand for LMFS at a less rapid rate (H1) and to a lower degree than urban consumers. These results hold when controlling for the presence of an Amazon fulfillment center, indicating that the lower demand and slower increase are not a function of a lack of e-commerce infrastructure. Thus, expanding fulfillment offerings in rural areas would be unlikely to alter these findings. Accordingly, this suggests US retailers can continue focusing on brick-and-mortar offerings in rural areas to adequately serve customers. Retailers that have successfully expanded in rural areas include Dollar General (Delesline, 2024) and Petco (Jansen, 2022).

In addition to serving rural consumers via currently preferred means (i.e. brick-and-mortar stores), US retailers should consider influencing rural consumers to increase demand for LMFS. For example, hedonic motivation (i.e. enjoyment or fun) is a determinant of technology adoption (Childers et al., 2001; Venkatesh et al., 2012), indicating that retailers can consider creating an enjoyable online shopping experience for consumers, such as through livestream shopping (Achara, 2025). Similarly, the cost and benefit trade-off shapes technology use (Dodds et al., 1991; Venkatesh et al., 2012). Accordingly, retailers can aim to maximize the benefits of online shopping, such as by utilizing AI to provide tailored recommendations (Hewson et al., 2025). These efforts are especially important for pure e-commerce retailers to increase sales to consumers in rural areas, given that our empirical results indicate such consumers are less likely to shop online.

Lastly, we consider the implications of the empirical support for H2. Controlling for rural and urban categorization and the presence of an Amazon fulfillment center, areas with lower levels of demand for LMFS in 2019 experienced the greatest increase in demand in 2020. Thus, demand patterns changed. Thus, retailers must evaluate networks and offerings with real-time data to adjust to evolving consumer trends (McCarthy et al., 2022). These insights extend to other services and contexts. In the case of shocks that affect demand for services (e.g. buy-online-pickup-in-store (Kohan, 2023)), service providers cannot necessarily expect previous use patterns to hold. Thus, it is important to be prepared to expand offerings based on new demand patterns following shocks. When exploring how consumers may respond to a shock, managers can consider adjustment costs and opportunity costs (Argyres et al., 2019).

Considering limitations, given the way the transaction data is reported and the information provided, it is not clear whether all e-commerce is properly captured in the online channel data. However, given model-free evidence (see Supplementary Materials Section IV) consistent with expectations, any bias is consistent across years and should not impact conclusions. Similarly, some buy-online-pickup-in-store activity may be reported in the online channel data, indicating there is not a perfect 1:1 relationship between demand for LMFS and the way in which we operationalize this variable. However, our model-free evidence aligns with the overall trend observed in the US Census Bureau's (2023a) data regarding the percent e-commerce retail sales as a percent of total sales, and the majority of the variation in that data is driven by nonstore retailers (which require the use of LMFS), indicating that there is a strong validity claim (Miller et al., 2021) that these data represent our variable of interest. We are also unable to perfectly capture the environment in which a household shops, making the ruralness measure imperfect. Given that commuting zones capture where people live and work (US Department of Agriculture, 2019), however, it likely adequately captures their shopping environment.

While the observed patterns extend through 2023, this study can be extended to periods farther removed from the pandemic. Studies can also adopt growth models to explore additional predictors, such as other consumer characteristics that retailers could tailor to or additional geographic variables that impact retailers' and last-mile providers' networks. Similarly, research could explore whether predictors vary across product categories and/or types of online retailers to establish additional boundary conditions (Makadok et al., 2018). Additionally, studies could explore patterns of demand for LMFS in other countries. Finally, the methodological approach can be adapted to study behavior over time and in response to other shocks.

1.

This prediction and H2 are not inconsistent. These predictions are tested by different model parameters.

2.

Some trips in the online channel may be completed via buy-online-pickup-in-store (thus meaning there is not a perfect 1:1 relationship with demand for LMFS). However, our model-free evidence aligns with the overall trend observed in the US Census Bureau's (2023a) data regarding the percent e-commerce retail sales as a percent of total sales, and the majority of the variation in that data is driven by nonstore retailers (which require the use of LMFS), indicating that there is a strong validity claim (Miller et al., 2021) that these data represent our variable of interest.

3.

The term “fixed effect” is used here differently than the term is used in the econometrics literature when describing estimation of panel data models (Bell and Jones, 2015) per Singer and Willett (2003).

4.

The coefficient is translated to percent form following Allison (2012): 100×[exp(0.042)1].

The supplementary material for this article can be found online.

Achara
,
E.
(
2025
), “
QVC for Gen Z? Why women of all ages are embracing livestream shopping
”,
Wall Street Journal
,
available at:
 https://www.wsj.com/style/fashion/qvc-for-gen-z-why-women-of-all-ages-are-embracing-livestream-shopping-4f0d06e0
Ahmed
,
R.
,
Al Seesi
,
S.
and
Ruiz Sánchez
,
G.
(
2022
), “
Do online firms individualize search results? An empirical analysis of individualization on Amazon
”,
Journal of Theoretical and Applied Electronic Commerce Research
, Vol. 
17
No. 
3
, pp. 
1204
-
1218
, doi: .
Allison
,
P.D.
(
2012
),
Logistic Regression Using SAS: Theory and Application
, (2nd ed.) ,
SAS Pub
,
Cary, NC
.
Anderson
,
W.P.
,
Chatterjee
,
L.
and
Lakshmanan
,
T.R.
(
2003
), “
E-commerce, transportation, and economic geography
”,
Growth and Change
, Vol. 
34
No. 
4
, pp. 
415
-
432
, doi: .
Argyres
,
N.
,
Bigelow
,
L.
and
Nickerson
,
J.A.
(
2015
), “
Dominant designs, innovation shocks, and the follower's dilemma
”,
Strategic Management Journal
, Vol. 
36
No. 
2
, pp. 
216
-
234
, doi: .
Argyres
,
N.
,
Mahoney
,
J.T.
and
Nickerson
,
J.
(
2019
), “
Strategic responses to shocks: comparative adjustment costs, transaction costs, and opportunity costs
”,
Strategic Management Journal
, Vol. 
40
No. 
3
, pp. 
357
-
376
, doi: .
Astbury
,
B.
and
Leeuw
,
F.L.
(
2010
), “
Unpacking black boxes: mechanisms and theory building in evaluation
”,
American Journal of Evaluation
, Vol. 
31
No. 
3
, pp. 
363
-
381
, doi: .
Baldi
,
B.
,
Confente
,
I.
,
Russo
,
I.
and
Gaudenzi
,
B.
(
2024
), “
Consumer‐centric supply chain management: a literature review, framework, and research agenda
”,
Journal of Business Logistics
, Vol. 
45
No. 
4
, e12399, doi: .
Bell
,
A.
and
Jones
,
K.
(
2015
), “
Explaining fixed effects: random effects modeling of time-series cross-sectional and panel data
”,
Political Science Research and Methods
, Vol. 
3
No. 
1
, pp. 
133
-
153
, doi: .
Bigelow
,
L.
,
Nickerson
,
J.A.
and
Park
,
W.Y.
(
2019
), “
When and how to shift gears: dynamic trade‐offs among adjustment, opportunity, and transaction costs in response to an innovation shock
”,
Strategic Management Journal
, Vol. 
40
No. 
3
, pp. 
377
-
407
, doi: .
Bliese
,
P.D.
and
Lang
,
J.W.B.
(
2016
), “
Understanding relative and absolute change in discontinuous growth models: coding alternatives and implications for hypothesis testing
”,
Organizational Research Methods
, Vol. 
19
No. 
4
, pp. 
562
-
592
, doi: .
Bliese
,
P.D.
and
Ployhart
,
R.E.
(
2002
), “
Growth modeling using random coefficient models: model building, testing, and illustrations
”,
Organizational Research Methods
, Vol. 
5
No. 
4
, pp. 
362
-
387
, doi: .
Bocklisch
,
F.
,
Bocklisch
,
S.F.
and
Krems
,
J.F.
(
2012
), “
Sometimes, often, and always: exploring the vague meanings of frequency expressions
”,
Behavior Research Methods
, Vol. 
44
No. 
1
, pp. 
144
-
157
, doi: .
Boyer
,
K.K.
,
Prud’homme
,
A.M.
and
Chung
,
W.
(
2009
), “
The last mile challenge: evaluating the effects of customer density and delivery window patterns
”,
Journal of Business Logistics
, Vol. 
30
No. 
1
, pp. 
185
-
201
, doi: .
Cao
,
X.(J.)
,
Chen
,
Q.
and
Choo
,
S.
(
2013
), “
Geographic distribution of e-shopping: application of structural equation models in the Twin Cities of Minnesota
”,
Transportation Research Record
, Vol. 
2383
No. 
1
, pp. 
18
-
26
, doi: .
Carlson
,
K.D.
and
Wu
,
J.
(
2012
), “
The illusion of statistical control: control variable practice in management research
”,
Organizational Research Methods
, Vol. 
15
No. 
3
, pp. 
413
-
435
, doi: .
Castillo
,
V.E.
,
Bell
,
J.E.
,
Rose
,
W.J.
and
Rodrigues
,
A.M.
(
2018
), “
Crowdsourcing last mile delivery: strategic implications and future research directions
”,
Journal of Business Logistics
, Vol. 
39
No. 
1
, pp. 
7
-
25
, doi: .
Castillo
,
V.E.
,
Bell
,
J.E.
,
Mollenkopf
,
D.A.
and
Stank
,
T.P.
(
2022
), “
Hybrid last mile delivery fleets with crowdsourcing: a systems view of managing the cost‐service trade‐off
”,
Journal of Business Logistics
, Vol. 
43
No. 
1
, pp. 
36
-
61
, doi: .
Certo
,
S.T.
,
Withers
,
M.C.
and
Semadeni
,
M.
(
2017
), “
A tale of two effects: using longitudinal data to compare within- and between-firm effects
”,
Strategic Management Journal
, Vol. 
38
No. 
7
, pp. 
1536
-
1556
, doi: .
Chatfield
,
C.
(
1985
), “
The initial examination of data
”,
Journal of the Royal Statistical Society: Series A (General)
, Vol. 
148
No. 
3
, pp. 
214
-
253
, doi: .
Chauhan
,
R.S.
,
Capasso da Silva
,
D.
,
Salon
,
D.
,
Shamshiripour
,
A.
,
Rahimi
,
E.
,
Sutradhar
,
U.
,
Khoeini
,
S.
,
Mohammadian
,
A.K.
,
Derrible
,
S.
and
Pendyala
,
R.
(
2021
), “
COVID-19 related attitudes and risk perceptions across urban, rural, and suburban areas in the United States
”,
Findings
. doi: .
Childers
,
T.L.
,
Carr
,
C.L.
,
Peck
,
J.
and
Carson
,
S.
(
2001
), “
Hedonic and utilitarian motivations for online retail shopping behavior
”,
Journal of Retailing
, Vol. 
77
No. 
4
, pp. 
511
-
535
, doi: .
Cinelli
,
C.
,
Forney
,
A.
and
Pearl
,
J.
(
2022
), “
A crash course in good and bad controls
”,
Sociological Methods and Research
, Vol. 
53
No. 
3
, pp. 
1
-
34
, doi: .
Clarke
,
G.
,
Thompson
,
C.
and
Birkin
,
M.
(
2015
), “
The emerging geography of e-commerce in British retailing
”,
Regional Studies, Regional Science
, Vol. 
2
No. 
1
, pp. 
371
-
391
, doi: .
Confente
,
I.
,
Russo
,
I.
,
Peinkofer
,
S.
and
Frankel
,
R.
(
2021
), “
The challenge of remanufactured products: the role of returns policy and channel structure to reduce consumers' perceived risk
”,
International Journal of Physical Distribution and Logistics Management
, Vol. 
51
No. 
4
, pp. 
350
-
380
, doi: .
Cosgrove
,
E.
(
2023
), “
UPS will stop delivering to some rural neighborhoods as often, as it looks to slash costs
”,
Business Insider
,
available at:
 https://www.businessinsider.com/ups-rural-pilot-delivery-costs-fedex-amazon-2023-5
Craighead
,
C.W.
,
Ketchen
,
D.J.
and
Cheng
,
L.
(
2016
), “
Goldilocks' theorizing in supply chain research: balancing scientific and practical utility via middle-range theory
”,
Transportation Journal
, Vol. 
55
No. 
3
, pp. 
241
-
257
, doi: .
Cudeck
,
R.
(
1996
), “
Mixed-effects models in the study of individual differences with repeated measures data
”,
Multivariate Behavioral Research
, Vol. 
31
No. 
3
, pp. 
371
-
403
, doi: .
Daleo
,
J.
(
2022
), “
Amazon is doubling down on its warehouse strategy
”,
FreightWaves
,
available at:
 https://www.freightwaves.com/news/amazon-is-doubling-down-on-its-warehouse-strategy
Daugherty
,
P.J.
,
Bolumole
,
Y.
and
Grawe
,
S.J.
(
2019
), “
The new age of customer impatience: an agenda for reawakening logistics customer service research
”,
International Journal of Physical Distribution and Logistics Management
, Vol. 
49
No. 
1
, pp. 
4
-
32
, doi: .
Davis-Sramek
,
B.
,
Scott
,
A.
and
Richey
,
R.G.
(
2023
), “
A case and framework for expanding the use of model-free evidence
”,
Journal of Business Logistics
, Vol. 
44
No. 
1
, pp. 
4
-
10
, doi: .
Delesline
,
I.I.I.N.
(
2024
), “
Why Dollar General is winning with store count
”,
Retail Dive
,
available at:
 https://www.retaildive.com/news/dollar-general-store-count-growth-real-estate-target-walmart-big-lots/712995/
Dodds
,
W.В.
,
Monroe
,
K.В.
and
Grewal
,
D.
(
1991
), “
Effects of price, brand, and store information on buyers
”,
Journal of Marketing Research
, Vol. 
28
No. 
3
, pp. 
307
-
319
, doi: .
Droesch
,
B.
(
2021
), “
Amazon dominates US ecommerce, though its market share varies by category
”,
Insider Intelligence
,
available at:
 https://www.insiderintelligence.com/content/amazon-dominates-us-ecommerce-though-its-market-share-varies-by-category
Ellickson
,
P.B.
,
Grieco
,
P.L.E.
and
Khvastunov
,
O.
(
2020
), “
Measuring competition in spatial retail
”,
The RAND Journal of Economics
, Vol. 
51
No. 
1
, pp. 
189
-
232
, doi: .
Esper
,
T.
and
Peinkofer
,
S.
(
2017
), “
Consumer-based supply chain management performance research: a structured literature review
”,
Transportation Journal
, Vol. 
56
No. 
4
, pp. 
395
-
428
, doi: .
Esper
,
T.L.
,
Castillo
,
V.E.
,
Ren
,
K.
,
Sodero
,
A.
,
Wan
,
X.
,
Croxton
,
K.L.
,
Knemeyer
,
A.M.
,
DeNunzio
,
S.
,
Zinn
,
W.
and
Goldsby
,
T.J.
(
2020
), “
Everything old is new again: the age of consumer-centric supply chain management
”,
Journal of Business Logistics
, Vol. 
41
No. 
4
, pp. 
286
-
293
, doi: .
Farag
,
S.
,
Weltevreden
,
J.
,
van Rietbergen
,
T.
,
Dijst
,
M.
and
van Oort
,
F.
(
2006
), “
E-shopping in The Netherlands: does geography matter?
”,
Environment and Planning B: Planning and Design
, Vol. 
33
No. 
1
, pp. 
59
-
74
, doi: .
Fisher
,
M.L.
,
Gallino
,
S.
and
Xu
,
J.J.
(
2019
), “
The value of rapid delivery in omnichannel retailing
”,
Journal of Marketing Research
, Vol. 
56
No. 
5
, pp. 
732
-
748
, doi: .
Gao
,
C.
,
Peinkofer
,
S.T.
and
Griffis
,
S.E.
(
2026
), “
Are we delivering what customers want? Charting logistics service quality research—a process view
”,
Journal of Business Logistics
, Vol. 
47
No. 
1
, e70050, doi: .
Garland
,
M.
(
2025
), “
New York City to expand delivery locker initiative
”,
Supply Chain Dive
,
available at:
 https://www.supplychaindive.com/news/new-york-parcel-locker-expansion-lockernyc/761460/
Gibson
,
B.
,
Defee
,
C.
,
Ishfaq
,
R.
and
Davis-Sramek
,
B.
(
2018
), “
Urban fulfillment: the battle for city shoppers
”,
CSCMP’s Supply Chain Quarterly
,
available at:
 https://www.supplychainquarterly.com/articles/1809-urban-fulfillment-the-battle-for-city-shoppers
Hewson
,
A.
,
Vijayvergia
,
S.
and
Abrams
,
H.
(
2025
), “
Luxury brands tap AI to unlock growth
”,
Wall Street Journal
,
available at:
 https://deloitte.wsj.com/cfo/luxury-brands-tap-ai-to-unlock-growth-fbd6fcf8?gaa_at=
Holian
,
M.J.
(
2020
), “
The impact of urban form on vehicle ownership
”,
Economics Letters
, Vol. 
186
, 108763, doi: .
Jansen
,
C.
(
2022
), “
Petco opens first location of new rural store concept
”,
Retail Dive
,
available at:
 https://www.retaildive.com/news/petco-opens-first-new-rural-store-concept/625633/
Johns
,
G.
(
2006
), “
The essential impact of context on organizational behavior
”,
Academy of Management Review
, Vol. 
31
No. 
2
, pp. 
386
-
408
, doi: .
Kapner
,
S.
(
2020
), “
Coronavirus widens the retail divide: Macy's sales fall 45%, Best Buy slips 6%
”,
The Wall Street Journal
,
available at:
 https://www.wsj.com/articles/coronavirus-widens-retail-divide-leaving-macys-and-victorias-secret-behind-11590058503?mod=djemlogistics_h
Ketokivi
,
M.
and
McIntosh
,
C.N.
(
2017
), “
Addressing the endogeneity dilemma in operations management research: theoretical, empirical, and pragmatic considerations
”,
Journal of Operations Management
, Vol. 
52
, pp. 
1
-
14
, doi: .
Kohan
,
S.E.
(
2023
), “
Customers favor buy online pick up in store as U.S. holiday sales climb 5% over last year
”,
Forbes
,
available at:
 https://www.forbes.com/sites/shelleykohan/2023/01/11/customers-favor-buy-online-pick-up-in-store-as-us-holiday-sales-climb-5-over-last-year/
Kumar
,
P.
,
Hofer
,
A.R.
and
Peinkofer
,
S.
(
2023
), “
The role of scarcity-inducing post-stockout disclosures on consumer response to stockouts
”,
International Journal of Physical Distribution and Logistics Management
, Vol. 
53
No. 
9
, pp. 
946
-
966
, doi: .
Laudan
,
L.
(
1977
),
Progress and its Problems
,
University of California Press
,
Berkeley, CA
.
Makadok
,
R.
,
Burton
,
R.
and
Barney
,
J.
(
2018
), “
A practical guide for making theory contributions in strategic management
”,
Strategic Management Journal
, Vol. 
39
No. 
6
, pp. 
1530
-
1545
, doi: .
Masorgo
,
N.
,
Mir
,
S.
and
Hofer
,
A.R.
(
2023
), “
You're driving me crazy! How emotions elicited by negative driver behaviors impact customer outcomes in last mile delivery
”,
Journal of Business Logistics
, Vol. 
44
No. 
4
, pp. 
666
-
692
, doi: .
Matthews
,
B.
(
2022
), “
FedEx is cutting Sunday delivery in some rural markets starting the week of Aug. 15
”,
Washington Times
,
available at:
 https://www.washingtontimes.com/news/2022/jul/22/fedex-cutting-sunday-delivery-some-rural-markets-s/
McCarthy
,
B.
,
Baker
,
B.
,
Blask
,
R.
and
Adams
,
M.
(
2022
), “
Map a more customer-centric retail space
”,
Wall Street Journal
,
available at:
 https://deloitte.wsj.com/articles/map-a-more-customer-centric-retail-space-01669824453
Mertens
,
G.
,
Gerritsen
,
L.
,
Duijndam
,
S.
,
Salemink
,
E.
and
Engelhard
,
I.M.
(
2020
), “
Fear of the Coronavirus (COVID-19): predictors in an online study conducted in March 2020
”,
Journal of Anxiety Disorders
, Vol. 
74
, 102258, doi: .
Merton
,
R.K.
(
1987
), “
Three fragments from a sociologist's notebooks: establishing the phenomenon, specified ignorance, and strategic research materials
”,
Annual Review of Sociology
, Vol. 
13
No. 
1
, pp. 
1
-
29
, doi: .
Mervosh
,
S.
,
Lu
,
D.
and
Swales
,
V.
(
2020
), “
See which states and cities have told residents to stay home
”,
New York Times
,
available at:
 https://www.nytimes.com/interactive/2020/us/coronavirus-stay-at-home-order.html
Miller
,
J.W.
and
Kulpa
,
T.
(
2022
), “
Econometrics and archival data: reflections for purchasing and supply management (PSM) research
”,
Journal of Purchasing and Supply Management
, Vol. 
28
No. 
3
, 100780, doi: .
Miller
,
J.W.
,
Ganster
,
D.C.
and
Griffis
,
S.E.
(
2018
), “
Leveraging big data to develop supply chain management theory: the case of panel data
”,
Journal of Business Logistics
, Vol. 
39
No. 
3
, pp. 
182
-
202
, doi: .
Miller
,
J.
,
Davis‐Sramek
,
B.
,
Fugate
,
B.S.
,
Pagell
,
M.
and
Flynn
,
B.B.
(
2021
), “
Editorial commentary: addressing confusion in the diffusion of archival data research
”,
Journal of Supply Chain Management
, Vol. 
57
No. 
3
, pp. 
130
-
146
, doi: .
Morgeson
,
F.P.
,
Liu
,
D.
,
Cannella
,
A.A.
 Jr
,
Hillman
,
A.J.
,
Seibert
,
S.E.
and
Tushman
,
M.L.
(
2025
), “
This is an eventful era: exploring event-oriented approaches to organizational research
”,
Journal of Management
, Vol. 
51
No. 
3
, pp. 
953
-
966
, doi: .
MWPVL International Inc
(
2023
), “
Amazon global supply chain and fulfillment center network
”,
MWPVL.com
,
available at:
 https://mwpvl.com/html/amazon_com.html
Overberg
,
P.
,
McCormick
,
J.
and
Rust
,
M.
(
2023
), “
Exodus from America's big cities slowed last year
”,
Wall Street Journal
,
available at:
 https://www.wsj.com/articles/exodus-from-americas-big-cities-slowed-last-year-as-pandemic-receded-d6ae7006
Paluzzi
,
H.
,
Chen
,
H.
,
Howe
,
M.
,
Daugherty
,
P.J.
and
Tokar
,
T.
(
2025
), “
Consumer impatience in the e-commerce home delivery context: a consumer-centric supply chain perspective for time-based competition
”,
International Journal of Physical Distribution and Logistics Management
, Vol. 
55
No. 
1
, pp. 
1
-
21
, doi: .
Pan
,
X.
,
Mantin
,
B.
and
Dresner
,
M.
(
2023
), “
When the going gets tough, do the tough go shopping?
”,
Journal of Business Logistics
, Vol. 
44
No. 
1
, pp. 
61
-
79
, doi: .
Pew Research
(
2024
), “
Internet, broadband fact sheet
”,
Pew Research Center
,
available at:
 https://www.pewresearch.org/internet/fact-sheet/internet-broadband/
Ranjbari
,
A.
,
Diehl
,
C.
,
Dalla Chiara
,
G.
and
Goodchild
,
A.
(
2023
), “
Do parcel lockers reduce delivery times? Evidence from the field
”,
Transportation Research Part E: Logistics and Transportation Review
, Vol. 
172
, 103070, doi: .
Rich
,
R.
(
2013
), “
The Great recession
”,
Federal Reserve History
,
available at:
 https://www.federalreservehistory.org/essays/great-recession-of-200709
Roberson
,
C.M.
(
2021
), “
Population shifts away from urban areas to raise last-mile costs
”,
Journal of Commerce
,
available at:
 https://joc.com/article/population-shifts-away-urban-areas-raise-last-mile-costs_20210428.html
Rose
,
W.J.
,
Mollenkopf
,
D.A.
,
Autry
,
C.W.
and
Bell
,
J.E.
(
2016
), “
Exploring urban institutional pressures on logistics service providers
”,
International Journal of Physical Distribution and Logistics Management
, Vol. 
46
No. 
2
, pp. 
153
-
176
, doi: .
Rose
,
W.
,
Bell
,
J.
,
Autry
,
C.
and
Cherry
,
C.R.
(
2017
), “
Urban logistics: establishing key concepts and building a conceptual framework for future research
”,
Transportation Journal
, Vol. 
56
No. 
4
, pp. 
357
-
394
, doi: .
Rose
,
W.J.
,
Mollenkopf
,
D.A.
,
Autry
,
C.W.
and
Williams
,
B.D.
(
2020a
), “
Tailoring transportation planning decisions to diverse urban environments
”,
Decision Sciences
, Vol. 
51
No. 
4
, pp. 
920
-
961
, doi: .
Rose
,
W.J.
,
Ralston
,
P.M.
and
Autry
,
C.W.
(
2020b
), “
Urbanness and its implications for logistics strategy: a revised perspective
”,
Transportation Journal
, Vol. 
59
No. 
2
, pp. 
165
-
199
, doi: .
Rose
,
W.J.
,
Confente
,
I.
,
Peinkofer
,
S.T.
and
Russo
,
I.
(
2025
), “
Unlocking the door: information disclosure framing and consumer characteristics in parcel locker adoption
”,
International Journal of Physical Distribution and Logistics Management
, Vol. 
55
No. 
11
, pp. 
92
-
117
, doi: .
Seiders
,
K.
,
Berry
,
L.L.
and
Gresham
,
L.G.
(
2000
), “
Attention, retailers! How convenient is your convenience strategy?
”,
Sloan Management Review
, Vol. 
41
No. 
3
, pp. 
79
-
89
.
Shi
,
K.
,
De Vos
,
J.
,
Yang
,
Y.
and
Witlox
,
F.
(
2019
), “
Does e-shopping replace shopping trips? Empirical evidence from Chengdu, China
”,
Transportation Research Part A: Policy and Practice
, Vol. 
122
, pp. 
21
-
33
, doi: .
Singer
,
J.D.
and
Willett
,
J.B.
(
2003
),
Applied Longitudinal Data Analysis: Modeling Change and Event Occurrence
,
Oxford University Press
,
New York, NY
.
Smithson
,
M.
and
Verkuilen
,
J.
(
2006
), “
A better lemon squeezer? Maximum-likelihood regression with beta-distributed dependent variables
”,
Psychological Methods
, Vol. 
11
No. 
1
, pp. 
54
-
71
, doi: .
Sodero
,
A.C.
(
2022
), “
Good cause, not so good business? Sales and operations performance of cause-related marketing
”,
Journal of Business Logistics
, Vol. 
43
No. 
4
, pp. 
566
-
592
, doi: .
Song
,
Z.
(
2022
), “
The geography of online shopping in China and its key drivers
”,
Environment and Planning B: Urban Analytics and City Science
, Vol. 
49
No. 
1
, pp. 
259
-
274
, doi: .
Stank
,
T.P.
,
Pellathy
,
D.A.
,
In
,
J.
,
Mollenkopf
,
D.A.
and
Bell
,
J.E.
(
2017
), “
New frontiers in logistics research: theorizing at the middle range
”,
Journal of Business Logistics
, Vol. 
38
No. 
1
, pp. 
6
-
17
, doi: .
Swider
,
B.W.
,
Yang
,
J.
and
Wang
,
M.
(
2024
), “
The use of trajectories in management research: a review and insights for future research
”,
Journal of Management
, Vol. 
50
No. 
6
, pp. 
2012
-
2045
, doi: .
Ta
,
H.
,
Esper
,
T.L.
and
Hofer
,
A.R.
(
2018
), “
Designing crowdsourced delivery systems: the effect of driver disclosure and ethnic similarity
”,
Journal of Operations Management
, Vol. 
60
No. 
1
, pp. 
19
-
33
, doi: .
Talukdar
,
D.
(
2008
), “
Cost of being poor: retail price and consumer price search differences across inner-city and suburban neighborhoods
”,
Journal of Consumer Research
, Vol. 
35
No. 
3
, pp. 
457
-
471
, doi: .
Tax
,
S.S.
,
Brown
,
S.W.
and
Chandrashekaran
,
M.
(
1998
), “
Customer evaluations of service complaint experiences: implications for relationship marketing
”,
Journal of Marketing
, Vol. 
62
No. 
2
, pp. 
60
-
76
, doi: .
Torry
,
H.
(
2020
), “
Pandemic speeds Americans' embrace of digital commerce
”,
Wall Street Journal
,
available at:
 https://www.wsj.com/articles/pandemic-speeds-americans-embrace-of-digital-commerce-11605436200
Trovall
,
E.
(
2023
), “
The rural-urban income divide persists, and its may be widening
”,
Marketplace
,
available at:
 https://www.marketplace.org/story/2023/11/30/rural-urban-wage-gap-covid
US Census Bureau
(
2023a
), “
E-commerce retail sales as a percent of total sales
”,
FRED, Federal Reserve Bank of St. Louis
,
available at:
 https://fred.stlouisfed.org/series/ECOMPCTNSA
US Census Bureau
(
2023b
), “
Retail sales: electronic shopping and mail-order houses [MRTSSM4541USN]
”,
FRED
,
Federal Reserve Bank of St. Louis, available at:
 https://fred.stlouisfed.org/series/MRTSSM4541USN
US Department of Agriculture
(
2019
), “
Commuting zones and labor market areas
”,
Economic Research Service U.S. Department of Agriculture
,
available at:
 https://www.ers.usda.gov/data-products/commuting-zones-and-labor-market-areas/
US Employment and Training Administration
(
2024
),
“Initial claims
”,
FRED
,
Federal Reserve Bank of
 
St. Louis
,
available at:
 https://fred.stlouisfed.org/series/ICSA
Vakulenko
,
Y.
,
Arsenovic
,
J.
,
Hellström
,
D.
and
Shams
,
P.
(
2022
), “
Does delivery service differentiation matter? Comparing rural to urban e-consumer satisfaction and retention
”,
Journal of Business Research
, Vol. 
142
, pp. 
476
-
484
, doi: .
Venkatesh
,
V.
,
Thong
,
J.Y.
and
Xu
,
X.
(
2012
), “
Consumer acceptance and use of information technology: extending the unified theory of acceptance and use of technology
”,
MIS Quarterly
, Vol. 
36
No. 
1
, pp. 
157
-
178
, doi: .
Willett
,
J.B.
(
1989
), “
Some results on reliability for the longitudinal measurement of change: implications for the design of studies of individual growth
”,
Educational and Psychological Measurement
, Vol. 
49
No. 
3
, pp. 
587
-
602
, doi: .
Young
,
L.
(
2022
), “
More stores do double duty as distribution centers for online orders
”,
Wall Street Journal
,
available at:
 https://www.wsj.com/articles/more-stores-do-double-duty-as-distribution-centers-for-online-orders-11670519596
Young
,
M.
,
Soza-Parra
,
J.
and
Circella
,
G.
(
2022
), “
The increase in online shopping during COVID-19: Who is responsible, will it last, and what does it mean for cities?
”,
Regional Science Policy and Practice
, Vol. 
14
No. 
S1
, pp. 
162
-
178
, doi: .
Zhen
,
F.
,
Du
,
X.
,
Cao
,
J.
and
Mokhtarian
,
P.L.
(
2018
), “
The association between spatial attributes and e-shopping in the shopping process for search goods and experience goods: evidence from Nanjing
”,
Journal of Transport Geography
, Vol. 
66
, pp. 
291
-
299
, doi: .
Zhou
,
Y.
and
Wang
,
X.C.
(
2014
), “
Explore the relationship between online shopping and shopping trips: an analysis with the 2009 NHTS data
”,
Transportation Research Part A: Policy and Practice
, Vol. 
70
, pp. 
1
-
9
, doi: .
Published by Emerald Publishing Limited. This article is published under the Creative Commons Attribution (CC BY 4.0) licence. Anyone may reproduce, distribute, translate and create derivative works of this article (for both commercial and non-commercial purposes), subject to full attribution to the original publication and authors. The full terms of this licence may be seen at Link to the terms of the CC BY 4.0 licence.

Supplementary data

Data & Figures

Figure 1
A line graph illustrates the relationship between year and observed and model-implied predicted values for logit of online shopping proportion.The horizontal axis ranges from 2010 to 2023 in increments of 1 year. The vertical axis ranges from negative 4.2 to negative 3.0 in increments of 0.2 units. Two representations are shown: a continuous line for “Model-Implied” and circular markers for “Observed”. The first line represents “Model-Implied,” starts at (2010, negative 4.0), then increases gradually passing through (2011, negative 3.9), (2012, negative 3.85), (2013, negative 3.8), (2014, negative 3.75), (2015, negative 3.72), (2016, negative 3.7), (2017, negative 3.65), (2018, negative 3.6), (2019, negative 3.55), then rises sharply to (2020, negative 3.2), and remains nearly constant passing through (2021, negative 3.2), (2022, negative 3.2), to end at (2023, negative 3.2). The second series, marked by circles, represents “Observed”, starts at (2010, negative 4.0), then increases gradually passing through (2011, negative 3.9), (2012, negative 3.85), (2013, negative 3.8), (2014, negative 3.75), (2015, negative 3.73), (2016, negative 3.72), (2017, negative 3.68), (2018, negative 3.62), (2019, negative 3.55), then rises sharply to (2020, negative 3.2), and remains nearly stable passing through (2021, negative 3.2), (2022, negative 3.2), to end at (2023, negative 3.25). Note: All numerical data values are approximated.

Observed and model-implied predicted values for logit of online shopping proportion. Source(s): Authors' own work

Close modal
Figure 2
A line graph illustrates the relationship between rural levels and percent change in odds of shopping online.The horizontal axis is labeled “Rural” and ranges from 1 to 9 in increments of 1 unit. The vertical axis is labeled “Percent change in odds of shopping online” and ranges from 0 percent to 7 percent in increments of 1 percent. The solid line represents the trend in percent change. The line represents “Percent change in odds of shopping online”, starts at (1, 5.8 percent), then decreases steadily passing through (2, 5.4 percent), (3, 5.0 percent), (4, 4.6 percent), (5, 4.2 percent), (6, 3.7 percent), (7, 3.3 percent), (8, 2.9 percent), to end at (9, 2.5 percent). Note: All numerical data values are approximated.

Plot of the simple slope of Trend10to19 across the range of Rural̅. Note: Unlike in the analysis, the values of Rural̅ in the figure are not mean-centered. Source(s): Authors' own work

Close modal
Figure 3
A line graph illustrates the relationship between rural levels and percent change in odds of shopping online.The horizontal axis is labeled “Rural” and ranges from 1 to 9 in increments of 1 unit. The vertical axis is labeled “Percent change in odds of shopping online” and ranges from 30 percent to 70 percent in increments of 5 percent. The solid line represents the trend in percent change. The line represents “Percent change in odds of shopping online”, starts at (1, 68 percent), then decreases steadily passing through (2, 63 percent), (3, 58 percent), (4, 53 percent), (5, 48 percent), (6, 44 percent), (7, 40 percent), (8, 36 percent), to end at (9, 32 percent). Note: All numerical data values are approximated.

Plot of the simple slope of Jump20to23 across the range of Rural̅. Note: Unlike in the analysis, the values of Rural̅ in the figure are not mean-centered. Source(s): Authors' own work

Close modal
Table 1

Main results

LabelModel 1Model 2Model 3Model 4
Fixed effects     
  • Intercept

γ00−3.611*** (−221.82)−3.593*** (−157.78)−3.602*** (−156.23)−3.600*** (−153.82)
  • Trend10to19

γ10 0.042*** (13.05)0.042*** (12.77)0.042*** (12.40)
  • Jump20to23

γ20 0.413*** (18.74)0.410*** (18.43)0.408*** (17.87)
  • Amazon

γ30  0.054*** (3.54)0.013 (0.80)
  • Rural̅

γ40  −0.029*** (−3.44)−0.040*** (−3.24)
  • Trend10to19 × Rural̅

γ50   −0.004** (−2.13)
  • Jump20to23 × Rural̅

γ60   −0.030*** (−2.73)
Variance components     
  • Var. Intercept

σ020.145*** (15.31)0.276*** (14.94)0.268*** (14.86)0.268*** (14.87)
  • Var. Trend10to19

σ12 0.005*** (12.81)0.005*** (10.43)0.005*** (12.76)
  • Var. Jump20to23

σ22 0.217*** (12.52)0.217*** (12.51)0.213*** (12.45)
  • Cov. Trend10to19, Jump20to23

σ12 −0.008*** (−4.26)−0.008*** (−4.29)−0.009*** (−4.56)
  • Cov. Trend10to19, intercept

σ01 0.024*** (10.56)0.023*** (10.43)0.023*** (10.43)
  • Cov. Jump20to23, intercept

σ02 −0.085*** (−6.14)−0.089*** (−6.49)−0.090*** (−6.61)
  • Var. Residual

σϵ20.326*** (64.14)0.151*** (59.00)0.151*** (58.99)0.151*** (59.00)
Model fit     
  • −2 log likelihood

 16,453.55611,956.21111,936.01511,914.313
  • Pseudo R2

 0.1800.1950.199
Sample     
  • Observations

 8,8628,8628,8628,862
  • Number of groups

 633633633633

Note(s): Outcome: LogitShareTripsOnlinejt. Models were analyzed with robust standard errors. z-statistics are reported in parentheses; *p < 0.10, **p < 0.05, ***p < 0.01

Source(s): Authors' own work

Supplements

Supplementary data

References

Achara
,
E.
(
2025
), “
QVC for Gen Z? Why women of all ages are embracing livestream shopping
”,
Wall Street Journal
,
available at:
 https://www.wsj.com/style/fashion/qvc-for-gen-z-why-women-of-all-ages-are-embracing-livestream-shopping-4f0d06e0
Ahmed
,
R.
,
Al Seesi
,
S.
and
Ruiz Sánchez
,
G.
(
2022
), “
Do online firms individualize search results? An empirical analysis of individualization on Amazon
”,
Journal of Theoretical and Applied Electronic Commerce Research
, Vol. 
17
No. 
3
, pp. 
1204
-
1218
, doi: .
Allison
,
P.D.
(
2012
),
Logistic Regression Using SAS: Theory and Application
, (2nd ed.) ,
SAS Pub
,
Cary, NC
.
Anderson
,
W.P.
,
Chatterjee
,
L.
and
Lakshmanan
,
T.R.
(
2003
), “
E-commerce, transportation, and economic geography
”,
Growth and Change
, Vol. 
34
No. 
4
, pp. 
415
-
432
, doi: .
Argyres
,
N.
,
Bigelow
,
L.
and
Nickerson
,
J.A.
(
2015
), “
Dominant designs, innovation shocks, and the follower's dilemma
”,
Strategic Management Journal
, Vol. 
36
No. 
2
, pp. 
216
-
234
, doi: .
Argyres
,
N.
,
Mahoney
,
J.T.
and
Nickerson
,
J.
(
2019
), “
Strategic responses to shocks: comparative adjustment costs, transaction costs, and opportunity costs
”,
Strategic Management Journal
, Vol. 
40
No. 
3
, pp. 
357
-
376
, doi: .
Astbury
,
B.
and
Leeuw
,
F.L.
(
2010
), “
Unpacking black boxes: mechanisms and theory building in evaluation
”,
American Journal of Evaluation
, Vol. 
31
No. 
3
, pp. 
363
-
381
, doi: .
Baldi
,
B.
,
Confente
,
I.
,
Russo
,
I.
and
Gaudenzi
,
B.
(
2024
), “
Consumer‐centric supply chain management: a literature review, framework, and research agenda
”,
Journal of Business Logistics
, Vol. 
45
No. 
4
, e12399, doi: .
Bell
,
A.
and
Jones
,
K.
(
2015
), “
Explaining fixed effects: random effects modeling of time-series cross-sectional and panel data
”,
Political Science Research and Methods
, Vol. 
3
No. 
1
, pp. 
133
-
153
, doi: .
Bigelow
,
L.
,
Nickerson
,
J.A.
and
Park
,
W.Y.
(
2019
), “
When and how to shift gears: dynamic trade‐offs among adjustment, opportunity, and transaction costs in response to an innovation shock
”,
Strategic Management Journal
, Vol. 
40
No. 
3
, pp. 
377
-
407
, doi: .
Bliese
,
P.D.
and
Lang
,
J.W.B.
(
2016
), “
Understanding relative and absolute change in discontinuous growth models: coding alternatives and implications for hypothesis testing
”,
Organizational Research Methods
, Vol. 
19
No. 
4
, pp. 
562
-
592
, doi: .
Bliese
,
P.D.
and
Ployhart
,
R.E.
(
2002
), “
Growth modeling using random coefficient models: model building, testing, and illustrations
”,
Organizational Research Methods
, Vol. 
5
No. 
4
, pp. 
362
-
387
, doi: .
Bocklisch
,
F.
,
Bocklisch
,
S.F.
and
Krems
,
J.F.
(
2012
), “
Sometimes, often, and always: exploring the vague meanings of frequency expressions
”,
Behavior Research Methods
, Vol. 
44
No. 
1
, pp. 
144
-
157
, doi: .
Boyer
,
K.K.
,
Prud’homme
,
A.M.
and
Chung
,
W.
(
2009
), “
The last mile challenge: evaluating the effects of customer density and delivery window patterns
”,
Journal of Business Logistics
, Vol. 
30
No. 
1
, pp. 
185
-
201
, doi: .
Cao
,
X.(J.)
,
Chen
,
Q.
and
Choo
,
S.
(
2013
), “
Geographic distribution of e-shopping: application of structural equation models in the Twin Cities of Minnesota
”,
Transportation Research Record
, Vol. 
2383
No. 
1
, pp. 
18
-
26
, doi: .
Carlson
,
K.D.
and
Wu
,
J.
(
2012
), “
The illusion of statistical control: control variable practice in management research
”,
Organizational Research Methods
, Vol. 
15
No. 
3
, pp. 
413
-
435
, doi: .
Castillo
,
V.E.
,
Bell
,
J.E.
,
Rose
,
W.J.
and
Rodrigues
,
A.M.
(
2018
), “
Crowdsourcing last mile delivery: strategic implications and future research directions
”,
Journal of Business Logistics
, Vol. 
39
No. 
1
, pp. 
7
-
25
, doi: .
Castillo
,
V.E.
,
Bell
,
J.E.
,
Mollenkopf
,
D.A.
and
Stank
,
T.P.
(
2022
), “
Hybrid last mile delivery fleets with crowdsourcing: a systems view of managing the cost‐service trade‐off
”,
Journal of Business Logistics
, Vol. 
43
No. 
1
, pp. 
36
-
61
, doi: .
Certo
,
S.T.
,
Withers
,
M.C.
and
Semadeni
,
M.
(
2017
), “
A tale of two effects: using longitudinal data to compare within- and between-firm effects
”,
Strategic Management Journal
, Vol. 
38
No. 
7
, pp. 
1536
-
1556
, doi: .
Chatfield
,
C.
(
1985
), “
The initial examination of data
”,
Journal of the Royal Statistical Society: Series A (General)
, Vol. 
148
No. 
3
, pp. 
214
-
253
, doi: .
Chauhan
,
R.S.
,
Capasso da Silva
,
D.
,
Salon
,
D.
,
Shamshiripour
,
A.
,
Rahimi
,
E.
,
Sutradhar
,
U.
,
Khoeini
,
S.
,
Mohammadian
,
A.K.
,
Derrible
,
S.
and
Pendyala
,
R.
(
2021
), “
COVID-19 related attitudes and risk perceptions across urban, rural, and suburban areas in the United States
”,
Findings
. doi: .
Childers
,
T.L.
,
Carr
,
C.L.
,
Peck
,
J.
and
Carson
,
S.
(
2001
), “
Hedonic and utilitarian motivations for online retail shopping behavior
”,
Journal of Retailing
, Vol. 
77
No. 
4
, pp. 
511
-
535
, doi: .
Cinelli
,
C.
,
Forney
,
A.
and
Pearl
,
J.
(
2022
), “
A crash course in good and bad controls
”,
Sociological Methods and Research
, Vol. 
53
No. 
3
, pp. 
1
-
34
, doi: .
Clarke
,
G.
,
Thompson
,
C.
and
Birkin
,
M.
(
2015
), “
The emerging geography of e-commerce in British retailing
”,
Regional Studies, Regional Science
, Vol. 
2
No. 
1
, pp. 
371
-
391
, doi: .
Confente
,
I.
,
Russo
,
I.
,
Peinkofer
,
S.
and
Frankel
,
R.
(
2021
), “
The challenge of remanufactured products: the role of returns policy and channel structure to reduce consumers' perceived risk
”,
International Journal of Physical Distribution and Logistics Management
, Vol. 
51
No. 
4
, pp. 
350
-
380
, doi: .
Cosgrove
,
E.
(
2023
), “
UPS will stop delivering to some rural neighborhoods as often, as it looks to slash costs
”,
Business Insider
,
available at:
 https://www.businessinsider.com/ups-rural-pilot-delivery-costs-fedex-amazon-2023-5
Craighead
,
C.W.
,
Ketchen
,
D.J.
and
Cheng
,
L.
(
2016
), “
Goldilocks' theorizing in supply chain research: balancing scientific and practical utility via middle-range theory
”,
Transportation Journal
, Vol. 
55
No. 
3
, pp. 
241
-
257
, doi: .
Cudeck
,
R.
(
1996
), “
Mixed-effects models in the study of individual differences with repeated measures data
”,
Multivariate Behavioral Research
, Vol. 
31
No. 
3
, pp. 
371
-
403
, doi: .
Daleo
,
J.
(
2022
), “
Amazon is doubling down on its warehouse strategy
”,
FreightWaves
,
available at:
 https://www.freightwaves.com/news/amazon-is-doubling-down-on-its-warehouse-strategy
Daugherty
,
P.J.
,
Bolumole
,
Y.
and
Grawe
,
S.J.
(
2019
), “
The new age of customer impatience: an agenda for reawakening logistics customer service research
”,
International Journal of Physical Distribution and Logistics Management
, Vol. 
49
No. 
1
, pp. 
4
-
32
, doi: .
Davis-Sramek
,
B.
,
Scott
,
A.
and
Richey
,
R.G.
(
2023
), “
A case and framework for expanding the use of model-free evidence
”,
Journal of Business Logistics
, Vol. 
44
No. 
1
, pp. 
4
-
10
, doi: .
Delesline
,
I.I.I.N.
(
2024
), “
Why Dollar General is winning with store count
”,
Retail Dive
,
available at:
 https://www.retaildive.com/news/dollar-general-store-count-growth-real-estate-target-walmart-big-lots/712995/
Dodds
,
W.В.
,
Monroe
,
K.В.
and
Grewal
,
D.
(
1991
), “
Effects of price, brand, and store information on buyers
”,
Journal of Marketing Research
, Vol. 
28
No. 
3
, pp. 
307
-
319
, doi: .
Droesch
,
B.
(
2021
), “
Amazon dominates US ecommerce, though its market share varies by category
”,
Insider Intelligence
,
available at:
 https://www.insiderintelligence.com/content/amazon-dominates-us-ecommerce-though-its-market-share-varies-by-category
Ellickson
,
P.B.
,
Grieco
,
P.L.E.
and
Khvastunov
,
O.
(
2020
), “
Measuring competition in spatial retail
”,
The RAND Journal of Economics
, Vol. 
51
No. 
1
, pp. 
189
-
232
, doi: .
Esper
,
T.
and
Peinkofer
,
S.
(
2017
), “
Consumer-based supply chain management performance research: a structured literature review
”,
Transportation Journal
, Vol. 
56
No. 
4
, pp. 
395
-
428
, doi: .
Esper
,
T.L.
,
Castillo
,
V.E.
,
Ren
,
K.
,
Sodero
,
A.
,
Wan
,
X.
,
Croxton
,
K.L.
,
Knemeyer
,
A.M.
,
DeNunzio
,
S.
,
Zinn
,
W.
and
Goldsby
,
T.J.
(
2020
), “
Everything old is new again: the age of consumer-centric supply chain management
”,
Journal of Business Logistics
, Vol. 
41
No. 
4
, pp. 
286
-
293
, doi: .
Farag
,
S.
,
Weltevreden
,
J.
,
van Rietbergen
,
T.
,
Dijst
,
M.
and
van Oort
,
F.
(
2006
), “
E-shopping in The Netherlands: does geography matter?
”,
Environment and Planning B: Planning and Design
, Vol. 
33
No. 
1
, pp. 
59
-
74
, doi: .
Fisher
,
M.L.
,
Gallino
,
S.
and
Xu
,
J.J.
(
2019
), “
The value of rapid delivery in omnichannel retailing
”,
Journal of Marketing Research
, Vol. 
56
No. 
5
, pp. 
732
-
748
, doi: .
Gao
,
C.
,
Peinkofer
,
S.T.
and
Griffis
,
S.E.
(
2026
), “
Are we delivering what customers want? Charting logistics service quality research—a process view
”,
Journal of Business Logistics
, Vol. 
47
No. 
1
, e70050, doi: .
Garland
,
M.
(
2025
), “
New York City to expand delivery locker initiative
”,
Supply Chain Dive
,
available at:
 https://www.supplychaindive.com/news/new-york-parcel-locker-expansion-lockernyc/761460/
Gibson
,
B.
,
Defee
,
C.
,
Ishfaq
,
R.
and
Davis-Sramek
,
B.
(
2018
), “
Urban fulfillment: the battle for city shoppers
”,
CSCMP’s Supply Chain Quarterly
,
available at:
 https://www.supplychainquarterly.com/articles/1809-urban-fulfillment-the-battle-for-city-shoppers
Hewson
,
A.
,
Vijayvergia
,
S.
and
Abrams
,
H.
(
2025
), “
Luxury brands tap AI to unlock growth
”,
Wall Street Journal
,
available at:
 https://deloitte.wsj.com/cfo/luxury-brands-tap-ai-to-unlock-growth-fbd6fcf8?gaa_at=
Holian
,
M.J.
(
2020
), “
The impact of urban form on vehicle ownership
”,
Economics Letters
, Vol. 
186
, 108763, doi: .
Jansen
,
C.
(
2022
), “
Petco opens first location of new rural store concept
”,
Retail Dive
,
available at:
 https://www.retaildive.com/news/petco-opens-first-new-rural-store-concept/625633/
Johns
,
G.
(
2006
), “
The essential impact of context on organizational behavior
”,
Academy of Management Review
, Vol. 
31
No. 
2
, pp. 
386
-
408
, doi: .
Kapner
,
S.
(
2020
), “
Coronavirus widens the retail divide: Macy's sales fall 45%, Best Buy slips 6%
”,
The Wall Street Journal
,
available at:
 https://www.wsj.com/articles/coronavirus-widens-retail-divide-leaving-macys-and-victorias-secret-behind-11590058503?mod=djemlogistics_h
Ketokivi
,
M.
and
McIntosh
,
C.N.
(
2017
), “
Addressing the endogeneity dilemma in operations management research: theoretical, empirical, and pragmatic considerations
”,
Journal of Operations Management
, Vol. 
52
, pp. 
1
-
14
, doi: .
Kohan
,
S.E.
(
2023
), “
Customers favor buy online pick up in store as U.S. holiday sales climb 5% over last year
”,
Forbes
,
available at:
 https://www.forbes.com/sites/shelleykohan/2023/01/11/customers-favor-buy-online-pick-up-in-store-as-us-holiday-sales-climb-5-over-last-year/
Kumar
,
P.
,
Hofer
,
A.R.
and
Peinkofer
,
S.
(
2023
), “
The role of scarcity-inducing post-stockout disclosures on consumer response to stockouts
”,
International Journal of Physical Distribution and Logistics Management
, Vol. 
53
No. 
9
, pp. 
946
-
966
, doi: .
Laudan
,
L.
(
1977
),
Progress and its Problems
,
University of California Press
,
Berkeley, CA
.
Makadok
,
R.
,
Burton
,
R.
and
Barney
,
J.
(
2018
), “
A practical guide for making theory contributions in strategic management
”,
Strategic Management Journal
, Vol. 
39
No. 
6
, pp. 
1530
-
1545
, doi: .
Masorgo
,
N.
,
Mir
,
S.
and
Hofer
,
A.R.
(
2023
), “
You're driving me crazy! How emotions elicited by negative driver behaviors impact customer outcomes in last mile delivery
”,
Journal of Business Logistics
, Vol. 
44
No. 
4
, pp. 
666
-
692
, doi: .
Matthews
,
B.
(
2022
), “
FedEx is cutting Sunday delivery in some rural markets starting the week of Aug. 15
”,
Washington Times
,
available at:
 https://www.washingtontimes.com/news/2022/jul/22/fedex-cutting-sunday-delivery-some-rural-markets-s/
McCarthy
,
B.
,
Baker
,
B.
,
Blask
,
R.
and
Adams
,
M.
(
2022
), “
Map a more customer-centric retail space
”,
Wall Street Journal
,
available at:
 https://deloitte.wsj.com/articles/map-a-more-customer-centric-retail-space-01669824453
Mertens
,
G.
,
Gerritsen
,
L.
,
Duijndam
,
S.
,
Salemink
,
E.
and
Engelhard
,
I.M.
(
2020
), “
Fear of the Coronavirus (COVID-19): predictors in an online study conducted in March 2020
”,
Journal of Anxiety Disorders
, Vol. 
74
, 102258, doi: .
Merton
,
R.K.
(
1987
), “
Three fragments from a sociologist's notebooks: establishing the phenomenon, specified ignorance, and strategic research materials
”,
Annual Review of Sociology
, Vol. 
13
No. 
1
, pp. 
1
-
29
, doi: .
Mervosh
,
S.
,
Lu
,
D.
and
Swales
,
V.
(
2020
), “
See which states and cities have told residents to stay home
”,
New York Times
,
available at:
 https://www.nytimes.com/interactive/2020/us/coronavirus-stay-at-home-order.html
Miller
,
J.W.
and
Kulpa
,
T.
(
2022
), “
Econometrics and archival data: reflections for purchasing and supply management (PSM) research
”,
Journal of Purchasing and Supply Management
, Vol. 
28
No. 
3
, 100780, doi: .
Miller
,
J.W.
,
Ganster
,
D.C.
and
Griffis
,
S.E.
(
2018
), “
Leveraging big data to develop supply chain management theory: the case of panel data
”,
Journal of Business Logistics
, Vol. 
39
No. 
3
, pp. 
182
-
202
, doi: .
Miller
,
J.
,
Davis‐Sramek
,
B.
,
Fugate
,
B.S.
,
Pagell
,
M.
and
Flynn
,
B.B.
(
2021
), “
Editorial commentary: addressing confusion in the diffusion of archival data research
”,
Journal of Supply Chain Management
, Vol. 
57
No. 
3
, pp. 
130
-
146
, doi: .
Morgeson
,
F.P.
,
Liu
,
D.
,
Cannella
,
A.A.
 Jr
,
Hillman
,
A.J.
,
Seibert
,
S.E.
and
Tushman
,
M.L.
(
2025
), “
This is an eventful era: exploring event-oriented approaches to organizational research
”,
Journal of Management
, Vol. 
51
No. 
3
, pp. 
953
-
966
, doi: .
MWPVL International Inc
(
2023
), “
Amazon global supply chain and fulfillment center network
”,
MWPVL.com
,
available at:
 https://mwpvl.com/html/amazon_com.html
Overberg
,
P.
,
McCormick
,
J.
and
Rust
,
M.
(
2023
), “
Exodus from America's big cities slowed last year
”,
Wall Street Journal
,
available at:
 https://www.wsj.com/articles/exodus-from-americas-big-cities-slowed-last-year-as-pandemic-receded-d6ae7006
Paluzzi
,
H.
,
Chen
,
H.
,
Howe
,
M.
,
Daugherty
,
P.J.
and
Tokar
,
T.
(
2025
), “
Consumer impatience in the e-commerce home delivery context: a consumer-centric supply chain perspective for time-based competition
”,
International Journal of Physical Distribution and Logistics Management
, Vol. 
55
No. 
1
, pp. 
1
-
21
, doi: .
Pan
,
X.
,
Mantin
,
B.
and
Dresner
,
M.
(
2023
), “
When the going gets tough, do the tough go shopping?
”,
Journal of Business Logistics
, Vol. 
44
No. 
1
, pp. 
61
-
79
, doi: .
Pew Research
(
2024
), “
Internet, broadband fact sheet
”,
Pew Research Center
,
available at:
 https://www.pewresearch.org/internet/fact-sheet/internet-broadband/
Ranjbari
,
A.
,
Diehl
,
C.
,
Dalla Chiara
,
G.
and
Goodchild
,
A.
(
2023
), “
Do parcel lockers reduce delivery times? Evidence from the field
”,
Transportation Research Part E: Logistics and Transportation Review
, Vol. 
172
, 103070, doi: .
Rich
,
R.
(
2013
), “
The Great recession
”,
Federal Reserve History
,
available at:
 https://www.federalreservehistory.org/essays/great-recession-of-200709
Roberson
,
C.M.
(
2021
), “
Population shifts away from urban areas to raise last-mile costs
”,
Journal of Commerce
,
available at:
 https://joc.com/article/population-shifts-away-urban-areas-raise-last-mile-costs_20210428.html
Rose
,
W.J.
,
Mollenkopf
,
D.A.
,
Autry
,
C.W.
and
Bell
,
J.E.
(
2016
), “
Exploring urban institutional pressures on logistics service providers
”,
International Journal of Physical Distribution and Logistics Management
, Vol. 
46
No. 
2
, pp. 
153
-
176
, doi: .
Rose
,
W.
,
Bell
,
J.
,
Autry
,
C.
and
Cherry
,
C.R.
(
2017
), “
Urban logistics: establishing key concepts and building a conceptual framework for future research
”,
Transportation Journal
, Vol. 
56
No. 
4
, pp. 
357
-
394
, doi: .
Rose
,
W.J.
,
Mollenkopf
,
D.A.
,
Autry
,
C.W.
and
Williams
,
B.D.
(
2020a
), “
Tailoring transportation planning decisions to diverse urban environments
”,
Decision Sciences
, Vol. 
51
No. 
4
, pp. 
920
-
961
, doi: .
Rose
,
W.J.
,
Ralston
,
P.M.
and
Autry
,
C.W.
(
2020b
), “
Urbanness and its implications for logistics strategy: a revised perspective
”,
Transportation Journal
, Vol. 
59
No. 
2
, pp. 
165
-
199
, doi: .
Rose
,
W.J.
,
Confente
,
I.
,
Peinkofer
,
S.T.
and
Russo
,
I.
(
2025
), “
Unlocking the door: information disclosure framing and consumer characteristics in parcel locker adoption
”,
International Journal of Physical Distribution and Logistics Management
, Vol. 
55
No. 
11
, pp. 
92
-
117
, doi: .
Seiders
,
K.
,
Berry
,
L.L.
and
Gresham
,
L.G.
(
2000
), “
Attention, retailers! How convenient is your convenience strategy?
”,
Sloan Management Review
, Vol. 
41
No. 
3
, pp. 
79
-
89
.
Shi
,
K.
,
De Vos
,
J.
,
Yang
,
Y.
and
Witlox
,
F.
(
2019
), “
Does e-shopping replace shopping trips? Empirical evidence from Chengdu, China
”,
Transportation Research Part A: Policy and Practice
, Vol. 
122
, pp. 
21
-
33
, doi: .
Singer
,
J.D.
and
Willett
,
J.B.
(
2003
),
Applied Longitudinal Data Analysis: Modeling Change and Event Occurrence
,
Oxford University Press
,
New York, NY
.
Smithson
,
M.
and
Verkuilen
,
J.
(
2006
), “
A better lemon squeezer? Maximum-likelihood regression with beta-distributed dependent variables
”,
Psychological Methods
, Vol. 
11
No. 
1
, pp. 
54
-
71
, doi: .
Sodero
,
A.C.
(
2022
), “
Good cause, not so good business? Sales and operations performance of cause-related marketing
”,
Journal of Business Logistics
, Vol. 
43
No. 
4
, pp. 
566
-
592
, doi: .
Song
,
Z.
(
2022
), “
The geography of online shopping in China and its key drivers
”,
Environment and Planning B: Urban Analytics and City Science
, Vol. 
49
No. 
1
, pp. 
259
-
274
, doi: .
Stank
,
T.P.
,
Pellathy
,
D.A.
,
In
,
J.
,
Mollenkopf
,
D.A.
and
Bell
,
J.E.
(
2017
), “
New frontiers in logistics research: theorizing at the middle range
”,
Journal of Business Logistics
, Vol. 
38
No. 
1
, pp. 
6
-
17
, doi: .
Swider
,
B.W.
,
Yang
,
J.
and
Wang
,
M.
(
2024
), “
The use of trajectories in management research: a review and insights for future research
”,
Journal of Management
, Vol. 
50
No. 
6
, pp. 
2012
-
2045
, doi: .
Ta
,
H.
,
Esper
,
T.L.
and
Hofer
,
A.R.
(
2018
), “
Designing crowdsourced delivery systems: the effect of driver disclosure and ethnic similarity
”,
Journal of Operations Management
, Vol. 
60
No. 
1
, pp. 
19
-
33
, doi: .
Talukdar
,
D.
(
2008
), “
Cost of being poor: retail price and consumer price search differences across inner-city and suburban neighborhoods
”,
Journal of Consumer Research
, Vol. 
35
No. 
3
, pp. 
457
-
471
, doi: .
Tax
,
S.S.
,
Brown
,
S.W.
and
Chandrashekaran
,
M.
(
1998
), “
Customer evaluations of service complaint experiences: implications for relationship marketing
”,
Journal of Marketing
, Vol. 
62
No. 
2
, pp. 
60
-
76
, doi: .
Torry
,
H.
(
2020
), “
Pandemic speeds Americans' embrace of digital commerce
”,
Wall Street Journal
,
available at:
 https://www.wsj.com/articles/pandemic-speeds-americans-embrace-of-digital-commerce-11605436200
Trovall
,
E.
(
2023
), “
The rural-urban income divide persists, and its may be widening
”,
Marketplace
,
available at:
 https://www.marketplace.org/story/2023/11/30/rural-urban-wage-gap-covid
US Census Bureau
(
2023a
), “
E-commerce retail sales as a percent of total sales
”,
FRED, Federal Reserve Bank of St. Louis
,
available at:
 https://fred.stlouisfed.org/series/ECOMPCTNSA
US Census Bureau
(
2023b
), “
Retail sales: electronic shopping and mail-order houses [MRTSSM4541USN]
”,
FRED
,
Federal Reserve Bank of St. Louis, available at:
 https://fred.stlouisfed.org/series/MRTSSM4541USN
US Department of Agriculture
(
2019
), “
Commuting zones and labor market areas
”,
Economic Research Service U.S. Department of Agriculture
,
available at:
 https://www.ers.usda.gov/data-products/commuting-zones-and-labor-market-areas/
US Employment and Training Administration
(
2024
),
“Initial claims
”,
FRED
,
Federal Reserve Bank of
 
St. Louis
,
available at:
 https://fred.stlouisfed.org/series/ICSA
Vakulenko
,
Y.
,
Arsenovic
,
J.
,
Hellström
,
D.
and
Shams
,
P.
(
2022
), “
Does delivery service differentiation matter? Comparing rural to urban e-consumer satisfaction and retention
”,
Journal of Business Research
, Vol. 
142
, pp. 
476
-
484
, doi: .
Venkatesh
,
V.
,
Thong
,
J.Y.
and
Xu
,
X.
(
2012
), “
Consumer acceptance and use of information technology: extending the unified theory of acceptance and use of technology
”,
MIS Quarterly
, Vol. 
36
No. 
1
, pp. 
157
-
178
, doi: .
Willett
,
J.B.
(
1989
), “
Some results on reliability for the longitudinal measurement of change: implications for the design of studies of individual growth
”,
Educational and Psychological Measurement
, Vol. 
49
No. 
3
, pp. 
587
-
602
, doi: .
Young
,
L.
(
2022
), “
More stores do double duty as distribution centers for online orders
”,
Wall Street Journal
,
available at:
 https://www.wsj.com/articles/more-stores-do-double-duty-as-distribution-centers-for-online-orders-11670519596
Young
,
M.
,
Soza-Parra
,
J.
and
Circella
,
G.
(
2022
), “
The increase in online shopping during COVID-19: Who is responsible, will it last, and what does it mean for cities?
”,
Regional Science Policy and Practice
, Vol. 
14
No. 
S1
, pp. 
162
-
178
, doi: .
Zhen
,
F.
,
Du
,
X.
,
Cao
,
J.
and
Mokhtarian
,
P.L.
(
2018
), “
The association between spatial attributes and e-shopping in the shopping process for search goods and experience goods: evidence from Nanjing
”,
Journal of Transport Geography
, Vol. 
66
, pp. 
291
-
299
, doi: .
Zhou
,
Y.
and
Wang
,
X.C.
(
2014
), “
Explore the relationship between online shopping and shopping trips: an analysis with the 2009 NHTS data
”,
Transportation Research Part A: Policy and Practice
, Vol. 
70
, pp. 
1
-
9
, doi: .

Languages

or Create an Account

Close Modal
Close Modal