A data quality assessment framework (DQAF) is crucial in the foundational stages of composite indicators (CIs) construction by guaranteeing the selection of appropriate elementary indicators. While data quality components are rooted in UN Fundamental Principles of Official Statistics, different CI builders frequently utilize diverse criteria, with scant information regarding the cultivation of these components. This not only leads to diverse output but also prompts problems of justification.
This study, which focuses on a CI for public service delivery, utilized literature to identify 23 potential data quality components. Through the assessment of 19 experts, priority five components over the original 23 were: relevance, interpretability, methodological soundness, accuracy and statistical adequacy. An elaboration of these quality components, the quality criteria and associated scores ranging from 1 to 5 formed the DQAF. In application to service delivery data, an aggregated quality score below 2.0 served as a cut-off point for accepting elementary indicators into the initial list for CI construction.
The study's findings underscore the significance of a thoroughly documented DQAF, not only for CI construction, but also for its adaptability to different case studies, hence augmenting its application. The designed DQAF includes a dual orientation comprising two user-oriented (interpretability and relevance) and three producer-oriented (methodological soundness, accuracy and statistical adequacy) data quality components. This orientation connects data producers and users, offering a justification for indicators' selection and highlighting opportunities for enhancing data quality. The application of the DQAF to public service delivery led to the selection of 51 from 103 potential elementary indicators for the development of the relevant CI, with an overall acceptability rate of 48.6%.
The significance of expert participation in the formulation and implementation of the DQAF for a specific case study is emphasized to reduce subjectivity in scoring and guarantee thorough evaluations. The DQAF seeks to refine the selection process by addressing potential overlaps and redundancies in the chosen components, hence improving the overall quality and dependability of CIs. The approach to evaluate data quality proposed in this article is new and it is suggested for CI constructions in all subject fields.
1. Introduction
1.1 Measurement of service delivery
Establishing and sustaining high standards of service delivery is a fundamental objective of any nation. Although a universal metric for service delivery is absent, as illustrated by Amin and Chaudhury (2008) and Reinikka and Smith (2004), it is widely acknowledged that the interaction between providers and users is central to the assessment of this phenomenon. Through a synthesis of the positions of Organization for Economic Cooperation and Development [OECD] (2009) and Ministry of Local Government (2013), service delivery can be defined as any contact with the public administration during which citizens, residents or enterprises seek or provide data, handle their affairs or fulfill their duties. The policy research article by Fiszbein et al. (2016) from the World Bank emphasized that the governance of services is equally crucial to examine when evaluating public service delivery. In addition to governance systems and provider-recipient interactions, cross-sectional research, including service delivery surveys such as Uganda Bureau of Statistics [UBOS] (2021), World Bank (2013), Office of the Prime Minister (2020) and Tumushabe et al. (2010), has sought to assess service delivery using a diverse array of indicators from both providers and recipients. A comprehension review on the quality-of-service delivery in African countries has been recently published by Fernandez and Cheema (2025). The present study conceptualizes the measurement of service delivery as a multifaceted and data-intensive phenomenon due to the numerous stakeholders, interconnected iterative processes, extent of decision-making and consequences arising from complex interactions. This enables successful measurement of service delivery using composite indicators (CIs) (Rovan, 2025). Owing to this complexity, CI methodologies, utilizing statistical aggregation and ranking, provide effective means to capture and assess such a multifaceted and data-intensive phenomenon. Composite indexing entails mathematical aggregation of a collection of distinct indicators that measure multidimensional concepts but usually have no common units of measurement (Zhou and Ang, 2009; Saisana et al., 2005). Indeed, CIs have become increasingly significant in assessment of socio-economic phenomena related to service delivery, such as human development (United Nations Development Program [UNDP], 2024), access to services (Marozzi and Bolzan, 2018), Erasmus mobility effects (Fabbris and Scioni, 2021), frailty (Silan et al., 2022), social vulnerability (Tate, 2012), environment (Messer et al., 2014), sustainable development goals (SDGs) (Sachs et al., 2018), etc. We aimed to assess public service delivery in Uganda across five primary dimensions: education, health, water, agriculture and roads, utilizing high-quality data. This study consists of five sections: the introduction, which includes the relationship between service delivery measurement and the production of CIs; a description of the data quality assessment framework (DQAF) and a discussion of the data quality components (DCQs) utilized by various CIs. The second section outlines the technique for developing the DQAF and its use in evaluating and selecting fundamental indicators for incorporation into the CI for this case study. The third section delineates the study's outcomes, whilst the fourth section articulates the discussion. This study aims to develop and formalize a DQAF from both mathematical and participatory viewpoints to evaluate the quality of elementary indicators utilized in the creation of the service delivery CI.
1.2 Composite indicators
The construction of a CI is not a straightforward process (European Commission, Joint Research Centre and Organisation for Economic Co-operation and Development [OECD], 2008), which incites discussion regarding its design, the decisions required at each phase, the individuals responsible for measurement and crucially (though frequently overlooked) the nature and quality of data to be incorporated into the model. Albeit the methodological debates (Nardo et al., 2005), CIs remain vital due to their capacity to simplify complex measurement constructs and their political appeal, a reason for their enhanced uptake by global institutions and media (Greco et al., 2019). Along these lines, Jimenez-Fernandez and Ruiz-Martos (2020) asserted that the methodological choices taken by any CI builder should be explicitly recognized.
Discussions on data quality seek to guarantee that the CI is coherent and pertinent to decision makers while avoiding information overload. Accordingly, the OECD (2008) guideline of the ten steps to be followed in constructing CIs has been the model for many authors. These steps include: (1) developing a theoretical framework, (2) data selection, (3) imputation of missing data, (4) multivariate analysis, (5) normalization, (6) weighting and aggregation, (7) uncertainty and sensitivity analysis, (8) returning to the data, (9) links to other indices and (10) visualization of results. Despite the ten steps, several methodological decisions can be made within each step, leading to results that may not be similar since CIs are heavily dependent on how they were constructed especially during weighting and aggregation as asserted by Gan et al. (2017).
This study enhances and elaborates on the data selection process, a fundamental phase akin to the theoretical framework upon which all succeeding stages rely. A crucial aspect is that the quality of data input into the measurement system significantly affects the quality of the resulting CI (Ravetz and Funtowicz, 1990). Consequently, it is crucial to enhance the selection of data from a recognized DQAF, which is a system employed to compare current procedures with best practices (International Monetary Fund [IMF], 2006).
1.3 Data quality
Quality is the degree to which a set of inherent characteristics of an object fulfills requirements (International Standardization Organization [ISO], 2015). By extension, data quality fundamentally refers to the suitability of the data for its intended purpose and user requirements (Statistics Directorate of OECD, 2012; Uganda National Bureau of Standards [UNBS], 2012; Brackstone, 1999). Discussions regarding data quality involve specific terminology such as (1) DQAF, (2) data quality management, (3) case studies, (4) DCQs and (5) data quality criteria, which, for the purpose of this study, are described consistently by Veiga et al. (2017). Data quality assessment involves qualitatively and/or quantitatively judging the suitability of data for use in any specific context. In qualitative terms, it involves judging whether data are suitable for a specific use, whereas quantitative judgments are concerned with establishing quality levels. Therefore, (1) the DQAF provides a structure for comparing the statistical properties of available data with best practices or defined norms. Conversely, (2) data quality management entails actions (planning, control and assurance) to improve the data quality. Data quality control aims to improve data quality by preventing or correcting errors, whereas assurance aims to ensure that the data selected for use has sufficient quality for a specific purpose by filtering and excluding data lacking the desired quality. In addition, (3) each case study defines a delimitation of the scope of data quality requirements. For the purpose of this research, the case study is the construction of a CI for service delivery. It is important to clearly define a case study because the data quality requirements differ within and across specific applications. (4) DCQs are defined as relevant and measurable attributes used to characterize the quality (or lack of quality) of the data for a particular case study. Finally, (5) a criterion is a statement describing the acceptable data quality measures by which data are judged based on their suitability for the case study. OECD (2008) contended that the quality of the CI is primarily contingent upon two equally significant factors: the quality of the foundational data and the quality of the methodologies employed in constructing and disseminating the indicator. Consequently, CI builders must be mandated to create DQAFs to assess the quality of elementary indicators and data. Generally, DQAFs encapsulate data quality requirements and provide solutions to meet them (van de Berg et al., 2014). Through this assessment process, elementary indicators and data proposed for inclusion in the CI system should be subjected to certain criteria to assess their fitness for purpose. A synthesis of the literature, such as Terzi et al. (2021), Milanović et al. (2022), Booysen (2002), Salzman (2003), OECD (2008), Mazziotta and Pareto (2013), and Sachs et al. (2018), showed that agreement on DQAFs precedes the construction of the CI, as evidenced by the various DCQs developed by these CI builders.
1.4 Data quality components for a composite indicator
DCQs are rooted in the United Nations' Fundamental Principles of Official Statistics (IMF, 2006), a set of overarching governance principles at the apex of official statistics worldwide. Prominent organizations such as the IMF, OECD and Eurostat have embraced these ideas by developing codes of practice and associated guidelines to delineate the components of data quality that inform the design of data quality frameworks or evaluation methodologies. For clarity, DCQs are usually assembled into three or four tiers (International Monetary Fund, 2006; United Nations, 2019; European Statistical System Committee, 2017; Eurostat, 2019). An illustration of this grouping is the quality assurance framework of the European Statistical System, whose components are grouped into three tiers: (1) the institutional environment, (2) statistical processes and (3) statistical output (Eurostat, 2019). Three-tier data quality assessment systems require substantial technical skills and are prohibitively costly to rapidly adopt throughout the CI construction phase. Consequently, for CIs, regarding the categorization of DCQs into two groups, it can be asserted that only relative aspects may be presented to the DQAF, whereas the remainder is presumed to have been evaluated by the data providers. As a result, in this study, our application is focused on quality components grouped under the two tiers of the data production process and outputs. Since the choice of elementary indicators is sourced from official statistics, components related to institutional/governance systems are assumed to have been assessed by data producers. Consequently, this study considered the DCQs at the statistical process and output stages. Given that DCQs may be contextual, their working definitions should be elaborated. Table 1 shows a cross tabulation of the DCQs emerging from a search of the reference literature, their corresponding frameworks and the synthesized definitions used in this study. We derive these definitions borrowing and synthesizing from the 2018 United Nations Statistical Quality Assessment Framework, IMF Data Quality Assessment Framework, Uganda Standards for Statistics-942, 2012 Quality Framework and Guidelines for OECD Statistical Activities, 2017 European Statistics Code of Practice and Quality Assurance Framework of the European Statistical System 2.0.
More recent studies have further explored the importance and application of DQAFs in CI construction. For example, Papadimitriou et al. (2023) proposed a quality assessment framework specifically for environmental CIs, emphasizing the need for domain-specific adaptations. Their framework included components such as data relevance, accuracy, comparability and coherence. Similarly, Katsikis et al. (2023) developed a data quality framework for CIs in the tourism sector, highlighting the importance of timeliness, accessibility and interpretability as key quality dimensions. In the context of SDGs, Mendoza-Velazquez and Rowcliffe (2023) conducted a comprehensive analysis of data quality issues in SDG indicators, identifying gaps and challenges in areas such as data availability, comparability and methodological soundness; their study underscored the need for robust DQAFs to ensure the reliability and credibility of SDGs monitoring and reporting. Vilarinho et al. (2025) presented a new index to measure service quality in the water supply and treatment sector, emphasizing the importance of alignment with regulator preferences.
Table 1 illustrates the availability of several DQAFs in the literature. Determining the most appropriate DQAF for a certain case study is rarely straightforward because it may hinge on the paradigm, idiosyncrasies, convenience or expertise of the authors. Moreover, the DCQs utilized or suggested by various DQAFs were distributed across three tiers, making their application to this case study impractical.
Service delivery data are maintained in several formats and dispersed across numerous providers inside the National Statistical Systems (NSS), either as reports from surveys or as administrative data. This makes nationwide data quality assessments impractical, but rather sector-specific, or by case study, more realistic. In developing countries such as Uganda, several efforts have been made to assess data quality in general (UNBS, 2012). A case in point is the approval of the Uganda Standards for Statistics–942 and 943, as the national standard for data quality matters. Additionally, at the operational level, routine data quality assessments are conducted for administrative data in the health sector (Odeny et al., 2023; Lemma et al., 2020; Alipour and Ahmadi, 2017; Department of Health Statistics and Information Systems [HSI], 2011). However, in the literature, there is no accessible evidence of comprehensive data quality assessments in other sectors. This means that the quality of certain service delivery statistics remains uncertain in numerous specific case studies.
Considering this, it can be inferred that although the elements of the DQAFs proposed by different authors (Table 1) are sufficiently generic for application in diverse contexts, they were not designed for every multidimensional phenomenon or case study. An important point is that owing to the inherent quirks in data quality, the components must be assessed for the case study examined as Al-Salim et al. (2022) concluded that having one static framework with its dimensions is not suitable for emerging data challenges in Artificial Intelligence. Moreover, although there is a substantial body of literature available for producers regarding quality considerations, data users have restricted access to the DQAFs utilized for compiling not only CIs but also several other statistical metrics. It is evident that for each CI, a tailored DQAF that matches the theoretical framework of the phenomenon being evaluated must be developed. In the absence of a definitive DQAF, users may doubt the suitability of the chosen elementary indicators and whether the study's objective is sufficiently represented in the evaluated possibilities (van de Berg et al., 2014). To enable data quality assessments, it is essential to delineate pertinent DCQs and the corresponding DQAFs, thereby allowing consumers, researchers and providers to analyze and enhance the suitability of the data for its intended application.
1.5 Research questions
From the above considerations, the following research questions emerged. (1) What are the most relevant DCQs for assessing elementary indicators to be included in a CI for public service delivery? (2) How can a DQAF be formulated based on the identified components? (3) How can the formulated framework be applied to select appropriate elementary indicators for the CI?
From these questions, we defined research objectives. First, the identification of the most relevant DCQs through expert assessment for the case of a public service delivery CI. Then, the formulation of a DQAF based on the identified components and their quality criteria is followed by the application of the DQAF to evaluate and select appropriate elementary indicators for inclusion in the public service delivery CI.
While DCQs are well-established based on the UN Fundamental Principles of Official Statistics, different CI builders utilize diverse criteria with little documentation on how these components are cultivated for their specific case study. This leads to a lack of transparency and justification in the selection of elementary indicators.
This study introduces a novel DQAF that is formulated through a participatory approach involving experts. DQAF provides a systematic and documented way to identify relevant DCQs, define their quality criteria, and apply the framework to objectively evaluate and select appropriate elementary indicators for a specific CI case study. In addition, results show the application of the formulated DQAF as a tool for evaluating and selecting appropriate elementary indicators for CI construction in real-world contexts, i.e. for CI constructions in many fields. Table 2 provides a tabular form to visualize the novelties introduced by the approach proposed in this article.
2. Methodology
2.1 Data quality components identification
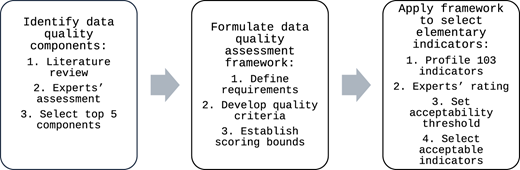
The construction of the DQAF for the CI intended to measure service delivery was performed in three phases. The initial phase entailed collaborative selection of the most pertinent components by 19 specialists in statistical methods who were proficient in data quality evaluations. The specialists comprised representatives from the National Statistics Office (13), Statistical Training Institutions (2), and Statistics Departments of Ministries and Agencies (4). The selection was intentional, as data quality concerns necessitate technical expertise and experience, as noted by van de Berg et al. (2014), who stressed that quality assessments are more effective when conducted by independent, esteemed experts. Additionally, the participatory approach and the choice of the 19 experts align with the assertions of Strong et al. (1997), who contended that quality cannot be assessed by producers exclusively, but it must also be defined by consumers who select and utilize products.
Figure 1 contains a flow chart of the research steps, which are then described in detail in this section of the article.
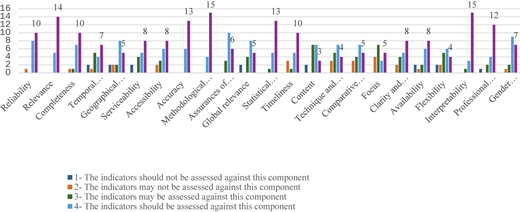
During the preliminary stage of its definition, the literature was examined to identify 23 prospective DQCs for the assessment of data quality. We established that there were significant overlaps in most of the DQCs that emerged from the literature search. Therefore, the experts were administered an instrument (see Appendix 1) containing the request to rate the 23 DCQs reported in Table 1, using a Likert scale (with scores from 1–elementary indicators should not be assessed against this component, to 5–elementary indicators must be assessed for this component). The frequencies were analyzed to identify the top five preferred components to customize the most suitable DQCs for this case study. The choice of only five components aligns with Chen and Lee (2021), who utilized five components in their study on the selection of good-quality data. These five components, together with the criteria were summarized in a matrix of statistical information, as shown by Weidema (1998).
Descriptive statistics, such as mean, standard deviation and variability ratio, were computed in addition to Cronbach's alpha to test the internal consistency of the results (reliability of the instrument). Correlation of the DCQs through the quality ratings of the elementary indicators was also performed to shed light on the association between the components.
2.2 Formulation of the data quality assessment framework
The second step involved formulating the DQAF. Therefore, for each of the top five DCQs identified in the previous phase, the case study (service delivery CI) data quality requirements are detailed, as shown in Table 3.
It is based on these identified requirements and the researchers' experience that quality criteria were built. Given that certain data points or elementary indicators may not fulfil all quality standards, it is essential to establish data quality levels with distinctly defined bounds. Bounds were constructed to characterize the quality of each elementary indicator/data point with respect to the case study. The criteria were categorized into five quality levels, each assigned one of the five numerical scores (1–5) that represent quality levels ranging from very good to very poor, in accordance with Chen and Lee (2021), Weidema (1998), and May and Brennan (2003). A 5 × 5 matrix was given, comprising a cross combination of the five DQCs as rows and their related quality criteria in five aligned columns associated with their scores. This generated matrix forms a DQAF for this case study.
2.3 Selection of the elementary indicators
The third stage involved the application of the formulated DQAF to identify and select elementary quality indicators. Since the goal is to construct a service delivery CI under the five dimensions of education, health, water, agriculture and roads, we collected and profiled 103 prospective elementary indicators (as shown in Appendix Table A2.1) for inclusion in the model. Profiling involved the documentation of metadata for every indicator/data point. The metadata for each indicator was sourced from reports in which the corresponding indicator and statistics were published. The documents encompass the 2022 National Service Delivery Survey, the 2022 Annual Health Sector Performance Report, the 2022 Ministry of Water and Environment Performance Report and the 2022 Uganda Police Force Crime and Traffic Report. Other sources, such as the Food and Agriculture Organization of the UN (FAO) and United Nations International Children's Emergency Fund (UNICEF) websites, were used to obtain metadata accordingly. Employing the DQAF, each elementary indicator was evaluated by three experts based on user experience to produce data quality ratings on a Likert scale with the following scores: 1 = true/observed, 2 = partially observed/true, 3 = not true/observed, 4 = not applicable/not sure, 5 = not accessed/not existing. A straightforward average rating was derived for each elementary indication. A choice was made to identify the qualifying elementary indicators that achieved a target quality score of less than 2.0. The World Health Organization (WHO) proposed the use of the target quality score to assess the quality of health data (WHO, 2022) as recommended by May and Brennan (2003). Moreover, the efficacy (acceptability) of this DQAF in relation to the specific case study was evaluated by calculating the descriptive statistics for each DCQ and the proportion of elementary indicators that achieved the goal quality score. The correlations of the ratings by the DQCs were analyzed to identify potential overlaps.
3. Results of the application of the methodology
3.1 Identification of data quality components by experts
The frequencies of ratings of the initial 23 DQCs by the 19 experts, as presented in Figure 2 and Table 4, show that the preferred DCQs are interpretability (15), methodological soundness (15), accuracy (13), relevance (14) and statistical adequacy (13). Contextualization divides the selected data-quality components into two categories: endogenous and exogenous. The endogenous category includes three DQCs concerned with the quality of data and their intrinsic worth, primarily related to data production activities. These included accuracy, adequacy and methodological soundness. The exogenous category consists of two DQCs, interpretability and relevance, which are related to how a user exploits the data. A combination of endogenous and exogenous categorization is intended to deliver a more accurate evaluation because it considers both the user and the producer.
According to Table 4, all DQCs are applicable to this case study, as determined by the experts. This is supported by the figures for the maximum ratings, which show that every component scored a maximum of 5. Low standard deviations (SD < 2) indicated low variability in the scores assigned for the DQCs. The results also showed that the five selected DQCs (in italic) had the greatest mean values and the lowest variability ratios, further indicating similar preferences by the experts.
Table 5 shows the internal consistency of the scores for the DQCs, with Cronbach's alpha value of 0.95. This finding indicates that DQCs are closely linked and more likely to measure the same construct. This finding is supported by the average inter-item covariance of 0.46, which indicates that the items share a moderate amount of variance.
Consequently, it can be concluded that the instrument utilized (Appendix A1) to capture the preferred DCQs for the case study is internally consistent and reliable.
3.2 Construction of the data quality assessment framework
The DQAF included five specified DQCs, as well as their development and suitable score boundary delineation. Table 6 presents the DQAF produced for the specific case study of service delivery.
3.3 Quality assessment of the elementary indicators
Three experts compiled the DQAF as elaborated in the assessment (Table 6), reviewing each of the case study's initial 103 elementary indicators (reported in Table A2.1 in Appendix 2). The average rating for the three experts was computed to form the final score for each elementary indicator, referring to the five dimensions of public service delivery of education, health, water, agriculture and roads. This resulted in the selection of 51 elementary indicators suitable for inclusion in the CI for service delivery (detailed ratings of these 51 selected items are reported in Table A2.2 in Appendix 2). To determine the performance of the developed DQAF with regard to the case study, the acceptability levels were computed as recommended by May and Brennan (2003), which showed an overall acceptability of 48.6%, differing across the five dimensions. The results shown in Table 7 indicate that slightly more than half of the original indicators possessed quality deficiencies for the case study, ultimately pointing to shortcomings in the NSS in addressing the production and use of statistics for any case study.
The lowest acceptability rate (31.3%) was found for elementary indicators related to the agriculture dimension, indicating the existence of many poor-quality indicators or a lack of sufficient data for measurements in this case study. The highest acceptability rate was observed for the water dimension of 62.5%.
The mean quality rating for elementary indicators in each dimension was 1.64 (the cut-off was set at 2.0); however, this varied slightly by dimension, with education having the best rating at 1.58 and roads, the worst, at 1.79. Considering all the elementary indicators, a variability ratio of 0.02 is obtained (a variability ratio<0.1 is considered good). Analogous to May and Brennan (2003), the combination of the low value of the variability ratio and a mean value lower than the cut-off shows that the adopted DQAF primarily selected indicators can be judged as good.
Correlation analysis of the average rating for each elementary indicator per DQC was performed, and the results are shown in Table 8.
Overall, there was a uniform and high correlation (ρxy > 0.70) among the three DQCs of accuracy, methodological soundness and adequacy. Coincidentally, these dimensions fall into the data-producer category. This means that elementary indicators that were found to be accurate or adequate were also characterized by methodological soundness. Conversely, the two DQCs in the data user category, relevance and interpretability, showed a higher level of correlation (0.76). The correlation between adequacy and relevance (0.45) and between adequacy and interpretability (0.51) was the weakest. These weak correlations can be evaluated in two ways. Firstly, following Odeny et al. (2023), who posited that a combination of DQCs with low correlation scores should measure distinct dimensions of data quality. Secondly, the low correlation scores for these data-quality components across the exogenous and endogenous categories highlight the disconnection between data generation and use. While a data producer may meet statistical standards for the development of an indicator, this does not always result in great usability for the utilizer. This evidence forms the basis for data producers to periodically conduct user satisfaction studies to address such disconnects.
From a methodological point of view, this study contributes to the literature on CI construction by demonstrating how data quality assessment can be systematically operationalized through a participatory and multidimensional framework, integrating both producer-oriented and user-oriented quality components. From a practical perspective, the findings provide guidance for policymakers, statistical agencies and researchers on improving the transparency, consistency and credibility of elementary indicator selection, while also identifying areas where NSS require further strengthening in data production and usability.
4. Discussion
CI builders are occasionally presented with a myriad of elementary indicators from which to choose, without considering all available information. This decision is sometimes influenced by DQCs and the criteria defined in Booysen (2002), Salzman (2003), and OECD (2008). In some circumstances, builders' experience informs the selection; in others, builders do not provide arguments for their decisions, which contradicts the objective of promoting transparency in the use of data. Different DQCs are available in the literature, but we discovered that there is some overlap among the proposed DQCs. As a result, all 23 DQCs proposed in the literature were given to a panel of 19 experts who chose the most relevant cognizant for the case study. The top five DCQs were elaborated in a 5 × 5 statistical information matrix, which helped overcome overlap issues by focusing on only five core DQCs and developing a clearly defined data quality information criterion. This structure served as the DQAF in this case study.
The DQAF is used in the development of a CI to assess public service delivery in Uganda, considering its five primary dimensions – education, health, water, agriculture and roads. The DQAF established in this study seeks to elucidate the quality dimensions of fundamental indicators suggested for incorporation into the CI formulation. Furthermore, it aids in selecting elementary indicators considered suitable for the case study according to the established data quality requirements. This DQAF was designed using a participative approach that considers the opinions of technical experts, political experts and stakeholders. This process improves the adaptability and ownership of a case study. The experts chose DQCs from this study that fell into two categories: those from the producer side (methodological soundness, accuracy and statistical adequacy) and those from the user side (interpretability and relevance). This choice aligns with the notion of quality fit because it enables quality assessment beyond data generation to data consumption. Consistent with Chen and Lee (2021), a more profound application of this DQAF may not only mitigate the apprehensions of data producers, including sampling errors, response rates and data sources, but also fulfil the expectations of data users regarding production timing versus necessity, presentation format, conceptual clarity and other related factors. The use of this DQAF facilitates a more stringent evaluation of the data quality and fundamental metrics essential for CI creation.
Benchmarks with prior studies, such as Papadimitriou et al. (2023), Katsikis et al. (2023), Odeny et al. (2023) and Vilarinho et al. (2025) validate the framework proposed in this article, especially similarities emerge in the emphasis on transparency and multidimensional quality assessment. Moreover, the novelty of our participatory and case-specific DQAF approach for CI construction emerges.
This study demonstrated that data quality is a multidimensional construct during the formulation of data quality information criteria, as the delineation of boundaries for each quality level and information criterion is heavily reliant on expert knowledge of the case study and statistical principles. This indicates that these bounds may fluctuate based on the user and evaluator. This study provided higher quality scores to elementary indicators that align with national and international development frameworks, such as the SDGs and those that yield annual data. This is due to the expectation that the established CI will be reproduced annually in other countries. Conversely, other constructors who may favor elementary indicators that correspond to a subnational program and receive monthly updates could need to allocate greater quality scores to these rudimentary indicators accordingly.
Data quality assessments can be performed both qualitatively and quantitatively, albeit with unavoidable subjective elements. Qualitative assessments are based on binary outcomes (yes/no) and are user-friendly, whereas quantitative assessments require substantial mathematical rigor and knowledge to assess the quality of an elementary indicator within a defined range. This renders quantitative evaluation, as employed in this study, a domain of statistical professionals. Considering that matters of data quality assurance require expert knowledge, it is proposed that several experts should be enlisted to conduct the assessments and then the results should be aggregated to obtain the overall rating/score. This diminishes subjectivity in evaluations, thereby improving the clarity and simplicity of CI formulation. This study developed a DQAF that can be used to assign quality scores from an educated and systematic perspective. The performance of the DQAF with respect to the case study was assessed at 48.6%, suggesting that the NSS can, on average, fulfil slightly less than half of the quality data requirements for the selected case study. Correlation analysis of the DCQs, derived from expert evaluations, was conducted to uncover overlapping concerns. This study suggests that DQCs exhibiting uniform or high correlations (for example, accuracy and methodological soundness) may be amalgamated, or alternative DQCs may be selected to further reveal the inherent data quality characteristics of the elementary indicators.
The developed DQAF provides a practical tool for national statistical offices, international organizations and researchers involved in constructing CIs across various domains. By following the systematic approach outlined in this study, they can objectively assess the quality of potential elementary indicators and justify their selection, enhancing the transparency and credibility of the CI construction process. Additionally, DQAF can be adapted and customized for specific case studies, ensuring the relevance of the quality assessment to the phenomenon being measured.
This study contributes to the theoretical understanding of data quality assessment in the context of CI development. It highlights the importance of a participatory approach involving experts in identifying relevant DCQs and defining their quality criteria. The dual orientation of the selected components, encompassing both producer-oriented and user-oriented perspectives, aligns with the notion of quality fit and addresses the potential disconnect between data generation and data usability. Furthermore, the correlation analysis of the DCQs provides insights into potential overlaps and redundancies, informing future refinements and optimizations of the DQAF.
Summarizing, the unique contributions of the present study to the existing literature are: first of all, the development of a participatory and case-specific DQAF for CI construction; the integration of both producer-oriented and user-oriented DCQs within a single framework; the use of explicit quality criteria and scoring rules to enhance transparency and reproducibility in elementary indicator selection; and the practical application and validation of the framework in the context of public service delivery measurement. Finally, it is important to highlight that the proposed approach can be broadly applied across different CI domains.
5. Conclusion
This study developed a DQAF for the evaluation and selection of elementary indicators to be used to build CIs. The DAQF was then applied to the case study of public service delivery. The proposed framework provides a systematic, transparent and replicable protocol that bridges the gap between the theoretical definition and the exploratory analyses phase in the process of CI building. The DAQF integrates data quality criteria and scoring rules. The involvement of experts in this process is crucial.
One key finding of the study is that the most relevant DCQs for the examined case study include both producer-oriented dimensions (accuracy, methodological soundness and statistical adequacy) and consumer-oriented dimensions (relevance and interpretability). This evidence demonstrated that high-quality data should both satisfy technical production standards and meet users' needs.
The application of the proposed DQAF to public service delivery in Uganda demonstrates its practical usefulness. Out of 103 candidate elementary indicators to be used to build a CI, only 51 satisfied the required quality threshold. The acceptability rate varied considerably across the five dimensions of service delivery considered for our case study: education, health, water, agriculture and roads. This poses a relevant challenge to the National Statistical Institute.
This study makes a contribution to the literature of CI construction by operationalizing data quality assessment for elementary indicators into a structured framework. It offers to policy makers, statistical agencies and researchers a replicable tool for improving transparency, consistency and credibility of CIs construction in various fields of application.
The study also identifies limitations and lines of future research. Since experts' judgment is essential for the evaluation process, some degree of subjectivity remains unavoidable despite the use of multiple evaluators and consistency checks. In addition, some DCQs may be correlated, suggesting potential overlaps and redundancy that future studies could address by exploring alternative selection procedures or dimensionality reduction techniques.
Overall, the study demonstrates that a clearly documented and context-sensitive DAQF can significantly improve methodological robustness, transparency and credibility in CI development, supporting improved data quality management and evidence-based decision-making.
The supplementary material for this article can be found online.