

This study aims to investigate how manufacturing firms can leverage digital platforms to drive digital servitization by actualizing the action potential offered by data. This process is vital for sustaining service growth in complex and evolving contexts.
Grounded in affordance theory and based on 23 semistructured interviews, this research uses a detailed case study of a manufacturer’s platform-based servitization. It explores the opportunities enabled by digital technologies, analyzing the platform’s evolution and the interplay between various affordances.
This study reveals that the perception and actualization of data affordances are shaped by supportive platform affordances. Furthermore, platform architecture evolves through a routinized yet punctuated pathway, driven by internal needs, customer feedback and emerging technologies.
For practitioners, this study offers guidance on achieving internal alignment and external coordination to transform data into actionable insights using digital platforms. It underscores the need to manage customer-centric platform development by prioritizing usability and phased digital transformation, thus avoiding overly advanced solutions that exceed industry readiness. It also denotes the need for manufacturers to align platform investments with both market demand and the availability of capable complementors, while overcoming internal hurdles by developing prototypes that demonstrate the tangible value of data-driven services.
With business-to-business marketing research increasingly focusing on the interplay of platforms and data, this study applies affordance theory to highlight how platform and data affordances interdependently enable digital servitization. It further shows that platform evolution is not only a structural backdrop but an active mechanism fostering cooperation in servitization.
1. Introduction
Servitization has become a central theme in business-to-business (B2B) marketing research and practice (Martín-Peña et al., 2020; Vilkas et al., 2022; Löfberg et al., 2025). It denotes the transformation of manufacturers from offering products to delivering outcome-based services (Wirtz and Kowalkowski, 2023). Increasingly, firms are investing in digital platforms to enable data-driven services, creating new opportunities for value co-creation and competitive advantage through digital servitization (Cenamor et al., 2017; Gebauer et al., 2020; Jovanovic et al., 2022; Ferreira and Lind, 2023). For example, Caterpillar has expanded into the digital realm with over 1.5 million assets connected to its Cat Connect platform, enabling real-time fleet-wide insights through improved uptime and productivity (Caterpillar Inc, 2025). In such shifts, connected equipment generates prolific operational data with embedded action possibilities for service growth (Kohtamäki et al., 2019; Ciasullo et al., 2021; Smania et al., 2024). Yet, data alone is insignificant in the pursuit of such growth. To translate data’s perceived value into actionable insights, firms rely on digital platforms both internally and externally. As this implementation is both complex and extended in time, understanding how platforms evolve is therefore critical (Cusumano et al., 2019) and among the key questions in B2B marketing research (Wirtz and Kowalkowski, 2023).
Digital platforms are intentionally designed architectures that leverage digital technologies to facilitate the exchange and integration of resources between multiple actors (Cusumano et al., 2019; Lusch and Nambisan, 2015). Hence, they provide connectivity while harnessing and overseeing digitized resources located beyond the firm’s boundaries (Gawer, 2021; Michel et al., 2023; Amawate, 2024; Deng et al., 2024; Sheng et al., 2024). Although research has examined how digital platforms contribute to servitization, the underlying platform dynamics are still not well known (Jovanovic et al., 2022) and represent an important opportunity for further research (Wirtz and Kowalkowski, 2023). Most marketing literature focuses on digital marketplaces in consumer settings, which are characterized by “winner-take-all-or-most” scenarios (Cusumano et al., 2019). Applying insights derived from consumer platforms to B2B contexts presents challenges as customers and other B2B actors are generally complex legal entities, each with diverse goals, resources and motivations (Springer et al., 2025).
In business markets, manufacturers face growing volumes and varieties of data that offer major opportunities for digital servitization, but these can only be realized if transformed into actionable insights (Tronvoll et al., 2020; Kristiansen and Aas, 2024). Simultaneously, many firms are increasingly cautious about sharing proprietary data (Hein et al., 2019; Smania et al., 2024), limiting service-growth opportunities. Manufacturers also contend with managing platform-based businesses alongside traditional pipeline operations, a challenge distinct from born-digital firms. Research indicates that most manufacturers struggle to launch and sustain their platforms successfully (Lerch and Heimberger, 2022). As a result, despite their potential, many companies find it difficult to establish and scale digital service offerings (Gebauer et al., 2020), which B2B marketing research also views as a major source of tensions that remain to be addressed (Smania et al., 2024).
We argue that this evidence highlights the gaps in our understanding of platform-based service growth, especially when compared to traditional manufacturing platforms (e.g. Sköld and Karlsson, 2013) and field service operations (e.g. Cohen and Lee, 1990). Several key questions arise:
How can manufacturing firms develop digital platforms for data-driven services?
What are the action possibilities offered by such platforms and their data?
How can data catalyze platform evolution and afford service innovation?
Taken together, we need a better understanding of how manufacturing firms can translate the perceived value of data into actionable insights through platforms (Springer et al., 2025; Wirtz and Kowalkowski, 2023).
Against this backdrop, the objective is to analyze the process by which manufacturers can leverage digital platforms to actualize the action potential offered by data, thereby driving digital servitization. We draw on affordance theory to explore the spectrum of opportunities a technology “affords” to its users (Gibson, 1979; Norman, 1999). Affordances represent action possibilities, outlining what actors with specific competencies and objectives can achieve with a given technology (Hutchby, 2001). Using an in-depth case study of a manufacturer pursuing platform-based servitization, we analyze the evolution of its digital platform and the roles and interplay between different types of affordances.
Our study makes two primary theoretical contributions to B2B marketing research. First, leveraging affordance theory, we explore platform evolution and data-driven servitization, aligning data and platform affordances with the cascading nature of technology affordances as discussed by Naik et al. (2020). We argue that the perception and realization of a technology’s affordances rely on the supportive affordances of another complementary technology. Specifically, our findings indicate that data affordances depend on the data aggregation and sharing affordances enabled by digital platforms. With these findings, our study contributes to B2B marketing research with its increasing focus on the interplay of data and platforms (Smania et al., 2024).
Second, we suggest that technological modifications in platform architecture often follow a platformization pathway (Lerch et al., 2024) that alternates between routinized and punctuated developments shaped by firm decisions. Such decisions may expand the ecosystem through external partner integration or adapt the platform’s architecture in response to internal needs, customer feedback or emerging technologies. These dynamics drive a mix of internal and external activities that collectively shape the platform’s gradual evolution, highlighting that platform evolution can be less systematic than suggested in prior servitization research. These findings provide valuable insights to the nascent research on platform evolution in business markets.
2. Literature review
Our study is situated at the intersection of three bodies of literature: digital servitization, digital platforms and technology affordances. We review each of these domains below.
2.1 Digital servitization
As manufacturing firms increasingly invest in advanced services and solutions, servitization has become one of the most active domains in B2B marketing research (e.g. Raddats et al., 2019; Wirtz and Kowalkowski, 2023; Löfberg et al., 2025). This research stream explores how companies evolve their offerings, business models and organizational structures to become service-oriented enterprises, achieving both short-term productivity and long-term growth (Vilkas et al., 2022). In recent years, service provision has become increasingly dependent on data and digital technologies (Ciasullo et al., 2021; Smania et al., 2024). The more data-intensive service provision becomes, the more efficient data exploitation is necessary (Opresnik and Taisch, 2015). Addressing this need, digital technologies have become critical for the development and sales of advanced services, affecting both back- and front-end activities and enabling customization and operational efficiency (Cenamor et al., 2017; Rapaccini et al., 2023).
These profound developments drive B2B marketing research and managerial focus toward digital servitization (Galvani and Bocconcelli, 2022; Chen et al., 2024; Favoretto et al., 2024; Zhang et al., 2025b), whereby manufacturers leverage data and digital technologies to gain deeper insights into customer needs and processes for enhancing their offerings and strengthening customer relationships (Tronvoll et al., 2020; Ciasullo et al., 2021; Smania et al., 2024; Zhou et al., 2024). While integrating servitization and digitalization is increasingly ubiquitous (Gebauer et al., 2020; Martín-Peña et al., 2020; Paschou et al., 2020), the growing importance of data and digital technologies has led to a digitally-based paradigm shift in manufacturing that is reflected in B2B marketing research (Ferreira and Lind, 2023; Kristiansen and Aas, 2024; Smania et al., 2024; Zhou et al., 2024; Zhang et al., 2025b). As part of this shift, digital service innovation arises at the intersection of technological and service innovation (Kowalkowski et al., 2024), with digital service defined as “an activity or benefit that one party can give to another, provided through a digital transaction” (Williams et al., 2008, p. 506).
Reflecting this evolution in manufacturing, digital servitization involves transformations of entire business models: among its effects are higher scalability of service offerings, reduced dependence on the physical materiality of products, decision-making centralization for more efficient operations, increased cooperation to compensate for insufficient digital competencies and disrupted power structures across industry levels (Ciasullo et al., 2021; Galvani and Bocconcelli, 2022; Chen et al., 2024; Lerch et al., 2024; Smania et al., 2024; Zhang et al., 2025b). Such all-encompassing effects of digital servitization have led to a growing interest in digital platforms, which are among the key areas of B2B marketing research that also offer important opportunities for further studies (Wirtz and Kowalkowski, 2023). Commonly conceptualized as technological architectures designed to facilitate the exchange and integration of resources, platforms allow coping with the increased complexity of digital service provision in ecosystems (Cenamor et al., 2017; Ferreira and Lind, 2023; Rapaccini et al., 2023; Favoretto et al., 2024; Zhou et al., 2024).
2.2 Digital platforms
Digital platforms are technologically mediated and intentionally designed to foster interactions between diverse stakeholders while supporting specific tasks (Cusumano et al., 2019; Gawer, 2021). They transform how firms create and capture value by enabling novel forms of digital services delivered in more intelligent and responsive ways (Lerch et al., 2024; Michel et al., 2023; Amawate, 2024; Deng et al., 2024; Sheng et al., 2024). By supporting both customer–provider exchanges and broader ecosystem orchestration, they bring together multiple stakeholders and can even redefine industry boundaries (Perks et al., 2017; Liu et al., 2023; Zhang et al., 2025a; Kowalkowski et al., 2024).
The description above primarily pertains to platforms in B2B contexts. While such platforms focus on orchestrating complex multi-actor ecosystems and supporting high-integration exchanges, B2C platforms typically exhibit stronger direct network effects, operate with large-scale user bases and emphasize standardized service interactions that prioritize convenience, personalization and a seamless customer experience (Hänninen et al., 2019). Moreover, B2C platforms generate value through mechanisms such as transaction fees, subscriptions and data-driven monetization models that depend on continuous user engagement and rapid scalability (Breidbach and Maglio, 2016). This approach contrasts with the relationship-intensive, co-development-focused value creation characteristic of B2B platforms.
In the B2B context, manufacturers initially developed internal product platforms around their installed bases (Gawer, 2014; Sandberg et al., 2020), integrating digital modules for data collection (Björkdahl, 2020) and introducing services such as monitoring and visualization to generate new revenue streams (Zhu and Furr, 2016). To provide higher-order services like optimization and autonomy, however, they needed to incorporate complementary external modules into their platforms (Constantinides et al., 2018), as much of the critical expertise resides outside firm boundaries – this shift increased reliance on diverse external ecosystem actors (Björkdahl, 2020). Accordingly, manufacturers aim to evolve product platforms into innovation platforms – foundations that integrate complementary services, products and technologies while offering developers accessible innovation capabilities (Gawer, 2014). This transformation is actively driven by deliberate managerial actions (Gawer and Cusumano, 2014). Crucially, the interfaces of innovation platforms must remain sufficiently open to ensure interoperability and enable such external integrations (Chen et al., 2022; Boudreau, 2010). Manufacturers implement adequate governance mechanisms into their platforms’ designs and architectures that can support such interoperability and incentivize the external collaborations necessary for driving platform-based service innovations (Springer et al., 2025).
Innovation platforms with extensive integration of manufacturers’ core products are referred to as solution enabler platforms in B2B markets (Springer et al., 2025). These platforms connect manufacturers and their physical assets – such as machinery and equipment – with service providers and end-users, facilitating data sharing and the co-delivery of tailored, modular innovations aligned with industrial needs. By doing so, they drive the “platformization” of B2B business models (Ritala and Jovanovic, 2024), enabling a shift from product-centric platforms to broader innovation ecosystems (Stonig et al., 2022).
Consequently, solution enabler platforms extend beyond operational support to act as enablers of servitization (Ulaga and Kowalkowski, 2022). They leverage extensive data sets and advanced technologies such as artificial intelligence (AI) (Jovanovic et al., 2022; Michel et al., 2023; Amawate, 2024; Deng et al., 2024; Zhang et al., 2025a), which makes ecosystem collaboration essential for managing both data quality and quantity (Gregory et al., 2021). Ecosystems allow firms to aggregate data from diverse customer equipment (Cenamor et al., 2017; Liu et al., 2023) and share insights with partners (Lerch et al., 2024; Zhang et al., 2025a), thereby enabling more advanced, data-driven service innovation (Agrawal et al., 2018). Such collaborations augment platform value as accumulated data improves service quality (Gregory et al., 2021; Sheng et al., 2024; Zhang et al., 2025a). For example, Caterpillar leverages data from its connected assets and dealers for advanced analytics, condition monitoring and proactive life cycle management to address evolving customer needs (Hogan, 2024). Such data-driven insights augment platform value and establish data as a key driver for innovation and customer relevance (Cenamor et al., 2017; Lerch et al., 2024), which B2B marketing research views among key topics in need of further research (Smania et al., 2024).
Servitization research, on the one hand, highlights that a platform’s evolution involves the systematic, gradual co-development of its technology architecture, services and governance (Jovanovic et al., 2022). On the other hand, such a transformation can also occur in stages, resulting from a complex interplay between sequences of transitions as captured by the notion of a “platformization pathway,” where manufacturers become increasingly platform focused (Lerch et al., 2024). From this perspective, platforms can be viewed as artifacts with specific technology affordances that enable service development (Bonina et al., 2021).
2.3 Technology affordances
Originating from Gibson’s (1979) work in ecological psychology, affordance initially described the potential actions an animal could take toward an object, emphasizing that humans perceive an object’s capabilities but must interact with it to reveal its actual action possibilities. In the context of information systems, Norman (1999) framed affordances as intrinsic properties of technology and its artifacts, with designs reflecting potential actions. Hutchby (2001) expanded the concept of technology affordances within the sociology of science and technology, defining them as the functional and relational characteristics of an object that frame – but do not strictly determine – the range of possible actions available to users. From this perspective, technologies are artifacts that simultaneously influence and are influenced by the practices humans adopt when interacting with, around and through them.
Majchrzak and Markus (2013) further conceptualized technology affordance as action potential, that is, what an individual or organization with a specific purpose can achieve using a technology or information system. This view aligns with Gibson’s dualist perspective, which underscores the inseparable link between the social and technical, suggesting that affordances emerge from the relationship between artifacts and their users (Volkoff and Strong, 2018). For instance, the affordance of a smartphone’s camera to capture high-quality photos and videos materializes only when the device interacts with its camera app to take a picture or record a video.
The literature distinguishes between two main types of affordances. Perceived affordances refer to the potential uses of an artifact as understood by users based on its appearance and physical characteristics, which guide its operation (Norman, 1999). In contrast, actualized affordances involve actions taken by users to use an artifact’s affordances to achieve specific goals, resulting in tangible outcomes (Strong et al., 2014). For example, a smartphone user may perceive the affordance of photography by recognizing that tapping the camera icon will open the app; this affordance is actualized when the user takes a picture.
Actualized affordances depend on various factors, including the artifact’s features, prior affordance actualizations, the complexity of actions, user skills and goals and organizational readiness and knowledge (Bernhard et al., 2013; Volkoff and Strong, 2013). Affordances also exhibit a cascading nature, where perceiving and actualizing lower-order affordances are prerequisites for recognizing and using higher-order affordances (Bloomfield et al., 2010; Strong et al., 2014).
Naik et al. (2020) applied such an affordance perspective when studying Internet of Things technologies for servitization, emphasizing their role in capturing action opportunities through the interaction between technological artifact features and goal-oriented actors. Their research broadened the focus from exploring technological features to investigating their application in developing services.
In this study, we expand the concept of technology affordance to understand how a manufacturing firm capitalizes on opportunities for platform-based data-driven servitization. Drawing on Strong et al. (2014), we propose that technology affordance also identifies required technological developments to enhance its abilities to support planned outcomes, necessitating specific organizational actions.
Digital platforms, viewed as technological artifacts (Cennamo, 2021), align well with the technology affordance perspective. Although affordance theory was not originally applied to intangible entities like data, Lawson (2017) argues that technological resources serving specific goals in personal or organizational contexts can be regarded as technological artifacts. Horsman (2019, p. 2) defines a digital artifact as a “digital object containing data which may describe the past, present, or future use or function of a piece of software, application, or device.” Since digital files containing data qualify as digital artifacts (Horsman, 2019), we conceptualize data generated by sensors, collected through platforms (Bilgeri et al., 2019) and used for innovation (Opresnik and Taisch, 2015) as digital technological artifacts. Consequently, such data can exhibit technology affordances. Hence, this study applies the technology affordance lens to both digital platforms and data, extending its established use in analyzing technology, features and outcomes (Zammuto et al., 2007). Our study contributes to B2B marketing research with its increasing focus on the interplay of platforms and data (Smania et al., 2024; Wirtz and Kowalkowski, 2023).
The relevance of the technology affordance perspective can be contrasted with the dynamic capability view. Technology affordances explain the potential value embedded in technology artifacts (Hutchby, 2001), such as data and digital platforms in our study, while dynamic capabilities explain the organizational mechanisms that can convert the potential of such artifacts into realized economic and strategic value (Teece, 2007). Technology affordances reveal what action possibilities a technology provides to actors; dynamic capabilities determine whether and how firms leverage these possibilities through sensing, seizing and reconfiguring. Together, technology affordances and dynamic capabilities can provide a micro-to-macro explanation of how firms translate their technological resources into competitive advantage. However, in this study, we emphasize the actor perspective to identify action possibilities enabled by specific technologies, such as data and digital platforms. Hence, we adopt the technology affordance perspective as our theoretical lens.
3. Research method, data collection and data analysis
Our focal firm, henceforth referred to as Transvectio, is a global leader in heavy vehicles and one of the earliest movers in developing digital service platforms. The firm introduced its first online portal in 2004, marking the beginning of its journey into data-driven service innovation by leveraging operational data from connected vehicles. Since then, it has continuously expanded its digital offerings, culminating in the launch of a new platform in 2022 that integrates ecosystem partners for data exchange and collaborative service development. We studied Transvectio over a period of 1.5 years and analyzed key stages of the firm’s platform development retrospectively to capture its historical evolution. This combination of retrospective and real-time analysis enabled us to examine and synthesize these stages in our Findings section to describe how the firm’s platform evolution and servitization advanced concurrently, and how it positioned itself as a frontrunner in its industry.
Our research design provides rich, detailed and context-specific insights into an under-researched phenomenon–servitization mediated by digital platforms. It enabled us to examine how the manufacturer engaged in platform evolution activities to enhance key affordances, thereby supporting advanced data analytics and facilitating the development of data-driven services.
3.1 Case selection and description
We carefully selected our case firm using the following theoretical sampling criteria: a manufacturer that:
is investing in platforms for digital servitization;
is pursuing ecosystem orchestration to achieve this objective; and
provides access to a sizeable informant base – with key informants from different functions and levels – to allow a comprehensive understanding of the phenomenon.
Transvectio is a leading manufacturer of heavy trucks that operates in more than 100 countries and employs over 50,000 people. Historically, the digital maturity in the industry has been low compared to industries such as materials handling or aviation. For example, even today, many large freight haulers schedule vehicle maintenance through manually operated databases. However, this is changing due to vehicle connectivity and the growth of third-party software providers offering platform-based data-driven services. The shifting competitive landscape has pushed original equipment manufacturers (OEMs) such as Transvectio to invest strategically in digitalization, not only for their manufacturing and product business but also for service operations. In the past decade, the compound annual growth rate of the service business has been around 10%, excluding 2020, when the onset of the COVID-19 pandemic temporarily disrupted performance. This disruption reflected an industry-wide challenge, as firms in the transportation sector remained heavily dependent upon on-site operations and were generally unprepared to deliver remote services to their customers. The situation highlighted the need for digital solutions and platform-based approaches to enhance service continuity and resilience. In response, to mitigate the risk of similar disruptions in the future, Transvectio expanded into the digital domain by launching its platform in 2022. This platform enabled the systematic collection and utilization of data, allowing the firm to deliver more advanced, data-driven and platform-based services to its customers.
3.2 Data collection
In October 2022, we initiated data collection to investigate platform-based servitization within the case firm. Guided by a primary informant overseeing a platform-based servitization project, we selected respondents from technical and commercial domains across organizational levels to capture both strategic and operational insights. Semistructured, in-depth interviews served as the primary method, allowing for flexibility in follow-up questions and detailed responses (Pawson, 1996). Snowball sampling identified additional respondents, including fleet managers from two major customers and senior managers from a data partner, enhancing triangulation and study rigor. Between March 2023 and July 2024, we conducted 23 interviews, ranging from 34 to 122 min, totaling 1,340 min in length (see Table 1). While most interviews were online, five were conducted in person, enabling informants to visually illustrate key data-driven processes underlying platform-based service innovation.
Informants and roles
| Organization | Role | Identifying code | Interview time (minutes) |
|---|---|---|---|
| Transvectio | |||
| Analytics team member | T9 | 81 | |
| Analytics team member | T16 | 45 | |
| Dealership team member | T14 | 81* | |
| Dealership team member | T15 | ||
| Director of mobility services | T1 | 50 | |
| Head of analytics | T13 | 29 | |
| Head of strategy | T10 | 65 | |
| Legislative officer | T2 | 54 | |
| Commercial product manager | T5 | 122 | |
| Commercial product manager | T7 | 65 | |
| Commercial product manager | T4 | 75 | |
| Commercial product manager | T18 | 66 | |
| Commercial product owner (digital platform development team member) | T12 | 100 | |
| Strategy manager | T8 | 59 | |
| Venture builder | T6 | 56 | |
| Venture builder | T17 | 59 | |
| Workshop product owner | T3 | 50 | |
| Workshop product manager | T11 | 54 | |
| Customers | |||
| Hauler A | Fleet manager | A1 | 38 |
| Hauler B | Fleet manager | B1 | 44 |
| Data partner | |||
| Chief executive officer | C1 | 79 | |
| Director of sales | C2 | 61* | |
| Product manager | C3 | ||
*These interviews were conducted with two informants simultaneously
A pre-developed interview guide structured the sessions, incorporating open-ended questions on data-driven service development, analytics, data sharing, platform ecosystems and governance. Follow-up questions ensured clarity and comprehensive insights, while informants were encouraged to contextualize their responses within the broader phenomenon of platform-based servitization. The guide evolved iteratively, adapting to each respondent’s expertise to deepen understanding.
To complement the interviews, we used secondary sources, including Transvectio’s annual reports, websites and news portals, to validate and enrich our findings. For instance, annual reports and press releases allowed cross-checking of the platform’s launch date and services offered, while online news revealed industry collaborations and events influencing platform evolution. These sources enhanced the reliability of our data and provided a comprehensive view of Transvectio’s platform development and servitization efforts.
3.3 Data analysis
We used thematic analysis to identify patterns and connections within the analytical themes of our data set (Gioia et al., 2013), aiming to develop an empirically grounded process framework for platform evolution aligned with data-driven servitization activities. The analysis followed a three-step approach widely used for qualitative interview data (Ben-Menahem et al., 2016; Sjödin et al., 2020).
As the first step, our approach commenced with verbatim transcription and analysis of the interviews. Each transcript was read multiple times, with notable phrases and passages related to our research themes marked and coded based on common words, phrases and terms mentioned by informants. This process identified 103 relevant quotes, which were reformulated into passive sentences and grouped into 36 first-order categories based on similarities. As one example of this first step, an informant’s quote, “We are actively working on, as well as encouraging partners, to develop functionality for our platform[…] We provide developers with our standard for the apps and services,” led to the first-order category “Coordinating complementary service development and enabling an efficient go-to-market process.”
As the second step, iterative analysis refined these categories into 12 second-order themes, representing higher abstraction levels and patterns linked to Transvectio’s servitization activities, platform evolution and data- and platform affordances. In this step, we extensively discussed the themes, revisiting both the data and literature to further refine the emerging themes. In this process, we especially aimed to ensure that the second-order themes reflect the underlying first-order categories. To continue with the above example, the first-order category “Coordinating complementary […]” was grouped under the second-order theme “Managing partners” as the most fitting for the underlying data of actively working with and encouraging partners in the development efforts.
As the third step, four aggregate dimensions were constructed to offer a theoretically and practically grounded categorization, aligning with organizational focus and technology affordances (see Figure 1). In this step, we carefully evaluated how the second-order themes related to each other, iteratively revisiting the first-order codes to determine if these still fit together. Continuing the above example, the second-order category “Managing partners,” together with the categories “Assembling partners” and “Customer experience management,” was categorized as “External orchestration” activities for platform evolution.
 The structured diagram is organised into three vertical columns titled first-order categories, second-order themes, and aggregated dimensions. The left column lists grouped bullet points under two vertical labels, platform evolution and technology affordances. Platform evolution includes first-order categories describing service orientation, strategy alignment, platform architecture, customer experience management, assembling partners, managing partners, resource sharing, and resource aggregation. These connect by arrows to second-order themes with the same titles. The themes are further connected to two aggregated dimensions labelled internal congruence and external orchestration. Technology affordances includes first order categories describing service availability, data monetisation, product usage tracking, and operational efficiency and effectiveness. These connect to corresponding second-order themes and then to aggregated dimensions labelled platform affordances and data affordances. Arrows visually indicate the relationships from left to right across the three columns.
Data structure
Source: Authors’ own work
The structured diagram is organised into three vertical columns titled first-order categories, second-order themes, and aggregated dimensions. The left column lists grouped bullet points under two vertical labels, platform evolution and technology affordances. Platform evolution includes first-order categories describing service orientation, strategy alignment, platform architecture, customer experience management, assembling partners, managing partners, resource sharing, and resource aggregation. These connect by arrows to second-order themes with the same titles. The themes are further connected to two aggregated dimensions labelled internal congruence and external orchestration. Technology affordances includes first order categories describing service availability, data monetisation, product usage tracking, and operational efficiency and effectiveness. These connect to corresponding second-order themes and then to aggregated dimensions labelled platform affordances and data affordances. Arrows visually indicate the relationships from left to right across the three columns.Data structure
Source: Authors’ own work
Our interviews revealed two distinct yet interconnected data categories. The first data set represents the firm’s platform evolution process and the internal/external collaboration activities. These activities help develop the technology (platform and data) affordances, represented by the second category of the data, which drive servitization. The resulting coding structure is depicted in Figure 1. NVivo was used for coding, and labels were refined collaboratively during joint analysis sessions.
4. Findings
Transvectio, a long-established vehicle manufacturer, traditionally focused on selling vehicles and providing on-demand maintenance services. This approach was not unique to the firm but reflected a common practice across the transportation industry. With the advent of digitalization, however, industry practices began to shift as firms started integrating digital services alongside their products – for example, remote vehicle monitoring and preventive maintenance – thus embracing servitization. Transvectio was no exception. Its management regarded servitization as a strategy to simultaneously support all operating vehicles and create new revenue streams, a view articulated by the director of mobility services (T1):
We have several hundred thousand connected vehicles out there. That is our addressable market. How do we do something for them?
Although the firm collected increasingly extensive operational data, identifying the potential of these data (i.e. data affordances) proved challenging, as explained by the head of the analytics team (T13):
I think the biggest problem is the literacy and understanding of what data truly represents. The operational flows generate data, which must be treated as a product with the same standards–stored with quality, shareable, and addressable–just like any other tangible product, not as the digital byproduct of processes.
Initially, the focus was on developing data-driven services to reduce customers’ operational costs, optimize product life cycles and enhance product uptimes based on operational data. However, our respondents made two critical observations that limited Transvectio’s planned service developments. First, understanding the service development opportunities leveraging operational data requires complementary external resources such as additional data sets and data analytics algorithms. To mitigate this, Transvectio’s data analytics team started identifying suitable complementary partners for collaboration.
Second, Transvectio’s existing monolithic fleet management portal (launched in 2004) was insufficient for acquiring and aggregating data sets and algorithms from external complementors. It also lacked the flexibility to ensure uninterrupted service accessibility for customers during platform updates, leading to service downtime. To overcome these limitations, Transvectio has undertaken a gradual transformation of its platform architecture into a dynamic, flexible system capable of integrating internal and external resources.
This redesign aimed to support both basic and advanced data analytics, enabling the discovery of data affordances for developing new data-driven services and enhancing existing ones without disrupting customer access. Throughout this process, Transvectio retained ownership of the platform, acting as the central orchestrator for all platform-based activities. Table 2 outlines an overview of the key stages of Transvectio’s platform’s evolution.
Key stages of Transvectio’s platform evolution with timeline
| Period | Key development stages | Focus |
|---|---|---|
| 2004–2012 | Launch of the first online fleet management portal and initiation of digital services based on vehicle data | Introduction of tachograph services and vehicle monitoring reports |
| 2012–2016 | Launch of fleet management services (FMS) mobile application | Expansion of connected vehicles and FMS user base |
| 2017–2021 | Migration of the fleet management portal and services to the cloud | Strengthened external connectivity; growth in connected vehicles from <100,000 to 450,000 |
| 2022–2024 | Launch of the Transvectio platform integrating customers and ecosystem partners | Modularized services, enhanced user experience, expanded data sharing; >600,000 vehicles connected |
4.1 Platform evolution
Our analysis revealed significant developments and improvements in Transvectio’s platform evolution to address the abovementioned challenges. This evolution process was not entirely linear or systematic but was rather marked by punctuated leaps. The process can be seen as a dual progression that involves aligning Transvectio’s internal technical and strategic resources and orchestrating external customers and platform complementors.
4.1.1 Internal congruence
Prompted by increased customer demand and internal servitization motives, Transvectio’s business orientation became increasingly service oriented. With hundreds of thousands of vehicles connected through built-in sensors, the future goal was to offer customers Vehicles as a Service (VaaS). Initially, to deliver enhanced customer digital service experiences, Transvectio implemented a unified user interface on the digital platform. This enabled aggregating all digital services on a single dashboard, easing customers’ feedback collection regarding the service offerings and incorporating them during service development, as highlighted by one of the venture builders (T6) and several product team members (T5, T7, T12, T11).
Additionally, to boost customers’ platform adoption, Transvectio introduced freemium services to incentivize platform usage. Any authenticated customer can access the platform and preview both free and paid service offerings on it. The commercial product owner responsible for the platform management (T12) expressed it in the following way:
I am visualizing our platform to be quite similar to video gaming platforms. They are usually quite open, and when you purchase things, they ask you to log in and experience other products. It feels like you can try out any offerings available for you while you are logged in until you start playing the games. I think we probably should have something like that for our customers.
Amid technological and market shifts, Transvectio adopted an incremental platform evolution strategy, maintaining core services while gradually integrating complementary external services to enhance its platform-based offerings. To address governance challenges associated with external complementor integration, the legislative officer (T2) emphasized the importance of a centralized digital strategy to standardize and scale the platform-based service development process. This strategy eliminated the need for project-specific governance checks and introduced a framework for collaborative activities with internal and external partners. Governance features were integrated into the platform to ensure ecosystem-wide strategic compliance and regulate access to sensitive digital resources, such as data, while respecting ownership considerations.
Technological advancements enabled this transformation by overhauling Transvectio’s back-end platform architecture. Previously, the platform offered limited customer-facing digital services, focusing mainly on vehicle tracking, and lacked the regulation needed for resource sharing among partners. This constrained both service development and Transvectio’s broader servitization efforts. The increasing demand for digital services, coupled with Transvectio’s servitization shift and accelerated by the COVID-19 pandemic, drove a transition from a closed platform to a more open, collaborative one. This allowed internal teams to aggregate necessary complementary digital resources from external partners, such as data sets and data analytics algorithms, to enable effective data analytics for developing data-driven services, fostering a resource-sharing ecosystem supporting servitization (see Figure 2).
 The diagram illustrates relationships among customers, internal organisational teams, and external partners. At the top, customers include fleet managers, connected to workshops and dealerships. Workshops link to a workshop team, and dealerships link to a dealership team and a commercial team. At the centre, data science and research and development technology developers connect with product teams, workshop teams, dealership teams, and a legislative team. Two product teams are shown, each containing product managers, product owners, and data analysts. The internal structure is enclosed within a large oval labelled transvectio. At the bottom, external cloud partners are grouped together and include tachograph data providers, analytic algorithm providers, logistics sensor providers, and a cloud-based data warehouse service provider. An external connectivity partner is shown separately on the right. Lines indicate data exchange and collaboration links between internal teams and external partners.
Transvectio’s platform ecosystem
Source: Authors’ own work
The diagram illustrates relationships among customers, internal organisational teams, and external partners. At the top, customers include fleet managers, connected to workshops and dealerships. Workshops link to a workshop team, and dealerships link to a dealership team and a commercial team. At the centre, data science and research and development technology developers connect with product teams, workshop teams, dealership teams, and a legislative team. Two product teams are shown, each containing product managers, product owners, and data analysts. The internal structure is enclosed within a large oval labelled transvectio. At the bottom, external cloud partners are grouped together and include tachograph data providers, analytic algorithm providers, logistics sensor providers, and a cloud-based data warehouse service provider. An external connectivity partner is shown separately on the right. Lines indicate data exchange and collaboration links between internal teams and external partners.Transvectio’s platform ecosystem
Source: Authors’ own work
The initial plan was to rapidly transform the platform into a service marketplace, embracing an open ecosystem and interoperable platform to integrate external partners and aggregate services developed internally and externally, as noted by the director of mobility services (T1). However, limited customer demand for such a marketplace and the lack of suitable external services in the market led to a reconsideration of this ambitious evolution strategy, mentioned by the commercial product owner (T12). Instead, Transvectio adopted an incremental approach, beginning with the modularization of its back-end platform technology to increase flexibility. This enabled the platform to handle multiple services simultaneously and modify individual services without causing service downtime. It also provided product teams autonomy to autonomy for trial and error during service development activities. Over time, this approach allowed the aggregation of effective internal and external services for customers on the platform. We see this retraction plan from a radical approach as one of the largest punctuated leaps during Transvectio’s platform evolution journey, as highlighted by the commercial product owner responsible for platform management (T12):
Service-wise, the fleet management portal was kind of a monolithic software, which was very difficult to maintain. It was not possible to add new applications to that platform at the same time. We have been trying to break out that long list of tenancies and make them standalone applications.
4.1.2 External orchestration
Transvectio’s service orientation created a strong emphasis on customer experience management. The firm used a thorough customer-onboarding process, including customer training by the dealership team on using the platform and its services, as pointed out by one of the dealership team members (T15). The platform also boasted a customized user experience through a “single sign-on” system tailored to customers’ individual subscription preferences. Furthermore, the platform enabled direct communication between customers and workshops to book maintenance visits efficiently based on their convenience and the workshops’ availability, minimizing their dependencies on Transvectio personnel. Workshops optimized spare parts inventory based on digital customer bookings, facilitating proactive maintenance as emphasized by product and analytics team members (T3, T11, T7, T9). Workshop product team members (T3, T11) noted that data from numerous connected vehicles and Transvectio’s internal systems aggregated on a single platform provided a competitive advantage to launch brand-specific services for its customers over third-party software vendors. As the workshop product manager (T11) stated:
We are providing an end customer service that is connected with our entire retail network. We use common but unique definitions of our products and services while interacting with other platforms in our network. We do not recommend that customers rely on third-party applications to avail similar services. There is no third-party application that can do what we can with the support of our broad network and experienced resources.
Consistent with its internal strategy, Transvectio initiated a more open and cooperative approach by facilitating interoperability, allowing for the integration of both strategically fitting complementary partners and selected competitors on its platform. Corroborated by fleet managers from two haulers (A1, B1), this shift addressed the challenge faced by customers with vehicles from multiple OEMs, streamlining their data-driven services under a unified, vendor-agnostic platform.
To accomplish this, Transvectio’s venture-building unit was assigned to scout external services that met the strategic criteria. For instance, its venture builders sought partners that offered automated toll payment services. These services streamlined customer experiences without conflicting with Transvectio’s offerings. The legislative officer (T2) underscored the importance of mutual compliance with governance policies for the partner onboarding:
It is really important to understand if your partners have good quality checks in place or if they take too many chances. So, we can learn from them, and they can learn from us; and we can more easily work together.
The legislative team formulated and updated the platform’s governance policy based on partner requirements. Transvectio, as the platform owner, was responsible for integrating the policy with adequate governance mechanisms and constantly updating these as needed. This approach regulated external partners’ platform access to safeguard aggregated resources, such as data privacy.
Transvectio also maintained strict technical standards for its services on the platform. The external partners and their services were assessed by the legislative team to ensure compliance with Transvectio’s standards. In case of any non-compliance or partners’ inability to comply with these standards, Transvectio’s product teams trained them to meet the standards. Effective partner management preserved the platform’s ecosystem integrity, alongside ensuring uninterrupted resource sharing, aggregation and access, as mentioned by the head of strategy (T10):
Partner orchestration could be a quick way to start working in the field. All the functionalities and all the teams are sitting to create domain knowledge on all aspects of data in the ecosystem. So it is a great way of figuring out how we can create innovation and benefits together.
The platform’s evolution is an ongoing, non-sequential process characterized by punctuated patterns (see Figure 3).
 The diagram is divided into two main sections titled platform evolution on the left and technology affordances on the right. Under platform evolution, internal congruence includes three boxes labelled service orientation, strategy alignment, and platform architecture. Below, external orchestration includes customer experience management, assembling partners, and managing partners. Arrows connect platform evolution to technology affordances. Within technology affordances, platform affordances include resource sharing leading to resource aggregation, shown twice to indicate parallel processes, and service availability. These connect to data affordances on the far right, which include data monetization, product usage tracking, and operational efficiency and effectiveness. Arrows indicate directional relationships from platform evolution through platform affordances to data affordances.
Platform evolution and technology affordance for data-driven servitization
Source: Authors’ own work
The diagram is divided into two main sections titled platform evolution on the left and technology affordances on the right. Under platform evolution, internal congruence includes three boxes labelled service orientation, strategy alignment, and platform architecture. Below, external orchestration includes customer experience management, assembling partners, and managing partners. Arrows connect platform evolution to technology affordances. Within technology affordances, platform affordances include resource sharing leading to resource aggregation, shown twice to indicate parallel processes, and service availability. These connect to data affordances on the far right, which include data monetization, product usage tracking, and operational efficiency and effectiveness. Arrows indicate directional relationships from platform evolution through platform affordances to data affordances.Platform evolution and technology affordance for data-driven servitization
Source: Authors’ own work
Internal congruence activities do not always precede external orchestration activities. A major instance of this was the initial plan to transform the platform into a service marketplace, triggered by the need to change the platform’s technology architecture. This plan was later revised by the external orchestration’s assembling partners step and the internal congruence’s strategy alignment step. The first step identified the scarcity of suitable complementary partners and services, while the second advised an incremental development approach. The decision was then returned to the technology architecture step.
Additionally, external orchestration activities, such as the venture-building team identifying a partner with different technology standards or the dealership team requesting interface changes to enhance customer experience, often prompted adjustments to the platform’s technology architecture under internal congruence. Thus, internal and external activities, influenced by contextual factors, occur concurrently or interchangeably, driving platform evolution through punctuated leaps.
4.2 The role of technology affordance in servitization
Our interviews and analysis reveal how technology affordances were perceived and actualized in the development of the firm’s data-driven services, highlighting their critical role in Transvectio’s data-driven servitization. For example, Transvectio’s data analysts’ perception of external data sets and algorithms for enabling effective analytics catalyzed the identification and actualization of the platform’s resource-sharing affordance.
Here, we make an important distinction between data and platform affordances to denote their inherent action possibilities and interdependencies, particularly in identifying the potential for data-driven servitization (see Figure 3).
Platform affordances refer to the action possibilities enabled by a platform’s architecture, functionalities and governance structures in relation to an actor’s capabilities. They condition how ecosystem participants can connect, coordinate and create value by aggregating and sharing data, resources and services within the platform ecosystem. Data affordances, in contrast, are the action possibilities that arise from the intrinsic properties of data (e.g. volume, variety, granularity, timeliness) and their alignment with an actor’s analytical and technological capabilities. They determine how data can be accessed, combined and exploited within a specific organizational and technological context to support decision-making and innovation. We argue that a nuanced distinction exists between data affordance and the more established concept of data capability. Data capability refers to an organization’s ability to systematically mobilize, manage and exploit data resources to achieve defined outcomes (Gupta and George, 2016). It reflects realized potential – what the organization does with data – rather than the possibilities data itself affords. In essence, data affordance denotes a generative condition, while data capability represents a realized organizational attribute.
In a servitization context, platform affordances facilitate the acquisition and aggregation of product data from manufacturers’ products and complementary data sets from external ecosystem actors. This data is then structured and analyzed to produce insights that reveal data affordances. These data affordances, in turn, drive the innovation and development of digital services, which are delivered to customers through the platform’s affordances. Together, platform and data affordances form the foundation of data-driven, platform-based digital servitization. Both data and platform affordances include specific activities crucial to their actualization, which we discuss next.
4.2.1 Platform affordances
Transvectio’s platform evolution process led to the development of three key affordances essential for its servitization process: resource sharing, resource aggregation and service availability. These affordances are activated through multiple sub-affordances developed throughout the platform evolution process.
Enhanced interoperability, the result of the open platform architecture, facilitated the integration of external partners on the platform. This enabled the sharing of digital resources among ecosystem partners and across various internal and external systems, with governance upheld through established internal mechanisms. For example, the modularization of the platform facilitated relevant data and data-driven insights shared by various internal systems with the workshops. This streamlined communication between the internal and external workshop teams concerning vehicle-specific issues. Rather than the workshops searching for relevant information in Transvectio’s databases, internal teams could now directly share this information with the workshops through the platform. As the workshop product owner (T3) recalled:
We are trying to make it as easy as possible for our workshops to do the job they are doing. We are trying to show them the things that they need directly, instead of them having to navigate 15 different systems, which was the case five years ago.
The resource-sharing ability is considered the platform’s primary affordance. Furthermore, the platform could centrally aggregate the digital resources shared by internal and external partners. The resource aggregation helped the analytics teams to generate data-driven insights. The enhanced platform interface allowed visual representations of these insights for easy comprehension by both customers and internal teams, such as the workshops, to support decision-making. This was acknowledged by members of the dealership team (T14, T15) and seconded by the head of analytics (T13):
We are working with big data providers of “space-based data.” So we are retrieving weather data, raw data and a lot of complementary data sources we need to be accurate for any kinds of predictions when deploying the vehicles.
The evolved platform provided customers with a one-stop solution for managing their Transvectio fleet, incorporating all digital services from both Transvectio and its approved partners. It enabled digital service accessibility and facilitated on-demand subscription services, granting customers full autonomy in navigating their service experience. Additionally, it allowed customers to engage with Transvectio’s product teams to provide feedback on their service experiences.
4.2.2 Data affordances
The platform’s resource-sharing affordance facilitates interactions among Tranvectio’s ecosystem partners and the sharing of digital resources. The resource aggregation affordance enables the data analytics team to compile the necessary digital resources, such as vehicle operational data, complementary data sets from external partners (i.e. traffic, tachograph, geographic and environmental data) and required data analytics algorithms. The aggregated resources enable data analytics and identify data affordances. The data affordances enable the product team to develop data-driven services. This process was delineated by the head of analytics (T13):
We look at a business question, search for the data, and then do all the steps of modeling. If we discover that some data is missing, we try to work around that. So, it is a traditional way of executing the process of data analytics.
The primary data affordances, referred to as first-order data affordances in this study, perceived through basic data structuring and analytics, are leveraged for monetization opportunities. Product and analytics teams structure data based on customer demands. Raw operational data are cleaned and categorized in the structuring process into product-handling and GPS-based route-tracking reports, then offered to vehicle and data customers as bundled APIs. Some bundles are provided as freemium services to encourage platform utilization, while selected API-based bundles are available for on-demand purchases. Vehicle customers can share these bundles with third-party service providers to enable services beyond Transvectio’s scope. Data customers resell these bundles as core offerings, as noted by ecosystem members (C1, C2, C3). Additionally, Transvectio’s product teams collaborate with external developers by sharing API-based bundles via the platform’s developer portal to facilitate third-party service development. One of the commercial product managers (T5) mentioned in this regard:
So, we collect the data from the vehicles and provide it through APIs to our customers or third-party service providers that have shown interest or want to build services on this data. These data have many different purposes, and we have different strategies for sharing them. We might not share very detailed maintenance or fault causes with those kinds of data.
From a data-driven service innovation perspective, first-order data affordances enable product teams to develop services that track Transvectio’s product usage. Examples include product-positioning trackers, product-handling reports and energy-consumption and emission-monitoring services. These services allow customers to monitor fleet positioning in real time, track energy consumption and CO2 emissions and use tachograph services to ensure legal compliance by monitoring drivers’ driving and resting behaviors. Customer interactions on the platform generate specific service modification requests, enabling an additional customization layer in vehicle performance reports and enhancing decision-making convenience for individual customers.
Furthermore, data-driven insights from product usage tracking services are obtained through the digital platform, shared with analytics teams and integrated with complementary resources to enable the next level of data-driven service innovation. These insights enhance Transvectio’s internal data-analytic algorithms, improving predictive capabilities for vehicle-health monitoring and proactive fault detection. They also guide the development team in identifying new data-driven opportunities. For instance, combining product-handling and product-positioning data motivated the potential for developing new services focused on vehicle operational efficiency and effectiveness. These perceived action possibilities from data, termed second-order data affordances, rely on product usage tracking services and emerge from the perception and actualization of first-order data affordances.
The actualizations of the second-order data affordances helped the product team to develop services such as product-handling improvement prompts, energy-optimization support, proactive fault detection and preventive maintenance services for its customers. These services offered insights and autonomy to customers to maintain optimal product handling and maintenance practices, contributing to increased energy efficiency, extended product life cycles and reduced yearly downtime and maintenance costs.
In Transvectio’s case, combining driving behavior data from tachograph services with vehicle positioning data provided insights into predicting the life cycles of brake and engine systems, alongside optimizing driving plans to extend their life cycles. Preventive maintenance services, designed for both routine and ad hoc needs, enabled customers to independently schedule workshop appointments directly with the workshops through Transvectio’s platform. Additionally, dealership representatives (T14, T15) shared an anecdotal example where a customer praised the effectiveness of the product-handling improvement prompts. These prompts offer insights into whether the usage behavior accelerates wear and tear on a vehicle’s engine or braking system beyond standard levels and whether it contributes to inefficient fuel consumption. With this information, customers could engage drivers in discussions to adjust their behaviors, reducing fuel consumption and optimizing vehicle life cycles during daily operations. In reflection of this overall process, the director of mobility services (T1) noted:
Under data-driven services, we typically include maintenance and uptime services that are data-driven. I mean, we have several hundred thousand connected vehicles that we collect data from globally. So, of course, there is a lot of intelligence that can be applied to that data, and that creates great services.
The translation of these data affordances into actual data-driven services involved several back-end steps. At the initial stage, each data-driven service was merely an idea when data affordances were perceived. Approval from Transvectio management was necessary to develop these ideas into full-fledged services. These ideas were first developed into service prototypes, termed “lighthouse projects” by the head of analytics. These prototypes showcased the potential outcomes of the actual services (if developed) for both Transvectio’s management and its customers, thus catalyzing the probability of securing management approval for their development into full-fledged services. Transvectio’s management also conducted idea competitions where product teams presented their prototypes to the management. Some of these ideas evolved into services that are now recognized as Transvectio’s “flagship projects,” according to the head of analytics (T13):
You need to have some flagship projects; you need some lighthouse projects at the early stages first to show the potential value of the flagship projects. Well, if they understand, “Wow, what value!” then the minds open up to understand what was needed to make this value happen.
5. Discussion and conclusion
Manufacturing firms are increasingly transforming traditional product platforms into innovation platforms (i.e. solution-enabler platforms), as legacy types are no longer sufficient to support service development and innovation through collaboration with external complementors (Gawer, 2014; Randhawa and Springer, 2025). Such collaborations enable firms to combine operational product data with external digital resources, thereby advancing data-driven service development and innovation (Agrawal et al., 2018). The resulting data aggregation contributes to progressively improving service quality and strengthening overall platform outcomes (Gregory et al., 2021; Sheng et al., 2024; Zhang et al., 2025a).
Consequently, companies are placing growing emphasis on advancing both the development and capabilities of their platforms. While our study focuses on the transportation industry, evidence from other case studies offers additional nuances. For example, Ciasullo et al. (2021) show how one manufacturer evolved its digital platform into an interactional hub to enhance customer engagement, whereas another pursued a radical shift by co-developing a platform through extensive ecosystem collaboration. These cases highlight key contrasts: ownership models range from manufacturer-centric to shared governance; evolutionary pathways vary from gradual modularization to rapid, innovation-driven transformation; and platform affordances (though not explicitly labeled as such) differ in scope, from enabling operational transparency to supporting solution development. Ferreira and Lind (2023) describe yet another trajectory: the focal manufacturer relied on an external platform provider for its digital backbone, resulting in strong supplier dependency and limited governance control. Here, platform evolution centered on managing interfaces rather than shaping platform architecture, with strategic emphasis on adapting internal resources and coordinating supplier relationships. In Wieczerzycki et al.’s (2025) study, the digital platform functioned primarily as a coordination hub for transactions and logistics, facilitating value co-creation across dyads, triads and networks. In this case, evolution was shaped by the replication of practices and role fluidity within the service ecosystem. Recognizing these variations strengthens the external validity of our study, situating Transvectio’s experience within a broader spectrum of platform-based servitization.
5.1 Technology affordances enabling servitization
Drawing on affordance theory, our study provides insights into the evolution of digital platforms for servitization and the interplay between platform and data affordances (see Figure 3). Affordance theory allows for an understanding of the impact of digital technology on organizations (Nambisan et al., 2017). It posits that technology outcomes arise from an actor’s actions, stemming from perceived opportunities within the interplay of technological features and the actor’s goals (Strong et al., 2014). The present study analyzes the process by which a manufacturer actualizes the action potential offered by data through its digital platform and transforms it into novel data-driven services.
The platform’s action possibilities (i.e. platform affordances) assist in aggregating operational data from the installed base, as well as in the discovery of action possibilities (i.e. data affordances) through data analytics. However, recognizing these possibilities necessitates additional resources that are found not only internally (Cenamor et al., 2017) but also externally, such as complementary data sets and effective data analytics algorithms from partners (Ferreira and Lind, 2023; Lerch et al., 2024). The sharing of these resources is enabled by the affordances gained through the platform’s evolution.
Our study reveals internal congruence and external orchestration activities during the platform evolution process. This process constantly enhances platform affordances by extending an ecosystem beyond firms’ internal operations (Cenamor et al., 2017) to incorporate external complementors (Rapaccini et al., 2023; Lerch et al., 2024). The platform also supports alignment and coordination among its ecosystem members (Ciasullo et al., 2021), which then allows reciprocal resource sharing to execute data analytics and perceive data affordances. The platform’s aggregated resources thus enable firms’ data experts – reflecting the importance of back-end functions for platforms (Cenamor et al., 2017) – to summarize raw data, revealing first-order data affordances. To identify these affordances, advanced data analytics may not be needed, but rather the human and technological capital to interact with data for effective cleaning and structuring.
The first-order data affordances help perceive and actualize the development of product-usage-based services. Among such services are representations of the firm’s product performances based on handling, as well as monitoring products’ location and environment-based energy consumption (Shmueli and Koppius, 2011). These services monitor and describe the products’ behavioral patterns and trends (Laursen and Thorlund, 2016) based on environmental, operational and usage conditions. We conceptualize these services as descriptive and posit that their development is driven by the perception of actualization of first-order data affordances. Linking this notion to Lerch et al.’s (2024) “platformization pathway,” in which manufacturers become increasingly platform-focused, we posit that descriptive services are the reflection of platform evolution in its earlier stages.
The insights from the descriptive services are deployed for further data analytics, which, in turn, enable second-order data affordances. These affordances help perceive and actualize the services that not only predict products’ future performance estimations but also provide recommendations on optimizing product performance. Such services help decision-support systems by prescribing how to handle and maintain the products to ensure lower operating costs and longer product life cycles (Davenport and Harris, 2007). We conceptualize these services as prescriptive and posit that their development is driven by the perception of actualization of second-order data affordances. Also linking this notion to Lerch et al.’s (2024) platformization pathway, we further posit that prescriptive services reflect platform evolution in its later stages. As both descriptive and prescriptive services are made available for customers via the platform, the combined technology affordances – that is, platform and data affordances – enable servitization.
5.2 Theoretical implications
Our paper makes two theoretical contributions to B2B marketing research. First, we draw on affordance theory to understand the interplay between platforms and data in facilitating servitization. We seek to identify the role of Transvectio’s platform evolution in its data-driven servitization. We further shed light on the internal congruence and external orchestration efforts in platform evolution. By applying the affordance lens to our analysis, we align data affordances with the broader cascading nature of technology affordances explored by Naik et al. (2020). Echoing their findings, we observe that the recognition of higher-order technology affordances – second-order data affordances in our study – relies on the prior perception and actualization of lower-order affordances of the same technology (Bloomfield et al., 2010; Strong et al., 2014) – in our context, first-order data affordances for driving digital servitization. This suggests that more comprehensive analytics of technology affordances allow firms additional opportunities for advanced outcomes. Yet, our analysis further suggests that this process cannot occur independently of other technologies. We extend the existing discussion (Naik et al., 2020; Bloomfield et al., 2010; Strong et al., 2014) by proposing that the perception and actualization of one technology’s affordances depend on another technology’s supporting affordances. In our case, the perception of data affordances is contingent on platform affordances for data aggregation and sharing.
Second, we suggest that platform evolution may not always follow a tightly systematic pattern in which architecture, services and governance evolve simultaneously, as described by Jovanovic et al. (2022). Instead, it may rather resemble Lerch et al.’s (2024) platformization pathway, where changes in a firm’s platform architecture occur in a routinized yet punctuated manner, shaped by business priorities and strategic choices and reflecting the interplay among the pathway’s stages. Such decisions can drive the expansion of a platform ecosystem, for example, by integrating ad hoc external partners for data sharing in response to contextual necessities or emerging data affordances. Customers may also request design enhancements to improve operational ease, while a firm’s internal service needs can similarly prompt architectural changes – consistent with servitization research showing that platform architecture is closely linked to both front- and back-end functions (Cenamor et al., 2017). In addition, the introduction of new technologies may necessitate platform reconfiguration. Governance mechanisms during these changes, rather than remaining static, adapt to internal and external requirements to foster interoperability and resource sharing within these platform ecosystems (Springer et al., 2025). Collectively, these factors help explain the variety of internal and external activities that shape platform evolution.
5.3 Managerial implications
During data-driven servitization, managers should strive early on to identify potential complementarities for data analytics. This should enable them to discern data-driven insights and convert them into services, thereby getting the most value from the data. However, simply investing in the collection of operational data from products may not be sufficient to transform them into data-driven services. In our study, it was essential for the analytics teams to recognize the internal shortcomings related to the complementary resources needed for data analytics. These complementary resources were vital to perceive the data affordances and actualize them by developing services that aligned with the set objectives. The assemblage of suitable complementary partners to share and aggregate these resources was instrumental in Transvectio’s ability to offer data-driven services. Since this can be both time-consuming and resource-intensive, initiating these tasks early could provide firms with a competitive edge.
Additionally, it is vital to underscore the significance of both internal and external management in the progression of a customer-centric platform. A key takeaway from Transvectio’s platform journey is the need to prioritize user-friendly interfaces and convenient service accessibility for customers, steering clear of avant-garde designs that may not resonate with industry norms and customer readiness. In many B2B industries, overly advanced and sophisticated solutions can backfire, as users and decision-makers may have to be gradually accommodated to digital changes. Incremental improvements and a phased approach to digital transformation can therefore be effective, ensuring that users can adapt comfortably and efficiently to new technologies. This approach may help in building trust, interest and acceptance, ultimately leading to a more successful execution.
Furthermore, investments in platforms and associated service development should align not only with market demand but also with the availability of third-party complementors. While manufacturers frequently partner with Big Tech firms such as Microsoft and AWS, local start-ups and other specialists with domain expertise can also play a crucial role in accessing and analyzing data, understanding its potential applications and innovating data-driven services. Manufacturers can foster such collaborations by providing data and guidelines to help them comply with necessary legal and technology standards, especially when partners with the required skills and standards are not readily available in the market for integration.
Moreover, our research offers insights to tackle some of the obstacles managers encounter while implementing digital servitization. We delve into how decision-makers can navigate internal hurdles to secure approval for data-driven service development. Analogous to product development, the creation of manageable service prototypes can enhance the process of management comprehending the prospective potential of these services once they are fully developed and made available to customers. Our findings suggest that the success of these services can subsequently stimulate an internal understanding of the credibility of data-driven activities, ideally fostering a virtuous cycle. Table 3 summarizes the key managerial implications.
Platform evolution and technology affordances: key managerial implications
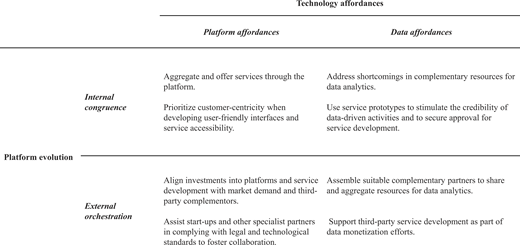 |
Finally, we highlight that platformization does not necessarily guarantee successful outcomes. Transvectio’s success factors can be contrasted with failed platformization attempts. Vestas’ Covento and IBM-Maersk’s TradeLens exemplify common pitfalls (Springer et al., 2025; Randhawa and Springer, 2025). Covento, launched as an open marketplace for spare parts, struggled to attract a critical mass of suppliers and buyers due to unclear value propositions, limited complementor engagement and governance discontinuities that eroded trust. Similarly, TradeLens faced adoption barriers: its governance model created perceived competitive risks for participants, undermining ecosystem identity and incentives to join. In contrast, Transvectio pursued an evolution strategy under a unified governance model, maintaining a closed platform. By screening partners and prioritizing interoperability and trust over indiscriminate growth, Transvectio mitigated the issues similar to the above cases.
5.4 Limitations and further research
The limitations of our study offer fruitful opportunities for further research. First, as our selected case is confined to a single industry, exploring platform-based servitization across diverse B2B contexts could yield insightful cross-industry perspectives. Especially revealing in this regard would be industries that substantially differ from our case, such as process firms operating within “input-to-process” rather than “installed-based” business logic. Much platform research focuses on highly specialized digital firms that can use direct and indirect network effects to “hyperscale” their business (Giustiziero et al., 2023) and achieve winner-takes-all or most advantages. In contrast, platforms in manufacturing industries are typically crafted to address domain-specific business requirements with customized solutions, requiring complex transactions and maintaining long-term customer relationships. These characteristics underscore the necessity of thoroughly understanding the particular types of platforms pertinent to various B2B markets and how they drive (or inhibit) digital servitization.
Second, our study primarily focuses on the scenario where the manufacturer retains ownership of the digital platform and acts as the central orchestrator. However, this does not account for other types of platforms where the manufacturer may or may not be the owner or the primary orchestrator. For example, there are digital platforms that are owned by data intermediaries that operate under different governance models where the manufacturers do not play the central orchestrator role. This variation in platform ownership and orchestration could lead to different dynamics in service development and deployment, which are not fully explored in this study. Therefore, future research should consider these alternative platform structures to provide a more comprehensive understanding of how these digital platforms influence the development of data-driven services.
Third, quantitative investigations could uncover and test relationships between platform evolution dimensions and affordances. This is particularly relevant as our empirical evidence primarily stems from the supplier’s perspective. Given that platform-based operations are highly interconnected, more supplementary data from the perspectives of customers and other platform members could deepen our understanding of platform dynamics.
Fourth, our findings on effective guidelines for platform management and data governance could be extended. We specifically recommend integrating research related to digital responsibility and data privacy, which is getting increased attention in digital services research (Wirtz et al., 2023). For example, customer compliance is changing regularly, and in many markets, the customer cannot use the equipment without consenting to the changes.
Finally, our study underscores the complexity of data ownership in the context of data monetization. Future research should aim to equip managers with a better understanding of data monetization, thereby enhancing firm strategies and transforming data-driven offerings into consistent revenue streams (Ritala et al., 2024). Overall, as platform-based data-driven servitization becomes increasingly critical for B2B service growth, future research in this area appears especially promising.
