Skip to article sections
Purpose

This study proposes the application of a four dimensional framework of autonomy to a weapon swarm of high subsonic cruise missiles.

Design/methodology/approach

A virtual anti-access area denial (A2AD) environment involving combat operations between two opposing forces is constructed using the Advanced Framework for Simulation, Integration and Modeling (AFSIM). The effects of the dimensions of autonomy on the strike package are statistically tested using a designed experiment.

Findings

Analysis of the results shows that the framework for autonomy is significant at a 95% level of confidence towards all measures of effectiveness. The ability for intra-swarm communication provides the greatest benefit to both the offensive and defensive performance of the swarm, most notably with a 51.9% increase in the swarm’s capacity to detect and destroy new threats.

Research limitations/implications

While the results obtained are promising, this research presents representative system capabilities that must be tested with real system data before operational decisions can be made. AFSIM allows this through its modular design with plug in capability for real system performance parameters and scenario configurations/laydowns, but this is beyond the scope of this research effort.

Originality/value

The increasing push toward and reliance on autonomous systems, to include autonomous-human teams, requires methods for gauging the effectiveness of these systems. This research provides a case study for suitable metrics and measures of system effectiveness.

As warfare advances, the necessity to incorporate data-driven processes has become increasingly apparent. The complexity of the decision space in which command and control (C2) nodes must now operate will exceed the capability of existing chain of command procedures. Autonomous systems that incorporate human-machine interactions offer a potential solution to this problem. The United States of America emphasizes this goal specifically within a broad range of strategy documents including successive National Defense Strategy Documents (NDS, 2018, 2022) and other Department of Defense Directives and scientific board recommendations (DoDD3000.09, 2023; DSBTF, 2012).

Another result of the highly proliferated global defense industry of the twenty-first century is that of increasingly complex anti-access area denial (A2AD) environments that contain Integrated Air Defense Systems (IADS). The United States Air Force (USAF) Science and Technology strategy identifies modern IADS as a “threat to the technological superiority of U.S. military forces” by inhibiting the prospect of air dominance through conventional methods of highly sophisticated air assets (AFDP1 2021; Wilson, 2019). In order to deter aggression and overcome the long-term strategic competition of near-peer adversaries, efforts must be concentrated on progressing capabilities for attritable, low-cost autonomous missile swarms that have shown potential in successfully overcoming A2AD environments (Goggins, 2022; Martinez, 2023; MacWilkinson, 2023).

This research simulates multiple different conditions of autonomy in order to assess the relative effect on performance of Blue (friendly) forces in an A2AD environment. The scenario involves a networked swarm of autonomous cruise missiles that engage the Red (enemy) IADS in order to allow for a succeeding strike by the Blue manned penetrating bomber on the Red high value target (HVT). Modeling and simulation experiments are conducted in the Advanced Framework for Simulation, Integration and Modeling (AFSIM).

This research answers the following questions.

  1. To what extent can autonomy in the application of cruise missile swarms be advanced from a previously defined three-dimensional framework?

  2. To what degree does autonomy aid in the offensive and defensive capabilities of Blue forces under the prescribed conditions?

Huang et al. provides a systematic method of standardization for the terminology related to specifying levels of autonomy in unmanned systems (UMS) (Huang et al., 2005). Autonomy in the application of the UMS is defined to be “the ability of sensing, perceiving, analyzing, communicating, planning, decision-making, and acting, to achieve its goals as designed by its human operator(s) through designed human-robot interaction.” Huang et al. proposes the Autonomy Levels for Unmanned Systems (ALFUS) as a three-dimensional framework to autonomy comprised of mission complexity, environmental complexity and human independence (Huang et al., 2005). By extending these definitions, we explicitly define autonomy within the scope of this research to be a cruise missile’s capacity to make command, control and communication decisions once actively deployed within the battle space in support of the mission objectives of its human operators.

Goggins (2022) furthers the framework put forth by Huang et al. (2005) by introducing three new characteristics of autonomous systems with respect to cruise missile swarms. They are the ability of a missile swarm to act alone, to cooperate and to adapt to situational changes. Through a designed experiment with three levels of autonomy for each characteristic, results show that the highest levels of autonomy do not necessarily produce the best military outcomes, contrary to what one might expect. His work indicates that the value of autonomy is potentially scenario dependent (Goggins, 2022).

Martinez (2023) uses the framework in Goggins (2022) to extend the combat scenario to include ground-based units. Similar results are obtained indicating that higher levels of autonomy in swarming autonomous assets are potentially of less military value to offensive capabilities in an A2AD environment.

Lockheed Martin’s Framework for Autonomy provides an extensive look into the design of concept and theoretical application of autonomous systems. In this context, autonomy is decomposed into 7 different dimensions providing a high-resolution structure for defining a system’s framework (Spiegel et al., 2019). Each dimension contributes to an overall autonomy score, rated on a scale from level 1–10, with 10 being a fully autonomous system. Pollack (2021) applies this model by defining an autonomous system through the fusion of Lockheed Martin’s seven dimensions into a simpler three-tiered taxonomy, similar to Huang et al.’s framework. Pollack specifically uses situation understanding, multi-system operations and planning and control as relevant to the scenario of high value airborne asset defense. Most relevant to our research, his thesis relinquishes the dimensions related to human–system or human–machine interaction, stating a human component is not considered. However, a requirement for human–machine interaction is likely necessary for future fielding of concept according to the Department of Defense’s (DoD) task force report (DSBTF, 2012).

A2AD is a military strategy that leverages the threat or employment of missiles and aircraft to destroy enemy targets or power projection capabilities (JP3-01 2023). This approach is often implemented through integrated air defense systems (IADS) and may be executed in coordination with next generation aircraft. IADS is not a formal system in itself but is the amalgamation of service components and air and missile defense (AMD) systems. AMDs are often comprised of C2 networks that enable the use of early warning (EW) radars, target selection and acquisition radars (TAR), target engagement radars (TER), surface-to-air missile (SAM) launchers and all required personnel that operate within the theater (JP3-01 2023).

The modern advancement of these systems can effectively prevent aerial forces from entering into a geographic zone, eliminating the possibility for domain superiority and requiring supplemental capabilities of the offensive force. As a defensive strategy, A2AD poses deterrence difficulties in several key regions of the world including both Europe (Lasconjarias, 2019; Sukhankin, 2018) and Asia (Yevtodyeva, 2022).

In order to maintain superiority as a military force, the DoD must embrace autonomous capabilities and adopt enterprise processes to support their strategic advantages (David, 2016). Autonomous weapon systems integration will be imperative to operational accomplishment of the future. Understanding the globalized impact of such technology on the DoD and its potential adversaries must remain an utmost priority if the USAF wishes to continue being the dominant power in future conflicts across all operating domains (Wilson, 2019). However, the slow integration of autonomy reflects the internal hesitation to abdicate command authorities to autonomous systems (David, 2016; Herzog and Kunertova, 2024). Further research and development of autonomy in military application may aid in combating these institutional reservations by providing evidence for well-defined parameters in which autonomous systems may be used, allowing for the confidence necessary to support greater organizational change.

Modeling and simulation is a statistical method applied through computer-based software to replicate real-world operation under defined conditions (Banks et al., 2005). This enables research to be conducted by studying the interactions of entities during the evolution of a system. Implementation provides a cost effective and comparatively simple method for data collection when chosen over live experimentation (Banks et al., 2005). Yang et al. showed that modeling and simulation efforts within the context of regional air defense combat allows for the study of complex transactions between invading aircraft and IADS in a multi-dimensional, probabilistic environment (Yang et al., 2019).

Unlike discrete-event simulation, which tends to model systems from the process perspective, agent-based modeling is approached from the perspective of the agent within the simulated environment. Weimer et al. (2016) provide an excellent primer on agent-based modeling, as does Macal (2016). Agent-based simulation has been successfully used to model a multitude of situations where interactions between competing interests are important, such as blockchains (Rosa et al., 2019), large urban areas (Macal et al., 2018), pandemic policy (Li and Giabbanelli, 2021; Sulis and Terna, 2021; Sobkowicz and Sobkowicz, 2021), strategic group formation (Collins and Frydenlund, 2017) and building evacuation scenarios (Liu et al., 2016).

Agent-based simulation is well-suited to modeling defense-related topics, particularly combat, because outcomes are primarily interaction-based. Some of these scenarios are search (Hill et al., 2006), search and rescue (Pescatore and Beery, 2024; Drew, 2021), small unit operations (Koehler et al., 2021; Ilachinski, 1999), mission level models (Tryhorn et al., 2023; Reid et al., 2023; Harper, 2020) and campaign simulations (Serré et al., 2021; Hill et al., 2004). This research is focused on the mission level of combat modeling within AFSIM.

Design of experiments (DOE) provides a statistically rigorous foundation with which one can soundly execute the scientific method on a problem set. Experiments are designed by identifying the variable of interest for the experimenter, defining the factor(s) that influence these responses, creating means by which to efficiently collect data, conducting the experiment and performing statistical analysis of the results (Montgomery, 2020). Applying the DOE statistical method to computer-based simulations provides a range of possible experimental settings to be executed. Research using either a full factorial or fractional factorial design has been successful with computer-based simulation efforts (Martinez, 2023; Bruns, 2022; Goggins, 2022; Pollack, 2021; Ciaravino, 2020). From this, a factorial-designed experiment is the selection for this research.

AFSIM is a defense-focused modeling and simulation environment managed by the Air Force Research Lab (West and Birkmire, 2020). AFSIM is a complex, but flexible, platform that allows the modeler/analyst to specify the level of fidelity (or abstraction) of model entities based on the study requirements. AFSIM supports models at varying levels of resolution (West and Birkmire, 2020). Table 1 presents a common taxonomy with an indication of complexity and scope. The environment supports modeling in virtual (man-in-the-loop) and constructive (entirely computer code) experiments.

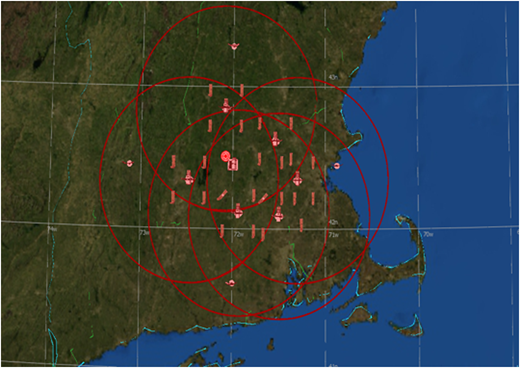
AFSIM employs discrete-event timing through agent-based modeling approaches that allow for specifically modeled entities to be defined as individual agents (West and Birkmire, 2020). This paradigm supports the ability to define behaviors for individual agents within the simulation, providing a desirable level of flexibility to the overall modeling architecture. Scenario visualization is supported with terrain detail in various resolutions. Figure 1 shows representative terrain and Red agents defined in this research.

The cruise missile swarm is endowed with four dimensions of autonomy that provide the ability for self-governance and cooperation with the Blue penetrating bomber. These dimensions are the ability to act alone, ability for intra-swarm communication, ability to adapt and ability for leader-follower cooperation. Each of these four dimensions is further defined by a low setting or a high setting, which corresponds to the level on the continuum of capability that the dimension provides the swarm when engaging the Red IADS.

Ability to act alone refers to a cruise missile’s capability to navigate the battle space. This defines how an agent within the swarm will calculate a three dimensional flight path that will allow them to engage a member of the Red IADS. The low setting sends a pre-briefed targeting scheme to the swarm, whereby each swarm member will directly engage their target in a straight line route. The high setting for this dimension allows for “smart” targeting–circumnavigating known threat rings from each tactical operations center (TOC) and calculating shortest distance-to-target ranges for more optimal threat engagements. A threat processing algorithm will calculate a route that least violates any additional airspaces beyond the one they must enter in order to engage their target. The term least violates refers to the maximal radial distance from the center point of the threat ring to the swarm agent.

Ability for intra-swarm communication refers to the swarm’s capability for relaying and acting upon internal targeting information as a coherent, unified ensemble. This dimension establishes a communication network between all cruise missile agents that defines a master targeting array, populated with the priority score of each known Red entity. The high setting for this dimension enables the internal communications network for information fusion, creating the “swarm”. The purpose of this network is to report individual entity status, enhance awareness of the mission environment and create a targeting scheme that allows for a more effective attack configuration on the Red entities by allowing dynamic target reassignment.

Ability to adapt refers to a cruise missile’s capacity to detect variations within the mission environment and respond accordingly. With this dimension, the agent’s on-board sensor suite is outfitted with a radar warning receiver (RWR) that allows for situational awareness of the battle space. The high setting for this dimension turns the RWR on, which upon capture of radiation provides location and tracking information of the emitting IADS members. Additionally, a threat processing algorithm is added to each swarm member’s functionality which provides both detection of any incoming SAMs and the ability to execute evasive maneuvering of the threat through changes in the agent’s acceleration vector.

The final dimension of autonomy is the ability for a leader–follower cooperation. This dimension refers to the Blue strike package’s capacity for human–machine interaction. A communications network is established between the manned Blue bomber and each agent within the swarm, which provides the ability for transferring of targeting and location information in a bi-directional manner between the Blue entities. This setting establishes an elliptical zone around the bomber which mimics a logical gate for the bomber to issue commands of engagement to swarm members, based upon violation of the zone by IADS entities. The commands given to the cruise missiles will either be in a direct manner to specific individual agents, or to the swarm as a single entity for internal processing and execution, based upon which setting is enabled for the dimension of intra-swarm communication.

Specific factor settings for the 24 full factorial experiment design are shown in Table 2.

This research simulates two forces in conflict with each other. The Red force is defensive in posture, positioned on a coastal land segment with an IADS that defines the A2AD environment itself. The Blue force is an offensive strike package that ingresses from the sea and consists of a manned penetrating bomber that releases an autonomous cruise missile swarm both to overwhelm the Red IADS and to allow it to engage the Red high value target. While the systems represented and discussed herein are modeled to provide insights through realistic performance, they are not representative of any specific real-world existing or planned platforms.

The Red IADS consists of several distinct entities: an Air Operations Center (AOC), TOCs, EW radars, TARs, TERs, EW fusion centers and SAM battalions with associated launchers. The AOC acts as the highest level command authority within the IADS. The AOC assigns engagement tasks after receiving and processing subordinate command information. The first of the two subordinate commands to the AOC is the EW fusion center. The EW fusion center commands 11 EW radar sites, which obtain radar information and relay it to the fusion center for processing before being sent to the AOC. The six TOCs are the second of the two subordinate commands to the AOC and control the engagements of their own SAM battalion. Therefore, each SAM battalion consists of one TOC (commander), one TAR entity, one TER entity and four SAM launcher entities. The IADS layout also includes a stochastically-determined pop-up threat to test the autonomous cruise missile swarm’s ability to adapt to a changing scenario. The threat rings defined by each Red force TOC are shown in Figure 1.

The first component of the offensive Blue force is the manned penetrating bomber that seeks to destroy the Red HVT. The bomber is equipped with a communications network that allows for data and task processing for both itself and the swarm. The bomber can also enable an internal transceiver to allow for a command structure of the Blue forces, doing so enables operating conditions such that the bomber now has command authority over the swarm and therefore may issue commands to the swarm that must be executed. Due to the challenging IADS configuration, the bomber is set to Indestructible. Therefore, when engaged successfully by the IADS, the bomber entity continues to its mission objective, thus allowing more flexibility to assess the overall functionality of the combat model and the autonomy of the swarm.

The autonomous cruise missile swarm is released by the Blue penetrating bomber in response to the A2AD threat environment from the Red IADS. The swarm consists of 24 cruise missile entities. Each missile has an initialization failure rate set at five percent. Each missile entity also carries enough fuel for up to 250 nautical miles of travel. Upon successful deployment, each missile is equipped with wings that allow for in-flight maneuverability to a maximum aerodynamic load of two times the force of gravity (2g). Each cruise missile has a binary response probability to kill based on the radial distance of impact from its target: a 1.0 probability to kill within a 100-m radius, and a zero probability for any impact distance beyond. Each cruise missile is also equipped with a suite of sensors that provide information with respect to their navigation, location, threat detection and communication networks. The sensor suite is composed of a global positioning system (GPS), a RWR and a datalink transceiver. The RWR sensor operates at a 200 km range with a 0.1–20 GHz frequency band. The transceiver operates in support of both the intra-swarm network internal to each cruise missile agent, and the leader-follower network that is commanded by the Blue bomber. The communications transfer is set to a rate of 100 megabits per second.

In this scenario, the number of Red SAMs and other IADS entities outnumber the available cruise missiles, forcing the swarm to calculate: (1) if an acceptable solution exists (i.e. the Blue penetrating bomber can destroy the Red HVT and survive), and (2) if an acceptable solution does not exist, what is the method of attack which produces the fewest number of engagements upon the Blue penetrating bomber. With this goal in mind, the simulation is set such that each Red IADS entity is assigned a priority category that influences how the swarm will calculate a targeting scheme, with highest priority being one and lowest priority being four. Target priorities are displayed in Table 3.

Designing and implementing a simulation based experiment allows for statistical testing and analysis of results. Forming a model between control factors and responses provides the ability for rigorous interpretation between their causal relationship. The control factors used within this experiment are the dimensions and levels of autonomy for the cruise missile swarm; all other nuisance factors within the simulation experiment will be kept constant and left untested. The factors are assumed to be inherently orthogonal, and therefore independent of one another, which provides the necessary framework for a factorial design. Specifically, a 24 full factorial design with 16 unique treatment combinations is used (see Table 4). Additionally, the dimensions and levels of autonomy are represented by categorical variables, whereby an in-between value (or center point) holds no meaningful interpretation. Each treatment is replicated 100 times, which allows for the statistical aggregation of data points by using a random number seed. The total simulation experiment contains 1,600 experimental runs.

Measures of effectiveness (MOE) were devised to capture the effect of autonomy factors as they relate to both lethality and survivability from the standpoint of the Blue force. MOEs reflecting lethality were the number of Red entities destroyed by the cruise missile swarm and a binary response indicating whether the pop-up entity is destroyed. These two MOEs allow a quantifiable determination of the effectiveness of the swarm’s ability to execute its kill chain. MOEs reflecting survivability were the number of times the Blue penetrating bomber was struck by a Red SAM and the number of cruise missiles destroyed by the Red SAMs. These two MOEs test the swarm’s ability to survive and thwart the Red IADS kill chain. Measures of effectiveness are shown in Table 5.

Analysis of Variance (ANOVA) and log-likelihood techniques are applied to the experimental results in order to allow for statistical justification of the relationships between the response variables and factor settings. All statistical testing is conducted at a 95% significance level (α = 0.05) using JMP Pro 16.

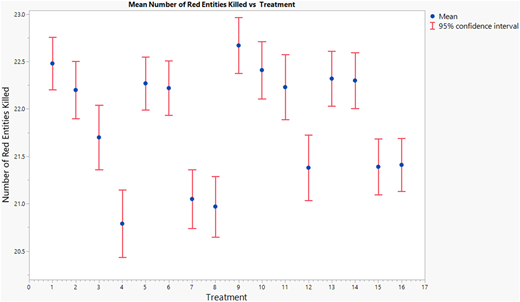
Figure 2 displays the mean number of Red entities killed by the swarm members for each of the 16 treatment combinations. A higher mean value corresponds to a better offensive performance of the swarm members in support of the overall Blue strike package objective. The ANOVA test results show an overall F-statistic of 21.03 with an associated p-value of less than 0.0001, indicating that at least one dimension of autonomy is statistically significant towards the swarm members ability to destroy the Red IADS members. Analyzing the residual normal quantile plot confirms that our model follows a normal distribution. Further, visually examining the residual by predicted plot confirms that our model is homoscedastic, or has constant variance.

Table 6 depicts the individual effects test for each main and multi-level interaction effect of autonomy. Factors in italics are statistically significant and contribute to the number of Red entities destroyed by the Blue cruise missile swarm. All four main effects statistically contribute to the swarm’s offensive capability against their targets. Additionally, these effects were also statistically significant: (1) two-factor interaction between the ability for intra-swarm communication and ability for leader–follower cooperation, and (2) the three-factor interaction for the ability for intra-swarm communication, ability to adapt and ability for leader–follower cooperation. These results show that autonomy, as defined in this four dimensional framework, enhances the swarm’s lethality when compared to the baseline model.

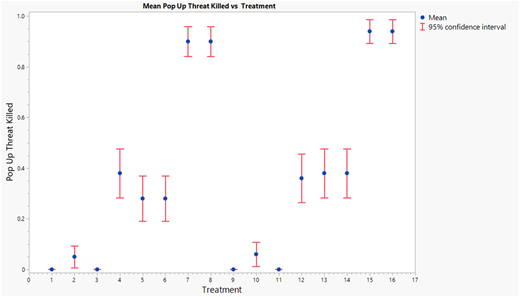
The treatment means and their 95% confidence intervals for the proportion of times the pop-up target was destroyed are shown in Figure 3. Quantifying the mean proportion of runs in which the pop-up threat was destroyed by a Blue swarm member allows for determination of the swarm’s flexibility in complex combat scenarios. The treatment combinations 1, 3, 9 and 11 encompass both the ability for intra-swarm communication and ability for leader–follower cooperation at a low level and never succeed in eliminating the pop-up threat, as the Blue cruise missile swarm does not have a means by which to dynamically reassign targets. The log-likelihood test results in a χ2 statistic of 1.029 with a p-value of less than 0.0001, allowing us to reject the null hypothesis in favor of having at least one dimension of autonomy that is significant towards this effect. Analyzing the receiver operating characteristic (ROC) plot provides an area under the curve (AUC) of 0.91, indicating that our model has a strong predictive accuracy.

Table 7 depicts the individual effects test for each main and two-level interaction effect of autonomy for proportion of time the pop-up target is destroyed. Factors in italics are statistically significant and contribute to the MOE. By examining the p-values at the set significance level, we are able to conclude that the main effects of ability for intra-swarm communication, ability to adapt and ability for leader–follower cooperation all statistically contribute to the swarm’s ability to seek and destroy the pop-up threat. Additionally, the two-factor interaction between the ability for intra-swarm communication and ability for leader–follower cooperation is statistically significant; this is an expected result due to the nature of the interaction in the battle space between the manned–unmanned team.

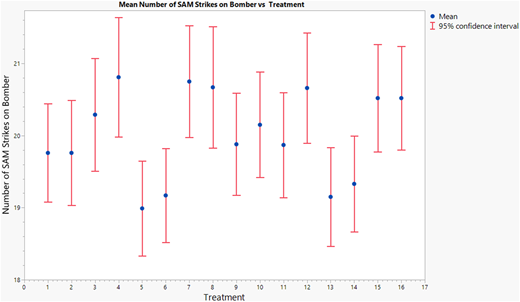
Figure 4 displays the treatment means and their 95% confidence intervals for the number of SAM strikes on the Blue penetration bomber. The lower the number of successful engagements by the SAM onto the Blue bomber corresponds to a higher rate of survivability and overall better defensive performance of the Blue strike package. The ANOVA test results show an overall F-statistic of 4.116 with an associated p-value of less than 0.0001. This result shows that autonomy provides at least one statistically significant effect towards the Blue strike package’s ability to disrupt the Red IADS kill chain. Analyzing the residual normal quantile plot and residual by predicted plot confirms that our model follows a normal distribution and has constant variance, respectively.

Table 8 displays the individual effects test for each main and two-level interaction effect for the dimensions of autonomy. Factors in italics are statistically significant and contribute to the number of SAM strikes on the bomber. Examining the p-values at the corresponding 0.05 significance level provides the conclusion that the ability to adapt main effect and ability to adapt with ability for intra-swarm communication interaction effect statistically contribute to the number of times that the bomber was successfully engaged upon by the SAM launchers. Further examination of the insignificant results reveal there is little statistical effect from the other dimensions of autonomy.

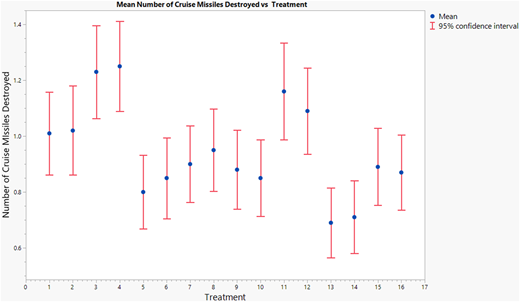
Figure 5 displays the treatment means and their 95% confidence intervals for the number of Blue cruise missiles destroyed by Red SAMs. The lower numbers correspond to less cruise missiles being destroyed and overall better survivability and defensive performance of the swarm. The ANOVA test results report the F-statistic to be 7.842 with an associated p-value of less than 0.0001. Analyzing the residual normal quantile plot indicates that the model for this MOE may have issues with our assumption of normality. The residual by predicted plot also indicates that there may be issues with our assumption of constant variance. Box–Cox transformations are tested to no significant effect. It is determined that these deviations will have minimal influence on the experimental results, and will therefore be accepted.

Table 9 displays the individual effects test for each main and two-level interaction effect for the dimensions of autonomy for the number of Blue cruise missiles destroyed by Red SAMs. Factors in italics are statistically significant and contribute to the MOE. The ability to act alone, ability for intra-swarm communication and ability to adapt main effects all show statistical significance with a p-value of less than 0.05. These results are sound in that the significant dimensions of autonomy directly influence how each swarm agent navigates the battle space, locates a target and engages that target. These actions place the swarm agents in a state at which a SAM launcher may target them. The insignificance of the ability for leader-follower cooperation is to be expected, as the functionality of the command structure is for purely offensive purposes.

As indicated previously, the weapons systems modeled do not represent any real system, Red or Blue. The results obtained through this research are promising. While AFSIM is capable of high-fidelity, physics-based modeling of combat systems and subsystems to include 6 DOF movement through space, this research used point representations of agents to keep the results publicly releasable. Therefore, additional modeling at higher fidelity is required before making programmatic decisions based on this research. The scenarios must be tested with real system data. AFSIM allows this through its modular design with plug-in capability for real system performance parameters and scenario configurations/laydowns, but this is beyond the scope of this research effort.

Additionally, the bomber was set to Indestructible within the scenario. As indicated, the scenario was extremely challenging with more Red threats than could be prosecuted by the cruise missile swarm. As such, we did not contemplate an ultimate mission success metric such as Number of times the penetration bomber reached its intended target. The intent of the research was to find the value or contribution of factors representing various aspects of autonomy and human-autonomous system behaviors. Future research may examine more operationally realistic strike packages to measure overall mission effectiveness.

This section presents the conclusions drawn from this research effort. The simulation results are connected back to the problem statement to provide answers to the research questions. Finally, recommendations are provided for future research threads based on these results and conclusions.

As requirements for autonomous technology in military applications grow, so does the need for continual research, development, testing and evaluation of these systems. This research effort proposed a four dimensional framework for autonomy, aiming to increase the versatility and effectiveness of previously defined lower dimensional efforts (Goggins, 2022; Pollack, 2021).

Specifically, this study defines autonomous systems based on their ability to act alone, ability for intra-swarm communication, ability to adapt and ability for leader-follower cooperation. By applying this framework to a swarm of cruise missiles, an experiment was able to be executed on the effectiveness of autonomy in support of a strike mission by a manned penetrating bomber through an A2AD battle space. The two research questions which guided this study are discussed below.

  1. To what extent can autonomy in the application of cruise missile swarms be advanced from a previously defined three-dimensional framework?

The ability to act alone was advanced by creating a “smart” engagement algorithm that allows for least intrusion into all threat zones by an agent during the calculation of its flight path. This maximized the radial distance from the center of known threat zones that each cruise missile flew into, allowing the lowest probability for detection by radar. The ability for intra-swarm communication was advanced by improving targeting criteria for the swarm, enabling reassignments to happen only if the subsequent Red entity was of higher value and closer to the individual agent. Additionally, enforcing a minimum distance that each agent must be from their current target before reassigning to a new target prevented unrealistic and last second changes. The ability to adapt involves a threat processing algorithm that detects radiation emitting sources and enables evasive maneuvering, if necessary. Improvements in the speed at which the algorithm can be executed allowed for an 80% increase in internal threat processing time. Lastly, a fourth dimension was added onto the autonomous framework that defined the ability for leader-follower cooperation through a manned-unmanned team. This provides an operational structure for the Blue strike package whereby the manned penetrating bomber acts as the commander of the swarm of cruise missiles. This affords the bomber the ability to issue commands to the swarm and override the swarm’s targeting scheme.

  1. To what degree does autonomy aid in the offensive and defensive capabilities of Blue forces under the prescribed conditions?

The ability to act alone, ability for intra-swarm communication and ability for leader-follower cooperation all provide a small, but positive increase on the average number of Red entities killed. The largest average increase being the ability for intra-swarm communication at 1.0%. The ability to adapt surprisingly decreases the number of Red entities killed by on average 5.48%. However, when considering all levels set to low, the cruise missiles still engage their pre-briefed targets to a lethal degree. The low variation among the application or omission of autonomy on the number of Red entities killed by the swarm suggests that this IADS scenario may not be complex enough to fully answer the research question. When considering the pop-up threat, the ability for intra-swarm communication, ability to adapt and ability for leader-follower cooperation all positively affect the swarm’s capacity for detecting and destroying the stochastic entity. The ability for intra-swarm communication increases the probability of this occurring by 51.9%. The ability to adapt and ability for leader-follower cooperation follow with a 37.4% increase and 10.6% increase, respectively. Importantly, the ability for leader-follower cooperation showed significance towards the lethality of the swarm in both MOE 1.1 and 1.2, providing evidence that the interaction of manned-unmanned teams will benefit combat operations within an A2AD environment.

The ability to act alone, ability for intra-swarm communication and ability to adapt are all statistically significant in their effect on survivability the Blue forces. The ability to adapt causes detriment to the capabilities of the swarm with a 4.81% increase in the number of SAM strikes on the manned bomber as well as an 18.66% increase in the number of cruise missiles shot down. The ability for intra-swarm communication proves to be the most valuable defensive measure within the autonomous framework by causing a 3.66% decrease in the number of SAM strikes on the manned bomber, as well as a 21.8% decrease in the number of cruise missiles shot down. Lastly, the ability to act alone decreases the number of cruise missiles shot down by 11.0%. As expected, the ability for leader-follower cooperation is not significant towards the defensive capabilities of the Blue forces.

As an area of research, the integration of autonomous combat systems is broad with many avenues available for additional research. This research provided insights into variations of autonomous behaviors as they relate to a specific scenario. Additional research could examine either additional behaviors, additional scenarios with higher or lower levels of threat or combinations of behaviors and scenarios. Inclusion of joint assets and tactics is also an area of interest being explored (Martinez, 2023; Martinez et al., 2024) and may be expanded similarly.

The axes of autonomy (i.e. what defines autonomous systems and behaviors) is also a potential area for additional modeling research. While the levels established through this research define autonomy in a general way, there may be other situations where other definitions are more applicable. Reframing the definition of autonomy to that of a continuous spectrum may open context-specific solutions that emerge for optimal performance depending on the battle space. In particular, allowing the agent to learn successful strategies of actions through reinforcement learning has the potential to leverage advances in machine learning techniques. Nascent research shows promise in defining autonomous behaviors in air-to-air combat scenarios, for example (Taylor, 2023; Pike, 2024; Combs, 2024). New and inventive ways to define and implement autonomy will continue to drive the overall posture of air superiority by the United States Air Force.
AFDP1
(
2021
),
Air Force Doctrine Publication 1
,
Technical report, US Department of the Air Force
,
Washington, DC
.
Banks
,
J.
,
Carson II
,
J.S.
,
Nelson
,
B.L.
and
Nicol
,
D.M.
(
2005)1999
),
Discrete-Event System Simulation
, (2 edn) ,
Prentice Hall
,
Upper Saddle River, NJ.’
.
Bruns
,
R.D.
(
2022
), “
Simulation and analysis of high value airborne asset defense effectiveness with kinetic weapons and noise jamming
”,
Master’s thesis, Air Force Institute of Technology
, Wright Patterson AFB,
OH
.
Ciaravino
,
M.A.
(
2020
), “Simulation and analysis of cyber operations for A2ad using Afsim”,
Master’s thesis, Air Force Institute of Technology
,
Wright Patterson AFB, OH
.
Collins
,
A.J.
and
Frydenlund
,
E.
(
2017
), “
Strategic group formation in agent-based simulation
”,
Simulation
, Vol. 
94
No. 
3
, pp. 
179
-
193
, doi: .
Combs
,
J.
(
2024
), “Reinforcement learning for team based air combat maneuvering decisions with directed energy weaponry”,
Master’s thesis
,
Air Force Institute of Technology
,
Wright Patterson AFB, OH
.
David
,
R.
(
2016
), “
Final report of the defense science board summer study on autonomy”
,
publicly-releasable version, technical report, Department of Defense Defense Science Board
,
Washington D.C.
,
available at:
 https://apps.dtic.mil/sti/pdfs/AD1017790.pdf
DoDD3000.09
(
2023
),
Dod Directive 3000.09: Autonomy in Weapon Systems
,
Technical report, Office of the Under Secretary of Defense for Policy
:
Washington, DC
,
available at:
 https://media.defense.gov/2023/Jan/25/2003149928/-1/-1/0/DOD-DIRECTIVE-3000.09-AUTONOMY-IN-WEAPON-SYSTEMS.PDF
Drew
,
D.S.
(
2021
), “
Multi-agent systems for search and rescue applications
”,
Current Robotics Reports
, Vol. 
2
2
, pp. 
189
-
200
, doi: .
DSBTF
(
2012
), “Defense science board task force report: the role of autonomy in DoD systems”,
publicly-releasable version, technical report, Department of Defense Defense Science Board
,
Washington D.C.
Goggins
,
K.W.
(
2022
), “Simulating autonomous cruise missile swarm behaviors in an anti-access area denial (A2AD) environment”,
Master’s thesis, Air Force Institute of Technology
,
Wright Patterson AFB, OH
.
Harper
,
D.J.
(
2020
), “
Operations analysis integration for effectiveness-based design in the AFRL expedite program
”,
AIAA Scitech 2020 Forum
, pp.
1
-
14
, doi: .
Hill
,
R.R.
,
Champagne
,
L.E.
and
Price
,
J.C.
(
2004
), “
Using agent-based simulation and game theory to examine the wwii bay of biscay u-boat campaign
”,
The Journal of Defense Modeling and Simulation
, Vol. 
1
No. 
2
, pp. 
99
-
109
, doi: .
Herzog
,
S.
and
Kunertova
,
D.
(
2024
), “
Nato and emerging technologies - the alliances’s shifting approach to military innovation
”,
Naval War College Review
, Vol.
772
. pp.
47
-
69
,
available at:
 https://digital-commons.usnwc.edu/nwc-review/vol77/iss2/5
Hill
,
R.R.
,
Carl
,
R.G.
and
Champagne
,
L.E.
(
2006
), “
Using agent-based simulation to empirically examine search theory using a historical case study
”,
Journal of Simulation
, Vol. 
1
1
, pp. 
29
-
38
, doi: .
Huang
,
H.-M.
,
Pavek
,
K.
,
Albus
,
J.
and
Messina
,
E.
(
2005
),
Autonomy levels for unmanned systems (ALFUS) framework: an update
, in 
G.R.
 
Gerhart
,
C.M.
 
Shoemaker
and
D.W.
 
Gage
, eds, “
Proceedings Volume 5804, Unmanned Ground Vehicle Technology VII
”,
Orlando, Florida, USA
, p.
439
,
available at:
 http://proceedings.spiedigitallibrary.org/proceeding.aspx?doi=10.1117/12.603725
Ilachinski
,
A.
(
1999
), “
Towards a science of experimental complexity: an artificial-life approach to modeling warfare
”,
5th Experimental Chaos Conference
,
Citeseer
.
JP3-01
(
2023
), “Jp 3-01. Countering air and missile threats”,
technical report, U.S. Department of Defense
,
Washington D.C.
Koehler
,
M.T.K.
,
Bricio-Neto
,
J.L.
,
Page
,
E.H.
and
Tolk
,
A.
(
2021
), “
Applying complex adaptive systems research results to combat simulations of the generation-after-next
”,
The Journal of Defense Modeling and Simulation
, Vol. 
0
0
, 15485129241233608, doi: .
Lasconjarias
,
G.
(
2019
), “
Nato's response to Russian a2/ad in the Baltic states: going beyond conventional?
”,
Scandinavian Journal of Military Studies
, Vol. 
2
No. 
1
, pp. 
74
-
83
, doi: .
Li
,
J.
and
Giabbanelli
,
P.
(
2021
), “
Returning to a normal life via covid-19 vaccines in the United States: a large-scale agent-based simulation study
”,
JMIR Medical Informatics
, Vol. 
9
4
, e27419, doi: ,
available at:
 https://medinform.jmir.org/2021/4/e27419
Liu
,
R.
,
Jiang
,
D.
and
Shi
,
L.
(
2016
), “
Agent-based simulation of alternative classroom evacuation scenarios
”,
Frontiers of Architectural Research
, Vol. 
5
1
, pp. 
111
-
125
, doi: ,
available at:
 https://www.sciencedirect.com/science/article/pii/S2095263515000710
Macal
,
C.M.
(
2016
), “
Everything you need to know about agent-based modelling and simulation
”,
Journal of Simulation
, Vol. 
10
2
, pp. 
144
-
156
, doi: .
Macal
,
C.M.
,
Collier
,
N.T.
,
Ozik
,
J.
,
Tatara
,
E.R.
and
Murphy
,
J.T.
(
2018
), “
Chisim: an agent-based simulation model of social interactions in a large urban area
”,
2018 Winter Simulation Conference (WSC)
, pp. 
810
-
820
.
MacWilkinson
,
C.
(
2023
), “Advancing autonomous swarm behavior in a simulated anti-access area denial (A2ad) environment”,
Master’s thesis, Air Force Institute of Technology (AFIT)
,
Wright Patterson AFB, OH
.
Martinez
,
A.
(
2023
), “Simulating autonomous drone swarm behaviors in an anti-access area denial (A2ad) environment”,
Master’s thesis, Air Force Institute of Technology (AFIT)
,
Wright Patterson AFB, OH
.
Martinez
,
A.
,
Champagne
,
L.
and
LaCasse
,
P.
(
2024
), “
Simulating autonomous drone behaviors in an anti-access area denial (a2ad) environment
”,
Journal of Defense Modeling and Simulation: Applications, Methodology, Technology
, doi: .
Montgomery
,
D.
(
2020
),
Design and Analysis of Experiments
, (10 edn) ,
Wiley
,
New Jersey
.
NDS
(
2018
), “
Summary of the 2018 national defense strategy of the United States of America
”.
NDS
(
2022
), “
2022 national defense strategy of the United States of America
”.
Pescatore
,
M.
and
Beery
,
P.
(
2024
), “
Interoperability analysis via agent-based simulation
”,
The Journal of Defense Modeling and Simulation
, Vol. 
21
No. 
1
, pp. 
103
-
116
, doi: .
Pike
,
J.
(
2024
), “
A reinforcement learning approach to the 2v2 beyond visual range air combat maneuvering problem
”,
Master’s thesis
,
Air Force Institute of Technology
,
Wright Patterson AFB, OH
.
Pollack
,
N.A.
(
2021
),
Simulation and Analysis of High Value Airborne Asset Defense with Autonomous Systems
,
Master’s thesis
,
Air Force Institute of Technology, Wright-Patterson Air Force Base
.
Reid
,
D.C.
,
Champagne
,
L.E.
and
Gaw
,
N.B.
(
2023
), “
Implementing efficient dynamic threat avoidance routing based on dijkstra's shortest path algorithm in the advanced framework for simulation, integration, and modeling (AFSIM)
”,
2023 Winter Simulation Conference (WSC)
, pp. 
2415
-
2426
, doi: .
Rosa
,
E.
,
D'Angelo
,
G.
and
Ferretti
,
S.
(
2019
), “Agent-based simulation of blockchains”, in
Tan
,
G.
,
Lehmann
,
A.
,
Teo
,
Y.M.
and
Cai
,
W.
(Eds),
Methods and Applications for Modeling and Simulation of Complex Systems
,
Springer Singapore
,
Singapore
, pp. 
115
-
126
.
Serré
,
L.
,
Amyot-Bourgeois
,
M.
and
Astles
,
B.
(
2021
), “
Use of Shapley additive explanations in interpreting agent-based simulations of military operational scenarios
”,
2021 Annual Modeling and Simulation Conference (ANNSIM)
, pp. 
1
-
12
.
Sobkowicz
,
P.
and
Sobkowicz
,
A.
(
2021
), “
Agent based model of anti-vaccination movements: simulations and comparison with empirical data
”,
Vaccines
, Vol. 
9
8
, p.
809
, ,
available at:
 https://www.mdpi.com/2076-393X/9/8/809
Spiegel
,
C.
,
Shideler
,
T.
and
Franke
,
J.
(
2019
), “
A framework for autonomy: a short paper on the first principles of autonomous design
”.
Sukhankin
,
S.
(
2018
), “
From bridge of cooperation to a2/ad bubble: the dangerous transformation of Kaliningrad oblast
”,
Journal of Slavic Military Studies
, Vol. 
31
No. 
1
, pp. 
15
-
36
, doi: .
Sulis
,
E.
and
Terna
,
P.
(
2021
), “
An agent-based decision support for a vaccination campaign
”,
Journal of Medical Systems
, Vol. 
45
11
, p.
97
, doi: .
Taylor
,
C.
(
2023
), “
A reinforcement learning approach to a beyond visual range air combat maneuvering problem
”,
Master’s thesis
,
Air Force Institute of Technology
,
Wright Patterson AFB, OH
.
Tryhorn
,
D.
,
Dill
,
R.
,
Hodson
,
D.D.
,
Grimaila
,
M.R.
and
Myers
,
C.W.
(
2023
), “
Modeling fog of war effects in afsim
”,
The Journal of Defense Modeling and Simulation
, Vol. 
20
No. 
2
, pp. 
131
-
146
, doi: .
Weimer
,
C.W.
,
Miller
,
J.O.
and
Hill
,
R.R.
(
2016
), “
Agent-based modeling: an introduction and primer
”,
2016 Winter Simulation Conference (WSC)
, pp. 
65
-
79
, doi: .
West
,
T.
and
Birkmire
,
B.
(
2020
), “
Afsim
”,
CSIAC
, Vol. 
7
No. 
3
, p.
50
.
Wilson
,
H.
(
2019
),
United states Air Force Science and Technology Strategy: Strengthening Usaf Science Nd Technology for 2030 and beyond, Technical Report
,
US Department of the Air Force
,
Washington, DC
.
Yang
,
H.-y.
,
Zhang
,
S.-w.
and
Li
,
X.-y.
(
2019
), “
Modeling of situation assessment in regional air defense combat
”,
Journal of Defense Modeling and Simulation
, Vol. 
16
No. 
2
, pp. 
91
-
101
, doi: .
Yevtodyeva
,
M.G.
(
2022
), “
Development of the Chinese a2/ad system in the context of us-China relations
”,
Herald of the Russian Academy of Sciences
, Vol. 
92
No. 
S6
, pp. 
S534
-
S542
, doi: .
Published in Journal of Defense Analytics and Logistics. Published by Emerald Publishing Limited

Data & Figures

Figure 1
A scatter plot with error bars shows the mean number of red entities killed across 16 treatments.The scatter graph is titled “Mean number of red entities killed versus treatment.” The horizontal axis of the graph is labeled “Treatment” and ranges from 0 to 17 in increments of 1 unit. The vertical axis is labeled “Number of red entities killed” and ranges from 20.5 to 23.0 in increments of 0.5 units. A legend at the top right shows the mean represented by a dot. The error line represents a 95 percent confidence interval. The data shows the mean value of the number of red entities killed, the positive error, and the negative error for every treatment count. The data from the graph is as follows: Treatment 1: Mean: 22.464; Positive error: 22.73; Negative error: 22.184. Treatment 2: Mean: 22.179; Positive error: 22.479; Negative error: 21.883. Treatment 3: Mean: 21.693; Positive error: 22.013; Negative error: 21.357. Treatment 4: Mean: 20.786; Positive error: 21.137; Negative error: 20.440. Treatment 5: Mean: 22.264; Positive error: 22.524; Negative error: 21.973. Treatment 6: Mean: 22.204; Positive error: 22.479; Negative error: 21.923. Treatment 7: Mean: 21.051; Positive error: 21.342; Negative error: 20.746. Treatment 8: Mean: 20.971; Positive error: 21.272; Negative error: 20.656. Treatment 9: Mean: 22.649; Positive error: 22.935; Negative error: 22.364. Treatment 10: Mean: 22.389; Positive error: 22.679; Negative error: 22.093. Treatment 11: Mean: 22.224; Positive error: 22.544; Negative error: 21.878. Treatment 12: Mean: 21.372; Positive error: 21.708; Negative error: 21.041. Treatment 13: Mean: 22.299; Positive error: 22.579; Negative error: 22.013. Treatment 14: Mean: 22.284; Positive error: 22.564; Negative error: 21.988. Treatment 15: Mean: 21.397; Positive error: 21.663; Negative error: 21.042. Treatment 16: Mean: 21.412; Positive error: 21.673; Negative error: 21.132. Note: All numerical data values are approximated.

Red IADS force lay down. Source: Author generated

Figure 1
A scatter plot with error bars shows the mean number of red entities killed across 16 treatments.The scatter graph is titled “Mean number of red entities killed versus treatment.” The horizontal axis of the graph is labeled “Treatment” and ranges from 0 to 17 in increments of 1 unit. The vertical axis is labeled “Number of red entities killed” and ranges from 20.5 to 23.0 in increments of 0.5 units. A legend at the top right shows the mean represented by a dot. The error line represents a 95 percent confidence interval. The data shows the mean value of the number of red entities killed, the positive error, and the negative error for every treatment count. The data from the graph is as follows: Treatment 1: Mean: 22.464; Positive error: 22.73; Negative error: 22.184. Treatment 2: Mean: 22.179; Positive error: 22.479; Negative error: 21.883. Treatment 3: Mean: 21.693; Positive error: 22.013; Negative error: 21.357. Treatment 4: Mean: 20.786; Positive error: 21.137; Negative error: 20.440. Treatment 5: Mean: 22.264; Positive error: 22.524; Negative error: 21.973. Treatment 6: Mean: 22.204; Positive error: 22.479; Negative error: 21.923. Treatment 7: Mean: 21.051; Positive error: 21.342; Negative error: 20.746. Treatment 8: Mean: 20.971; Positive error: 21.272; Negative error: 20.656. Treatment 9: Mean: 22.649; Positive error: 22.935; Negative error: 22.364. Treatment 10: Mean: 22.389; Positive error: 22.679; Negative error: 22.093. Treatment 11: Mean: 22.224; Positive error: 22.544; Negative error: 21.878. Treatment 12: Mean: 21.372; Positive error: 21.708; Negative error: 21.041. Treatment 13: Mean: 22.299; Positive error: 22.579; Negative error: 22.013. Treatment 14: Mean: 22.284; Positive error: 22.564; Negative error: 21.988. Treatment 15: Mean: 21.397; Positive error: 21.663; Negative error: 21.042. Treatment 16: Mean: 21.412; Positive error: 21.673; Negative error: 21.132. Note: All numerical data values are approximated.

Red IADS force lay down. Source: Author generated

Close Figure 1
Figure 2
A scatter plot with error bars shows the mean pop up threat killed across 16 treatments.The scatter graph is titled “Mean Pop Up Threat Killed versus Treatment.” The horizontal axis of the graph is labeled “Treatment” and ranges from 0 to 17 in increments of 1 unit. The vertical axis is labeled “Pop Up Threat Killed” and ranges from 0 to 1.0 in increments of 0.2 units. A legend at the top right shows the mean represented by a dot. The error line represents a 95 percent confidence interval. The data shows the mean value of pop-up threats killed, along with the positive and negative errors for each treatment value. The data from the graph is as follows: Treatment 1: Mean: 0; Positive error: 0; Negative error: 0. Treatment 2: Mean: 0.054; Positive error: 0.096; Negative error: 0.011. Treatment 3: Mean: 0; Positive error: 0; Negative error: 0. Treatment 4: Mean: 0.379; Positive error: 0.471; Negative error: 0.283. Treatment 5: Mean: 0.277; Positive error: 0.368; Negative error: 0.192. Treatment 6: Mean: 0.284; Positive error: 0.368; Negative error: 0.192. Treatment 7: Mean: 0.891; Positive error: 0.947; Negative error: 0.830. Treatment 8: Mean: 0.895; Positive error: 0.946; Negative error: 0.832. Treatment 9: Mean: 0; Positive error: 0; Negative error: 0. Treatment 10: Mean: 0.062; Positive error: 0.111; Negative error: 0.016. Treatment 11: Mean: 0; Positive error: 0; Negative error: 0. Treatment 12: Mean: 0.361; Positive error: 0.453; Negative error: 0.263. Treatment 13: Mean: 0.380; Positive error: 0.473; Negative error: 0.284. Treatment 14: Mean: 0.377; Positive error: 0.473; Negative error: 0.283. Treatment 15: Mean: 0.473; Positive error: 0.973; Negative error: 0.880. Treatment 16: Mean: 0.933; Positive error: 0.973; Negative error: 0.882. Note: All numerical data values are approximated.

Number of red entities killed versus treatment. Source: Author generated

Figure 2
A scatter plot with error bars shows the mean pop up threat killed across 16 treatments.The scatter graph is titled “Mean Pop Up Threat Killed versus Treatment.” The horizontal axis of the graph is labeled “Treatment” and ranges from 0 to 17 in increments of 1 unit. The vertical axis is labeled “Pop Up Threat Killed” and ranges from 0 to 1.0 in increments of 0.2 units. A legend at the top right shows the mean represented by a dot. The error line represents a 95 percent confidence interval. The data shows the mean value of pop-up threats killed, along with the positive and negative errors for each treatment value. The data from the graph is as follows: Treatment 1: Mean: 0; Positive error: 0; Negative error: 0. Treatment 2: Mean: 0.054; Positive error: 0.096; Negative error: 0.011. Treatment 3: Mean: 0; Positive error: 0; Negative error: 0. Treatment 4: Mean: 0.379; Positive error: 0.471; Negative error: 0.283. Treatment 5: Mean: 0.277; Positive error: 0.368; Negative error: 0.192. Treatment 6: Mean: 0.284; Positive error: 0.368; Negative error: 0.192. Treatment 7: Mean: 0.891; Positive error: 0.947; Negative error: 0.830. Treatment 8: Mean: 0.895; Positive error: 0.946; Negative error: 0.832. Treatment 9: Mean: 0; Positive error: 0; Negative error: 0. Treatment 10: Mean: 0.062; Positive error: 0.111; Negative error: 0.016. Treatment 11: Mean: 0; Positive error: 0; Negative error: 0. Treatment 12: Mean: 0.361; Positive error: 0.453; Negative error: 0.263. Treatment 13: Mean: 0.380; Positive error: 0.473; Negative error: 0.284. Treatment 14: Mean: 0.377; Positive error: 0.473; Negative error: 0.283. Treatment 15: Mean: 0.473; Positive error: 0.973; Negative error: 0.880. Treatment 16: Mean: 0.933; Positive error: 0.973; Negative error: 0.882. Note: All numerical data values are approximated.

Number of red entities killed versus treatment. Source: Author generated

Close Figure 2
Figure 3
A scatter plot with error bars shows the mean number of S A M strikes on bomber across 16 treatments.The scatter graph is titled “Mean Number of S A M Strikes on Bomber versus Treatment.” The horizontal axis of the graph is labeled “Treatment” and ranges from 0 to 17 in increments of 1 unit. The vertical axis is labeled “Number of S A M Strikes on Bomber” and ranges from 18 to 21 in increments of 1 unit. A legend at the top right shows the mean represented by a blue dot. The red error line represents a 95 percent confidence interval. The data shows the mean value of S A M strikes on the bomber, the positive error, and the negative error for each treatment value. The data from the graph is as follows: Treatment 1: Mean: 19.822; Positive error: 20.502; Negative error: 19.128. Treatment 2: Mean: 19.822; Positive error: 20.549; Negative error: 19.074. Treatment 3: Mean: 20.359; Positive error: 21.141; Negative error: 19.564. Treatment 4: Mean: 20.882; Positive error: 21.712; Negative error: 20.046. Treatment 5: Mean: 19.040; Positive error: 19.693; Negative error: 18.360. Treatment 6: Mean: 19.210; Positive error: 19.869; Negative error: 18.551. Treatment 7: Mean: 20.842; Positive error: 21.603; Negative error: 21.039. Treatment 8: Mean: 20.746; Positive error: 21.603; Negative error: 19.890. Treatment 9: Mean: 19.951; Positive error: 20.651; Negative error: 19.210. Treatment 10: Mean: 20.216; Positive error: 20.957; Negative error: 19.462. Treatment 11: Mean: 19.931; Positive error: 20.651; Negative error: 19.190. Treatment 12: Mean: 20.740; Positive error: 21.501; Negative error: 19.944. Treatment 13: Mean: 19.210; Positive error: 19.890; Negative error: 18.503. Treatment 14: Mean: 19.394; Positive error: 20.039; Negative error: 18.693. Treatment 15: Mean: 20.604; Positive error: 21.345; Negative error: 19.822. Treatment 16: Mean: 20.590; Positive error: 21.311; Negative error: 19.863. Note: All numerical data values are approximated.

Pop-up threat killed versus treatment. Source: Author generated

Figure 3
A scatter plot with error bars shows the mean number of S A M strikes on bomber across 16 treatments.The scatter graph is titled “Mean Number of S A M Strikes on Bomber versus Treatment.” The horizontal axis of the graph is labeled “Treatment” and ranges from 0 to 17 in increments of 1 unit. The vertical axis is labeled “Number of S A M Strikes on Bomber” and ranges from 18 to 21 in increments of 1 unit. A legend at the top right shows the mean represented by a blue dot. The red error line represents a 95 percent confidence interval. The data shows the mean value of S A M strikes on the bomber, the positive error, and the negative error for each treatment value. The data from the graph is as follows: Treatment 1: Mean: 19.822; Positive error: 20.502; Negative error: 19.128. Treatment 2: Mean: 19.822; Positive error: 20.549; Negative error: 19.074. Treatment 3: Mean: 20.359; Positive error: 21.141; Negative error: 19.564. Treatment 4: Mean: 20.882; Positive error: 21.712; Negative error: 20.046. Treatment 5: Mean: 19.040; Positive error: 19.693; Negative error: 18.360. Treatment 6: Mean: 19.210; Positive error: 19.869; Negative error: 18.551. Treatment 7: Mean: 20.842; Positive error: 21.603; Negative error: 21.039. Treatment 8: Mean: 20.746; Positive error: 21.603; Negative error: 19.890. Treatment 9: Mean: 19.951; Positive error: 20.651; Negative error: 19.210. Treatment 10: Mean: 20.216; Positive error: 20.957; Negative error: 19.462. Treatment 11: Mean: 19.931; Positive error: 20.651; Negative error: 19.190. Treatment 12: Mean: 20.740; Positive error: 21.501; Negative error: 19.944. Treatment 13: Mean: 19.210; Positive error: 19.890; Negative error: 18.503. Treatment 14: Mean: 19.394; Positive error: 20.039; Negative error: 18.693. Treatment 15: Mean: 20.604; Positive error: 21.345; Negative error: 19.822. Treatment 16: Mean: 20.590; Positive error: 21.311; Negative error: 19.863. Note: All numerical data values are approximated.

Pop-up threat killed versus treatment. Source: Author generated

Close Figure 3
Figure 4
A scatter plot with error bars shows the mean number of cruise missiles destroyed across 16 treatments.The scatter graph is titled “Mean Number of Cruise Missiles Destroyed versus Treatment.” The horizontal axis of the graph is labeled “Treatment” and ranges from 0 to 17 in increments of 1 unit. The vertical axis is labeled “Number of Cruise Missiles Destroyed” and ranges from 0.6 to 1.4 in increments of 0.2 units. A legend at the top right shows the mean represented by a dot. The error line represents a 95 percent confidence interval. The data shows the mean value of cruise missiles destroyed, along with the positive and negative errors for each treatment value. The data from the graph is as follows: 1: Mean: 1.018; Positive error: 1.163; Negative error: 0.864. 2: Mean: 1.029; Positive error: 1.186; Negative error: 0.866. 3: Mean: 1.293; Positive error: 1.402; Negative error: 1.067. 4: Mean: 1.253; Positive error: 1.417; Negative error: 1.094. 5: Mean: 0.804; Positive error: 0.935; Negative error: 0.673. 6: Mean: 0.854; Positive error: 0.997; Negative error: 0.709. 7: Mean: 0.908; Positive error: 1.039; Negative error: 0.769. 8: Mean: 0.956; Positive error: 1.101; Negative error: 0.809. 9: Mean: 0.887; Positive error: 1.025; Negative error: 0.742. 10: Mean: 0.858; Positive error: 0.992; Negative error: 0.714. 11: Mean: 1.165; Positive error: 1.338; Negative error: 0.992. 12: Mean: 1.099; Positive error: 1.246; Negative error: 0.942. 13: Mean: 0.695; Positive error: 0.818; Negative error: 0.569. 14: Mean: 0.714; Positive error: 0.845; Negative error: 0.586. 15: Mean: 0.896; Positive error: 1.034; Negative error: 0.756. 16: Mean: 0.873; Positive error: 1.008; Negative error: 0.742. Note: All numerical data values are approximated.

Number of SAM strikes on bomber versus treatment. Source: Author generated

Figure 4
A scatter plot with error bars shows the mean number of cruise missiles destroyed across 16 treatments.The scatter graph is titled “Mean Number of Cruise Missiles Destroyed versus Treatment.” The horizontal axis of the graph is labeled “Treatment” and ranges from 0 to 17 in increments of 1 unit. The vertical axis is labeled “Number of Cruise Missiles Destroyed” and ranges from 0.6 to 1.4 in increments of 0.2 units. A legend at the top right shows the mean represented by a dot. The error line represents a 95 percent confidence interval. The data shows the mean value of cruise missiles destroyed, along with the positive and negative errors for each treatment value. The data from the graph is as follows: 1: Mean: 1.018; Positive error: 1.163; Negative error: 0.864. 2: Mean: 1.029; Positive error: 1.186; Negative error: 0.866. 3: Mean: 1.293; Positive error: 1.402; Negative error: 1.067. 4: Mean: 1.253; Positive error: 1.417; Negative error: 1.094. 5: Mean: 0.804; Positive error: 0.935; Negative error: 0.673. 6: Mean: 0.854; Positive error: 0.997; Negative error: 0.709. 7: Mean: 0.908; Positive error: 1.039; Negative error: 0.769. 8: Mean: 0.956; Positive error: 1.101; Negative error: 0.809. 9: Mean: 0.887; Positive error: 1.025; Negative error: 0.742. 10: Mean: 0.858; Positive error: 0.992; Negative error: 0.714. 11: Mean: 1.165; Positive error: 1.338; Negative error: 0.992. 12: Mean: 1.099; Positive error: 1.246; Negative error: 0.942. 13: Mean: 0.695; Positive error: 0.818; Negative error: 0.569. 14: Mean: 0.714; Positive error: 0.845; Negative error: 0.586. 15: Mean: 0.896; Positive error: 1.034; Negative error: 0.756. 16: Mean: 0.873; Positive error: 1.008; Negative error: 0.742. Note: All numerical data values are approximated.

Number of SAM strikes on bomber versus treatment. Source: Author generated

Close Figure 4
Figure 5
A geospatial map overlaid with a section of latitude and longitude grid lines and radial range rings.The base layer displays a detailed geographical region, with coastlines along the eastern edge and varied terrain across the western and central areas. Multiple concentric range rings, depicted as red circles, are superimposed in the southeastern portion of the map. These rings overlap with one another, forming an intersecting circular pattern with differing extents of overlap. Scattered across the map are numerous red symbols, including towers and radar icons arranged across both inland and coastal regions, inside the rings. The background also includes longitudinal and latitudinal grid lines, dividing the map into rectangular sections for reference. The gridlines indicated have the following markings: From East to West, the latitudes are marked from 70 West to 74 West in increments of 1 unit. From South to North, the longitudes are marked from 41 North to 43 North in increments of 1 unit.

Number of cruise missiles destroyed versus treatment. Source: Author generated

Figure 5
A geospatial map overlaid with a section of latitude and longitude grid lines and radial range rings.The base layer displays a detailed geographical region, with coastlines along the eastern edge and varied terrain across the western and central areas. Multiple concentric range rings, depicted as red circles, are superimposed in the southeastern portion of the map. These rings overlap with one another, forming an intersecting circular pattern with differing extents of overlap. Scattered across the map are numerous red symbols, including towers and radar icons arranged across both inland and coastal regions, inside the rings. The background also includes longitudinal and latitudinal grid lines, dividing the map into rectangular sections for reference. The gridlines indicated have the following markings: From East to West, the latitudes are marked from 70 West to 74 West in increments of 1 unit. From South to North, the longitudes are marked from 41 North to 43 North in increments of 1 unit.

Number of cruise missiles destroyed versus treatment. Source: Author generated

Close Figure 5
Table 1

Levels of combat simulation (West and Birkmire, 2020)

Simulation levelComplexity scaleTime duration
CampaignMany vs. ManyDays
MissionSome vs. SomeHours
EngagementFew vs. FewMinutes
EngineeringSubsystem interactionSeconds
Table 2

Summary of dimensions and levels of autonomy

DimensionLow levelHigh level
Ability to Act AloneEngage target withoutAvoid threat zones
course deviationwith smart engagement
Ability for Intra-Swarm CommunicationComms disabledEnabled comms allow for
 target reassignment
Ability to AdaptRWR disabledRWR enables threat
 recognition
Ability for Leader–Follower CooperationComms disabledBomber issues commands
 and information is relayed
Table 3

Target priority categories by platform type

Priority categoryPlatform type
1AOC, SAM Launcher, Pop-Up Threat
2TOC, EW Fusion Center
3EW Radar
4TAR/TER
Table 4

Experimental design matrix

TreatmentAloneIntra-swarmAdaptL/F coop
1LowLowLowLow
2LowLowLowHigh
3LowLowHighLow
4LowLowHighHigh
5LowHighLowLow
6LowHighLowHigh
7LowHighHighLow
8LowHighHighHigh
9HighLowLowLow
10HighLowLowHigh
11HighLowHighLow
12HighLowHighHigh
13HighHighLowLow
14HighHighLowHigh
15HighHighHighLow
16highHighHighHigh
Table 5

Measures of effectiveness

MOECategoryMetric
1.1OffensiveNo. of Red entities destroyed
1.2OffensivePop-up threat eliminated(Boolean)
2.1DefensiveNo. of SAM strikes on bomber
2.1DefensiveNo. of cruise missiles destroyed
Table 6

Number of red entities killed effect tests

SourceSum of squaresF ratioProb > F
Alone36.9115.33<0.0001
Intra-Swarm23.289.6690.0019
Adapt395.0161.4<0.0001
L/F Coop36.9115.33<0.0001
Alone*Intra-Swarm2.3260.9660.3259
Alone*Adapt11.734.8720.0274
Intra-Swarm*Adapt2.4811.0300.3103
Alone*L/F Coop0.2760.1150.7352
Intra-Swarm*L/F Coop29.4312.220.0005
Adapt*L/F Coop9.1513.8010.0514
Intra-Swarm*Adapt*L/F Coop9.4563.9270.0477
Table 7

Pop-up threat killed effect likelihood ratio tests

SourceLikelihood ratio χ2Prob >χ2
Alone1.4120.2347
Intra-Swarm620.1<0.0001
Adapt211.1<0.0001
L/F Coop94.24<0.0001
Alone*Intra-Swarm1.4190.2336
Alone*Adapt0.0010.9808
Intra-Swarm*Adapt3.4770.0622
Alone*L/F Coop01.000
Intra-Swarm*L/F Coop67.24<0.0001
Adapt*L/F Coop01.000
Table 8

Number of SAM strikes on bomber effect tests

SourceSum of squaresF ratioProb > F
Alone0.0900.0070.9353
Intra-Swarm27.041.9780.1593
Adapt390.128.53<0.0001
L/F Coop21.621.5850.2082
Alone*Intra-Swarm0.00060.0001.000
Alone*Adapt19.801.4520.2284
Intra-Swarm*Adapt87.426.4100.0114
Alone*L/F Coop2.4030.1760.6747
Intra-Swarm*L/F Coop10.560.7750.3790
Adapt*L/F Coop2.2500.1650.6847
Table 9

Number of cruise missiles destroyed effect tests

SourceSum of squaresF ratioProb > F
Alone4.7318.7400.0032
Intra-Swarm20.9338.67<0.0001
Adapt14.6327.03<0.0001
L/F Coop0.0060.0100.9188

Supplements

References

AFDP1
(
2021
),
Air Force Doctrine Publication 1
,
Technical report, US Department of the Air Force
,
Washington, DC
.
Banks
,
J.
,
Carson II
,
J.S.
,
Nelson
,
B.L.
and
Nicol
,
D.M.
(
2005)1999
),
Discrete-Event System Simulation
, (2 edn) ,
Prentice Hall
,
Upper Saddle River, NJ.’
.
Bruns
,
R.D.
(
2022
), “
Simulation and analysis of high value airborne asset defense effectiveness with kinetic weapons and noise jamming
”,
Master’s thesis, Air Force Institute of Technology
, Wright Patterson AFB,
OH
.
Ciaravino
,
M.A.
(
2020
), “Simulation and analysis of cyber operations for A2ad using Afsim”,
Master’s thesis, Air Force Institute of Technology
,
Wright Patterson AFB, OH
.
Collins
,
A.J.
and
Frydenlund
,
E.
(
2017
), “
Strategic group formation in agent-based simulation
”,
Simulation
, Vol. 
94
No. 
3
, pp. 
179
-
193
, doi: .
Combs
,
J.
(
2024
), “Reinforcement learning for team based air combat maneuvering decisions with directed energy weaponry”,
Master’s thesis
,
Air Force Institute of Technology
,
Wright Patterson AFB, OH
.
David
,
R.
(
2016
), “
Final report of the defense science board summer study on autonomy”
,
publicly-releasable version, technical report, Department of Defense Defense Science Board
,
Washington D.C.
,
available at:
 https://apps.dtic.mil/sti/pdfs/AD1017790.pdf
DoDD3000.09
(
2023
),
Dod Directive 3000.09: Autonomy in Weapon Systems
,
Technical report, Office of the Under Secretary of Defense for Policy
:
Washington, DC
,
available at:
 https://media.defense.gov/2023/Jan/25/2003149928/-1/-1/0/DOD-DIRECTIVE-3000.09-AUTONOMY-IN-WEAPON-SYSTEMS.PDF
Drew
,
D.S.
(
2021
), “
Multi-agent systems for search and rescue applications
”,
Current Robotics Reports
, Vol. 
2
2
, pp. 
189
-
200
, doi: .
DSBTF
(
2012
), “Defense science board task force report: the role of autonomy in DoD systems”,
publicly-releasable version, technical report, Department of Defense Defense Science Board
,
Washington D.C.
Goggins
,
K.W.
(
2022
), “Simulating autonomous cruise missile swarm behaviors in an anti-access area denial (A2AD) environment”,
Master’s thesis, Air Force Institute of Technology
,
Wright Patterson AFB, OH
.
Harper
,
D.J.
(
2020
), “
Operations analysis integration for effectiveness-based design in the AFRL expedite program
”,
AIAA Scitech 2020 Forum
, pp.
1
-
14
, doi: .
Hill
,
R.R.
,
Champagne
,
L.E.
and
Price
,
J.C.
(
2004
), “
Using agent-based simulation and game theory to examine the wwii bay of biscay u-boat campaign
”,
The Journal of Defense Modeling and Simulation
, Vol. 
1
No. 
2
, pp. 
99
-
109
, doi: .
Herzog
,
S.
and
Kunertova
,
D.
(
2024
), “
Nato and emerging technologies - the alliances’s shifting approach to military innovation
”,
Naval War College Review
, Vol.
772
. pp.
47
-
69
,
available at:
 https://digital-commons.usnwc.edu/nwc-review/vol77/iss2/5
Hill
,
R.R.
,
Carl
,
R.G.
and
Champagne
,
L.E.
(
2006
), “
Using agent-based simulation to empirically examine search theory using a historical case study
”,
Journal of Simulation
, Vol. 
1
1
, pp. 
29
-
38
, doi: .
Huang
,
H.-M.
,
Pavek
,
K.
,
Albus
,
J.
and
Messina
,
E.
(
2005
),
Autonomy levels for unmanned systems (ALFUS) framework: an update
, in 
G.R.
 
Gerhart
,
C.M.
 
Shoemaker
and
D.W.
 
Gage
, eds, “
Proceedings Volume 5804, Unmanned Ground Vehicle Technology VII
”,
Orlando, Florida, USA
, p.
439
,
available at:
 http://proceedings.spiedigitallibrary.org/proceeding.aspx?doi=10.1117/12.603725
Ilachinski
,
A.
(
1999
), “
Towards a science of experimental complexity: an artificial-life approach to modeling warfare
”,
5th Experimental Chaos Conference
,
Citeseer
.
JP3-01
(
2023
), “Jp 3-01. Countering air and missile threats”,
technical report, U.S. Department of Defense
,
Washington D.C.
Koehler
,
M.T.K.
,
Bricio-Neto
,
J.L.
,
Page
,
E.H.
and
Tolk
,
A.
(
2021
), “
Applying complex adaptive systems research results to combat simulations of the generation-after-next
”,
The Journal of Defense Modeling and Simulation
, Vol. 
0
0
, 15485129241233608, doi: .
Lasconjarias
,
G.
(
2019
), “
Nato's response to Russian a2/ad in the Baltic states: going beyond conventional?
”,
Scandinavian Journal of Military Studies
, Vol. 
2
No. 
1
, pp. 
74
-
83
, doi: .
Li
,
J.
and
Giabbanelli
,
P.
(
2021
), “
Returning to a normal life via covid-19 vaccines in the United States: a large-scale agent-based simulation study
”,
JMIR Medical Informatics
, Vol. 
9
4
, e27419, doi: ,
available at:
 https://medinform.jmir.org/2021/4/e27419
Liu
,
R.
,
Jiang
,
D.
and
Shi
,
L.
(
2016
), “
Agent-based simulation of alternative classroom evacuation scenarios
”,
Frontiers of Architectural Research
, Vol. 
5
1
, pp. 
111
-
125
, doi: ,
available at:
 https://www.sciencedirect.com/science/article/pii/S2095263515000710
Macal
,
C.M.
(
2016
), “
Everything you need to know about agent-based modelling and simulation
”,
Journal of Simulation
, Vol. 
10
2
, pp. 
144
-
156
, doi: .
Macal
,
C.M.
,
Collier
,
N.T.
,
Ozik
,
J.
,
Tatara
,
E.R.
and
Murphy
,
J.T.
(
2018
), “
Chisim: an agent-based simulation model of social interactions in a large urban area
”,
2018 Winter Simulation Conference (WSC)
, pp. 
810
-
820
.
MacWilkinson
,
C.
(
2023
), “Advancing autonomous swarm behavior in a simulated anti-access area denial (A2ad) environment”,
Master’s thesis, Air Force Institute of Technology (AFIT)
,
Wright Patterson AFB, OH
.
Martinez
,
A.
(
2023
), “Simulating autonomous drone swarm behaviors in an anti-access area denial (A2ad) environment”,
Master’s thesis, Air Force Institute of Technology (AFIT)
,
Wright Patterson AFB, OH
.
Martinez
,
A.
,
Champagne
,
L.
and
LaCasse
,
P.
(
2024
), “
Simulating autonomous drone behaviors in an anti-access area denial (a2ad) environment
”,
Journal of Defense Modeling and Simulation: Applications, Methodology, Technology
, doi: .
Montgomery
,
D.
(
2020
),
Design and Analysis of Experiments
, (10 edn) ,
Wiley
,
New Jersey
.
NDS
(
2018
), “
Summary of the 2018 national defense strategy of the United States of America
”.
NDS
(
2022
), “
2022 national defense strategy of the United States of America
”.
Pescatore
,
M.
and
Beery
,
P.
(
2024
), “
Interoperability analysis via agent-based simulation
”,
The Journal of Defense Modeling and Simulation
, Vol. 
21
No. 
1
, pp. 
103
-
116
, doi: .
Pike
,
J.
(
2024
), “
A reinforcement learning approach to the 2v2 beyond visual range air combat maneuvering problem
”,
Master’s thesis
,
Air Force Institute of Technology
,
Wright Patterson AFB, OH
.
Pollack
,
N.A.
(
2021
),
Simulation and Analysis of High Value Airborne Asset Defense with Autonomous Systems
,
Master’s thesis
,
Air Force Institute of Technology, Wright-Patterson Air Force Base
.
Reid
,
D.C.
,
Champagne
,
L.E.
and
Gaw
,
N.B.
(
2023
), “
Implementing efficient dynamic threat avoidance routing based on dijkstra's shortest path algorithm in the advanced framework for simulation, integration, and modeling (AFSIM)
”,
2023 Winter Simulation Conference (WSC)
, pp. 
2415
-
2426
, doi: .
Rosa
,
E.
,
D'Angelo
,
G.
and
Ferretti
,
S.
(
2019
), “Agent-based simulation of blockchains”, in
Tan
,
G.
,
Lehmann
,
A.
,
Teo
,
Y.M.
and
Cai
,
W.
(Eds),
Methods and Applications for Modeling and Simulation of Complex Systems
,
Springer Singapore
,
Singapore
, pp. 
115
-
126
.
Serré
,
L.
,
Amyot-Bourgeois
,
M.
and
Astles
,
B.
(
2021
), “
Use of Shapley additive explanations in interpreting agent-based simulations of military operational scenarios
”,
2021 Annual Modeling and Simulation Conference (ANNSIM)
, pp. 
1
-
12
.
Sobkowicz
,
P.
and
Sobkowicz
,
A.
(
2021
), “
Agent based model of anti-vaccination movements: simulations and comparison with empirical data
”,
Vaccines
, Vol. 
9
8
, p.
809
, ,
available at:
 https://www.mdpi.com/2076-393X/9/8/809
Spiegel
,
C.
,
Shideler
,
T.
and
Franke
,
J.
(
2019
), “
A framework for autonomy: a short paper on the first principles of autonomous design
”.
Sukhankin
,
S.
(
2018
), “
From bridge of cooperation to a2/ad bubble: the dangerous transformation of Kaliningrad oblast
”,
Journal of Slavic Military Studies
, Vol. 
31
No. 
1
, pp. 
15
-
36
, doi: .
Sulis
,
E.
and
Terna
,
P.
(
2021
), “
An agent-based decision support for a vaccination campaign
”,
Journal of Medical Systems
, Vol. 
45
11
, p.
97
, doi: .
Taylor
,
C.
(
2023
), “
A reinforcement learning approach to a beyond visual range air combat maneuvering problem
”,
Master’s thesis
,
Air Force Institute of Technology
,
Wright Patterson AFB, OH
.
Tryhorn
,
D.
,
Dill
,
R.
,
Hodson
,
D.D.
,
Grimaila
,
M.R.
and
Myers
,
C.W.
(
2023
), “
Modeling fog of war effects in afsim
”,
The Journal of Defense Modeling and Simulation
, Vol. 
20
No. 
2
, pp. 
131
-
146
, doi: .
Weimer
,
C.W.
,
Miller
,
J.O.
and
Hill
,
R.R.
(
2016
), “
Agent-based modeling: an introduction and primer
”,
2016 Winter Simulation Conference (WSC)
, pp. 
65
-
79
, doi: .
West
,
T.
and
Birkmire
,
B.
(
2020
), “
Afsim
”,
CSIAC
, Vol. 
7
No. 
3
, p.
50
.
Wilson
,
H.
(
2019
),
United states Air Force Science and Technology Strategy: Strengthening Usaf Science Nd Technology for 2030 and beyond, Technical Report
,
US Department of the Air Force
,
Washington, DC
.
Yang
,
H.-y.
,
Zhang
,
S.-w.
and
Li
,
X.-y.
(
2019
), “
Modeling of situation assessment in regional air defense combat
”,
Journal of Defense Modeling and Simulation
, Vol. 
16
No. 
2
, pp. 
91
-
101
, doi: .
Yevtodyeva
,
M.G.
(
2022
), “
Development of the Chinese a2/ad system in the context of us-China relations
”,
Herald of the Russian Academy of Sciences
, Vol. 
92
No. 
S6
, pp. 
S534
-
S542
, doi: .

Languages

or Create an Account

Close subscription notice
Close access options