As sustainability becomes increasingly important in organizational strategy, there is a growing need to explore how Green Information Technology (IT), and Information Systems (IS) adoption can drive various dimensions of performance. This paper clearly investigates the methodological and empirical link between Green IT/IS and organizational performance outcomes, emphasizing moderators such as national Green IT/IS context, firm size, and type of performance.
A comprehensive meta-analysis was conducted using 34 empirical studies comprising 11,333 observations. To capture contextual variations, subgroup analyses were performed across four dimensions: Green IT versus Green IS, performance types (environmental, financial, and other operational outcomes), national Green IT/IS implementation levels (measured by The Global Competitiveness Report, 2017–2018), and firm size (large firms versus SMEs).
The results confirm that Green IT/IS adoption significantly improves organizational performance, particularly by enhancing environmental outcomes. The effect is stronger in countries with lower levels of Green IT/IS implementation, emphasizing the importance of national policies and infrastructure. While firm size shows a weak overall moderating effect, its influence becomes more pronounced when distinguishing between Green IT and Green IS, highlighting the need for tailored strategies.
Methodologically, this study offers a new meta-analysis approach that merges results reported and then rigorously checks the findings using heterogeneity, subgroup, and robustness tests. A newly constructed National Green IT/IS Index, derived from global competitiveness report indicators, enables the first quantitative test of institutional context alongside firm-level moderators (size and performance type). Substantively, the analysis integrates 34 cross-country studies and three distinct performance dimensions (environmental, financial, and others), yielding the first pooled estimates that disentangle Green IT from Green IS impacts. The findings provide managers and policymakers with evidence-backed guidance on tailoring Green IT/IS initiatives to country readiness and organizational characteristics, thus maximizing both competitive advantage and sustainability outcomes.
1. Introduction
As global environmental challenges intensify, organizations are increasingly embedding sustainability into their strategic objectives (Anthony et al., 2018; Lei et al., 2023; Loeser et al., 2017). One prominent avenue for achieving such goals is the integration of IT and IS (Gholami et al., 2013; Molla et al., 2011). Green IT typically emphasizes the environmentally responsible design, use, and disposal of computing hardware and related infrastructure (Katal et al., 2023; Oró et al., 2015; Setia et al., 2024), whereas Green IS leverages information systems to enable eco-friendly practices in areas such as supply chain management, resource optimization, and smart energy utilization (Ijab et al., 2012; Karim et al., 2024; Watson et al., 2010). Researchers contend that Green IT/IS can substantially enhance organizational performance, including environmental, financial, and operational dimensions, by streamlining processes and reducing waste (Benitez-Amado and Walczuch, 2012; Cai et al., 2013). Yet, empirical findings remain mixed, leaving uncertainty about whether, how, and under what conditions Green IT/IS adoption translates into measurable performance benefits (Jenkin et al., 2011; Loeser et al., 2017).
A key source of this inconsistency stems from the lack of clarity regarding moderating variables, particularly national policy environments, organizational characteristics, and performance-type differences (Mouakket and Aboelmaged, 2022; Yang et al., 2017). For instance, national contexts with well-developed IT infrastructures and supportive governmental policies may more readily facilitate the adoption of Green IT/IS, leading to stronger performance gains (Molla and Abareshi, 2012; Ning and Khuntia, 2023). Meanwhile, firm size, whether a company is an SMEs or a large enterprise, could alter how it allocates resources to implement Green IT/IS (Ryoo and Koo, 2013; Wang et al., 2015). Without specifying such moderators, it is difficult to ascertain why some organizations achieve substantial returns on their Green IT/IS investments while others see minimal benefits.
Existing reviews often aggregate Green IT and Green IS under a single umbrella, providing limited insight into the distinct mechanisms by which each contributes to performance (Loeser, 2013; Nanath and Pillai, 2017). Moreover, they frequently focus on direct associations between Green IT/IS and performance, overlooking how key factors, such as innovation capacity, infrastructure quality, and cultural attitudes toward sustainability, can significantly amplify or constrain organizational outcomes (Chan, 2021; Lei et al., 2023). To bridge these gaps, researchers have called for systematic and quantitative approaches that incorporate multi-level moderators (Chuang and Huang, 2018; Oesterreich et al., 2022). Meta-analysis, in particular, is noted for its ability to synthesize effect sizes across varied contexts and identify patterns that traditional literature reviews might miss (Bokhari, 2005; Chauhan and Jaiswal, 2017; Schmidt and Hunter, 2016).
Foundational theories such as the Resource-Based View (RBV) (Barney, 1991), the Natural Resource-Based View (NRBV) (Hart, 1995), and Institutional Theory (Dimaggio and Powell, 1983; Scott, 2008) have long provided valuable lenses for understanding competitive advantage and organizational behaviour. However, previous research in the domain of Green IT/IS has often limited itself to merely citing these frameworks without fully exploiting their potential to explain differential outcomes. This study advances theoretical conversation by explicitly incorporating multi-level moderators that refine these foundational theories. For instance, by integrating a national-level Green IT/IS readiness index, which captures variations in technology readiness, infrastructural quality, and innovation capacity, the analysis extends RBV and NRBV into the sustainability arena, demonstrating how external environmental factors interact with internal resources to drive performance. In parallel, the examination of firm size as a moderator enriches institutional theory by showing how external regulatory pressures and internal organizational dynamics converge to shape the adoption and impact of green technologies.
In response, the present study conducts a comprehensive meta-analysis of 34 empirical studies, including 11,333 unique observations, on the relationship between Green IT/IS and organizational performance. Drawing upon RBV (Barney, 1991) and NRBV (Hart, 1995) theories, as well as institutional perspectives (Dimaggio and Powell, 1983; Scott, 2008), this study explores how both internal firm resources and external institutional pressures drive or moderate the performance outcomes of Green IT/IS adoption. Our analysis not only evaluates the aggregate impact of Green IT/IS on organizational performance but also systematically differentiates between Green IT and Green IS, thereby identifying whether one domain exerts a more pronounced influence than the other under specific contextual conditions (Baggia et al., 2019; Jenkin et al., 2011). Furthermore, this study disaggregates organizational performance into distinct dimensions, environmental, financial, and other key outcomes, thereby providing greater precision in assessing how different facets of performance are influenced by green initiatives (Haleem et al., 2024; Przychodzen et al., 2018).
Unlike prior reviews that either qualitatively mapped thematic developments (e.g. Singh and Sahu, 2020) or visualized intellectual clusters without quantitative integration (e.g. Mat Nawi et al., 2024), this study offers a novel methodological contribution by computing pooled correlation-based effect sizes alongside systematic subgroup analyses. While earlier efforts have largely refrained from aggregating empirical findings due to metric heterogeneity and limited effect size reporting (Asadi et al., 2017; Laranja Ribeiro et al., 2021), our approach leverages a meta-analytic framework that not only quantifies the overall Green IT/IS, performance relationship but also dissects this relationship across critical contextual moderators, such as national readiness, firm size, and type of performance outcome. This dual strategy of effect size aggregation and moderator testing enhances statistical power and mitigates the interpretive fragmentation that has long constrained the field. As such, it provides a more nuanced and empirically grounded understanding of when and where Green IT/IS initiatives translate into measurable organizational value. Thus, this study introduces several analytical innovations. First, we develop a new Green IT/IS index based on global competitiveness indicators to account for cross-national differences in three key moderators: technology readiness, infrastructure quality, and innovation capacity. These country-level factors are theorized to significantly influence how effectively organizations implement Green IT/IS solutions (Molla et al., 2011; Xie et al., 2023). Second, advanced subgroup analyses, beyond mere comparisons between high- and low-implementing nations, help determine how firm size and performance type moderate Green IT/IS’s effects (Chuang and Huang, 2015; Ryoo and Koo, 2013). Third, a rigorous random-effects model is adopted, suitable for handling data from diverse cultural and regulatory contexts (Hedges and Olkin, 2014; Lu and Taylor, 2016). By thoroughly incorporating these elements, by extending traditional correlation methods, this research identifies the specific conditions under which Green IT/IS delivers the greatest benefits.
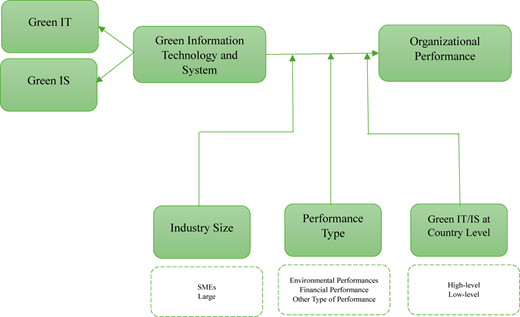
This approach not only contributes empirical clarity to a fragmented literature but also expands theoretical understanding of how green-focused technologies intertwine with institutional and organizational factors. In contrast to existing reviews that present Green IT/IS as a uniform construct, our meta-analysis positions Green IT and Green IS distinctly, thereby revealing context-specific benefits and challenges (Anthony, 2019; Loeser et al., 2017). Practitioners, including managers and policymakers, can employ these findings to refine strategic planning, identify high-impact areas for green interventions, and better align corporate sustainability goals with national policy trends. Scholars gain a replicable meta-analytic framework that clarifies the multiple contingencies shaping Green IT/IS outcomes, thus opening further avenues for cross-country, cross-sector research on eco-innovation. Figure 1 outlines the proposed conceptual framework.
The present study proceeds as follows. First, the theoretical framework integrates complementary perspectives to develop hypotheses concerning the moderating effects of country-level Green IT/IS development, firm size, and performance dimensions. Subsequent sections detail the methodological approach, including data collection protocols, coding procedures, and analytical techniques. Meta-analytic results demonstrate both overarching patterns and significant contextual variations in Green IT/IS effectiveness. The discussion addresses theoretical contributions, practical implications, study limitations, and future research directions.
2. Literature review and hypotheses development
2.1 Theoretical background
Scholars have relied on several complementary theoretical frameworks to explain how Green IT/IS translate into competitive advantage and performance outcomes. The resource-based view (RBV) (Barney, 1991) conceptualizes Green IT/IS as valuable, rare and inimitable resources that enhance process efficiency, optimize resource use and align digital infrastructures with firm strategy, thereby strengthening stakeholder relations (Baggia et al., 2019; Bekele et al., 2024). The natural-resource-based view (NRBV) (Hart, 1995) extends this logic by emphasizing the strategic importance of environmental capabilities. Proactive environmental practices such as Green IT/IS promote eco-efficiency, regulatory compliance and reputational gains, consistent with empirical evidence linking Green IS to superior environmental performance (Chuang and Huang, 2018; Wang et al., 2015). Finally, institutional theory (Scott, 2008) highlights the regulative, normative and cultural-cognitive pressures that shape organizational responses to sustainability expectations. National contexts with mature Green IT/IS infrastructures exert stronger normative pressures, encouraging adoption and amplifying performance pay-offs.
2.2 Green IT/IS and organizational performance
Green IT/IS have emerged as pivotal mechanisms for aligning technological advancement with sustainability goals (Lei et al., 2023). Empirical studies link Green IT/IS to be enhanced operational performance through greater energy efficiency and cost reduction (Dao et al., 2011; Wang et al., 2015), improved financial performance and market competitiveness (Przychodzen et al., 2018; Singh and Sharma, 2023) and superior environmental outcomes such as lower carbon emissions and optimized resource management (Gholami et al., 2013; Yang et al., 2017). Some contributions also report positive social and reputational effects (Mouakket and Aboelmaged, 2022; Yang et al., 2017), while noting that high up-front investment and training costs can moderate short-term returns (Jenkin et al., 2011). Performance gains are frequently mediated by innovation-related dynamic capabilities (Erkmen et al., 2020; Nanath and Pillai, 2017) and vary across industries and firm sizes (Benitez-Amado and Walczuch, 2012; Chuang and Huang, 2015, 2018). Overall, the evidence suggests that organizations prioritizing green technologies realize superior decision-making, resource optimization and long-term sustainable growth.
2.3 National-level green IT/IS context
Country-level policies, infrastructures and cultural attitudes form an institutional framework that conditions the effectiveness of firm-level Green IT/IS initiatives. Governments accelerate adoption through regulatory mandates, incentives and green-technology investment (Jongsaguan and Ghoneim, 2017; Sayed Sikder et al., 2023). Empirical work from China, Australia, New Zealand, and the United States, for example, shows that stringent regulation and supportive infrastructure encourage firms to integrate green practices as part of compliance and competitive positioning (Chan, 2021; Molla et al., 2011). Societal norms also matter: where environmental stewardship is culturally entrenched, as in South Korea or Taiwan, firms face stronger legitimacy pressures to deploy sustainable technologies (Chuang and Huang, 2015, 2018; Ryoo and Koo, 2013). Macro-level enablers such as technological readiness, innovation capacity and advanced infrastructure further amplify performance benefits (Erkmen et al., 2020; Kraft and Bausch, 2018; Schwab, 2017). Conversely, limited resources and weaker enforcement in some developing economies can dampen or delay adoption gains (Mihardjo et al., 2019; Ojo and Fauzi, 2020). Collectively, these findings indicate that national context critically shapes the strength and direction of Green IT/IS performance effects.
2.4 Performance type
Organizational performance spans environmental, financial, operational and social dimensions, each of which may respond differently to Green IT/IS. Environmental performance improvements, lower emissions, resource conservation and regulatory compliance, tend to materialize quickly (Anthony, 2019; Liu et al., 2018; Meacham et al., 2013). Financial returns, including profitability and revenue growth, often emerge over longer horizons as energy efficiencies translate into cost savings and competitive advantage (Cai et al., 2013; Singh and Sharma, 2023). Operational performance benefits (process optimization, productivity) are widely documented (Wang et al., 2015), while social performance gains—strengthened stakeholder trust and corporate reputation—arise from transparent, ethical practice (Aggarwal et al., 2025; Chuang and Huang, 2018; Magboul et al., 2024; Mouakket and Aboelmaged, 2022). Appreciating these differential effects is vital to understanding when and where Green IT/IS deliver maximum value.
2.5 Company size
Firm size influences both the adoption and performance outcomes of Green IT/IS. Large organizations possess substantial financial and technical resources, face higher public scrutiny and often implement comprehensive green initiatives that yield strategic, long-term benefits (Benitez-Amado and Walczuch, 2012; Karim et al., 2024; Przychodzen et al., 2018). Smaller firms benefit from organizational agility but may lack capital and specialized expertise, limiting the scale and timing of performance gains (Chuang and Huang, 2015, 2018; Gholami et al., 2013). Accordingly, resource availability, stakeholder pressure and agility interact differently across firm sizes, suggesting size-contingent heterogeneity in Green IT/IS effectiveness (Nanath and Pillai, 2017; Singh and Sharma, 2023).
2.6 Research gaps and contribution
Based on Table 1 several influential reviews have sought to synthesize the expanding literature on Green IT and Green IS. The narrative classification provides an initial thematic mapping of the field, yet it is acknowledged that organizational performance is evaluated by only a limited number of studies, with comparable effect sizes being reported by virtually none. They explicitly advocate for large-sample, quantitative studies capable of disentangling contextual factors such as national readiness and firm size (Singh and Sahu, 2020). Studies published between 2007 and 2016 were systematically reviewed, leading to a taxonomy organized around four themes: benefits, adoption, readiness, and strategy. Their analysis corroborates the predominance of evidence regarding performance, underpinned by inconsistent metrics that obstruct meaningful cross-study comparisons. They highlight two persistent gaps in the literature: the widespread omission of moderator analyses, and the absence of quantitative synthesis across fragmented studies (Asadi et al., 2017).
More recently, bibliometric mapping techniques have been applied to visualize the intellectual structure of the field rather than to consolidate empirical findings. For instance, articles from the Web of Science were analysed to identify emerging research clusters related to adoption behaviour and green IT/IS. However, performance was only addressed superficially, with no in-depth examination of findings or synthesis of effect sizes. Additionally, the exclusive use of a single database may have skewed the representation toward developed economies (Mat Nawi et al., 2024). Laranja Ribeiro et al. (2021) take a more focused approach, narrowing their Scopus search to ABS-listed journals and drawing attention to a developing interest in post-adoption impacts. Nonetheless, they similarly conclude that robust quantitative evidence estimating the magnitude of performance gains remains scarce. Collectively, these four reviews provide critical insights into the structure and evolution of Green IT and Green IS research. However, they also leave four key empirical blind spots unaddressed that this meta-analysis directly addresses:
No pooled estimate of the Green IT/IS (separately and combining) → performance relationship.
No systematic test of critical moderators (national Green IT/IS context, economic development status, firm size, performance type).
Severe heterogeneity in outcome metrics, impeding comparability.
Under-representation of firms in developing and emerging economies.
Thus, based on the rich descriptive and case-based evidence summarized above, three salient gaps persist in the Green IT/IS terrain. First, prior studies rarely integrate multiple performance dimensions in a single empirical framework, limiting understanding of how environmental, operational and financial outcomes inter-relate (Cai et al., 2013; Liu et al., 2018). Second, the contextual role of national-level readiness has been theorized but seldom quantified, leaving the institutional boundary conditions of Green IT/IS effectiveness largely speculative (Scott, 2008). Third, existing reviews provide narrative or bibliometric syntheses rather than meta-analytic effect estimates, preventing cumulative insights into magnitude and heterogeneity (Mat Nawi et al., 2024; Singh and Sahu, 2020). By applying meta-analysis to 34 quantitative studies and constructing a novel national Green IT/IS index from the global competitiveness report (Schwab, 2017), the present study addresses these gaps, offering statistically grounded estimates of overall and context-specific effects.
2.7 Hypotheses development
Building on the foregoing theoretical arguments and empirical evidence, four sets of testable hypotheses are advanced.
2.7.1 Direct effect of green IT/IS on organizational performance
Grounded in the RBV (Barney, 1991) and its environmental extension, the NRBV (Hart, 1995), Green IT/IS constitute strategic assets that are valuable, rare and hard to imitate. Empirical work demonstrates that energy-efficient servers, virtualisation and eco-design analytics lower operating costs and improve product stewardship (Dao et al., 2011; Wang et al., 2015). Dynamic capability scholars further observe that firms leveraging Green IT/IS cultivate sensing–seizing–reconfiguring routines that translate eco-efficiency into sustained competitive advantage (Erkmen et al., 2020). Accordingly, a positive main effect on organizational performance is expected. Green technologies enhance efficiency, innovate value chains and strengthen stakeholder relations; hence a positive performance impact is expected.
Green IT/IS is positively related to Organizational Performance.
Green IT is positively related to Organizational Performance.
Green IS is positively related to Organizational Performance.
2.7.2 Moderating role of national green IT/IS context
Institutional theory posits that organizational practices are shaped by regulative, normative and cognitive forces (Scott, 2008). Countries with stringent environmental regulation, strong innovation systems and supportive digital infrastructure create enabling environments that magnify the performance pay-offs of Green IT/IS (Chan, 2021; Molla, 2013). Conversely, in weak institutional settings adoption may be symbolic, yielding limited efficiency gains (Ojo and Fauzi, 2020). Meta-analytic findings in related domains such as corporate environmental performance echo such contextual amplification effects (Kraft and Bausch, 2018). Thus, national readiness is theorized to strengthen the Green IT/IS–performance linkage. Because institutional support and green readiness vary across countries, the strength of the Green IT/IS–performance linkage is likely to depend on national context.
Green IT/IS at the country’s level moderates the relationship between Green IT/IS and Organizational Performance.
Green IT/IS at the country’s level moderates the relationship between Green IT and Organizational Performance.
Green IT/IS at the country’s level moderates the relationship between Green IS and Organizational Performance.
2.7.3 Moderating role of performance type
Contingency and stakeholder theories suggest that technological investments generate heterogeneous returns across different outcome categories (Donaldson, 2001). Environmental metrics, such as carbon intensity, react immediately to energy savings, whereas financial outcomes materialize after learning curves and market signalling effects unfold (Gholami et al., 2013; Przychodzen et al., 2018). Operational indicators (e.g. cycle time, error rates) often show intermediate-term responses, while social reputation benefits rely on stakeholder perception (Mouakket and Aboelmaged, 2022). These temporal and stakeholder-specific dynamics suggest that performance type will moderate Green IT/IS effectiveness. Given the multidimensional nature of performance, the Green IT/IS effect may vary across environmental, financial, operational and social outcomes.
Performance type moderates the relationship between Green IT/IS and Organizational Performance.
Performance type moderates the relationship between Green IT and Organizational Performance.
Performance type moderates the relationship between Green IS and Organizational Performance.
2.7.4 Moderating role of company size
Large firms possess slack resources and formalized structures that facilitate the absorption of complex green technologies, but may suffer from inertia; SMEs, conversely, are agile yet resource-constrained (Benitez-Amado and Walczuch, 2012; Chuang and Huang, 2015). Stakeholder pressure is also size-contingent, with listed corporations facing greater scrutiny (Karim et al., 2024). Prior mixed-method evidence shows stronger cost-saving and reputational impacts in large firms, while innovation flexibility can allow some SMEs to outperform peers (Nanath and Pillai, 2017). Hence, firm size is expected to condition the performance benefits of Green IT/IS investments. Resource availability and stakeholder pressures differ between large firms and SMEs, implying size-contingent variation in Green IT/IS performance pay-offs.
Company’s size moderates the relationship between Green IT/IS and Organizational Performance.
Company’s size moderates the relationship between Green IT and Organizational Performance.
Company’s size moderates the relationship between Green IS and Organizational Performance.
3. Methodology
3.1 Sampling
The main aim of this research is the relationship between green IT/IS and organizational performance. To locate as many relevant articles as possible from the existing literature, authors searched for main keywords on different databases like Science Direct, Web of Science, Wiley, ProQuest, ABI/Inform, and Google Scholar comprehensively. Since this paper to identify any possible papers to include, search keywords as following: (“Green Information Technology”, “GIT”, “Green IT”, “Sustainable IT”, “Environmental Information Technology “Green Information System”, “GIS”, “Green IS, “Sustainable IS, “Environmental Information System) × (“Firm Performance”, “Financial Performance”, “Economic Performance”, “Environmental Performance”, “Sustainable Performance”, “Sustainability”, “Social Performance”, “Competitive Advantage”).
Based on the work of Schmidt and Hunter (2016), this study adopted the following step to conduct the meta-analysis. First, because of the major question of this research as there is a link between green information technology and system and organizational performance, all papers must consider this relationship as one of the hypotheses or report the statistical results of this relationship. Secondly, all papers should be available in full-text format. Thirdly, the research exploring the link between green information technology and system and organizational performance should include a measure of correlation, represented by “r” or similar statistics. Alternatives to the correlation coefficient may include the t-value (t), or beta coefficient (β). Reporting these statistics is essential for performing meta-analytical evaluations. To convert t-value or beta coefficient (β) to r correlation following formulate has been used (Schmidt and Hunter, 2016):
t-value to r:
β value to r: or r:
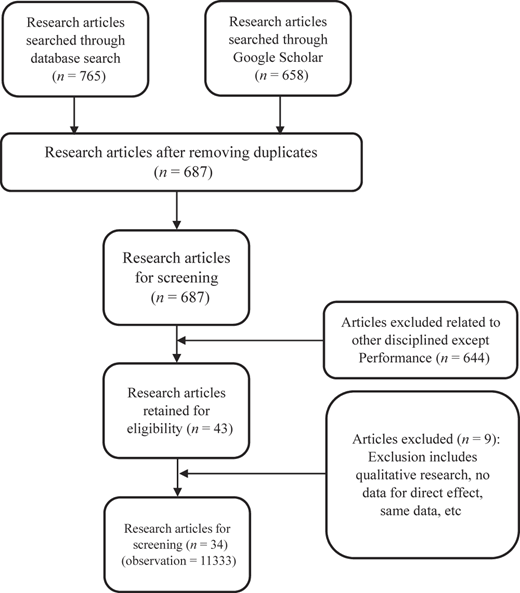
Following the search procedures and inclusion criteria listed above, we considered 687 publications. In the next step, the authors analyzed the title and abstract of these papers to find if the publications included green IT/IS and performance. This concluded with 43 papers. Additionally, we read the chosen articles to figure out that the papers specifically considered the relationship between these two variables and provided statistical quantitative results. Finally, we identified 34 papers equals 11,333 observations which are eligible, and they included the following journals as a publisher: European Journal of Information Systems, International Journal of Production Economics, Business Strategy and the Environment, Journal of Business Ethics, Information and Management, Information Systems Journal, and Journal of Cleaner Production etc. Figure 2 provides a PRISMA flow diagram, and an overview of the systematic literature review. Also, Table 2 details the final sample involved in this study, which covers 13 years (2012–2024).
The final selection of 34 studies aligns methodologically with accepted practices in emerging research areas, where exhaustive searches frequently yield limited quantitative studies suitable for meta-analysis. Methodologists further clarify that even a relatively small number of studies can be methodologically adequate to calculate an aggregate effect size and provide meaningful conclusions, particularly in emerging fields where comprehensive searches may yield limited empirical evidence (Valentine et al., 2010). Such sample sizes have been deemed sufficient and methodologically sound in recent meta-analytic research (Alfi et al., 2024; George et al., 2019; Gric et al., 2023). Thus, this meta-analysis effectively consolidates existing evidence, providing robust insights and clear guidance for future research within the evolving field of Green IT/IS and organizational performance.
3.2 Variables and coding process
The correlation coefficient and sample size must be collected to conduct the meta-analysis research. Some articles provide information like t-value and p-value, etc. that can be derived these values from the standardized mean difference effect sizes and the correlation coefficients from these statistical data. Furthermore, this paper has one independent variable, one dependent variable, four moderator variables and two controller variables.
Independent variable: Green IT typically refers to the effective application of information and communication technologies to enhance an organization’s environmental sustainability across its operations, products, services, and resource management (Chen et al., 2011) More broadly, it encompasses the design and implementation of information technologies that support sustainable business practices (Chen et al., 2011; Przychodzen et al., 2018). Green IS involves creating and utilizing information systems, including tools like groupware, teleconferencing, environmental auditing systems, and automation technologies, to facilitate and encourage eco-friendly practices and sustainable development (Watson et al., 2008).
Dependent variable: Organizational Performance refers to organizational achievements based on its goals and objectives that could involve different aspects of performance like financial, environmental, and operational performance (Asiaei et al., 2021). This concept of organizational performance has been used in central of most studies (Hizarci-Payne et al., 2021; Lu and Taylor, 2016).
Moderator Variables: Based on the hypothesis developed in the previous section, this study adopted various moderator variables that may have an impact on the relationship between green IT/IS and organizational performance. Green IT/IS at country level was measured as moderator variables by using information from the World Economic Forum (Schwab, 2017) which has been widely used in previous studies (Kraft and Bausch, 2018; Xie et al., 2023). Three factors from this report have been considered to measure the green IT/IS index indirectly: (1) Technological readiness: “the agility with which an economy adopts existing technologies to enhance the productivity of its industries, with specific emphasis on its capacity to fully leverage information and communication technologies (ICTs) in daily activities and production processes for increased efficiency and enabling innovation for competitiveness.” (2) Infrastructure: “a solid and extensive telecommunications network allows for a rapid and free flow of information, which increases overall economic efficiency by helping to ensure that businesses can communicate and decisions are made by economic actors taking into account all available relevant information.” (3) Innovation Capacity: “means sufficient investment in research and development (R&D), especially by the private sector; the presence of high-quality scientific research institutions that can generate the basic knowledge needed to build new technologies; extensive collaboration in research and technological developments between universities and industry; and the protection of intellectual property.”. For countries are participating in this study, scores related to these dimensions are extracted and based on following formulation green IT/IS Index was calculated. The median value of the calculated Green IT/IS Index across all countries is computed and those countries’ index are above median classified as High level and Low level are less than median. Table 1 provides detailed information.
Performance Type is another moderate factor that is used in this research. We split samples into three dummy subgroups and coded as financial performance, environmental performance and other forms of performance. Furthermore, Industry Size also was used as moderator in this study which classified two main categories: Large and Small and Medium-sized Enterprise (SMEs).
3.3 Control variables
Two control variables have been used to avoid exogenous influences on firms’ performance. First, we adopted publication year as dummy variable to control any time effects (Kraft and Bausch, 2018; Xie et al., 2023). We split studies into two groups published before and after 2020. Second, the quality of journals is considered as controller where top-ranked journals may because of in-depth review process underestimate some papers that could have effect. The present study follows quartiles (Q1-Q4) to categorize the studies that journals with Q1 rank add in high-quality and others in low-quality (Barroso-Méndez et al., 2024; Velte, 2022).
3.4 Meta-analytic procedures
This study used the Comprehensive Meta-Analysis software package (CMA) based on the method introduced by (Borenstein et al., 2021; Hedges and Olkin, 2014) which has been used in many studies previously (Barani et al., 2025; Lu and Taylor, 2016; Oesterreich et al., 2022; Singhania and Chadha, 2023; Xie et al., 2023). Bivariate meta-analytic procedures were adopted to examine the relationship between green IT/IS and performance. Firstly, the effect size (r) was transferred into Fisher’s z coefficients, while weighing the effect sizes by their variances helped to correct the sampling error (Hedges and Olkin, 2014). The aggregation of corrected individual effect sizes into an overall effect size has been done in the next stage. Like other studies in meta-analysis (George et al., 2019; Lu and Taylor, 2016; Xie et al., 2023), this study used the random effects model instead of the fixed effects model. The random effects model provides more reliable insight since it assumes within-study and between-study variance, it means that this method avoiding the bias of underestimating small sample weights or overestimating large sample weights. Next, two common methods, the Q-value test and the I2-value test, was adopted to measure the heterogeneity (Higgins and Thompson, 2002). The moderate effect is existence where the value for Q and I2 are greater than 75%. which means that there is a heterogeneity of effect sizes. The result of the Q-value and I2-value are presented at Table 2 which indicates that there is a heterogeneity between green IT/IS and performance (Q = 7,929, p < 0.01; and I2 = 94.841). This means that a large part of the variance was caused by factors other than sampling error (Sarooghi et al., 2015). These findings also confirm that random effect size is more suitable for this study (Higgins and Thompson, 2002).
On the next step, variables moderate effect size was measured based on subgroup analyses. Subgroup analyses test whether the effect sizes varied significantly between the subgroups. This study considers the homogeneity statistic (Qb) between groups, where the significance of the Qb means the variable is a moderator (Chauhan and Gupta, 2024; Hedges and Olkin, 2014).
3.5 Publication bias
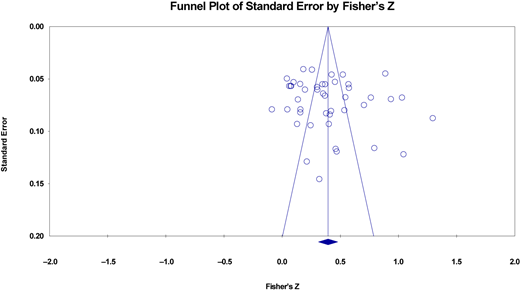
Based on Schmidt and Hunter (2016) two methods can be used to be sure about the reliability of results in terms of publication bias: funnel plot and file drawer analysis. Firstly, the file drawer was performed to check if the significant results from the studies were possibly overestimated (Lu and Taylor, 2016). Table 3 indicates that the numbers of all fail-safe is larger than adopted numbers used to calculate the mean effect size, it means there is no serious concern about the file drawer problem (Xie et al., 2023). The funnel plot was used as second method for publication bias. This method indicates that the dispersion of small sample can be larger that large sample where you can find small samples at bottom of the plots and large samples at top (Schmidt and Hunter, 2016). In this study most sample are at the top of the plot while distributed on both sides of the midline (Figure 3) which means there is no publication bias (Xie et al., 2023). Furthermore, this study also considers both Egger’s regression test and Duval and Tweedie’s trim-and-fill method regarding publication bias. Egger’s test revealed a non-significant intercept (B = 2.36, SE = 2.33, t = 1.01, p = 0.316, 2-tailed), with a 95% confidence interval ranging from −2.33 to 7.05. This result suggests no substantial evidence of funnel plot asymmetry (Egger et al., 1997). Complementarily, the trim-and-fill analysis did not estimate any missing studies, and the observed and adjusted effect sizes were identical under both fixed-effects (observed = adjusted = 0.353) and random-effects models (observed = adjusted = 0.375). These findings provide consistent support for the absence of significant publication bias in the data set (Duval and Tweedie, 2000). Together, the four diagnostic approaches reinforce the robustness and reliability of the meta-analytic results.
4. Data analysis
4.1 Meta-analysis (main effect)
This study provides a report in three panels: the overall effect of green IT/IS (Panel 1), green IT (Panel 2), and green IS (Panel 3). This can help to make a clear and effective way to structure meta-analysis, especially given that Green IT and Green IS are distinct yet related concepts. Green IT focuses on making IT itself environmentally sustainable, while Green IS uses IT and systems to promote overall sustainability. They complement each other in achieving environmental goals.
The result of the overall relationship between green IT/IS and performance is presented as Table 4 based on the bivariate meta-analysis. In Panel 1, the analysis aggregated 46 studies (N = 11,333), revealing a robust positive effect of Green IT/IS on performance (r = 0.375, z = 9.357, p < 0.01). These findings establish a strong foundational relationship, underscoring the importance of Green IT/IS in enhancing performance outcomes. Panel 2 and Panel 3 further described the impact by distinguishing Green IT and Green IS as independent constructs. For Green IT (Panel 2), 22 studies (N = 5,770) demonstrated a significant effect (r = 0.391, z = 7.376, p < 0.01), highlighting its specific contribution to performance. Similarly, Green IS (Panel 3), represented by 23 studies (N = 4,976), also exhibited a significant almost slight lower, effect size (r = 0.366, z = 5.567, p < 0.01). These findings suggest that while both Green IT and Green IS positively influencing performance, Green IT appears to have a marginally stronger impact.
The consistently significant effect sizes across all panels reinforce the robustness of the relationship between Green IT/IS and performance. Notably, the narrower confidence intervals in Panel 1 highlight the stability of the aggregated analysis, while the separate panels reveal nuanced insights into the unique contributions of Green IT and Green IS.
4.2 Subgroup analysis
The moderating effect of the green IT/IS level, performance type, and company size on the relationship between green IT/IS and performance was examined through a meta-analysis. Table 5 presents the results, including the number of effect sizes (k), the total sample size (N), the mean correlation coefficient (r), the 95% confidence intervals (lower and upper bounds), p-values, t-values, and the Qb statistic representing between-group heterogeneity.
4.2.1 Green IT/IS at the country’s level
The analysis revealed that the relationship between Green IT/IS and performance was significantly stronger for countries with low levels of Green IT/IS (r = 0.4603) compared to those with high levels of Green IT/IS (r = 0.2966) in Panel 1. This pattern suggests that in the context where Green IT/IS is underdeveloped, the marginal benefits of adopting Green IT/IS practices may be more pronounced, likely due to the novelty of such initiatives in these environments.
Furthermore, based on Panel 2 and 3, the results of green IT align with the overall analysis, with low Green IT/IS contexts exhibiting stronger effects. Similarly, in Panel 3, which focuses on Green IS, a comparable moderating effect was observed. However, it is worth noting that the differences between high and low Green IS levels, while significant, were slightly less pronounced than in the Green IT context. The Qb statistics, which measure between-group differences, were significant across panels, further validating the moderating influence of country-level Green IT/IS. The largest Qb value was observed in Panel 1 (15.63), underscoring that the overall Green IT/IS context plays a critical role in shaping performance outcomes. The Qb values in Panel 2 (7.98) and Panel 3 (2.38) were smaller but still meaningful, highlighting nuanced distinctions between Green IT and Green IS.
4.2.2 Performance type
For the overall effect, environmental performance exhibited the highest effect size (r = 0.4273) compared to financial performance (r = 0.3442) and other types (r = 0.3130). This result indicates the significant contribution of Green IT/IS to environmental outcomes, reflecting the primary sustainability goals of these technologies. Financial performance also demonstrated a moderate positive effect, indicating that Green IT/IS initiatives yield measurable economic benefits, though to a lesser extent than environmental outcomes. While focussing on Green IT, the pattern was consistent, with environmental performance showing the strongest impact (r = 0.5283). This indicates that Green IT technologies contribute significantly to environmental benefits, likely due to their direct role in energy efficiency and resource optimization. Financial performance, while still positive (r = 0.3301), was comparatively lower, suggesting that the economic advantages of Green IT are more indirect or require longer time horizons to materialize.
Considering Green IS shows that environmental performance also displayed the highest effect (r = 0.3834), but its effect size was slightly weaker than in Green IT. This may reflect the organizational and process-oriented nature of Green IS, which may have less direct environmental impact than the technical interventions of Green IT. Financial performance in this panel was nonsignificant, highlighting that the economic return of Green IS are less pronounced or harder to quantify compared to its environmental impacts.
4.2.3 Industry size
The analysis of industry size indicates that the overall effect size of Green IT/IS on performance for both large firms and SMEs are significantly positive, but the effect size for SMEs (r = 0.3637) was slightly smaller than for large firms (r = 0.3726). This suggests that while Green IT/IS benefits performance across industries of different sizes, large firms may derive marginally higher performance gains, potentially due to better resources and infrastructure implementing these technologies effectively. For Panel 2, focussing on Green IT, the findings highlight a more pronounced difference. SMEs demonstrated a notably stronger relationship (r = 0.5444) compared to large firms (r = 0.3625). This indicates that SMEs may benefit more from adopting Green IT practices, possibly due to their agility and ability to achieve significant efficiencies from targeted technological interventions. The between-group difference for this panel (Qb = 17.41) was highly significant, further emphasizing the stronger impact of Green IT in SMEs contexts. Moreover, in Panel 3, which focuses on Green IS, large firms exhibited a stronger effect (r = 0.3986) compared to SMEs (r = 0.2864). This result suggests that Green IS, which often involves process improvements and decision-making systems, aligns better with the structured organizational processes of larger firms. SMEs, in contrast, may face challenges in leveraging Green IS to its full potential due to resource or capability constraints.
4.2.4 Control variables
The subgroup analysis detailed in Table 6 reveals that the publication year within the sample period does not affect the relationship between green IT/IS and performance. The findings indicate that the impact of green IT/IS on performance is a bit greater in the years after 2020 compared to the years prior to 2020. Also, our analysis shows that the relationship between green IT/IS and performance in high-quality and low-quality are same significant and meaningful, while the effect is stronger in low-quality.
4.3 Supplementary analysis
To further understand the relationship between Green IT/IS and performance, a supplementary analysis was conducted to examine the moderating effects of national development level (developing vs. developed countries). The results revealed that Green IT/IS significantly influences performance across both developing and developed countries, with a more pronounced overall effect in developing nations. In developing countries, the correlation coefficient is r = 0.3966 (t-value = 8.4671), indicating a strong relationship between Green IT/IS adoption and performance outcomes. In contrast, developed countries exhibit a slightly weaker overall effect, with r = 0.3072 (t-value = 4.3376). This difference suggests that Green IT/IS may offer greater transformative potential in developing economies, where technological and sustainability advancements can address foundational gaps more effectively.
In developed countries, Green IT/IS impacts vary across country levels, performance types, and industry sizes. Low-level Green IT/IS maturity yields a correlation of r = 0.3990 (t-value = 5.2255), while high-level maturity shows a slightly smaller effect at r = 0.2984 (t-value = 3.8908). Environmental performance stands out as the strongest outcome (r = 0.4840, t-value = 7.4964), followed by other types (r = 0.2931, t-value = 4.0208) the effect for financial performance (r = 0. 0400, t-value = 0.5644) is insignificant, reflecting a priority on sustainability driven by advanced regulatory frameworks. Notably, SMEs outperform large firms, with a stronger effect (r = 0.4098, t-value = 6.5447) compared to large firms (r = 0.2680, t-value = 3.0531), likely due to their agility and innovation focus.
In developing countries, Green IT/IS delivers substantial benefits, particularly at lower maturity levels, where the effect is r = 0.4636 (t-value = 6.3346), compared to r = 0.2964 (t-value = 6.0265) at high maturity. Financial performance shows the largest impact (r = 0.4558, t-value = 4.8503), followed by environmental performance (r = 0.4133, t-value = 5.4017) and other types (r = 0.3216, t-value = 5.1801), highlighting the dual economic and ecological benefits in these regions. Large firms benefit more significantly (r = 0.4394, t-value = 6.8296) than SMEs (r = 0.3575, t-value = 4.7475), suggesting that resource availability enhances the ability to leverage Green IT/IS effectively in developing contexts.
Comparing the two regions shows that Green IT/IS generally has a bigger impact in developing economies across most aspects. The overall effect is stronger in developing countries (r = 0.3966 vs. r = 0.3072 in developed), as is the effect of low-level Green IT/IS maturity (r = 0.4636 vs. r = 0.3990). Developing countries also show greater financial performance gains (r = 0.4558 vs. r = 0.0400), while developed countries lead in environmental performance (r = 0.4840 vs. r = 0.4133). Industry size effects further diverge, with large firms in developing countries (r = 0.4394) outperforming their SME counterparts (r = 0.3575), whereas in developed countries, SMEs (r = 0.4098) surpass large firms (r = 0.2680). These findings underscore that Green IT/IS has a more transformative impact in developing economies, particularly for financial outcomes and large firms, while developed economies leverage it more for environmental gains, with SMEs driving innovation.
4.4 Robustness check
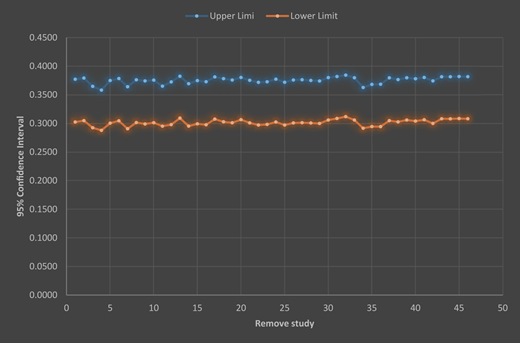
Two robust checks have been adopted to test the robustness of findings. In the first step, “Leave-one-out” procedure used for sensitivity analysis (Rudolph et al., 2020). This method has been recommended for no change in the results of the study when a single case in the estimate of the mean effect size is deleted (Viechtbauer and Cheung, 2010). Figure 4 indicates the results of Leave-one-out in this study. There is no significant change in the results in the absence of a single test on the 95% confidence interval for the mean effect size. Thus, there is a proven robust in the relationship between green IT/IS and performance.
In the second step, this paper addressed concerns about outliers, defining them as effect sizes exceeding two standard deviations above or below the mean effect size (Xie et al., 2023). Eight studies which have substantial r size −0.086, 0.043, 0.047, 0.711, 0.734, 0.775, 0.779 and 0.861 were deleted from the model. Findings from Tables 7 and 8 provide evidence that in the absence of these papers, there is no considerable difference in results. As a result, strong support has been provided for the hypothesis of this study.
5. Discussion and implications
5.1 Findings
The meta-analysis of 34 studies, encompassing 11,333 observations, reveals a robust and statistically significant relationship between Green IT/IS adoption and enhanced organizational performance. This positive association spans financial, operational, and environmental dimensions, confirming that sustainability-oriented technologies yield measurable improvements in key performance indicators. Consistent with previous research (Anthony et al., 2018; Loeser et al., 2017), the analysis demonstrates that organizations implementing Green IT/IS achieve operational efficiencies, cost reductions, and enhanced stakeholder trust, while also meeting regulatory requirements (Cai et al., 2013; Chan, 2021; Jenkin et al., 2011).
Importantly, the study extends foundational theories by examining the moderating effects of context. The findings reinforce the RBV by demonstrating that Green IT/IS function as strategic resources that enhance competitive advantage; however, they also reveal that the value of these resources is contingent upon internal capabilities and external factors such as firm size (Ainin et al., 2016; Erkmen et al., 2020; Lei et al., 2023). Similarly, the significant improvements in environmental performance observed in the analysis support the NRBV, underscoring that investments in green technologies are integral to achieving eco-efficiency and long-term sustainability (Anthony, 2019; Chuang and Huang, 2015, 2018). In addition, the study adapts institutional theory by showing that national-level variables, such as regulatory frameworks, technological readiness, and cultural attitudes toward sustainability, significantly moderate the relationship between Green IT/IS and performance (Chan, 2021; Gholami et al., 2013). For example, firms operating in countries with robust green policies and advanced infrastructure tend to achieve more pronounced performance gains, suggesting that institutional pressures and supportive environments can amplify the benefits of green initiatives (Loeser, 2013).
These theoretical extensions underscore the importance of a multi-level approach: while Green IT/IS contributes to performance improvements across all dimensions, the degree and nature of these benefits are context specific. The analysis shows that SMEs may experience quicker, more targeted gains from focused Green IT interventions (Baggia et al., 2019; Renaldo and Augustine, 2022; Wungkana et al., 2023), whereas larger organizations are better positioned to leverage comprehensive Green IS strategies for long-term strategic benefits (Mouakket and Aboelmaged, 2022; Ryoo and Koo, 2013). Thus, the findings not only confirm the positive impact of green factors on organizational performance but also offer insights into how the interplay of internal and external factors refine established theoretical frameworks. This integrated perspective provides actionable implications for managers and policymakers aiming to optimize sustainability investments in diverse organizational and national contexts.
5.1.1 Green IT vs. green IS
Green IT, encompassing energy-efficient computing hardware and software, and Green IS, which integrates sustainability into organizational processes through information systems, both significantly enhance performance, though in distinct yet complementary ways. Green IT delivers immediate, tangible benefits, such as reduced energy consumption and operating costs through solutions like server virtualization and low-energy hardware (Cai et al., 2013; Wang et al., 2015). In contrast, Green IS, exemplified by tools like sustainability-optimized enterprise resource planning (ERP) systems, supports strategic decision-making and resource optimization across the value chain, yielding broader ecological and financial advantages over the long term (Loeser et al., 2017; Ning and Khuntia, 2023). This distinction, Green IT focussing on technology-driven efficiency and waste reduction, and Green IS enabling environmental monitoring and strategic planning, underscores their dual role in driving operational efficiency and competitive advantage, particularly in industries under high environmental scrutiny (Dao et al., 2011; Gholami et al., 2013). While effect sizes vary slightly based on firm size, performance type, and national Green IT/IS maturity, their positive impact aligns with prior empirical findings, with Green IT offering quicker cost savings and Green IS providing deeper, systemic benefits (Anthony, 2019; Haider, 2022; Haleem et al., 2024; Magboul et al., 2024; Meacham et al., 2013; Nanath and Pillai, 2017).
5.1.2 National context and policy support
The effectiveness of Green IT/IS in enhancing organizational performance is significantly influenced by national-level factors, with the extent of Green IT/IS adoption playing a critical role in shaping outcomes. Research indicates that countries with lower levels of Green IT/IS adoption experience a stronger positive correlation between these practices and performance outcomes compared to those with higher adoption levels (Ainin et al., 2016; Arulrajah et al., 2020). This suggests that the benefits of Green IT/IS may be more substantial in contexts where such practices are less developed, likely due to the greater potential for transformative impact in less mature settings (Baggia et al., 2019). These findings align with institutional theory, which emphasizes the role of regulatory frameworks, infrastructure, and societal norms in shaping the success of sustainability initiatives (Dimaggio and Powell, 1983; Scott, 2008). For example, Ainin et al. (2016) demonstrate how institutional pressures, including regulatory and societal expectations, drive the adoption of Green IT, leading to improved environmental performance across varying national contexts.
In developing countries, where sustainability practices are often still emerging, the adoption of Green IT/IS tends to result in broader performance improvements, particularly in financial dimensions (Erkmen et al., 2020). This can be attributed to the significant potential for economic and operational gains in settings with less mature baseline practices. In contrast, developed countries, which often have established sustainability frameworks and stricter environmental regulations, tend to experience more pronounced environmental benefits from Green IT/IS adoption (Meacham et al., 2013; Ning and Khuntia, 2023; Spencer et al., 2013). These studies emphasize that environmental awareness and leadership commitment in Green IT practices significantly enhance environmental performance, particularly in contexts with robust institutional support. Moreover, the impact of Green IT/IS adoption remains significant across countries regardless of their economic development, though the strength varies with institutional readiness and market sophistication (Lei et al., 2023). For instance (Ryoo and Koo, 2013), illustrate how the alignment of Green IS practices with organizational strategies can amplify performance outcomes, underscoring the importance of national context. These insights highlight the necessity of tailoring policy frameworks to account for both a country’s developmental status and its institutional maturity to maximize the benefits of Green IT/IS.
5.1.3 Firm size and performance dimensions
The analysis reveals that firm size moderates the impact of Green IT and Green IS on organizational performance, with distinct patterns emerging for SMEs versus large firms. SMEs, being more agile and resource-constrained, exhibit a stronger association between Green IT and performance, particularly due to the immediate cost savings and operational efficiencies from technology-focused solutions like energy-efficient hardware (Chuang and Huang, 2015; Wang et al., 2015; Yang et al., 2018). This suggests smaller organizations may have greater flexibility or urgency to implement such practices. Conversely, Green IS shows a stronger correlation with performance in large firms, likely because their greater institutional resources enable effective integration of comprehensive information systems, such as sustainability-optimized ERP tools or integrated dashboards, into broader strategic frameworks (Haleem et al., 2024; Meacham et al., 2013; Nanath and Pillai, 2017). While the combined Green IT/IS domain shows a relatively weak moderating effect of firm size, separating the two constructs highlights these nuanced differences (Benitez-Amado and Walczuch, 2012; Ryoo and Koo, 2013).
Green IT and Green IS both demonstrate significant positive relationships with environmental performance, with Green IT exhibiting a slightly stronger association, probably because of the clear, quick benefits from tech solutions like energy-saving hardware and data centres (Anthony, 2019; Lei et al., 2023; Loeser et al., 2017). Environmental indicators, such as reduced ecological footprints, are among the earliest and most sensitive outcomes of these initiatives (Loeser, 2013; Wang et al., 2015). For financial performance, Green IT also outpaces Green IS, delivering more tangible and immediate cost savings, such as lower energy consumption and operational efficiencies (Cai et al., 2013; Erkmen et al., 2020; Przychodzen et al., 2018). However, Green IS financial benefits are not meaningful, possibly because they are indirect or emerge over the long term, warranting further exploration. Across performance types, the analysis confirms that green tools consistently enhance outcomes, though the strength and immediacy of these effects differ between Green IT and Green IS, reflecting their distinct roles in driving sustainability and efficiency.
5.2 Managerial and practical implications
5.2.1 Crafting a contextual strategy
The implications of these findings are broad and profound, offering actionable strategies for practitioners tailoring Green IT/IS adoption to specific contexts. Organizations should view Green IT as a strategic tool that enhances performance, particularly in energy-intensive industries where operational efficiencies yield cost savings and competitive edges (Ijab et al., 2012; Watson et al., 2010). Managers are advised to adapt their approaches based on national policy environments and firm-specific needs. Large organizations in policy-rich countries can leverage sophisticated systems like carbon management software and supply chain monitoring for strategic resource insights (Mouakket and Aboelmaged, 2022), while smaller firms in less mature contexts might prioritize incremental upgrades, such as low-energy hardware or data-centre consolidation (Cai et al., 2013). This contextual calibration ensures that Green IT/IS investments align with both external opportunities and internal capabilities, maximizing their practical impact.
5.2.2 Balancing green IT and green IS
The findings carry significant implications, underscoring the value of combining Green IT and Green IS for balanced sustainability outcomes. Green IT investments, like virtualization technologies, reduce operating costs and boost environmental credentials (Molla and Abareshi, 2012), while Green IS tools, such as lifecycle assessment software and analytics dashboards, enable data-driven decisions that optimize resource use (Benitez-Amado and Walczuch, 2012; Nanath and Pillai, 2017). Companies can achieve optimal benefits by pairing these hardware efficiencies with software solutions, blending short-term gains, like lower energy bills, with long-term strategic advantages, such as improved market positioning (Karim et al., 2024; Ning and Khuntia, 2023). This dual approach allows managers to build a cohesive sustainability portfolio that enhances both operational performance and competitive differentiation.
5.2.3 Leveraging policy incentives
These findings have implications for policymakers and firms, highlighting the role of external support in accelerating Green IT/IS adoption. Investments in Green IT, offer firms cost savings and sustainability benefits, but initial costs can be a barrier (Laranja Ribeiro et al., 2021; Mat Nawi et al., 2024). Policymakers can address this by offering financial subsidies, tax benefits, or certification standards, like energy star ratings for IT systems, to encourage uptake. Firms in supportive regulatory frameworks should pursue these incentives, such as technology grants or tax credits, to offset investment risks and speed up green innovation (Chan, 2021; Sayed Sikder et al., 2023). Partnerships with government or non-governmental organizations can further enhance resource access, making sustainable technology adoption more feasible and impactful (Molla and Abareshi, 2012; Ojo and Fauzi, 2020).
5.2.4 Cultivating a green organizational culture
Findings emphasize the critical role of organizational culture in maximizing Green IT/IS benefits. Tools like sustainability dashboards and energy-efficient technologies improve decision-making and efficiency (Benitez-Amado and Walczuch, 2012), but their success depends on employee buy-in. Leaders should foster a sustainability-focused culture through training on Green IT/IS tools, aligning these tools with corporate goals, and appointing green champions to drive engagement (Baggia et al., 2019; Jenkin et al., 2011). This cultural shift ensures sustainability becomes a core organizational value, reducing resistance, sparking innovation, and promoting collaboration across departments, ultimately amplifying the technologies’ performance outcomes.
6. Limitations and conclusion
6.1 Limitations and future study
This study has some limitations that future research can address to improve our understanding. One limitation is that it doesn’t show how Green IT/IS affects performance over time. Future studies could use long-term research to track these changes and see their lasting impact. Another issue is that it’s unclear how factors like company culture, leadership, or regulations affect the link between Green IT/IS and performance. Future work could explore these factors to explain how and when Green IT/IS makes a difference. Moreover, sector-specific analyses are warranted to identify whether the relationship varies across industries, such as manufacturing, services, or technology. Future research could focus on specific industries to see if the relationship varies. Another limitation is the insufficient detail in how Green IT/IS practices and performance outcomes are measured. Future research could address this by using more detailed and specific measures to better capture the complex nature of these concepts. For example, studying particular Green IT/IS practices like energy-efficient data centres or green supply chain management systems might provide more practical and valuable insights. Firm size classification was another limitation in this study. Definitions of SMEs and large firms vary across countries and industries, and some studies did not clearly define size or different criteria (e.g. employees, revenue). In such cases, we relied on contextual clues like industry type or average size to make our classification. Additionally, a few studies included both SMEs and large firms but reported results together, not separately. This required us to choose one category based on dominant characteristics. Moreover, some studies in this meta-analysis did not report correlation coefficients directly and required conversion from other statistical values such as beta coefficients or t-values. Although these conversions follow standard procedures and allow for consistent effect size comparison, they may introduce some degree of estimation error. To address this, appropriate conversion methods were applied carefully, and the overall consistency of results was assessed to ensure reliability. Finally, as technology evolves, the role of emerging technologies like artificial intelligence (AI) and blockchain in facilitating Green IT/IS should be examined to extend the current knowledge base (Bhullar et al., 2025). Such research would provide a richer understanding of the interplay between technological advancements and sustainable practices.
6.2 Conclusion
This study highlights the strategic importance of Green IT and Green IS in enhancing organizational performance across financial, operational, and environmental dimensions. Our meta-analysis confirms a strong, statistically significant relationship between these sustainability-focused technologies and improved firm outcomes. Green IT delivers immediate, tangible benefits through energy-efficient hardware and infrastructure that lower operating costs and reduce environmental footprints. In contrast, Green IS provides deeper, systemic advantages by embedding sustainability into strategic processes, enabling long-term decision-making, resource optimization, and value chain integration. Together, Green IT and Green IS form a synergistic framework that supports not only performance gains but also organizational resilience, innovation, and alignment with growing regulatory and stakeholder demands for sustainability.
Importantly, this study reveals nuanced differences in how these technologies impact firms based on national context and firm characteristics. Cross-country comparisons show that the impact of Green IT/IS is not uniform, developing countries realize stronger performance gains, particularly in financial outcomes, likely due to the transformative effect of new technologies in less mature markets. Developed countries, on the other hand, gain more from Green IT/IS in terms of environmental performance, reflecting stricter regulations and sustainability-driven cultures. Furthermore, national Green IT/IS maturity moderates the relationship: firms in low-maturity countries often experience stronger marginal benefits, as early adopters stand out in underdeveloped green ecosystems, while in high-maturity contexts, the returns are more incremental due to widespread adoption and institutional saturation.
Additionally, our analysis distinguishes the roles of Green IT and Green IS across firm size and performance types. Green IT is especially beneficial for SMEs, offering rapid cost savings and efficiency improvements that align with their resource constraints and agility. Larger firms, however, derive more value from Green IS, which supports complex, organization-wide sustainability initiatives through systems like ERP and integrated dashboards. Across all firm sizes, Green IT tends to outperform Green IS in driving both financial and environmental performance due to its immediate, measurable impacts, while Green IS yields more strategic and long-term benefits. These distinctions emphasize the importance of adopting context-specific green strategies, tailored to firm size, maturity level, and national development stage. Ultimately, this study contributes a comprehensive and practical understanding of how Green IT and Green IS function not just as technologies, but as catalysts for sustainable growth, competitive advantage, and long-term success in diverse economic environments.
The author acknowledges the use of an AI-powered language model to assist with editing and proofreading the manuscript. While the AI tool was used to enhance the grammar, spelling, and clarity of the written English, the core content, ideas, and analysis presented in this paper are the original work of the author.
Conflict of interest: The author declares that he has no conflicts of interest related to this study.
Research involving human participants and/or animals: This study did not involve any human participants or animals.
The data used in this research were derived from secondary sources, including published studies and publicly available datasets.