


This study proposes a digital humanitarianism dynamic capability (DHDC) paradigm that explores the direct effects of DHDC on disaster risk reduction (DRR) and the mediating effects of process-oriented dynamic capabilities (PODC) on the relationship between DHDC and DRR.
To validate the proposed model, the authors used an offline survey to gather data from 260 district magistrates in India managing the COVID-19 pandemic.
The results affirm the importance of the DHDC system for DRR. The findings depict that the impact of PODC on DRR in the DHDC system is negligible. This study can help policymakers in planning during emergencies.
Technological innovation has reshaped the way humanitarian organizations (HOs) respond to humanitarian crises. These organizations are able to provide immediate aid to affected communities through digital humanitarianism (DH), which involves significant innovations to match the specific needs of people in real-time through online platforms. Despite the growing need for DH, there is still limited know-how regarding how to leverage such technological concepts into disaster management. Moreover, the impact of DH on DRR is rarely examined.
The present study examines the impact of the dynamic capabilities of HOs on DRR by applying the resource-based view (RBV) and dynamic capability theory (DCT).
1. Introduction
In response to digital technology, the humanitarian field is transforming rapidly. Academicians and practitioners have discussed the digital humanitarian (DH) as an advance in data production, gathering and processing capacities (Shringarpure, 2020). Various means for data gathering during humanitarian operations include social media, computerized devices such as drones, satellite data and robots (Joshi, 2018; Beitz, 2019). Due to the multiple data sources, information overflows and thus needs digital technologies like big data to facilitate the humanitarian organizations (HOs) with real-time data to provide extended support to the affected areas during the disruption. Big data has changed the face of humanitarian operations in a much more effective manner by empowering actors through new-age technologies, including artificial intelligence (AI) (Roth and Luczak-Roesch, 2020; Sharma and Joshi, 2019; Joshi et al., 2022). The term “Digital Humanitarian,” broadly use the network of individuals (Volunteers and technical communities (V&TCs) experts and humanitarian professional) from every walks of life, qualifications and geographies. As a community-driven network, the digital humanitarian network (DHN) is evolving with its members' growing number of associations. DHs are volunteers, students and professionals from all walks of life. In conjunction with foreign HOs, they are mobilizing online. It makes sense to collect vast amounts of social posts, text messages and photographs from satellites and UAVs to support humanitarian operations. They build and exploit innovative crowdsourcing approaches with relevant AI insights (Hsu et al., 2022; Camburn et al., 2020).
Digital technologies enable “digital Jedis” to couple their humanitarian activities for better response to disasters (Bryant, 2022; Pantti, 2021; Joshi and Sharma, 2022). Such examples include post-earthquake humanitarian support in Haiti in 2010 by using “Crisis-Map”. The world disaster report 2018 refers to mobile technologies and social media in disaster recovery mechanisms as the key enablers to providing humanitarian assistance to thousands of people in need (Hupfer, 2022). The digital humanitarian dynamic capabilities (DHDC) can gain momentum by using digital data for emergency decisions (Abdulhamid et al., 2021; Sharma et al., 2022a). The study of vast volumes of information generated by various outlets, such as social media material, is increasingly important for humanitarian health crises. They are a critical case in which AI technologies (AI) are used to assist in detecting and processing sensitive information. Successful AI systems case studies have been published during humanitarian crises (Fernandez-Luque and Imran, 2018). The technical challenge is the real-time analysis of massive volumes of data. Data interoperability remains a barrier to the Internet, and traditional data sources converge and are required for data sharing (Fernandez-Luque and Imran, 2018).
As per the World Health Organization (WHO) report, there is an ongoing need for humanitarian aid for more than 130 million people due to natural disasters, outbreaks of diseases and conflicts. Digital health is in the incent stage and gradually developing across the sectors (Fernandez-Luque and Imran, 2018; Gupta and Katarya, 2020; Shinners et al., 2020). DH has been a “game-changer” that has revolutionized the traditional humanitarian networks. Past research has identified the technological, computational and operational transformations introduced by the advanced digital technologies in the emergency response (Khan et al., 2020), but the potential of DHN and its contribution to mitigating risk during a disaster is still unexplored. Moreover, how the dynamic capabilities of DHN can influence the emergency or the pandemic need to be assessed. Thus, this current study aims to answer research questions-
RQ1. How DHDC can be measured, and how do they influence the overall emergency management?
RQ2. What are the key (process-oriented) dynamic capabilities that play mediator roles between DHDC and disaster risk reduction (DRR)?
The theoretical foundation for the current study has been drawn from the resource-based view (RBV) (Haan-Cao, 2022) and dynamic capability theory (DCT) (Mishra et al., 2022). RBV theory has been applied in studies to measure the performance of firms. This theory helps to examine how resources can drive competitive advantage, especially capabilities that have been customized to the organizational environment (Sharma et al., 2022b). DCT theory is useful in exploring the inter-relationship between the firm's dynamic capabilities and its performance (Vrontis et al., 2020a; Sharma et al., 2022c). Therefore, based on the RBV and DCT, this study examines the direct and indirect effects of DHDC on DRR.
Followed by the introduction, the paper's organization is as follows: Section 2 elaborates on the systematic literature review process and dimensions of dynamic capabilities of DH. Section 3 includes theory building and hypotheses development. Section 4 presents the measurement model and the results. Section 5 discusses the implications of the research study followed by the limitations and future directions for research.
2. Literature review
Digital humanitarianism is like a cartel that engrosses multiple, diverse data to device humanitarian assignments that could not have been engaged in a more centralized manner (Liu et al., 2019; Vrontis et al., 2020b; Sharma et al., 2022d). The objective of the literature view is to explore the dynamic capabilities of the DHN influence in emergency management.
There are a few similar terms coined in the previous research which convey a similar meaning as digital humanitarianism is focused upon, for example, digital Weberianism, digital Weberianism bureaucracy and emergency digital social service (Meilani and Hardjosoekarto, 2020). These concepts are applied and tested for their efficacy in DRR related to the Sunda Strait volcanic tsunami (Meilani and Hardjosoekarto, 2020). The main difference between the digital humanitarianism and digital Weberianism is the inclusion of AI and bureaucracy together to tackle the disaster (Pre and Post). The understanding of digital Weberianism was conceived and defined by “The social infrastructures that constitute both public and private administration are increasingly entangled with digital code, big data, and algorithms” (Muellerleile and Robertson, 2018). Digital Weberianism was focused on “how the technologies draw from and give new substance to, the three key principles of Weber's theory of the bureau—efficiency, objectivity, and rationality”.
DRR is a novel cause wherein efforts are made to reduce the damages done by natural or man-made disasters. There are many interventions discussed in the literature to reduce the risk of disasters for example proactive and reactive measures are adopted to reduce the risk of disasters as shown in Table 1. These measures experiment at various locations and the risk of disasters is effectively reduced at those places.
Various interventions adopted for reducing the risk
| Authors | Type | Intervention |
|---|---|---|
| Alam et al. (2020), Bwambale et al. (2020), Ruszczyk et al. (2020) and Seddiky et al. (2020) | Proactive | Women empowerment, agriculture insurance, community awareness about knowledge of disasters, state-of-the-art on ecosystem-based solutions, forecast-based humanitarian assistance and the build-back-better |
| Busayo and Kalumba (2020), Huang and Zou (2020), Huang et al. (2020), Meilani and Hardjosoekarto (2020), Muellerleile and Robertson (2018), Nyandiko (2020), Smucker and Nijbroek (2020) and Chernobrov (2018) | Reactive | Digital Weberianism bureaucracy, digital Weberianism, digital volunteer networks, emergency managers |
The systematic literature review is conducted to identify the published literature on DHN, dynamic capabilities of digital humanitarian network (DCDHN) and DRR. The two databases “Scopus” and “Web of Science” are searched. The search includes “Digital Humanitarian” OR “Disaster Risk AND Digital Technologies” AND “Dynamic Capabilities” AND “Disaster” OR “Infrastructure capabilities” AND “Disaster”. The following keywords were searched for the period 2015–2020. The steps for the systematic literature review are shown in Figure 1.
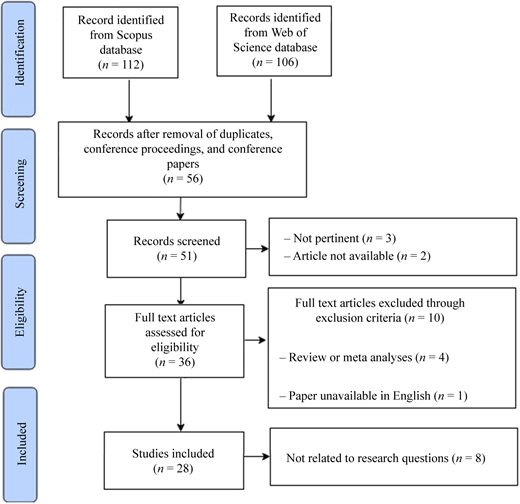
The first search resulted in 218 articles. The conference proceedings, conference papers, working papers and duplicates were excluded resulting in 56 papers. For selecting the papers, the cross-referencing approach was employed and finally, 36 papers were selected. Finally, 28 papers were selected that were directly related to the research questions. The PRISMA flow diagram exhibits the process of systematic literature review performed in the study. The top 10 most cited paper (2010–2020) related to the search is appended in Table 3.
2.1 Theoretical foundation
The performance of the DHN is measured using RBV and DCT theories. These theories are applied to explore the relationship and develop the hypotheses to be tested in the study. The following sub-sections elaborate on the dimensions of the DHDC.
2.1.1 Resource-based view
RBV is one of the most common theories for the organization (Wernerfelt, 1984; Oliver, 1997). Resources are limited during humanitarian operations, and the timely use of available resources is critical. In the DHDC that helps handle the situation, it is possible to recognize the relief organizations' services such as DHN. Crowdfunding is also carried out during relief activities to collect money (Barney et al., 2001; Gupta and Gupta, 2019). This research study analyses the resources of the DH and DHDC.
2.1.2 Dynamic capabilities theory
In recent years, various studies have measured the influence of creativity on the output of an organization (Kraatz and Zajac, 2001; Moliterno and Wiersema, 2007; Vrontis et al., 2020b). Almost every day, new digital studies and capabilities are announced. The standard and conduct of research in the humanitarian environment can be enhanced by automation of the data custody chain, smart metadata and other emerging technologies (Kohrt et al., 2019; Perakslis, 2018). How digitalization (big data) transforms the face of humanitarian response. Following the Haiti earthquake, a digital map of areas most affected by the earthquake was developed. Hundreds of automated volunteers have labeled crowd-sourced knowledge via social media, allowing US emergency teams to find survivors (Chernobrov, 2018; Dave, 2017; Maier-Hein et al., 2015). This study assesses the dynamic capabilities of the DHN and its impact on DRR.
2.1.3 Digital humanitarian as an enabler for enhancing performance
DH ensures participative management and real-time information flow that uses big data for the humanitarian response for effective relief operations (Hua and Shaw, 2020). The DH uses communication technologies in emergency management, greatly influenced by mobile cellular and broadband usage. Mobile phone ownership in low-income countries is surging, making communication easier and more effective with the affected communities in a disaster or emergency. In humanitarian activities using SMS messaging, electronic cash payments, the Geographical Information System (GIS), crowdsourcing and social networking, mobile technology has become highly relevant. OTT networks such as Twitter, Facebook, Instagram, etc. offer an infrastructure to support staff, neighborhoods impacted by crises and those with Internet connections during emergencies (Abdulhamid et al., 2021). In past research, various frameworks and models are introduced and evaluated using social media by various users at micron meso, macro, cross-level and direct channels between micro/macro and macro-level (Finn et al., 2017; Li et al., 2020). The data shares on social networks are mind-bending. For response generation in emergency times, big data is an opportunity to access a massive volume of data. The affected communities use the networking platform to call for help and publish information, and experiences. Social media have created the need for humanitarian actors who play a key role in emergency relief operations. To support humanitarian operations, DHNs contribute their technical expertise through crowd-sourcing. These frameworks can be applied in crowd work to formulate collective intelligence for emergency recovery and survivability using co-creation, open innovation, crowdfunding and crowdsourcing (Abdulhamid et al., 2021; Burns, 2018). There is a need for a strong partnership between HOs and volunteers to mainstream the social networks in emergency response. In 2014 the Ebola outbreak marked the first occurrence in West Africa of an infectious hemorrhagic fever epidemic. The most hit were Senegal, Sierra Leone, and Liberia. Ebola must be seen as a link between health, politics, security, climate, and poverty (Luigi-Bravo and Gill, 2022). Clinical disease management is far from straightforward. It creates a so-called complex humanitarian emergency (Luigi-Bravo and Gill, 2022). A national effort to tackle West Africa's Ebola virus has never been seen before. Experience in disease management and microbiology has included the contribution of Public Health England (PHE). Legacy preparation would be essential for the restoration of hospitals and public health services after the epidemic (Li et al., 2022). Crisis-affected communities are increasingly becoming digital, as are geographic networks of volunteers. This implies that the former is mainly the subject of the related crisis details. In the management and visualization of this knowledge, the latter become more competent (Abdulhamid et al., 2021). Relief staff must define the data used to take action and plan their tasks. For large-scale humanitarian disasters, data analytics are critical to their operations. To analyze this data, data development, sharing and joint analysis are crucial. Findings will build better data analytical tools in environments with limited resources (Hellmann et al., 2016). Joshi et al. (2022) evaluate the key role of drones concerning global epidemics, including humanitarian relief for infectious diseases such as the Wuhan-COVID-19 crisis. In humanitarian assistance, digital technology is widely used and aims to enhance the health and safety of crisis-affected communities-lack by evaluation of these technologies, paternalistic approach to their development, and privacy and equality. It is possible to structure the skills into two major categories: infrastructure and management. The DH wants to improve the essential skills of workforce management, infrastructure and decision-making (Davenport et al., 2012; McAfee et al., 2012; Wamba et al., 2017). These capabilities are essential to optimize their decision models and manage their huge volumes of data (Barton and Court, 2012). Therefore, based on the RBV and DCT theoretical contributions, the constructs are developed.
3. Theory development and conceptual framework
Based on the resource-based view (Grant, 1991), dynamic capability view (Moliterno and Wiersema, 2007; Vrontis et al., 2020a), process-oriented dynamic capabilities and the embryonic concept of digital humanitarianism literature (Table 2), this research proposes a DHDC to reduce the risk of disasters.
Effect on digital humanitarian during pandemic (COVID-19)
| Variables | Description | References |
|---|---|---|
| Crowdsourcing digital disaster response | Preparedness planning and COVID-19 response practices emerged as the key humanitarian activity (HA) among humanitarian actors | Abdulhamid et al. (2021) |
| Usage of big data | Realigning the communicating with teams, stakeholders and communities during COVID-19. It aims to maintain transparency, demonstrate the vulnerability and build resilience among humanitarian organization | Fadiya et al. (2014), Sharma and Joshi (2019), Nagendra et al. (2020) and Swaminathan (2018) |
| Humanitarian crisis reporting | Empowerment of the stakeholders helps humanitarian organizations to identify clear vision, competency and coordination across all levels. It also enhances the pandemic preparedness for effective response | Chernobrov (2018), Marmot et al. (2022) and Lawson (2021) |
| Role of digital volunteers | Risk communication across stakeholder brings transparency and pro-activeness to the pandemic situation. A low level of communication or broadcast of erroneous information may result in distrust among stakeholders | Smith et al. (2021) and Safary et al. (2021) |
| Collaborative mapping | Adoption of information resourcing activities and information behavior adaptation activities can meet the aims of humanitarian operations | Givoni (2021) and Schröder-Bergen et al. (2021) |
| Usage of social media | To ensure responsibility, participation and collaboration, the structure of governance becomes more agile and adaptive during pandemic times | McCosker et al. (2021) and Woods and Shee (2021) |
| Trust among humanitarian actors | Competency-based teaching approach can improve the intercultural pandemic training among the stakeholders. The empowered stakeholders can further improve interdisciplinary integration and enhance the overall operational effectiveness | Bryant (2022) and Jurko (2022) |
| Information system | Triple As' enabled – Information Planning Information System should aim to address' challenges faced by humanitarian organizations (HOs) and their unique missions, value generation processes and resource base for improving performance | Dubrovina et al. (2021), Joshi et al. (2022) and Winarno et al. (2021) |
| Digital humanitarian network design | Digital Humanitarian Networks ensure participative management and real-time information flow that uses big data for the humanitarian response for effective relief operations | Malisova and Stavrakis (2022) and Nazir et al. (2021) |
| Maintaining essential health services | The availability of essential medications, equipment and supplies are to be managed | Coulibaly-Zerbo et al. (2021) and LeFevre et al. (2021) |
| Inter-organizational coordination and collaboration | Collaborative planning for pandemic response through cooperation, interaction and collaboration among relief agencies | Deepu and Ravi (2021) and Saikouk et al. (2021) |
| Multi-modal transportation | Robust transportation can enhance post-pandemic recovery. Usage of multi-modal transportation can connect all supply nodes, affected areas and logistics operational areas | Godin and Donà (2021) and Lehmacher et al. (2021) |
| Surveillance for vulnerable groups | It aims to limit the spread of the pandemic in vulnerable groups (children, women and the old-age population). It is a critical factor as it enables rapid detection, isolation, testing and management. Surveillance is essential to monitor the mid-term and long-term COVID-19 spread in the vulnerable group and also to understand the change in the architecture of the virus and its symptoms | Roberts and Faith (2021), Weitzberg et al. (2021) and Sharma et al. (2022c) |
| Infection prevention and control | IPC is required for patient safety and quality. It is needed at every health care counter for patients and health worker | Kamara et al. (2022) |
| Human security | Protecting human life especially vulnerable groups by involving local government and partners can increase the operational effectiveness of Humanitarian Operations | Sitsinska et al. (2021), Richmond and Visoka (2021), Bryant (2022) and Sharma et al. (2022d) |
| Societal response | It is the collective efforts of Humanitarian Organizations, the corporate world, government, and the community to fight collectively against the COVID-19 situation. Based on the principle of “Respond, Recover and Rebuild” the societal response to the COVID-19 pandemic is a continuous improvement process | Lawson (2021) |
Table 2 Dynamic capabilities of a DH and its usage during pandemic (COVID-19).
DH technology capacity, workforce capacity and management capability have been studied as the core components of the DHDC organization (see Table 3).
Top 10 most cited papers
| Citations | Authors | Title | Year | Source |
|---|---|---|---|---|
| 701 | C. Lesk | Influence of extreme weather disasters on global crop production | 2016 | Nature |
| 395 | V. Barros | Climate change 2014 impacts, adaptation and vulnerability Part B: Regional aspects: Working group II contribution to the fifth assessment report of the intergovernmental panel on climate change | 2014 | Climate Change 2014: Impacts, Adaptation, and Vulnerability: Part B: Regional Aspects: Working Group II Contribution to the Fifth Assessment Report of the Intergovernmental Panel on Climate Change |
| 355 | D. Alexander | Resilience and disaster risk reduction: an etymological journey | 2014 | Natural Hazards and Earth System Sciences |
| 230 | J. Gaillard | Vulnerability, capacity and resilience: Perspectives for climate and development policy | 2010 | Journal of International Development |
| 217 | J. Mercer | Framework for integrating indigenous and scientific knowledge for disaster risk reduction | 2010 | Disasters |
| 212 | B.M. Ayyub | Systems resilience for multihazard environments: definition, metrics and valuation for decision making | 2014 | Risk Analysis |
| 201 | J. Gaillard | From knowledge to action: bridging gaps in disaster risk reduction | 2013 | Progress in Human Geography |
| 198 | J. Mercer | Disaster risk reduction or climate change adaptation: are we reinventing the wheel? | 2010 | Journal of International Development |
| 181 | J. Birkmann | Integrating disaster risk reduction and climate change adaptation: key challenges-scales, knowledge and norms | 2010 | Sustainability Science |
The analysis proposes DH dynamic capabilities as a third-order, hierarchical model embodied in two second-order constructs: DH infrastructure capability and DH management capability, as well as 11 first-order constructs: DH planning (DHP), DH coordination (DHCO), DH control (DHC), DH connectivity (DHCN), DH technical capability (SHTC), DH modularity (DHM), DH process-oriented dynamic capabilities (DH) The report also claims that DH capabilities have a big influence on DHPODC, which affects DRR in turn. The DHDC theoretical framework is presented in Figure 2 and constructs are discussed in Table 4.
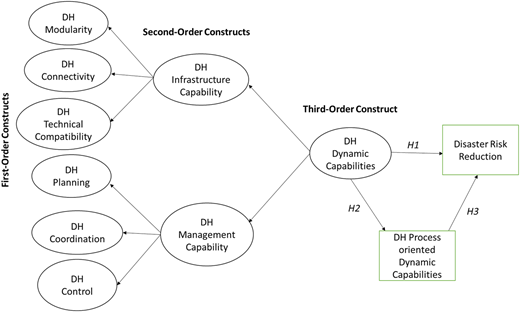
Constructs and definitions of the proposed framework
| Construct (latent variables) | Constructs and definition | Sources |
|---|---|---|
| DH dynamic capability (DHDC) | “DH dynamic capability (DHDC)is broadly defined as the competence to provide humanitarian disaster data management, infrastructure (technology) and talent (personal) capability to manage the humanitarian crisis” | Conceptualized by the authors, based on the literature on dynamic capabilities views (Ferreira et al., 2020; Gupta and Katarya, 2020) |
| DH process-oriented dynamic capability (DH PODC) | DHPODC is a dynamic capability of the humanitarian organization, it including various processes and trends to support the dynamic function of the firms | Defined and conceived by (Munir et al., 2022; Verbeke, 2022; Ndlela and Tanner, 2022) |
| Disaster risk reduction(DRR) | DRR is defined as the strategy for reducing the risk across humanitarian operations and supply chains | Defined by authors (Nohrstedt et al., 2022; Walz et al., 2021; Anderson and Renaud, 2021) |
| Indicator Variables to measure DHDC | Definition | Sources |
|---|---|---|
| DH connectivity (DHCN) | DH infrastructure capability explains the overall capabilities of the humanitarian organization | Adapted from Wamba et al. (2017) |
| DH technical capability (DHTC) | ||
| DH modularity (DHM) | ||
| DH planning (DHP) | DH management capability explained various aspects of planning, coordination and control | |
| DH coordination (DHCO) | ||
| DH control (DHC) |
3.1 Disaster risk reduction
Logistic activity may be described as a socio-technological mechanism by which a human social network organizes a set of technological activities. To understand the whole system's functioning, all its components must be adequately considered (Baffoe and Luo, 2020). Logistics has gained significant attention from scholars and practitioners in the sense of humanitarian operations. In the next 50 years, the number of both natural and human disasters is expected to increase by five times (Abidi et al., 2014; Jabbour et al., 2019; Nikbakhsh and Farahani, 2011). Disaster recovery is complex and can significantly benefit from careful preparation (Gossler et al., 2020; Wisetjindawat et al., 2014). Humanitarian relief agencies mobilize billions of dollars annually to support victims of natural disasters, civil wars and conflicts (Balcik et al., 2010; Tatham and Houghton, 2011; Thomas and Mizushima, 2005).
Logistics are central to their activities and their strategic tasks. Research shows that environmental factors, such as catastrophe unpredictability and financing complexity, have contributed to high-swing logistics activities (Balcik et al., 2010). The 2003 worldwide epidemic of severe acute respiratory syndrome (SARS) has become a wake-up call for healthcare services. Pandemic planning has evolved over the past 15 years, introducing a holistic disease risk management strategy (O'Sullivan and Phillips, 2019; Runge et al., 2020). 2020 was the year of COVID-19 management, World Bank group notes. It calls for the system's use for controlling the risk of health-emergency disasters to supplement existing responses. It claims that the existing disaster management mechanisms and techniques will strengthen reactions to epidemics or global pandemics such as COVID-19 (Djalante et al., 2020).
3.2 DH dynamic capabilities
Disasters are increasing, and the assistance received by donors is becoming more and more unpredictable. HOs try effective and reliable solutions (Tomasini and Van Wassenhove, 2009). Disaster management brings many organizations together to share resources in crises. The collaboration of different organizations relies heavily on successful activities. The real conditions of the 2013 flood in Acapulco, Mexico, showed that anyone organization had been unable to cope. The US economy and people have been severely affected by natural disasters. This is important that aid supplies are planned correctly and handled effectively before a disaster begins. Olanrewaju et al. (2020) provide multi-stage stochastic programming models for suppliers in disaster response planning. It offers relief organizations information on how the terms of the deal impact the decision to pick a service provider and reduce the overall expected contract expense. The models determine whether the chosen suppliers fulfill their contractual terms and how much relief the relief agency has bought from suppliers. This model is used to solve the problem for small-scale test cases and solve a real word problem (Olanrewaju et al., 2020). Therefore, we posit the following hypothesis:
DHDC significantly reduces the risk of disaster.
3.3 DH process-oriented dynamic capabilities
Logistics is essential for humanitarian relief and disaster response operations (Bastos et al., 2014; Maghfiroh and Hanaoka, 2020). Disasters are marked by conflicting, unclear, or data shortages. Disasters like the Asian Tsunami, Hurricane Katrina and earthquakes in Pakistan have shown the urgent need for robust technical infrastructure (Tandon and Kumar, 2020; Tomaszewski et al., 2006). Rapid decisions need to be taken by the humanitarian aid staff. Information availability and consistency expectation is still not met in practice by humanitarian decision support systems (DSS). DSS supports a system for location recognition in disaster relief supply chains to tackle the network architecture (Munyaka and Yadavalli, 2021). A real-life scenario can then be added to the solution strategy (Frennesson et al., 2021; Timperio et al., 2017). On the other hand, vast complexity reflecting pressures and constraints on the field and accelerated humanitarian logistical forecasting is three main challenges for an operational DSS supporting distribution planning (Frennesson et al., 2021). Disasters lead to the collapse of the system of existing ICTs. The ICT failure stops the service from collecting information from disaster-affected areas in real-time last miles. This creates a complex, unpredictable, unstable and restricting humanitarian relief situation (Nagendra et al., 2020). Therefore, we posit the following hypotheses:
DHDC positively affects DHPODC.
DHPODC significantly reduces the risk of disaster.
3.4 Research methodology and data collection
The study employed a quantitative approach and used a convenient sampling method for data collection in India from March to August 2020 by self-administered offline surveys. The survey instrument is spread using paper-print survey approaches (Tamilmani et al., 2020). Appendix shows all first-order constructs and their respective measuring items adapted for measurement.
3.4.1 Questionnaire design
The questionnaire was drawn upon the original literature of the proposed constructs ( Appendix), which were developed following an adaptation of the original RBV to this specific study. The questionnaire was tested using a pilot study before floating it individually to pan India respondents (District Magistrates). By measuring Cronbach's alpha values for each theoretical component, the instrument's reliability and inner consistency were assessed. Using the inter-item correlation study, the validity of the model was tested. The average alpha of Cronbach was 0.92, and the individual alpha of Cronbach was also larger than 0.9 for each construct ( Appendix). As mentioned Although the instrument was conceived from the previous literature, confirmatory factor analysis (CFA) was used to test the adequate item loadings and sampling adequacy; the KMO test results show valid adequacy (Greater than 8), as shown in Table 5) of the samples while few items were deleted due to cross lodgings and poor loading (Below 0.4, Appendix). The details of the items and the constructs, along with their source, are presented in Appendix.
3.4.2 Data collection and sampling
Data were collected from district magistrates across pan India in two stages from February to April 2020 during the COVID-19 lockdown period. A convenient sampling technique was used. A structured questionnaire was developed using forms, with a consent form appended to it, and shared with the respondents through offline mode. On the five-point Likert scale, the participants were asked to indicate their responses. Two hundred sixty-five of the survey responses were collected offline, 265 were eventually deemed complete, with five found to be incomplete and rejected in all respects. The respondents' demographic details show 83.3% of females and 16.69%, of male participants, with an average age of 38 years old.
4. Measurement model
CFA was used to test the fitness of the measurement model. The average factor loading was greater than 0.65, which shows a good model convergent; the average factor lodgings were> AVE and AVE was > the inter-correlation among the constructs. (Tables 5–8 show fairly good discriminant validity. The CFA function was used to validate the measurement model using the R studio LAVAAN Package (Barrett, 2007; Oberski, 2014; Rosseel, 2020).
CFA factor lodgings (Regression based) of latent variables with AVE (Convergent and discriminant validity)
| Latent variables | Estimate | Std.Err | z-value | p(>|z|) | Std.lv | Std.all | AVE |
|---|---|---|---|---|---|---|---|
| DH_infra =∼ | 0.626142 | ||||||
| DHCN | 1 | 0.666 | 0.668 | ||||
| DHTC | 0.982 | 0.112 | 8.752 | 0.000 | 0.654 | 0.655 | |
| DHM | 0.952 | 0.111 | 8.534 | 0.000 | 0.634 | 0.635 | |
| DH_Management =∼ | 0.697346 | ||||||
| DHP | 1 | 0.67 | 0.672 | ||||
| DHCO | 1.18* | 0.117 | 10.123 | 0.000 | 0.791 | 0.793 | |
| DHC | 0.995 | 0.111 | 9.007 | 0.000 | 0.667 | 0.669 | |
| DHDC =∼ | 0.915759 | ||||||
| DH_infra | 1 | 0.98 | 0.98 | ||||
| DH_Management | 0.921 | 0.119 | 7.74 | 0.000 | 0.897 | 0.897 | |
Note(s):* Factor loadings may be greater than 1 in the case of Regression-based CFA
Correlation matrix of the first-order constructs
| Component correlation matrix | ||||||||
|---|---|---|---|---|---|---|---|---|
| Component | DHCN | DHTC | DHM | DHP | DHCO | DHC | DHPODC | DRR |
| DHCN | 0.70 | |||||||
| DHTC | 0.42 | 0.60 | ||||||
| DHM | 0.43 | 0.43 | 0.61 | |||||
| DHP | 0.42 | 0.35 | 0.36 | 0.59 | ||||
| DHCO | 0.44 | 0.45 | 0.47 | 0.54 | 0.72 | |||
| DHC | 0.41 | 0.36 | 0.42 | 0.47 | 0.51 | 0.67 | ||
| DHPODC | 0.45 | 0.48 | 0.34 | 0.35 | 0.45 | 0.37 | 0.68 | |
| DRR | 0.35 | 0.34 | 0.34 | 0.33 | 0.45 | 0.35 | 0.34 | 0.62 |
Note(s): Diagonal values represents the AVE
Model fit indices
| Fit indices' analysis of the research model | Model fit | Reference index | Source of reference |
|---|---|---|---|
| χ2/df | 1.9 | <3 | Bagozzi and Yi (2012), Barrett (2007) and Falke et al. (2020) |
| Goodness-of-fit index (GFI) | 0.984 | >0.9 | Bagozzi and Yi (2012), Barrett (2007) and Falke et al. (2020) |
| Adjusted goodness-of-fit index (AGFI) | 0.967 | >0.9 | Bagozzi and Yi (2012), Barrett (2007) and Falke et al. (2020) |
| Normed fit index (NFI) | 0.974 | >0.9 | Bagozzi and Yi (2012), Barrett (2007) and Falke et al. (2020) |
| Bentler–Bonnet non-normed fit index (NNFI) | 1 | >0.9 | Bagozzi and Yi (2012), Barrett (2007) and Falke et al. (2020) |
| Tucker–Lewis Index (TLI) | 1 | >0.9 | Bagozzi and Yi (2012), Barrett (2007) and Falke et al. (2020) |
| Comparative fit index (CFI) | 1 | >0.9 | Bagozzi and Yi (2012), Barrett (2007) and Falke et al. (2020) |
| Standardized root mean square error of approximation (SRMR) | 0.025 | <0.08 | Bagozzi and Yi (2012), Barrett (2007) and Falke et al. (2020) |
The codes are appended in Appendix (A1). The output of the measurement model shows a fairly good fit (Figure 2). The model fit indices like SRMR, TLI, AGFI, GFI, NNFI and CFI adequately fit the specified values (Table 7). We conducted a measurement analysis to verify the reliability, the uni-dimensionality, the convergence validity, the discriminated validity and the fit indices before applying structural equation modeling to test the hypothesis.
The average variance extracted (AVE) shows discrimination based on the following thumb rule: the AVE of each latent construct should be greater than that of the highest squared correlation with any other latent variable depending on the appropriate correlations of the confirmatory factor analysis (CFA) model (Fornell and Larcker, 1981; Henseler et al., 2014; Voorhees et al., 2016). For most variances, a single factor test was introduced to determine a possible common method bias (Podsakoff and Organ, 1986). The single factor expressed 45% of the overall variance; this result is a little high and indicates a probability of common method bias. Nevertheless, the correlation matrix (Table 7) reveals that the highest correlation between the constructs is 0.54, while common method bias is generally shown by exceedingly strong correlations (r N 0.90) (Bagozzi et al., 1991). Hence, common method bias in this study is not a serious concern.
4.1 Structural model
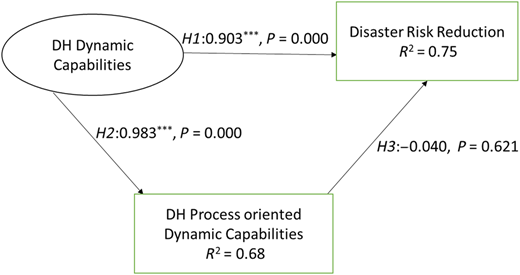
The proposed framework is empirically tested, and the regressions of the structural model are executed using the Lavan package of R. The regression output of SEM is listed in Tables 9 and 10 below. The path model of the SEM is shown in Figure 3.
Structural equation modeling path model
| Regressions | ||||||
|---|---|---|---|---|---|---|
| Estimate | Std.Err | z-value | p(>|z|) | Std.lv | Std.all | |
| DHPODC ∼ | ||||||
| DHDC | 0.983 | 0.121 | 8.1 | 0.000 | 0.642 | 0.643 |
| DRR ∼ | ||||||
| DHPODC | −0.04 | 0.081 | −0.495 | 0.621 | −0.04 | −0.04 |
| DHDC | 0.903 | 0.158 | 5.731 | 0.000 | 0.59 | 0.591 |
4.2 Data analysis and results
The results of the path model indicate that H1 and H2 are supported at a significantly high level. Hence, DHDC significantly reduces disaster risk, while DHDC also helps to improve DHPODC. Surprisingly, DHPODC does not significantly reduce the risk of disasters (H3); perhaps it is due to DH's nature, which depends upon the management of volunteers that uses various social media and other ICT devices, unlike the manufacturing or service firms.
5. Implications of the research
This research has some theoretical consequences for DHDC research. Firstly, it is among the few studies to evaluate the effect of DHDC on DRR and DHPODC. The research on DHDC is a new area that lacks literature. Secondly, DH is a relatively new concept that is underutilized by agencies to reduce the risk of disasters. The study has also included DHDC and DHPODC and opened a new window that had not been discussed before. The combination of DHDC and DHPODC was investigated in the study. Finally, by following the DHDC paradigm, we prove that this strategy helps to explain the use of DH to minimize disaster risk. This methodology is demonstrated by the theoretical model.
The findings guide policymakers and agencies who are engaged in disaster management. The non-significant role of DHPODC indicates that to leverage digital humanitarianism, dynamic management (DHDC) is more valuable; in uncertain environments, DHDC can be leveraged as a source of advantage to control the disaster. The two DHDC components intensely influence DRR indicating that to translate DHDC into results; administrators need to concentrate on DH infrastructure capability, which includes DH connectivity, DH technical capability and DH modularity. Likewise, administrators may inspect the microstructure of DH planning, investment, coordination and control. This helps to safeguard DH management capability, which is one of the mainstays of DHDC. Some research also suggests that hybrid governance gives a good result in humanitarian crisis it is also observed that the digital forecast-based techniques have helped in DRR. Digital volunteer networks have played a significant role in crisis reporting, especially for human rights (Dzhennet-Mari and Malika-Sofi, 2020; Chernobrov, 2018).
6. Limitations and further research
This research has explored how digital technology and society theories could be leveraged to understand digital humanitarianism to reduce the risk of disasters. It is imperative to note that the results of this research of digital humanitarianism may also translate into an understanding of the technological and societal implications. Digital humanitarianism is activism that positively helps to reduce the impact of disasters in emergencies. Therefore, handling of DH is a different ball game compared to other fields of management. Hence, the survey used for this research was convenient sampling. Future research could widen the survey for generalizations of the results. As governmental and non-governmental organizations leverage DH techniques, DHDC identified here will have wider ramifications. In addition, the research framework developed can be further examined into case-based settings and has the potential to reused for further empirical studies with bigger sample size.
This paper forms part of a special section “The COVID19 impact on humanitarian operations: lessons for future disrupting events”, guest edited by Bhavin Shah, Guilherme Frederico, Vikas Kumar, Jose Arturo Garza-Reyes and Anil Kumar.
References
Further reading
Appendix
| Item | DH dynamic capability (DHDC) (AVE: 0.915759) | Item code | Mean | SD |
|---|---|---|---|---|
| DH Connectivity (α = 0.86; CR: 0.90; AVE: 0.71) | 4.04 | 1.15 | ||
| 1 | The district has sufficient infrastructure for the digital network connectivity | DHCN1 | ||
| 2 | All other (e.g. remote, branch and mobile) offices are connected to the central district office for sharing analytics insights | DHCN2 | ||
| 3 | Our district utilizes open systems network mechanisms to boost analytics connectivity | DHCN3 | ||
| 4 | There are no identifiable communication bottlenecks within our district for sharing analytics insights | DHCN4 | ||
| DH Technical Compatibility (DHTC) (α = 0.91; CR: 0.92; AVE: 0.63) | 4.10 | 1.16 | ||
| 1 | The district disaster center software applications can be easily used across multiple analytics platforms | DHTC1 | ||
| 2 | Our user interfaces provide transparent access to all platforms | DHTC2 | ||
| 3 | Information is shared seamlessly across our district departments, regardless of the location | DHTC3 | ||
| DH Modularity (DHM) (α = 0.90; CR: 0.93; AVE: 0.64) | 4.12 | 1.12 | ||
| 1 | Reusable software using crowed sourcing modules are widely used in our new system development | DHM1 | ||
| 2 | Officers utilize object-oriented tools to create their insights | DHM2 | ||
| 3 | Analytics personnel the software to minimize the information sharing time of the events | DHM3 | ||
| 4 | The bureaucracy system within our district restricts the use of the centralized crowdsourcing | DHM4 | ||
| DH Planning (DHP) (α = 0.92; CR: 0.94; AVE: 0.73) | 4.11 | 1.21 | ||
| 1 | We continuously examine innovative opportunities for the strategic use of disaster data analytics | DHP1 | ||
| 2 | We enforce adequate plans for the utilization of data analytics | DHP2 | ||
| 3 | We perform business analytics planning processes in systematic ways | DHP3 | ||
| 4 | We frequently adjust disaster operations plans to better adapt to changing conditions | DHP4 | ||
| DH Coordination (DHCO) (α = 0.90; CR: 0.93; AVE: 0.69) | 4.11 | 1.15 | ||
| 1 | In our district, data analysts and officers meet regularly to discuss important issues | DHCO1 | ||
| 2 | In our district, data analysts and officers from various departments regularly attend cross-functional meetings | DHCO2 | ||
| 3 | In our district, data analysts and officers coordinate their efforts harmoniously | DHCO3 | ||
| 4 | In our district, information is widely shared between data analysts and officers so that those who make decisions or perform jobs have access to all available know-how | DHCO4 | ||
| DH Control (DHC) (α = 0.92; CR: 0.93; AVE: 0.72) | 4.19 | 1.11 | ||
| 1 | In our district, the responsibility for digital humanitarian development is clear | DHC1 | ||
| 2 | We are confident that digital humanitarian proposals are properly appraised | DHC2 | ||
| 3 | We constantly monitor the performance of the digital humanitarian function | DHC3 | ||
| 4 | Our disaster management department is clear about digital humanitarian performance criteria | DHC4 | ||
| 5 | Our district is better than others in connecting (e.g. communication and information sharing) parties within the departments | DHC5 | ||
| 6 | Our district is better than others in reducing disaster within a time frame | DHC6 | ||
| 7 | Our district is better than others in bringing complex analytical methods to bear on a disaster management process | DHC7 | ||
| 8 | Our company is better than others in bringing detailed information into a disaster management process | DHC9 | ||
| DHPODC (α = 0.91; CR: 0.91; AVE: 0.64) | 4.12 | 1.19 | ||
| 1 | Our district is better than others in connecting (e.g. communication and information sharing) parties within a business process | DHPODC1 | ||
| 2 | Our district is better than others in reducing costs within disaster operations | DHPODC2 | ||
| 3 | Our district is better than others in bringing complex analytical methods to bear on disaster operations | DHPODC3 | ||
| 4 | Our district is better than others in bringing detailed information into a disaster operations process | DHPODC4 | ||
| Disaster Risk reduction (DRR) (α = 0.92; CR: 0.92; AVE: 0.68) | 4.38 | 1.12 | ||
| 1 | Use of digital humanitarian has reduced the time to control the disaster | DRR1 | ||
| 2 | Use of digital humanitarian has enabled the resource allocation to the needy | DRR2 | ||
| 3 | Use of digital humanitarian have facilitated a quick response to the affected | DRR3 | ||
| 4 | Use of digital humanitarian have facilitated the centralized decision to oversee all the relief activities | DRR4 | ||
| 5 | Use of digital humanitarian have reduced the risk of casualties in my district | DRR5 |

