


Despite a growing body of research on the problem of increasing disaster preparedness by pre-positioning relief supplies at strategic locations, there is a lack of a benchmark set of problem instances that hinders thorough hypotheses testing, sensitivity analysis, model validation or solution procedure evaluation. The purpose of this paper is to address this issue by constructing a public library of diverse pre-positioning problem instances.
By carefully manipulating some of the instance parameters, the authors generated 30 case studies that were inspired by four instances collected from the literature that focus on disasters of different type and scale that occurred in different parts of the world. In addition, the authors developed a tool to algorithmically generate arbitrarily many diverse random instances of any size.
For many purposes, the problem library can eliminate or reduce the time-consuming process of data collection, conversion, digitization, calibration and validation, while simultaneously increasing the statistical significance of research results and allowing comparison with different works in the literature.
The case studies are inspired by only four disasters, and some of the instance parameters are defined in a reasonable, albeit arbitrary way. The instances are also limited by the underlying problem assumptions.
The instances provide a more comprehensive and balanced experimental setting (compared to a single case study) that can be used to study the pre-positioning and related problems, or derive managerial implications that can directly benefit the practitioners.
The instances can be used to derive practical guidelines that humanitarian workers can use on the ground to better plan their pre-positioning strategies and therefore minimize human suffering.
The case studies and the random instance generator are made publicly available to foster further research on the problem of pre-positioning relief supplies and humanitarian logistics in general.
Nomenclature
Sets
- Q
set of facility categories
- K
set of commodities
- S
set of scenarios
- V
set of vertices
- Es
set of edges in scenario s ∈ S
- Fi
- Vq
volume capacity of a facility of category q ∈ Q (m3)
- Aq
opening cost of a facility of category q ∈ Q (€)
- Vk
unit volume of commodity k ∈ K (m3)
- Bk
unit acquisition cost of commodity k ∈ K (€)
- Ck
unit transportation cost of commodity k ∈ K (€)
- V
average speed (km/h)
- Ps
probability of scenario s ∈ S
demand for commodity k ∈ K at vertex i ∈ V in scenario s ∈ S
- A
total budget for opening the facilities (€)
- B
total budget for aid acquisition (€)
- C
total budget for transportation (€)
1. Motivation and literature review
Disasters cause human suffering, environmental and economic harm, and set back progress on eliminating poverty (United Nations Development Programme, 2012). The world has witnessed some of the deadliest disasters of the century in the last 20 years; the total death toll from the 2004 Asian tsunami, the 2008 Cyclone Nargis and the 2010 Haiti earthquake was more than 500,000, while more than 6,000,000 people were left affected (Guha-Sapir; Balcik et al., 2016). During 2017 only, hurricanes Maria, Irma and Harvey affected the lives of millions of people in North America (Guha-Sapir). Furthermore, man-made disasters (such as conflicts, nuclear accidents or terrorist attacks) threaten the lives of people; for instance, the Syrian conflict, which started in 2011, has triggered the world’s largest humanitarian crisis since the second World War, killing more than 470,000 people to date and causing millions of people to be displaced (Balcik et al., 2016; Syrian Center for Policy Research, 2016).
No country is immune from the risk of disasters, but much human loss can be avoided by preparing to better deal with these emergencies. One mechanism to increase preparedness is advance procurement and pre-positioning of relief inventory at strategic locations. This allows to additionally speed up emergency assistance and save more lives by reaching areas that could be otherwise inaccessible (Chapman et al., 2014; Duran et al., 2011; Holguín-Veras et al., 2014; Kunz et al., 2014). The importance of pre-positioning relief supplies was demonstrated when Hurricane Katrina devastated New Orleans in 2005. The lack of pre-positioned materials and the delay in arrival of these supplies hampered further relief to the victims (de Brito Junior et al., 2013). Public records and interviews with the individuals directly involved in the logistical response indicate that the Federal Emergency Management Agency started deploying supplies just a day before the Katrina landfall (which was soon suspended because of the risks posed by the imminent strike of the hurricane) and was consequently still focused on procuring and deploying resources when it was expected to have those services already available to victims. Next to the time-consuming and bureaucratic nature of the procurement process, the supplies that can be expected to be high in demand tend to be more difficult to find, and it comes as no surprise that in this case, the suppliers were not able to supply goods in the necessary quantities. It has also been argued that the selection of storage facilities delayed the immediate response, since some supplies were stored too far away from the affected areas. For these reasons, some people in need of assistance have not received the needed supplies until seven to ten days after landfall, and the quantities of supplies received were significantly lower than the quantities requested (Holguín-Veras et al., 2007).
Only a decade ago, there were only a few studies focused on the pre-positioning problem (Altay and Green, 2006), but the growing research interest in the field has resulted in an abundance of articles that focus on different aspect of the problem. A recent literature review on the pre-positioning problem can be found in Balcik et al. (2016) or Grass and Fischer (2016). Despite the growing scientific attention for the pre-positioning problem, there is no set of standard benchmark instances that researchers can use to validate their models, solution procedures or hypotheses. Researchers therefore have to invest a lot of time and effort to process raw historical data from several databases in order to generate only one case study (Balcik et al., 2016); most often they proceed to use this single case study to test and illustrate their approaches (Table I). Notwithstanding the great lengths that the authors have gone to in order to collect the data, the statistical significance of findings obtained from a single problem instance is open to question. In addition, such findings might even be misleading, as they might only hold for the particular structure present in that instance, but might become invalid for other types of problem instances.
Literature review of the case studies for the pre-positioning and related problems
| Article | Time | Location | Disaster type | Principal data sources | Main findings | Methodology |
|---|---|---|---|---|---|---|
| Balcik and Beamon (2008) | 1900–2006 | Worldwide | Earthquake | National Geophysical Data Center, Socioeconomic Data and Applications Center | Pre-disaster investments have a strong impact on the emergency strategy response time and proportion of demand satisfied | Sensitivity analysis on pre- and post-disaster budgets |
| Barzinpour and Esmaeili (2014) | – | Tehran | Earthquake | Risk Assessment tool for Diagnosis of Urban Areas against Seismic Disaster, GIS information | Virtual zoning approach (that helps the authorities create a better collaboration between neighboring local areas) yields lower logistics costs and greater coverage that municipal subregional zoning | Comparison of the solutions obtained by the two different approaches |
| Bemley et al. (2013) | 2005 | US Gulf Coast | Hurricane | US Coast Guard, National Weather Service, National Hurricane Center | Pre-positioning of repair supplies increases the ability of a port to quickly recover from disasters | Sensitivity analysis on the amount of available supply |
| Bozorgi-Amiri et al. (2013) | – | Tehran | Earthquake | Tehran Municipality Urban Planning and Research Center | It is beneficial to consider the total cost and people satisfaction simultaneously rather than individually; the same holds for different types of uncertainty | Comparison of the solutions obtained by the proposed bi-objective model and the two single-objective models; and models that consider some or all types of uncertainty |
| Chapman et al. (2014) | – | South Eastern US | Hurricane | Louisiana Homeland Security and Emergency Preparedness (Chapman, 2007) | Pre-positioning emergency supplies reduces both the logistics costs and the unmet demand | Comparison of the solutions obtained with or without a pre-positioning policy |
| de Brito Junior et al. (2013) | – | São Paulo State | – | Historical data and geographic information | Stochastic model generates more robust solutions | Comparison of the solutions obtained by a deterministic and stochastic model |
| Falasca and Zobel (2011) | – | – | – | Random instance | Stochastic programming on average reduces the logistics costs and the unmet demand compared to a simple expected value approach | Comparison of the solutions obtained by a deterministic and stochastic model |
| Galindo and Batta (2013) | 2005 | US Gulf Coast | Hurricane | National Hurricane Center, Internal Revenue Service e-File, Natural Resources Defense Council (Cornuéjols et al., 1991; Lin et al., 2011) | Pre-positioning reduces the logistics costs | Sensitivity analyses on the amplifying factor that indicates the number of times that the distribution costs are amplified after the disaster |
| Gonçalves et al. (2013) | 2009–2010 | Ethiopia | Food insecurity | World Food Program Ethiopia | The proposed model is a useful tool for food aid supply and distribution planning | Comparison of the solution obtained by the proposed model to the strategy carried out by World Food Program |
| Klibi et al. (2013) | 1964–2012 | North Carolina | – | North Carolina Emergency Management Division, Federal Emergency Management Agency | The proposed solution approach is useful for tackling humanitarian relief problems | Comparison of the solution obtained by the proposed solution approach with the existing network design |
| Li et al. (2011) | 1880–2007 | US Gulf Coast | Hurricane | North Atlantic Hurricane Database, State Government of Louisiana, American Red Cross (Klotzbach et al., 2014) | The proposed model and solution procedure can be used to efficiently solve the sheltering network planning | Demonstration of the solution algorithm convergence and efficiency for a real-world problem instance |
| Lodree et al. (2012) | – | US Gulf Coast | Hurricane | Rawls and Turnquist (2010) | Expected performance of the proposed pre-positioning strategy is more effective than the wait-and-see approach | Comparison of the solutions obtained using the two approaches |
| Manopiniwes et al. (2014) | 2011 | Thailand | Flood | Department of Disaster Prevention and Mitigation, Ministry of Interior of the Royal Thai Government | The proposed model can be used to optimize the facility locations and stocking decisions | Sensitivity analysis on different time and cost parameters |
| Mete and Zabinsky (2010) | – | Seattle | Earthquake | Cascadia Region Earthquake Workgroup, Earthquake Engineering Research Institute, Washington Military Department Emergency Management Division | The proposed model can aid interdisciplinary agencies to both prepare and respond to disasters | Application of the model to solve the case study |
| Moreno et al. (2016) | 2011 | Rio de Janeiro State | Flood | The Emergency Events Database, Instituto Brasileiro de Geografia e Estatística, International Federation of Red Cross and Red Crescent Societies (Altay and Green, 2006; Rawls and Turnquist, 2010) | The integration of decisions in a multi-period context and the option of reusing vehicles reduce total costs, thus improving the overall performance of the relief operations | Comparison of the solutions obtained by a single- and multi-period model, and with our without reusing the vehicles |
| Murali et al. (2012) | – | Los Angeles County | Anthrax attack | Bravata et al. (2006) | The proposed heuristic can be used to locate facilities to address large-scale emergencies | Comparison of the solutions obtained by the proposed locate-allocate heuristic and simulated annealing procedure introduced in (Berman and Drezner, 2006) |
| Noyan (2012) | – | US Gulf Coast | Hurricane | Rawls and Turnquist (2010) | The optimal location and allocation policies change with respect to the risk parameters that describe the level of conservativeness and risk-averseness | Sensitivity analysis on the risk parameters |
| Pradhananga et al. (2016) | – | US Gulf Coast | Hurricane | Rawls and Turnquist (2010) | The network and deprivation cost structure affects the preparedness and response planning decisions and resulting costs and level of service | Comparison of the solutions obtained by considering a single pre-selected potential supply point and the proposed three-echelon network structure with multiple supply points; and of the solutions obtained by minimizing constant, linearly- and the proposed exponentially-increasing deprivation costs |
| Rawls and Turnquist (2010) | – | US Gulf Coast | Hurricane | The Atlantic Oceanographic and Meteorological Laboratory | The proposed Lagrangian L-shaped heuristic can be used as an effective large-scale resource pre-positioning planning tool | Comparison of the solutions obtained by the proposed heuristic and CPLEX |
| Rawls and Turnquist (2011) | – | US Gulf Coast | Hurricane | Rawls and Turnquist (2010) | Adding the service quality constraints to the model results in more open facilities, reduced tendency of facilities to be specialized for storage of just one commodity and increased computational complexity | Comparison of the solutions obtained with and without service quality constraints |
| Renkli and Duran (2015) | – | Istanbul | Earthquake | Istanbul Metropolitan Municipality, Japan International Cooperation Agency | Adding a probabilistic constraint that ensures a certain service reliability opens storage facilities at safer but more distant locations from their assigned affected areas, thereby reducing the expected unsatisfied demand and increasing the average distance | Comparison of the solutions obtained by employing a model with and without reliability constraints |
| Rezaei-Malek and Tavakkoli-Moghaddam (2014) | – | Seattle | Earthquake | Mete and Zabinsky (2010) | It is beneficial to consider the response time and sum of logistics and unmet demand penalty costs simultaneously rather than individually | Comparison of solutions obtained by the proposed bi-objective model and the two single-objective models |
| Rottkemper et al. (2011) | – | Burundi | Meningitis epidemic | Médecins Sans Frontièères | Taking the possibility of future disruptions (e.g. an overlapping disaster) into account can help to balance inventories and decrease unsatisfied demand, without a significant increase in logistics costs | Comparison of the solutions obtained by the proposed model and the transshipment model when uncertain parts of demand are ignored |
| Salmerón and Apte (2010) | – | – | Hurricane | Fritz Institute, Federal Emergency Management Agency (Heidtke, 2007; Tean, 2006) | As more budget becomes available, allocation levels increase progressively in warehouses and shelters, and remain fairly constant for expansion of ramp space and health facilities, what is a clear indication that initial conditions in warehouse capacity are the most compelling limitation to minimize casualties | Sensitivity analysis on the total budget |
| Sheu and Pan (2014) | 2009 | Taiwan | Typhoon | Ministry of the Interior Department of Statistics, Pingtung County Government, Central Disaster Emergency Operation Center Taiwan, local hospitals, GIS information | A centralized emergency supply network designed by the proposed method is superior over a decentralized one (host government does not collaborate with local NGOs), especially with regard to distribution network design | Comparison of the solutions obtained by the model under a decentralized and centralized condition |
| Uichanco | 2013 | Phillipines | Typhoon | Philippines’ Department of Social Welfare and Development, National Disaster Risk Reduction and Management Council, Federal Emergency Management Agency, GIS information (Holland, 1980) | The proposed robust model yields a lower average distance traveled than other common pre-positioning methods under typhoon path uncertainty and supply vulnerability | Comparison of the solutions obtained with no pre-positioning and the nominal, stochastic and robust pre-positioning strategies |
Note: In most of the literature on the pre-positioning problem, the authors process a lot of data from a few databases in order to generate a single case study that they use to obtain their findings
There are only a few articles on the pre-positioning problem that employ a number of problem instances to support their claims (e.g. Burkart et al., 2017; Döyen et al., 2012; Hong et al., 2015; Lin et al., 2012; Mohammadi et al., 2016) (a number of randomly generated instances, sometimes also including a case study), but the articles contain limited information about their construction and diversity, and none of the aforementioned case studies have been made publicly available. Sharing the data is important, as it allows to replicate the experiments and compare and build upon other work in the literature. The lack of benchmark data has been noted as a striking shortcoming of humanitarian logistics research (Kovács and Spens, 2011), and a recent survey on the pre-positioning problem (Balcik et al., 2016) suggests that it would be extremely valuable to create some benchmark case study data sets to test different approaches proposed for disaster inventory planning (e.g. implications of considering different problem aspects, objectives or different modeling approaches).
The lack of robust data is not only an issue for the research on the pre-positioning problem – it has been addressed as one of the most vexing problems in the humanitarian domain in general, with the data even being referred as the beast in humanitarian operations and crisis management and “data, data and data” being listed as the three key problems of the field (Starr and Van Wassenhove, 2014). There exist some platforms to collect and share data, such as Humanitarian Data Exchange (United Nations Office for the Coordination of Humanitarian Affairs) and Humanitarian Open Street Map (Humanitarian Open Street Map Team), yet data remain messy (Starr and Van Wassenhove, 2014). This is why the aforementioned trends are followed overall in the humanitarian logistics literature: a lot of time is invested in acquiring the data to generate a single case study that is employed to obtain some results (e.g. Afshar and Haghani, 2012; Barbarosoglu and Arda, 2004; Camacho-Vallejo et al., 2015; Gutjahr and Dzubur, 2016; Rivera-Royero et al., 2016). As the humanitarian logistics field matures, it is therefore important to establish some sets of standard problem instances (as richly varied as the types of disasters that can occur (Starr and Van Wassenhove, 2014)) that have long been available for some commercial logistics problems, e.g. traveling salesman problem (Reinelt, 1991) or vehicle routing problem (Golden et al., 1998; Uchoa et al., 2017).
To the best of our knowledge, this paper is the first attempt to assemble such a set of problem instances in the field of humanitarian logistics. To do this, we contacted many authors who introduced interesting case studies in their work, but, unfortunately, we received data from only four. The case studies we collected were described in different formats, lengths and languages, and the majority of them were not even pre-positioning problem instances. However, by defining the missing values in a reasonable way and strategically manipulating some parameters, we generated 30 case studies inspired by those four instances. In addition, we implemented an instance generator that can construct arbitrarily many diverse random instances of any size. We hope that the instances can support further research on the problem and have therefore made them readily available for download from the following webpage: http://antor.uantwerpen.be/prepositioning-problem-instances/.
The remainder of the paper starts with the pre-positioning problem description in Section 2. The case studies and the random instances are introduced in Sections 3 and 4, respectively. In order to better illustrate the contributions of this paper, we give a few examples of how these instances can be applied in Section 5. The paper ends with some limitations of the set of generated instances and resulting possibilities for future work.
2. Problem description
We adopt the problem description introduced in Rawls and Turnquist (2010) and thus look at pre-positioning strategies that determine the location and size of storage facilities, the quantities of various types of emergency supplies stocked in each facility and the distribution of the supplies to demand locations after an event, under uncertainty about if, or where, a disaster might occur. The uncertainties about demands, survival of pre-positioned supplies and transportation network availability are modeled as a random vector with a finite number of possible realizations, called scenarios s ∈ S, with respective probability masses Ps.
The pre-positioning problem instance (notation) is summarized in the nomenclature. The transportation network in a disaster scenario s ∈ S is represented by a directed graph Gs=(V, Es), where the set of vertices V represents the cities, villages or communities that might be potential facility and/or demand locations, and the set of edges Es represents the roads that connect them, with the weight of an edge (i, j) being the distance from vertex i ∈ V to vertex j ∈ V in scenario s ∈ S.
The subset of vertices i ∈ V with Fi=1 are potential facility locations. A storage facility of a number of different categories q ∈ Q, with a given volume capacity Mq and opening cost Aq, might be opened at any of these potential facility locations, while the facility budget A is respected. Commodities of different types k ∈ K, such as food, water, medicine, blankets or clothing, can be pre-positioned at any open storage facility, if the facility capacity and acquisition budget B constraints are respected. The commodity types differ in unit volume Vk, unit acquisition cost Bk, and unit transportation cost Ck.
The proportion of pre-positioned commodity type k ∈ K at vertex i ∈ V that remains usable (i.e. that is not destroyed) in a disaster scenario s ∈ S can be distributed with an average speed V to the beneficiaries that are in need of assistance, as long as the transportation budget C is not violated. The demand for commodity type k ∈ K at a vertex i ∈ V in disaster scenario s ∈ S is denoted by
An example of a toy pre-positioning problem instance with three cities, two facility categories, two commodities and two scenarios is given in Table II and Figure 1. The facility, acquisition and transportation budgets are A=18,000, B=500,000 and C=10,000, respectively. The average speed is 50, and the distances in the two disaster scenarios are:
Toy instance facility and commodity features
| Facility category q | Vq | Aq | Commodity k | Vk | Bk | Ck |
|---|---|---|---|---|---|---|
| 1 (small facility) | 500 | 8,000 | 1 (water) | 2 | 200 | 0.1 |
| 2 (big facility) | 2,000 | 18,000 | 2 (food) | 0.4 | 1,250 | 0.08 |
Note: Toy instance facility categories that might be opened at potential facility locations differ in their volume capacity Vq and opening cost Aq. For the different types of aid that are in demand and might be pre-positioned at open storage facilities, their unit volume Vk, unit acquisition cost Bk and unit transportation cost Ck are given
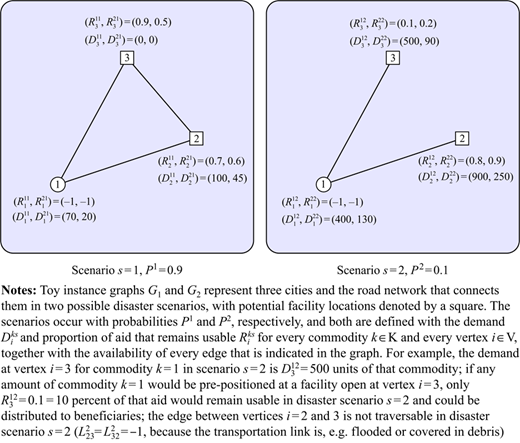
As mentioned earlier, the transportation networks are represented by directed graphs, and we therefore do not impose any restrictions on the symmetry of the distance matrices. If the distance between vertices i ∈ V and j ∈ V, and j ∈ V and i ∈ V is not the same (e.g. if there are multiple one-way roads of different lengths connecting the vertices, and/or one direction is not traversable due to debris or a flood), the distance matrices might be asymmetric.
In this paper, we omit a mathematical formulation of the pre-positioning problem, as there are many different ways to model the problem. The mathematical models can have different objectives (e.g. service, cost, response time, equity), different constraints (e.g. all or a certain percentage of demand must be met, the service must be provided within a given time) and decision variables (e.g. the aid distribution sub-problem can be formulated as a routing, network flow or assignment problem, with or without partial deliveries). For some examples of mathematical models that describe the pre-positioning problem, the reader is referred to any of the articles mentioned in the literature review in Table I.
3. Case studies
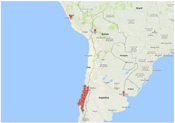
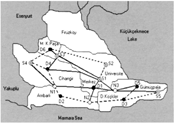
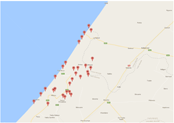
We constructed four case studies starting from the case studies introduced in Barbarosoglu and Arda (2004), Camacho-Vallejo et al. (2015), Rawls and Turnquist (2010) and Tricoire et al. (2012) that focus on disasters of different type and scale that occurred in different parts of the world (Table III). Most of the original case studies were used for post-disaster logistics problems and therefore lack information about the facility and commodity properties. We used reasonable values for these properties to complete the information that is necessary for an instance of the pre-positioning problem, what is explained in greater detail below. From each of the four base case studies, we further generated additional case studies by varying some instance coefficients, obtaining 30 in total. The 30 case studies are available for download from the following webpage, http://antor.uantwerpen.be/prepositioning-problem-instances/, together with the small instance toy-instance-3-2-2-2 shown in Figure 1.
Four case studies focused on disasters of different types and scale that occurred in different parts of the world were used to generate 30 diverse case studies to facilitate further research on humanitarian logistics problems
| case studies | case-study-47-1-4-1 | case-study-14-1-1-9 | case-study-30-1-1-10 | case-study-30-3-3-51 |
|---|---|---|---|---|
Network |
|
|
|
|
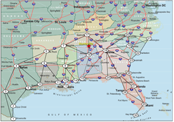
Description Source | Chile 2010 earthquake and tsunami [17] | Turkey 1999 earthquake [9] | Senegal ease study, instance Mboro [75] | US Gulf Coast hurricane threat [62] |
Number of vertices | 47 | 14 | 30 | 30 |
Number of facility categories | 1 | 1 | 1 | 3 |
Number of commodity types | 4 | 1 | 1 | 3 |
Number of scenarios | 1 | 9 | 10 | 51 |
Budgets: | ||||
Budget for facilities | 200,000 | 150,000 | 10,000 | 1,000,000 |
Acquisition budget | 500,000,000 | 1,000,000 | 300,000 | 29,500,000 |
Transportation budget | 50,000,000 | 2,000 | 2,000 | 1,500,000 |
Facilities: | ||||
Category | One category | One category | One category | Small facility |
Medium facility | ||||
Large facility | ||||
Capacity | 100,000 | 3,000 | 2,000 | 1,000 |
- | - | - | 12,000 | |
- | - | - | 22,000 | |
Opening cost | 100,000 | 35,000 | 5,000 | 19,600 |
- | - | - | 188,400 | |
- | - | - | 300,000 | |
Commodities: | ||||
Type | 1 bottle of water or milk | Aid kit | Aid kit | 1 000 gallons of water |
3 meals | - | - | 1 000 meals | |
1 personal product | - | - | medical kit | |
1 medicine unit | - | - | - | |
Unit volume | 0.00143 | 0.1 | 0.2 | 4 |
0.00021 | - | - | 2.3587 | |
0.00025 | - | - | 0.03285 | |
0.00005 | - | - | - | |
Unit acquisition cost | 0.2 | 20 | 30 | 647.7 |
2 | - | - | 5,420 | |
5 | - | - | 140 | |
3 | - | - | - | |
Unit transportation cost | 0.000158571 | 0.02 | 0.005 | 0.3 |
0.000023786 | - | - | 0.04 | |
0.00002775 | - | - | 0.00058 | |
0.00000555 | - | - | - | |
Average speed | 30 | 20 | 50 | 45 |
Summary: | ||||
Network description | There are 44 demand vertices in Chile clustered in groups of close- by villages where facilities cannot be opened and 3 zero demand vertices outside Chile as the only potential facility locations | There are 6 demand vertices where facilities cannot be opened, 5 zero demand vertices that arc potential facility locations and 3 zero demand vertices that are not potential facility locations | All vertices arc demand vertices in every scenario and are all potential facility locations. All scenario hap-pen with equal probability p=0.1 | All vertices arc potential facility locations, and in each scenario a few of them have non-zero demand. |
Expected proportion of aid that remains usable at a potential facility location | 1 | 1 | 1 | 0.97414 |
1 | - | - | 0.97414 | |
1 | - | - | 0.97414 | |
1 | - | - | - | |
Demand at a single vertex in a scenario | [0, 19,772,600] | [0, 21,793] | [2, 9,050] | [0, 9, 495] |
[0, 19,772,600] | - | - | [0. 5,285] | |
[0, 4,519,440] | - | - | [0, 37,751.1] | |
[0, 4,519,440] | - | - | - | |
Expected demand at a vertex in a scenario | 3,181,830 | 10,995.4 | 575.933 | 1,010.12 |
3,181,830 | - | - | 286.816 | |
727,275 | - | - | 2,164.83 | |
727,275 | - | - | - | |
Expected total demand in a scenario | 140,000,000 | 65,972.2 | 17,278 | 4,321.76 |
140,000,000 | - | - | 2,102.12 | |
32,000,100 | - | - | 14,537.2 | |
32,000,100 | - | - | - | |
Expected number of demand vertices in a scenario | 44 | 6 | 30 | 5.74755 |
Expected shortest path distance between 2 vertices | 505.175 | 3.50159 | 33.559 | 1,114.04 |
| case studies | case-study-47-1-4-1 | case-study-14-1-1-9 | case-study-30-1-1-10 | case-study-30-3-3-51 |
|---|---|---|---|---|
Expected shortest path distance between 2 demand vertices | 288.921 | 3.81812 | 33.559 | 515.885 |
Capacity required to store the expected total demand in a scenario | 239,201 | 6,597.23 | 3,455.6 | 22,722.9 |
Facility budget necessary to meet the expected total demand in a scenario | 300,000 | 105,000 | 10,000 | 450,800 |
Acquisition budget necessary to meet the expected total demand in a scenario | 564,002,000 | 1,319,440 | 518,340 | 16,227,900 |
Additional case studies derived | case-study-47-1-4-6_1 | case-study-14-1-1-9 1 | case-study-30-1-1-10_1 | case-study-30-3-3-51 _1 |
case-study-47-1-4-6_2 | case-study-14-1-1-9 2 | case-study-30-1-1-10_2 | case-study-30-3-3-51 _2 | |
case-study-47-1-4-6_3 | case-study-14-1-1-9 3 | case-study-30-1-1-10_3 | case-study-30-3-3-51 _3 | |
case-study-47-1-4-6_4 | case-study-14-1-1-9_4 | case-study-30-1-1-10_4 | case-study-30-3-3-51 _4 | |
case-study-47-2-4-1_1 | case-study-14- 1-1-9_5 | case-study-30-1-1- 10_5 | case-study-30-1-3-51 | |
case-study-47-2-4-1_2 | case-study-30-1-1-10_6 | |||
case-study-47-2-4-6_1 | case-study-30-1-1-10_7 | |||
case-study-47-2-4-6_2 | case-study-30-1-1-10_8 |
For each of the four base case studies, we varied different instance coefficients (in order to construct new instances), rather than following a specific protocol that is the same for every base case. For example, for some base case studies, we vary the budgets and for another the scenario probabilities and/or facility capacities. We do this to give an idea of which parameters would be interesting to vary and how, but without ending up with an overwhelmingly large set of instances (that are often not very different). In this way, the set of 30 case studies can often be directly used as a somewhat balanced experimental setting, as there are number of instance factors that are varied. Deriving rules of thumbs for facility decision making, for instance, using a single case study or even the four base case studies can yield misleading implications, as these decisions might be significantly influenced also by the level of transportation network damage or the relationship between opening costs of different facility categories (which we alternated for some of the case studies in our library).
For the specific purpose of their study, researchers are of course welcome to vary any of the instance coefficients in any way. For example, if one is interested in investigating the influence of different budgets on the pre-disaster planning (similarly to Balcik and Beamon, 2008, see Table I), it is possible to define many different budget levels in a controlled way according to the same protocol for every (base) case study, while keeping the other instance coefficient constant (or alternating some of them, if one is also interested in studying the interactions between the factors).
3.1 Case studies 47-1-4-1
The first group of instances is based on a Chile 2010 magnitude-8.8 earthquake case study introduced in Camacho-Vallejo et al. (2015). In total, 567 people lost their lives, 25 went missing and 2,671,556 people were affected by the disaster (Guha-Sapir). In the original paper, the authors consider a post-disaster multi-modal aid distribution problem, the aid being delivered from 12 countries helping Chile using air, maritime and land transportation modes. We limit our study to a single land transportation mode (Section 2), so that only Lima, La Paz and Buenos Aires in the three neighboring countries Peru, Bolivia and Argentina become the potential facility locations, as we are trying to prepare for disaster in advance. The proportions of aid that remains usable are all set to one at these potential facility locations, as the neighboring countries were not affected by the earthquake. The facility capacity and opening costs are adopted from another case study in (Balcik and Beamon, 2008). The unit volume and transportation costs of the four commodity types are adopted from the original case study, and the commodity unit acquisition costs and average speed are defined to be some reasonable values, as well as the facility and acquisition budget. In the original paper, the objective is to minimize response time such that all demands are met, and therefore we must also set the transportation budget to a reasonable value that allows some demands to be met. The original post-disaster aid distribution study considers the demands to be known, what results in a single scenario. The demands for each region are based on the Richter scale of the earthquake and the level of damage and population size in each region, and are defined by analyzing several sources of information, such as press notes, National Emergency Office, Red Cross, etc. (Camacho-Vallejo et al., 2015).
The latitude and longitude of each vertex were obtained from GPS coordinates (GPS Coordinates, n.d.), and the distance matrix is calculated using the Open Source Routing Machine (Open Source Routing Machine, n.d.). The Open Source Routing machine calculates the shortest path between the vertices (so that every element of the distance matrix is non-negative), and therefore gives no information which vertices are actually connected with an edge. For some purposes, this information might be of interest, and we therefore assume that each vertex is connected with and an edge to its three closest neighbors, redefining the remaining matrix elements to be −1. The network map is created using Ward. The base study case-study-47-1-4-1 results in an instance of the pre-positioning problem with 47 vertices, 1 facility category, 4 commodity types and 1 scenario.
From this base pre-positioning case study case-study-47-1-4-1, we defined additional eight case studies by varying some of the instance coefficients. The first four case studies, case-study-47-1-4-6_1 to case-study-47-1-4-6_4, include additional scenarios with increasing demand (defining the demands in scenarios by varying the demands slightly according to the base scenario is a quite common practice when constructing case studies, e.g. Barbarosoglu and Arda, 2004; Tricoire et al., 2012), decreasing or increasing probabilities, and a total transportation budget that is either the same as the base case study or it is increased. The next two case studies, case-study-47-2-4-1_1 and case-study-47-2-4-1_2, have an additional facility category and a facility budget that is either the same as the base case study or somewhat decreased. The last two case studies, case-study-47-2-4-6_1 and case-study-47-2-4-6_2, have both the additional facility category, decreased facility budget, and additional five scenarios with increasing demand and decreasing or increasing scenario probabilities.
3.2 Case studies 14-1-1-9
The second group of instances is based on a Turkey 1999 magnitude-7.6 earthquake case study introduced in (Barbarosoglu and Arda, 2004). A total of 17,127 people lost their lives and 1,358,953 were affected by the disaster (Guha-Sapir). In the original paper, the authors consider a multi-modal aid distribution problem with stochastic demands. We limit our study to the land transportation mode (Section 2) and consider the same graph with six demand vertices, five supply vertices that become potential facility locations and three transshipment vertices with zero demand where no facility can be opened, but that we kept in order to preserve the network structure. The facility and commodity coefficients are set to reasonable values. Scenario demands and probabilities correspond to the original paper, where the demands of the base scenario are defined using (Erdik and Aydinoglu, 2001), which are then perturbed with certain percentages to define the demands in remaining scenarios (Barbarosoglu and Arda, 2004). Distances are estimated using Google Maps, and, in some scenarios, some edges are destroyed. Budget for opening the facilities is defined so that four out of five facilities can be opened. Acquisition budget is defined so that the amount of pre-positioned aid mentioned in the original paper could be acquired. In the original paper, the objective is to minimize the sum of transportation cost and penalty costs for unmet demand, and therefore the transportation budget is also not a part of the instance information and had to be set to a reasonable value. The base case study case-study-14-1-1-9 results in an instance of the pre-positioning problem with 14 vertices, 1 facility category, 1 commodity type and 9 scenarios.
The additional instances, case-study-14-1-1-9_1 to case-study-14-1-1-9_5, are created from the base pre-positioning case study case-study-14-1-1-9 only by varying the facility, acquisition and transportation budget.
3.3 Case studies 30-1-1-10
The third group of instances is based on a Senegal case study introduced in Tricoire et al. (2012), without the disaster type being explicitly named. The paper describes 32 instances, representing 32 communities that each consists of several villages as demand points, and we take the Mboro community as our case study, removing the depot with zero demand from the list of vertices and considering all remaining demand vertices as potential facility locations. In the original paper, the authors consider the covering tour problem with stochastic demands, and therefore we had to define a number of pre-positioning instance coefficients. The facility capacity is adopted from the original study, and the facility opening cost is set to a reasonable value, as well as the commodity and transportation coefficients and budgets. The scenario probabilities and demands are adopted from the original case study, where the demands are derived from the population size of the vertex, multiplied by an uncertainty factor (a sum or a random baseline term that is common for the whole region, and a correction term that is specific for the given vertex). To define the distance matrices and obtain the network map, we used GPS coordinates (GPS Coordinates, n.d.), Open Source Routing Machine (Open Source Routing Machine, n.d.) and Ward, analogously to the case study in Section 3.1. The base study case-study-30-1-1-10 results in an instance of the pre-positioning problem with 30 vertices, 1 facility category, 1 commodity type and 10 scenarios.
From this base pre-positioning case study, case-study-30-1-1-10, we defined additional eight case studies, case-study-30-1-1-10_1 to case-study-30-1-1-10_8, by decreasing the number of potential facility locations, facility capacity, the proportions of aid that remains usable across scenarios and/or number of traversable edges, and varying facility, acquisition and transportation budget.
3.4 Case studies 30-3-3-51
The fourth group of instances is based on a case study focused on hurricane threat in the Gulf Coast area of the USA introduced in Rawls and Turnquist (2010). The case study is constructed using historical records from a sample of 15 hurricanes, obtained from the National Oceanic and Atmospheric Administration research facility Atlantic Oceanographic and Meteorological Laboratory. Since we adopted the description of the pre-positioning problem from the aforementioned paper, only minor adjustments of the case study were necessary. In the original paper, the objective is to minimize the sum of logistics costs and penalty costs for unmet demand, and therefore the budgets are not a part of instance information. We define the available budgets to be the costs of the solution that the authors obtained in the paper using their heuristic procedure. The base study, case-study-30-3-3-51, results in an instance of the pre-positioning problem with 30 vertices, 3 facility category, 3 commodity types and 51 scenarios.
From this base pre-positioning case study, case-study-30-3-3-51, we defined additional five case studies by varying some instance coefficients. For the first two instances, case-study-30-3-3-51_1 and case-study-30-3-3-51_2, the ratios between facility opening costs are respectively decreased and increased. In the case-study-30-3-3-51_3, the facility and transportation budgets are decreased, while the acquisition budget is increased so that the total budget corresponds to the base case study. The case study case-study-30-3-3-51_4 has a severely damaged transportation network, while the last instance case-study-30-1-3-51 has the same (badly damaged) transportation network, and only the medium facility category is considered.
4. Random instances
In order to further diversify our problem library, we devised an instance generator that returns a random instance random-instance-|V|-|Q|-|K|-|S| for a given number of vertices |V|, facility categories |Q|, commodities |K| and scenarios |S|. For a better readability of this section, we write whenever x is a random number generated from the probability distribution with parameter α. The notation for the probability distributions used is given in Table IV. Since the random instance generator is implemented in C++, Table IV also includes the class templates that were used to draw numbers from different probability distributions.
The discrete and continuous uniform probability distribution are used to generate most of the random instance coefficients
| Notation | ||
|---|---|---|
| Distribution | Discrete uniform distribution | Continuous uniform distribution |
| Parameters | a, b ∈ ℤ | a, b ∈ ℝ |
| Support | x ∈{a, a + 1, a + 2,…,b} | x ∈[a, b] |
| Probability mass/density function | f(x) = (1)/(b − a + 1) | f(x) = (1)/(b − a) |
| C++ class template | std::uniform_int_distribution | std::uniform_real_distribution |
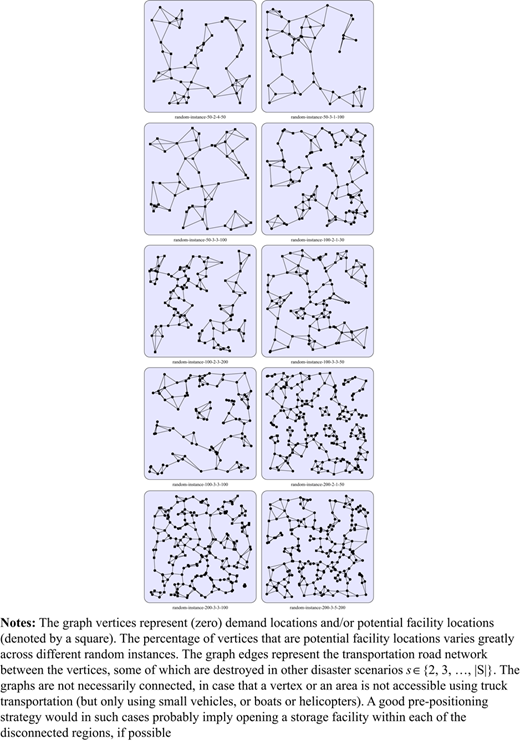
The coordinates of graph vertices i∈{1,2,…,|V|} are random numbers with a random non-zero percentage of random vertices being potential facility locations (Figure 3).
The facility capacities and opening costs are set to some reasonable random values, with the opening costs increasing in a slower fashion than the capacities, due to economies of scale. More precisely, for any facility category q ∈{1, 2,…,|Q|}, we define the capacity and opening costs in the following way:
Guided by the wide range of possible values for the unit volume and acquisition cost in the case studies (Table III), for every commodity type k ∈{1, 2,…,|K|}, we define these parameters in the following way:
Note that the unit acquisition cost Bk is related, but not necessarily directly proportional to the unit volume Vk. Indeed, a commodity unit might represent a bottle of water or a palette of water bottles, and we aim for the unit acquisition cost to reflect this relationship with the unit volume. However, a small medical kit might be much more expensive than a bottle of water, although they can have similar volume. This prompted us to introduce additional randomness in defining the acquisition costs. The unit transportation cost is defined as:
since the authors of the first case study noted that the transportation costs for 30 pallets (1 m3) for 120 km is €400 (yielding 0.111€/m3 per km). The speed is defined to be 30 km/h.
Next we define the demand of each commodity k ∈{1, 2, …, |K|} at every vertex i ∈{1, 2,…, |V|} in every scenario s ∈{1, 2, …, |S|}. The propagation of demand depends greatly on the type of disaster (earthquake, hurricane, flood, drought, wildfire, disease epidemics). Different disaster types have different metrics that can be used to estimate the disaster destructive potential, e.g. hurricane wind speed or the amount of energy radiated by an earthquake. For the purpose of generating diverse random instances, we describe each disaster scenario with disaster magnitude and epicenter. The demands at each vertex will be defined as a function of the magnitude and distance from the epicenter.
We consider scenario s=1 to correspond to no disaster (zero demands and no damages), and therefore define the magnitude to be zero, M1=0. For each disaster scenario s ∈{2, 3,…,|S|}, we define the magnitude as a random number Examples of disaster magnitude are different levels on the Richter earthquake magnitude scale (Richter, 1935), Saffir–Simpson hurricane wind scale (National Hurricane Centre/National Oceanic and Atmospheric Administration) or the U.S. Drought monitor scale (National Centres for Environmental Information/National Oceanic and Atmospheric Administration) that classify hurricanes and droughts into five categories. The epicenter of each disaster scenario s ∈{2,3,…,S|} is a random vertex Not every disaster type has an obvious notion of an epicenter (such as earthquake epicenter or hurricane landfall), but we can consider this to be the vertex that is most severely affected.
The demands can depend on the magnitude and epicenter in a number of different ways. For example, different studies that examine the economic impacts of US hurricanes assume that hurricane loss approximately follows a power–law relationship with maximum wind speed. The power–law order is estimated from historical data on hurricane by many authors and ranges from 4.36 (Howard et al., 1972), 6.5–8 (Bouwer and Wouter Botzen, 2011), 9 (Nordhaus, 2010) or 4–12 (Zhai and Jiang, 2014). Another study (Murnane and Elsner, 2012) suggests an exponential relationship between wind speed and loss. In addition, any of these relationships is specific to the USA, as other regions would have different exposure characteristics, depending on many factors such as precipitation, surface roughness, building construction or population density. A power–law relationship seems to be a reasonable assumption for floods as well (Merz et al., 2010). Moreover, a power–law relationship between expected damage and disaster magnitude is assumed in Hergarten (2004) also for earthquakes, forest fires, rockfalls and landslides. We therefore assume a power–law relationship between the magnitude and demands, allowing the power to vary across scenarios. In some cases, we could also assume an exponential relationship, but we did not find this necessary as the exponential function does not differ greatly from the cubic function on the interval [0, 5] that contains the disaster magnitude Ms.
When it comes to the relationship between demand and the distance from the epicenter is, we assume that the demands decrease exponentially with normalized Euclidean distance from the epicenter:
where Lij is the Euclidean distance from i to j, allowing the rate of exponential growth to vary across scenarios. Hurricane Katrina data on the distance from hurricane landfall and forest damage, summarized in Oswalt and Oswalt (2008), suggests that this is a reasonable assumption.
The demand for commodity k ∈{1, 2,…,K} at vertex i ∈{1, 2,…,V} in scenario s ∈{2, 3,…,|S|} is therefore defined in the following way:
As explained, we assume a power–law relationship with disaster magnitude Ms, and inversely exponential relationship with the normalized distance from the epicenter (Figure 2). The demand is also inversely related to the unit acquisition cost, as we expect the demand for more expensive commodities to be lower, e.g. the demand for pallets of water is lower than the demands for bottles of water, and the demand for medicine kits is lower than the demand for water bottles. With we introduce additional randomness in the definition of demand, to account for unpredictable factors that might influence the demand volume. If i.e. i = is is the epicenter, we define so that the demand at the epicenter is greater than other vertices.
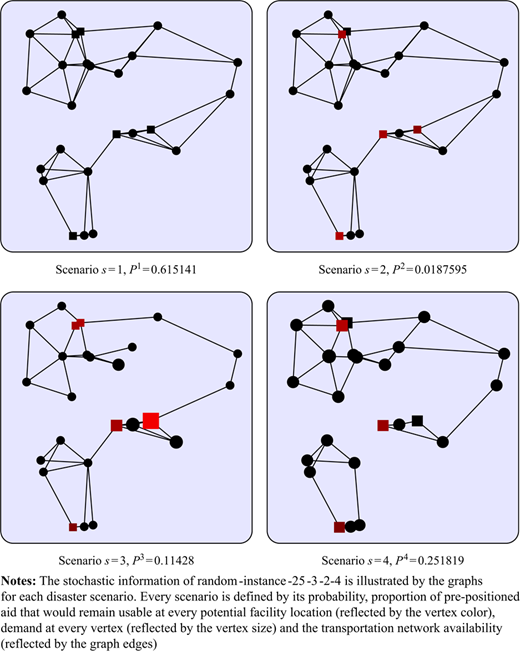
The proportions of commodities k ∈{1, 2,…,|K|} that remain usable at vertices i ∈{1, 2,…,|V|} in scenarios s ∈{2, 3,…,|S|} are defined in a similar way. If a vertex i ∈{1, 2,…, |V|} is not a potential facility location, we define and otherwise (Figure 2):
If the epicenter is a potential facility location, the proportion of each commodity type that remains usable is set to zero,
Scenario probabilities are randomly generated. In every scenario s ∈{1, 2,…,|S|}, we construct an edge between every vertex i ∈{1, 2,…,|V|} and the three vertices that are closest to it, with respect to the Euclidean distance (Figure 3). If there is an edge between vertices i and j, the distance between them is defined as the Euclidean distance, In each disaster scenario s ∈{2, 3,…,|S|}, a random percentage of random edges is destroyed (Figure 2).
To define reasonable budgets, we proceed as follows. We calculate the volume of expected total demand, and the minimum number of only smallest or only largest facilities that would have to be opened to be able to store such demand volume. We set the facility budget A to be a random percentage of the average between the facility costs that are required to open the desired number of only smallest and only largest facilities. If this facility budget is lower than the cost A1 of opening a facility of the smallest category, then we set A = A1. The acquisition budget B is set as a random percentage of the acquisition cost of the expected total demand. To define the transportation budget, we calculate the expected total shortest path average distance between every demand vertex and all vertices that are connected to it. The transportation budget C is set as a random percentage of the cost of transporting the expected total demand for each commodity across the aforementioned distance. The budgets are rounded to the nearest thousand.
On the following webpage, http://antor.uantwerpen.be/prepositioning-problem-instances/, we included ten random instances of different size (Figure 3), together with a small instance random-instance-25-3-2-4 shown in Figure 2. However, the code that generates random instances for any given number of vertices, facility categories, commodity types and scenarios is also available online so that arbitrarily many instances can be constructed, and/or the definition of the instances can be modified.
5. Conclusions, limitations and future work
The growing richness of the literature on the problem of pre-positioning emergency supplies is exciting, since about a decade ago only a few studies focused on the topic, as noted in a recent literature survey on the problem (Balcik et al., 2016). However, the authors acknowledge the lack of a benchmark data set as a formidable impediment of the field that hinders thorough hypothesis testing, sensitivity analyses, model validation or heuristic performance evaluation. The shortage of publicly available problem instances prompts researchers to engage in a time-consuming process of data collection, data conversion, data digitization, calibration and validation to be able to generate a single case study. Despite the invested efforts, the implications that follow from a single case study are obtained without much statistical confidence. The evaluation of different modeling options or solution procedures and the managerial implications derived could even be misleading both for researchers and practitioners. For these reasons, the authors of the survey (Balcik et al., 2016) recommend to create a benchmark data sets to help investigate the implications of considering different problem aspects, objectives and compare solutions of different modeling approaches.
With this work, we have aimed to take the first step in tackling this challenge, by generating a set of diverse pre-positioning problem instances that are readily available to help extensively study the problem of pre-positioning emergency supplies. We have collected four case studies from humanitarian logistics literature and used them as a starting point to generate 30 diverse case studies that focus on disasters of different types that occurred in different parts of the world. In addition, we have introduced a random instance generator that allows to also construct arbitrarily many instances for any number of vertices, facility categories, commodity types and disaster scenarios. The case studies and random instances are available for download from http://antor.uantwerpen.be/prepositioning-problem-instances/.
It is important to note that the applicability of these instances goes beyond the problem of pre-positioning emergency supplies. The instances can be used both for pre- and post-disaster humanitarian logistics, but also for commercial logistics. Researchers may start from a given facility or facility-inventory configurations if these decisions are not a part of the problem, consider each scenario separately if there are no uncertainties, ignore some facility categories or commodity types, or ignore some or all budget limitations if, for example, the objective is to minimize logistics costs.
The available set of instances might be used in many ways. Basically, the problem library could be employed in any of the articles that focus on the pre-positioning (or related) problem and use a case study to validate their findings, which would be made much more reliable if verified on a set of diverse problem instances. For example, the instances can ensure a more thorough evaluation of different modeling decisions, e.g. what is the best choice of the objective function or aid distribution formulation. A recent survey of the pre-positioning problem literature (Balcik et al., 2016) suggests the benchmark data for the problem to be used to investigate whether/how stocking locations and inventory amounts are affected by different equity objectives (for an overview of equity measurements that aim to ensure fair distribution of aid among different demand locations, see (Marsh and Schilling, 1994)). Moreover, they propose to use the data to study whether there are some aspects (such as capacitated facilities, multiple commodity types, variable lead time or different cost items) that are essential in determining pre-positioned inventory levels for humanitarian operations, and whether standard problems can be defined for different disaster types.
Another obvious application of our problem library is algorithmic design and evaluation. Since most of the humanitarian logistics problems become intractable for exact methods for any instances of reasonable size, many authors introduced in their work a heuristic procedure to solve the problem. The diverse instances we have constructed can help the researchers to design robust heuristics (and not over-fitted to a single case study) and can allow for a more fair comparison of available solution procedures.
The problem library can also be used to derive some rules of thumb for disaster management through sensitivity analyses on different instance parameters. For example, one can investigate how the demand network topology and/or the level of transportation network damage affects the number and location of storage facilities to be open. Different types of findings in the literature (Table I) can now be investigated with a more comprehensive and balanced experimental setting that employs a set of test problems with various properties, rather than a single case study. These findings can then be used to guide the emergency strategy planning in case of a new disaster. For instance, in Balcik and Beamon (2008) and Barzinpour and Esmaeili (2014), the authors investigate the impact of the pre- and post-disaster budgets, or the impact of collaboration between neighboring local areas, on the quality of emergency strategy. Since the findings of these studies are based on a single case study, it is unclear if the same behavior would be exhibited for other problem instances, and, consequently, if the implications of the study could be applied in case of a new disaster. The statistical significance of the obtained results would be increased if a problem library describing a number of disasters of different types and with different instance parameters would have been employed. If the conclusions would be verified using a number of diverse problem instances, they could be translated into a more trustworthy and reliable general policy recommendations to be used in future emergency planning. If, however, different problem instances would exhibit different patterns, further analysis could help identify rules of thumb for different cases. In the aforementioned example of studying the impact of budgets on the quality of an emergency plan, it might be shown that different budgets are the most restrictive for different types of instances (e.g. depending on the network topology, facility capacities or relationship between other instance parameters), what can help guide fund-raising efforts in cases of new disasters.
To the best of our knowledge, this paper is the first attempt to create a public set of benchmark instances for humanitarian logistics problems. Although the instances can be used for a wide range of problems next to the pre-positioning of emergency supplies, they are at the same time limited by a number of underlying assumptions. As mentioned in Section 2, we adopt the pre-positioning problem definition introduced in Rawls and Turnquist (2010) (which has become the most standard formulation in the literature), which means that the instances cannot be immediately employed, e.g. for a multi-echelon, multi-period or a multi-transportation mode (pre-positioning) problem, or an integrated evacuation and aid distribution problem. The demands for aid in the instances we have generated are given across different disaster scenarios, so that the instances cannot directly be used if robust programming would have been chosen to approach a problem. However, researchers need to invest only limited effort to adapt the available instances to the specific assumptions of the problem at hand (and thus construct a data set for that problem), most often significantly less than our adaptation of the acquired case studies for other problems to the base case studies for the pre-positioning problem in Section 3. For example, in order to consider different modes of transportation, the user would only have to define the distance matrices for the remaining modes (probably using some online service, similarly to what we did to obtain the distances for land transportation in Sections 3.1 and 3.3), but the remainder of the instance information could remain unchanged (e.g. the rich data on the demand for each commodity at each vertex in every disaster scenario).
Another limitation of our problem library is that it is based on only four base case studies that we managed to assemble from the literature. This has prompted us to implement a random instance generator that constructs arbitrarily many instances of any size, which implements some research about the demand propagation for different types of disasters. However, we invite researchers to enrich the existing database with the case studies they introduced in their earlier or current work. We praise the efforts of academics who have consulted a number of data sources to construct a case study for the purpose of their studies, but we appeal to them to also share this data (in an accessible, easy-to-read format), what we hope becomes the norm in the humanitarian domain. Next to introducing a set of instances that can be directly used for studying a variety of problems, our aim has been precisely to spark further development of a set of standard problem instances for the field of humanitarian logistics.
The authors thank the authors that kindly provided the authors with the case studies introduced in their publications that inspired the generation of 30 case studies the authors introduced in this paper. The authors are also indebted to the Interuniversity Attraction Poles (IAP) Program on Combinatorial Optimization: Metaheuristics and Exact Methods (COMEX), initiated and funded by the Belgian Science Policy Office (BELSPO), for their financial support for this research.

