


Caesarean section (CS) is being used as a life-saving surgical tool when complications arise in the process of childbirth. CS rates have dramatically increased across the world, especially in recent decades. In this background, the purpose of this paper is to explore the CS rates and its determinants in Karnataka, India.
The study uses multiple rounds of the District Level Household Survey (DLHS) data to show the trends, differentials and determinants in CS deliveries. Both bivariate and multivariate analyses have been carried out, and the χ2 test and logistic regression models were applied.
Result shows a sharp increase in CS rates across Karnataka; further, this is high and reaches an alarming level in southern parts of the state. Along with a huge rural–urban difference, significant biological and socio-economic differences were observed. Further, a very dramatic increase in the CS rate was observed in private health facilities, whereas it was stagnant or even decreased in public health facilities during recent years. Mothers age at birth, birth weight, birth order, multiple births, birth institution and place of residence were significantly associated with CS delivery. Unlike these biological factors, the social-economic factors like maternal education, caste, religion and below poverty line household were not found to be significant in determining CS deliveries.
A strong policy to address the dramatic increase in CS deliveries is the need of the hour. Further, there should be a proper mechanism at national, state and sub-state level to provide appropriate checks and monitoring for CS deliveries which are unnecessary.
Introduction
Globally, approximately 287,000 maternal and 2.9m neonatal deaths are reported annually. Access to extensive emergency obstetric care, including caesarean section (CS), is a vital key to reducing these deaths[1, 2]. However, in spite of being a life-saving surgical tool when complications arise in the process of childbirth, the CS is a major surgical procedure and is associated with immediate maternal and perinatal risks and may have long-term effects and implications for future pregnancies[3–6].
Though the proportion of CS births is considered to be an important indicator of emergency obstetric care[7, 8], there is an ongoing debate on how to quantify the need for life-saving obstetric surgery. The World Health Organization’s (WHO) 1992 reports suggested that “a figure below 5 percent implies that a substantial proportion of women do not have access to surgical obstetric care; on the other hand a rate higher than 15 percent indicates overutilization of the procedure for other than life-saving reasons”[9]. Further, WHO advises that births by CS should only be performed when medically necessary, and does not recommend a target rate for countries to achieve at the population level[10].
In spite of the paucity of proof supporting substantial maternal and perinatal benefits following a CS, there has been a dramatic increase in the use of CSs across the world, particularly in middle and high-income countries. Some investigations have even demonstrated a connection between increasing CS rates and poorer outcomes[11, 12]. Further, studies documented that changes in maternal characteristics and professional practice styles, increasing malpractice pressure, as well as economic, organizational, social and cultural factors have all contributed to this trend[13–16].
The prevalence of CS rates, in recent years, has increased to a record level of 46 percent in China and 25 percent and above in many Asian countries, Latin America and the USA[9]. Studies also estimated that many developing countries (e.g. China, Nigeria, Bangladesh, etc.)[17–19] have recorded a rapid increase in CS birth in the past two decades, indicating that the increasing trend of CS rates is not limited to the middle- and high-income countries and India is following the same trend[20–24].
The rate of SC deliveries in India has increased nearly sixfold, from 3 percent in 1992[20] to 10 percent in 2005[25], and 17 percent in 2016[26]. Many Indian states, especially the southern states, have a higher proportion of CS deliveries than the national average. Earlier studies have estimated CS rates at the national and state level revealing interstate differences, but studies exploring variations within the state of Karnataka is limited. Within Karnataka, variations in CS rates may be expected as the vast inequality in all aspects, including demographic and socio-economic, was reported between southern and northern parts of the state.
The present study seeks to examine the level and trend of CS deliveries in Karnataka (a state in the southern region of India) and its districts (local administrative units, immediately below that of India’s sub-national States and Territories). It also tries to identify various factors associated with caesarean delivery in the context of Karnataka. Hence, the study focuses on two specific objectives: first, to estimate the levels and trends of CS rates at the district level, and, second, to identify various factors associated with CS deliveries in the context of Karnataka.
Methodology
Data
The present study utilized multiple data sets from the District Level Household Survey (DLHS). The DLHS is a large-scale, multi-round survey conducted in a representative sample of households throughout India. Four rounds of DLHS have been undertaken by the Ministry of Health and Family Welfare, Government of India in the past (Round-I in 1998–1999, Round-II in 2002–2004, Round-III in 2007–2008 and Round-IV in 2012–2013). The basic aim of DLHS-3 was to provide reliable estimates of maternal and child health, family planning and other reproductive health indicators at the district level[24,27]. Three different time periods of data, DLHS-2 (2002–2004), DLHS-3 (2007–2008) and DLHS-4 (2012–2013) were used to show the level and trend of CS deliveries in Karnataka. Further, the DLHS-4 (2012–2013) data are used to show the differentials and determinants of CS deliveries in Karnataka. The DLHS-4 data used a multi-stage stratified systematic sampling design. The details of the sampling procedure are available in the DLHS reports[23–25, 27].
The analysis is based on information regarding the latest birth of women who are or were married aged 15–49 years, who had given birth (both live and stillbirth) and reported the type of delivery. Though it is obvious that CS is an institutional procedure, the analysis is done on “all births” and “institutional births” because it is important to know the levels of cesarean births among all births.
Dependent variables
The type of delivery was the dependent variable and it was taken to be dichotomous in nature and coded by the value “1” (one) if the respondents underwent caesarean deliveries and “0” (zero) if not.
Independent variables
We have considered a range of biological, socio-economic and demographic predictors such as place of residence, woman’s age at birth, birth weight, birth order, multiple births, institution (place of birth), mother’s education, caste, religion and below poverty line (BPL) cardholder status. Existing literature on maternal care supported the selection of these independent variables, and for the analysis of data, the variables were categorized as follows:
place of residence: rural and urban;
age of woman at birth: ⩽19 year, 20–24 years, 25–29 years, 30 and above years;
birth weight: <3 kg, ⩾3 kg;
birth order: first, second and third or more;
multiple births: no, yes;
institution: public, private, others;
mother’s education: no schooling, primary, middle, secondary, college level;
caste: scheduled castes (SCs), scheduled tribes (STs), other backward classes (OBCs) and others;
religion: Hindu, Muslim, others; and
BPL cardholder: yes, no.
Statistical analysis
Both bivariate and multivariate analyses were conducted to identify factors associated with CS deliveries. First, bivariate analysis was performed to find significant associations between dependents, in this case, caesarean vs non-caesarean delivery type, and independent variables using the χ2 test of significance. Second, binary logistic regression was applied to understand the net effect of predictor variables on the CS deliveries. We have chosen logistic regression models because the response variable in the present analyses is of a dichotomous (i.e. binary) nature. In brief, to determine the risk factors, Yi denotes a binary variable that equals “1” (one) with probability P if the respondents undergo caesarean deliveries and “0” (zero) with probability 1−P otherwise.
All the predictor variables considered for bivariate analysis were found significant in the χ2 test and included in the final binary logistic regression model. For all the statistical tests, p-values of <0.001, <0.01 and <0.05 were considered for statistical significance, and the results of logistic regression are presented in the form of estimated odds-ratios with p-values and 95% confidence intervals. All the analyses in this study were carried out using the statistical software STATA version 13[28].
Ethics statement
The study uses an anonymous survey data set available for academic use with no information on the identities of survey participants, so ethical approval is not required. The survey data used in this study can be obtained upon request for academic use on the official website (www.iipsindia.org) of The International Institute for Population Sciences, Mumbai (India)[24, 27, 29].
Results
Profile of the respondents
Table I presents the weighted percentage distribution of women who have delivered their last child since January 1, 2008 by selected background characteristics. Around, 61 percent of mothers are from rural areas. The majority of mothers (87.5 percent) had given birth after 19 years of age. Children born to half of the mothers weighed less than 3 kg at birth and about 36 percent of mothers were first parity mothers. Around half of the mothers gave birth in public health facilities.
Percent distribution of women who gave birth during the five years preceding the survey, Karnataka, DLHS-4, 2012–2013
| Characteristics | Total births (n) | % |
|---|---|---|
| Residence | ||
| Rural | 7,614 | 61.0 |
| Urban | 4,892 | 39.0 |
| Age of woman at birth (yrs) | ||
| ⩽19 | 1,576 | 12.5 |
| 20–24 | 5,869 | 47.0 |
| 25–29 | 3,689 | 29.6 |
| ⩾30 | 1,370 | 10.9 |
| Birth weight (kg) | ||
| <3 | 5,367 | 48.1 |
| ⩾3 | 5,775 | 51.9 |
| Birth order | ||
| First | 4,499 | 36.1 |
| Second | 4,593 | 37.0 |
| Three or more | 3,322 | 26.8 |
| Multiple births | ||
| No | 12,379 | 99.0 |
| Yes | 125 | 1.0 |
| Institution | ||
| Public | 6,505 | 52.0 |
| Private | 4,617 | 36.9 |
| Others | 1,383 | 11.1 |
| Maternal education | ||
| No schooling | 2,577 | 20.9 |
| Primary | 2,551 | 20.5 |
| Middle | 1,871 | 15.0 |
| Secondary | 2,840 | 22.6 |
| College level | 2,636 | 21.0 |
| Castea | ||
| SCs | 2,461 | 20.9 |
| STs | 1,304 | 11.1 |
| OBCs | 6,376 | 53.4 |
| Others | 1,748 | 14.6 |
| Religion | ||
| Hindu | 10,039 | 80.4 |
| Muslim | 2,247 | 17.8 |
| Others | 216 | 1.7 |
| BPL cardholderb | ||
| Yes | 8,089 | 64.6 |
| No | 4,411 | 35.4 |
| Total | 12,506 | 100 |
Notes: n = un-weighted cases, figures may not add up to total due to missing cases; data are weighted using sampling weights provided by the DLHS 4th round. aThe scheduled castes (SCs) and scheduled tribes (STs) are the official designations given to various groups of historically marginalized people, recognized in the Constitution of India: in the British era, they were known as the depressed classes, while in present days, the SCs and STs are sometimes referred to as “Dalits” and “Adivasis” (i.e. traditional forest dwellers), respectively, and the SCs comprise about 16.6 percent and STs 8.6 percent of India’s population[29]; bBPL is below poverty line. OBCs represent other backward classes
Source: Computed from unit level data of DLHS-4
Further, about 21 percent of mothers were illiterate and the majority (80 percent) of them was Hindu. Among social groups, 53.4 percent of mothers belonged to OBCs followed by SCs (21 percent), STs (11 percent) and the rest belong to others (15 percent). The proportion of mothers belonging to the below poverty line (BPL) family was about 64.6 percent.
Trends in caesarean deliveries
This paper attempts to explore the trends in CS delivery in Karnataka over the past ten years based on the DLHS data sets for three consecutive rounds. Figures 1 and 2 present the trends in CS deliveries in Karnataka for the periods 2002–2004 to 2012–2013.
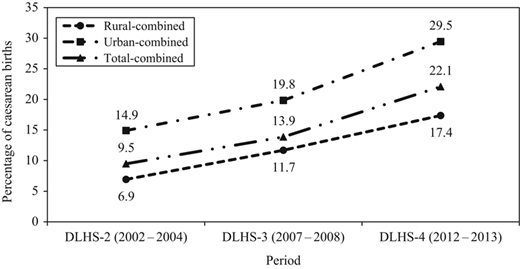
Prevalence (in percentage) of caesarean section delivery “for all births” from 2002 to 2004, 2007 to 2008 and 2012 to 2013, Karnataka
Prevalence (in percentage) of caesarean section delivery “for all births” from 2002 to 2004, 2007 to 2008 and 2012 to 2013, Karnataka
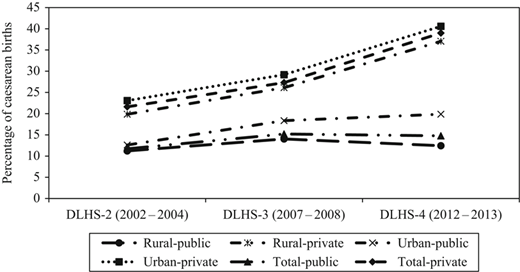
Prevalence (in percentage) of caesarean section delivery “for institutional births” from 2002 to 2004, 2007 to 2008 and 2012 to 2013, Karnataka
Prevalence (in percentage) of caesarean section delivery “for institutional births” from 2002 to 2004, 2007 to 2008 and 2012 to 2013, Karnataka
At the state level, the rate has increased from 9.5 percent of the childbirth in 2002–2004 to 13.9 in 2007–2008 and further to 22.1 percent in 2012–2013, indicating that during the DLHS-2 and DLHS-3, the average proportion of CS deliveries at the state level was well below the stipulated level of 15 percent compared to DLHS-4, which saw a very sharp increase. Interestingly, the increase in CS deliveries was observed among both rural as well as urban women, but whilst this increase is linear among rural women, there is a sharp increase amongst urban women, especially during 2007–2008 and 2012–2013 (Figure 1).
Similarly, Figure 2 presents the trends for public and private health facilities “for institutional births” only. The results show that unlike the overall percentage of CS deliveries shown in Figure 1, the increase was only observed in private health facilities, whereas this proportion was stagnant or even decreased in public health facilities during the third and fourth round of DLHS survey. The decrease of around 2 percent has been recorded only among rural women giving birth in public health facilities during 2007–2008 and 2012–2013. Otherwise, all results show an increase in trends for private health facilities with a widening gap between the proportion of deliveries in public and private health facilities.
The trend in CS delivery at the district level is shown in Table II. There is a significant increase in the percentage of birth by CS in many districts in Karnataka. At the state level, the proportion of CS has raised from 9.5 percent DLHS-2 to 22.1 percent in DLHS-4, an increase of around 13 percent. The difference in CS delivery from DLHS-2 to DLHS-4 is relatively high in districts like Chikmagalur, Bangalore Rural, Hassan, Tumkur, Chitradurga and Chamarajanagar.
Prevalence (in percentage) of women who had undergone a caesarean section delivery by district, from DLHS-2, DLHS-3 and DLHS-4
| Percentage of women who have a caesarean delivery | ||||
|---|---|---|---|---|
| District | DLHS-2 (2002–2004) | DLHS-3 (2007–2008) | DLHS-4 (2012–2013) | Difference between DLHS-2 and 4 |
| Belgaum | 6.1 | 13.0 | 16.9 | 10.8 |
| Bagalkot | 5.9 | 10.1 | 16.3 | 10.4 |
| Bijapur | 6.1 | 6.3 | 14.5 | 8.4 |
| Gulbarga | 4.0 | 6.8 | 13.6 | 9.7 |
| Bidar | 8.6 | 9.3 | 12.0 | 3.4 |
| Raichur | 2.5 | 8.8 | 14.3 | 11.8 |
| Koppal | 4.3 | 6.0 | 14.0 | 9.7 |
| Gadag | 6.5 | 9.9 | 17.5 | 11.0 |
| Dharwad | 13.9 | 12.1 | 20.0 | 6.1 |
| Uttara Kannada | 8.6 | 17.0 | 23.2 | 14.6 |
| Haveri | 8.3 | 9.3 | 18.6 | 10.3 |
| Bellary | 6.5 | 8.0 | 17.5 | 11.0 |
| Chitradurga | 6.7 | 14.9 | 25.6 | 18.9 |
| Davanagere | 13.1 | 17.8 | 28.5 | 15.5 |
| Shimoga | 21.4 | 20.2 | 29.6 | 8.3 |
| Udupi | 14.3 | 26.6 | 29.0 | 14.6 |
| Chikmagalur | 17.0 | 26.6 | 43.9 | 26.9 |
| Tumkur | 17.7 | 17.8 | 36.8 | 19.2 |
| Kolar | 11.4 | 11.5 | 25.3 | 13.9 |
| Bangalore Urban | 21.2 | 32.1 | 31.8 | 10.7 |
| Bangalore Rural | 9.0 | 18.4 | 35.2 | 26.2 |
| Mandya | 11.6 | 16.5 | 26.5 | 14.9 |
| Hassan | 10.9 | 19.1 | 35.0 | 24.2 |
| Dakshina Kannada | 13.3 | 20.0 | 25.8 | 12.5 |
| Kodagu | 12.8 | 12.9 | 30.0 | 17.2 |
| Mysore | 6.9 | 18.8 | 22.1 | 15.2 |
| Chamarajanagar | 6.5 | 16.8 | 24.8 | 18.3 |
| Ramanagara | na | na | 31.4 | na |
| Chikballapura | na | na | 28.2 | na |
| Yadgir | na | na | 9.3 | na |
| Karnataka | 9.5 | 13.9 | 22.1 | 12.6 |
Note: na, not applicable, because the three districts were newly created: Ramanagara from Bangalore Rural, Chikballapur from Kolar and Yadgir from Gulbarga district
Source: Computed from unit level data of DLHS-4
Caesarean deliveries by background characteristics
A combination of biological, demographic, socio-economic and institutional factors determines the rate of CS delivery in any region.
Table III presents the prevalence of CS deliveries by various socio-demographic and biological factors. Results show that 29.5 percent of urban area mothers underwent CS deliveries compared to 17.4 percent of mothers residing in rural areas. A positive association of CS delivery and age of mother at birth were observed; as age increases, the prevalence of CS deliveries also increases, around 17 percent of women who are in the age group of 19 years or less at the time of birth and underwent a CS delivery compared to 29 percent of women in the age group of 30 years or more. The higher prevalence of CS was observed among the women whose baby weighted 3 kg or more at birth.
Prevalence (in percentage) of caesarean deliveries by selected background characteristics, Karnataka, DLHS-4, 2012–2013
| Type of delivery | ||||
|---|---|---|---|---|
| Characteristics | Normal | Caesarean | p-valuec | Total births (n) |
| Residence | ||||
| Rural | 82.6 | 17.4 | <0.001 | 7,614 |
| Urban | 70.5 | 29.5 | 4,892 | |
| Age of woman at birth (yrs) | ||||
| ⩽19 | 83.1 | 16.9 | <0.001 | 1,576 |
| 20–24 | 80.5 | 19.5 | 5,869 | |
| 25–29 | 74.2 | 25.8 | 3,689 | |
| ⩾30 | 70.8 | 29.2 | 1,370 | |
| Birth weight (kg) | ||||
| <3 | 76.5 | 23.5 | 0.030 | 5,367 |
| ⩾3 | 74.9 | 25.1 | 5,775 | |
| Birth order | ||||
| First | 69.3 | 30.7 | <0.001 | 4,499 |
| Second | 77.4 | 22.6 | 4,593 | |
| Third or more | 90.2 | 9.8 | 3,322 | |
| Multiple births | ||||
| No | 78.1 | 21.9 | <0.001 | 12,379 |
| Yes | 56.7 | 43.3 | 125 | |
| Institution | ||||
| Public | 85.2 | 14.8 | <0.001 | 6,505 |
| Private | 61.0 | 39.0 | 4,617 | |
| Others | 99.9 | 0.1 | 1,383 | |
| Maternal education | ||||
| No schooling | 91.5 | 8.5 | <0.001 | 2,577 |
| Primary | 83.8 | 16.2 | 2,551 | |
| Middle | 79.9 | 20.1 | 1,871 | |
| Secondary | 73.1 | 26.9 | 2,840 | |
| College level | 62.3 | 37.7 | 2,636 | |
| Castea | ||||
| SCs | 83.9 | 16.1 | <0.001 | 2,461 |
| STs | 84.6 | 15.4 | 1,304 | |
| OBCs | 76.5 | 23.5 | 6,376 | |
| others | 70.5 | 29.5 | 1,748 | |
| Religion | ||||
| Hindu | 78.3 | 21.7 | 0.016 | 10,039 |
| Muslim | 77.0 | 23.0 | 2,247 | |
| Others | 69.8 | 30.2 | 216 | |
| BPL cardholderb | ||||
| Yes | 80.6 | 19.4 | <0.001 | 8,089 |
| No | 73.0 | 27.0 | 4,411 | |
| State average | 77.9 | 22.1 | 12,506 | |
Notes: n = un-weighted cases, figures may not add up to total due to missing cases; all data are weighted using sampling weights provided by the DLHS 4th round. aThe scheduled castes (SCs) and scheduled tribes (STs) are the official designations given to various groups of historically marginalized people, recognized in the Constitution of India: in the British era, they were known as the depressed classes, while in present days, the SCs and STs are sometimes referred to as “Dalits” and “Adivasis” (i.e. traditional forest dwellers), respectively, and the SCs comprise about 16.6 percent and STs 8.6 percent of India’s population[29]; bBPL is below poverty line; cp-value represents the significance level estimated from the χ2 test. OBCs represent other backward classes
Source: Computed from unit level data of DLHS-4
CS delivery rates were also significantly higher for first-order birth than subsequent births; three in every ten deliveries with the first order of birth were by CS delivery compared to one in every ten deliveries with a third or higher order of births. CS rates were significantly higher for women having multiple births at 43 percent compared to 22 percent for single births. Similarly, CS rates were higher in private institutional deliveries; it is found that while only 14.8 percent of women have undergone CS in public medical institutions, the figure is more than double (39 percent) in cases of private healthcare institutions. Further, women from the SC and ST community categories had lower CS rates than that of the OBCs and other higher caste women. Similarly, women from BPL households had lower CS rates than that of non-BPL households (Table III).
Logistic regression results; likelihood estimates of caesarean deliveries
Furthermore, to examine the statistical significance of independent variables such as demographic and socio-economic characteristics on the preference of CS delivery, a logistic regression model was applied and the results are presented in Table IV. The results show that even after controlling for the effect of background characteristics, individual-level risk factors are the most significant variables that predict CS deliveries.
Logistic regression results; likelihood estimates of caesarean deliveries for “all births” in Karnataka, DLHS-4, 2012–2013
| Characteristics | OR | SE | 95% CI |
|---|---|---|---|
| Residence | |||
| Rural [ref.] | 1 | ||
| Urban | 1.141* | 0.065 | [1.020, 1.275] |
| Age of woman at birth (yrs) | |||
| ⩽19 [ref.] | 1 | ||
| 20–24 | 1.182 | 0.106 | [0.991, 1.409] |
| 25–29 | 1.777*** | 0.172 | [1.469, 2.148] |
| ⩾30 | 2.436*** | 0.287 | [1.934, 3.068] |
| Birth weight (kg) | |||
| <3 [ref.] | 1 | ||
| ⩾3 | 1.139** | 0.060 | [1.028, 1.262] |
| Birth order | |||
| First [ref.] | 1 | ||
| Second | 0.648*** | 0.038 | [0.577, 0.726] |
| Third or more | 0.326*** | 0.029 | [0.274, 0.388] |
| Multiple births | |||
| No [ref.] | 1 | ||
| Yes | 3.079*** | 0.747 | [1.913, 4.954] |
| Institution | |||
| Public [ref.] | 1 | ||
| Private | 2.694*** | 0.152 | [2.411, 3.010] |
| Maternal education | |||
| No schooling [ref.] | 1 | ||
| Primary | 1.714 | 1.132 | [0.469, 6.258] |
| Middle | 2.006 | 1.326 | [0.549, 7.328] |
| Secondary | 2.302 | 1.519 | [0.632, 8.388] |
| College level | 2.441 | 1.611 | [0.669, 8.899] |
| Castea | |||
| SCs [ref.] | 1 | ||
| STs | 1.075 | 0.125 | [0.856, 1.351] |
| OBCs | 1.056 | 0.081 | [0.908, 1.228] |
| Others | 1.164 | 0.107 | [0.971, 1.395] |
| Religion | |||
| Hindu [ref.] | 1 | ||
| Muslim | 0.918 | 0.069 | [0.793, 1.064] |
| Others | 0.899 | 0.160 | [0.634, 1.275] |
| BPL cardholderb | |||
| Yes [ref.] | 1 | ||
| No | 0.926 | 0.052 | [0.829, 1.035] |
Notes: n = 8,301. aThe scheduled castes (SCs) and scheduled tribes (STs) are the official designations given to various groups of historically marginalized people, recognized in the Constitution of India: in the British era, they were known as the depressed classes, while in present days, the SCs and STs are sometimes referred to as “Dalits” and “Adivasis” (i.e. traditional forest dwellers), respectively, and the SCs comprise about 16.6 percent and STs 8.6 percent of India’s population[29]; bBPL is below poverty line. OBCs represents other backward classes. CI, confidence interval; OR, odds ratio; [ref.], reference category. Log-likelihood = −4,456.328; Pseudo R2 = 0.0925; constant = 0.09. *p<0.05; **p<0.01; ***p<0.001
Source: Computed from unit level data of DLHS-4
Birth weight and birth order are two other significant factors that determine the chance of CS deliveries. The odds of Caesarean deliveries are significantly higher among mothers whose baby weighted 3 kg or more at birth than their counterpart.
The odds of having a CS delivery for women who had multiple births are three times higher than for women who did not have multiple births. Similarly, deliveries in private health institutions are also nearly three times more likely to be performed by CS than at public health institutions (Table IV).
Biological risk factors and social factors, such as maternal education, caste, religion and BPL cardholder status, were not found to be significant in determining CS deliveries (Table IV).
Further, to examine the caesarean delivery with associated risk factors by type of health facilities, separate models were constructed for deliveries in private and public hospitals with estimates based on only “institutional births” and presented in Table V.
Logistic regression results; likelihood estimates of caesarean deliveries for “institutional births” in Karnataka, DLHS-4, 2012–2013
| Public hospital | Private hospital | |||||
|---|---|---|---|---|---|---|
| Characteristics | OR | SE | 95% CI | OR | SE | 95% CI |
| Residence | ||||||
| Rural [ref.] | 1 | 1 | ||||
| Urban | 1.431*** | 0.125 | [1.205, 1.699] | 0.979 | 0.073 | [0.847, 1.132] |
| Age of woman at birth (yrs) | ||||||
| ⩽19 [ref.] | 1 | 1 | ||||
| 20–24 | 1.409** | 0.184 | [1.091, 1.820] | 0.980 | 0.126 | [0.761, 1.261] |
| 25–29 | 2.374*** | 0.342 | [1.791, 3.147] | 1.379* | 0.187 | [1.057, 1.798] |
| ⩾30 | 3.733*** | 0.695 | [2.592, 5.378] | 1.763*** | 0.277 | [1.296, 2.398] |
| Birth weight (kg) | ||||||
| <3 [ref.] | 1 | 1 | ||||
| ⩾3 | 1.239** | 0.101 | [1.055, 1.455] | 1.096 | 0.075 | [0.959, 1.253] |
| Birth order | ||||||
| First [ref.] | 1 | 1 | ||||
| Second | 0.563*** | 0.051 | [0.471, 0.672] | 0.722*** | 0.056 | [0.621, 0.840] |
| Third or more | 0.229*** | 0.034 | [0.171, 0.305] | 0.416*** | 0.047 | [0.334, 0.519] |
| Multiple births | ||||||
| No [ref.] | 1 | 1 | ||||
| Yes | 1.921 | 0.987 | [0.702, 5.258] | 3.469*** | 1.028 | [1.941, 6.202] |
| Maternal education | ||||||
| No schooling [ref.] | 1 | 1 | ||||
| Primary | 0.914 | 0.701 | [0.203, 4.109] | 4.43 | 5.648 | [0.364, 53.892] |
| Middle | 1.079 | 0.829 | [0.239, 4.864] | 5.069 | 6.462 | [0.417, 61.670] |
| Secondary | 1.352 | 1.036 | [0.301, 6.068] | 5.270 | 6.710 | [0.435, 63.909] |
| College level | 1.466 | 1.126 | [0.325, 6.605] | 5.973 | 7.605 | [0.493, 72.422] |
| Castea | ||||||
| SC [ref.] | 1 | 1 | ||||
| ST | 1.042 | 0.167 | [0.760, 1.427] | 1.132 | 0.201 | [0.800, 1.602] |
| OBC | 1.171 | 0.131 | [0.940, 1.458] | 0.915 | 0.100 | [0.739, 1.133] |
| Others | 1.341* | 0.189 | [1.016, 1.769] | 1.007 | 0.126 | [0.788, 1.287] |
| Religion | ||||||
| Hindu [ref.] | 1 | 1 | ||||
| Muslim | 0.990 | 0.121 | [0.780, 1.258] | 0.869 | 0.082 | [0.722, 1.046] |
| Others | 1.134 | 0.400 | [0.568, 2.266] | 0.854 | 0.173 | [0.574, 1.271] |
| BPL cardholderb | ||||||
| Yes [ref.] | 1 | 1 | ||||
| No | 0.955 | 0.088 | [0.798, 1.143] | 0.943 | 0.068 | [0.819, 1.086] |
| Constant | 0.115** | 0.146 | ||||
| Log-likelihood | −1,948.44 | −2,480.66 | ||||
Notes: CI, confidence interval; OR, odds ratio; [ref.], reference category. aThe scheduled castes (SCs) and scheduled tribes (STs) are the official designations given to various groups of historically marginalized people, recognized in the Constitution of India: in the British era, they were known as the depressed classes, while in present days, the SCs and STs are sometimes referred to as “Dalits” and “Adivasis” (i.e. traditional forest dwellers), respectively, and the SCs comprise about 16.6 percent and STs 8.6 percent of India’s population[29]; bBPL is below poverty line. OBCs represent other backward classes. *p<0.05; **p<0.01; ***p<0.001
Source: Computed from unit level data of DLHS-4
Discussion
Increasing CS rates
Increased institutional deliveries and access to comprehensive obstetric care have resulted in a steady increase in the CS rates across the globe resulting in extensive debates[16, 30–33]. Based on the study results, it can be observed that the CS rates of 9.5 percent in 2002–2004 have increased to 22 percent in 2012–2013. Research reveals that this is a universal trend confirmed by other studies[7, 34, 35]. Very recent analysis shows a 12 percent increase of global average CS rates between 1990 and 2014 with an average annual rate of increase of 4.4 percent[36].
A higher proportion of CS rates in private health facilities
Further, based on the research results, the differences in the CS rate between public (15 percent) and private (39 percent) health facilities conform the findings of other studies. Similarly, a study using the second round of National Family Health Survey data estimated the odds of CS was about 1.7 times more likely to occur in private health facilities[37]. Similarly, another recent study based on the Annual Health Survey data, found the median CS rates of 28 and 5 percent in private and public health facilities, respectively[38]. Further, another study strongly argued that the increased CS rates may in part be driven by the private sector, and also suggest that demand from mothers may also play a part[39].
Conclusion and recommendations
There is an increase in CS deliveries. Caesarean deliveries are higher in most parts of Karnataka district but reach alarming levels in the southern part. Further, the increase in CS was only observed in private health facilities, whereas this proportion was stagnant or even decreased in public health facilities during DLHS-3 and DLHS-4. Therefore, medical audit, quality assessment and supportive supervision should be considered in order to minimize unnecessary CS rates.
This study also suggests introducing a strong policy at the national and state level, related to CS deliveries. Furthermore, improved steps at national, state and sub-state level should be introduced to provide appropriate checks and monitoring of unnecessary CS deliveries.
The study was conducted under the annual work plan (AWP) budget of the PRC, Dharwad sponsored by the Ministry of Health and Family Welfare (MoHFW), GOI, New Delhi. The authors acknowledge the financial assistance and technical guidance given by the MoHFW. The views expressed are those of the authors and do not necessarily reflect the official policy of MoHFW and PRC.

