


Service quality (SQ) evaluation is essential for competitiveness in hospitality, and SERVQUAL is its most widely used assessment framework. This study integrates SERVQUAL with NLP techniques to extract and interpret customer perceptions from unstructured online reviews automatically.
RbQUAL (review-based quality) uses BERT-based supervised learning, optimised with AutoML, to automatically identify, classify and quantify the SERVQUAL dimensions (SQDs) in reviews and map them to specific hotel service areas. An iterative two-phase training protocol was applied to 701 TripAdvisor reviews (3,798 sentences) of two comparable luxury hotels in Seville (Spain) to refine the model progressively. Phase 1 used 690 expert-annotated fragments on extreme ratings reviews; Phase 2 was expanded to 1,303 fragments with intermediate ratings included for error correction.
RbQUAL classifies SQDs with 73% accuracy and maps service areas with 83% accuracy. The hotel comparison shows that “tangibles” and “reliability” are the most influential dimensions, with statistically significant differences in positive evaluations (χ2 = 26.94, df = 4, p < 0.001), but convergent service failure patterns.
RbQUAL demonstrates that classical theoretical frameworks remain essential in the big data era. By converting publicly available reviews into a continuous SERVQUAL-based diagnostic, it replaces periodic surveys with automated monitoring and shifts quality management from reactive gap-correction to proactive improvement. Its open-source, architecture-agnostic design ensures accessibility for SMEs and transferability across sectors.
RbQUAL advances evidence-based SQ management by transforming unstructured customer discourse into actionable, theoretically consistent insights, bridging classical SQ theory and contemporary AI-driven analytics into a scalable, replicable model for hospitality research.
1. Introduction
To sustain a competitive advantage in strategic management, companies must align perceived value drivers with the value proposition that they communicate to their potential clients and customers. Hotels, in particular, benefit from rigorous service quality (SQ) assessment and continuous improvement due to intense competition and high customer expectations (Kalnaovakul and Promsivapallop, 2023).
The digital transformation has fundamentally altered how customers evaluate and express their service experiences. Online reviews have emerged as critical sources of intelligence that influence both consumer behaviour and managerial decision-making (Kolomoyets and Dickinger, 2023; Lekmiti et al., 2025), and the consequent proliferation of review platforms signals a paradigmatic shift in hospitality marketing and quality assessment. Platforms such as TripAdvisor have become increasingly influential in consumer decision-making (Schmitt, 2019), with travellers now relying heavily on peer-generated content to inform their booking decisions (Rita et al., 2022). These reviews constitute an invaluable resource for service improvement (Le et al., 2024; Zhang-J et al., 2021), as consumers perceive negative information as more credible and influential than positive feedback (Harrison-Walker and Jiang, 2023).
To date, methodological limitations have left much of the information in this resource untapped, despite the vast availability of online review data (Jiao et al., 2025; Liu and Chen, 2022). In short, there is a major methodological paradox that constrains current approaches to review analysis. While conventional computational approaches sacrifice theoretical grounding for analytical scalability, established SQ frameworks maintain conceptual rigour but cannot process unstructured digital discourse. In addition, traditional review analysis approaches, such as word-frequency models and Latent Dirichlet Allocation (LDA), are often unable to capture semantic nuances and contextual relationships (Reisenbichler and Reutterer, 2019). Further, while these unsupervised methods can generate empirically derived categories, they lack theoretical anchoring, so their results cannot be readily interpreted or used in cross-study comparisons. These methods typically use basic clustering algorithms to extract user preferences rather than exploit natural language processing (NLP) techniques (Arenas-Márquez et al., 2021; Sundberg and Holmström, 2024).
Consequently, SQ research is grappling with a critical theoretical-methodological divide. Classical SQ evaluation models, such as SERVQUAL (Parasuraman et al., 1985, 1988), offer a robust conceptual foundation through their multidimensional framework (reliability, responsiveness, assurance, empathy and tangibles). However, these frameworks were designed for structured, survey-based data and cannot handle the spontaneous, contextual nature of digital customer discourse. Although the alternative SERVPERF framework (Cronin and Taylor, 1992) is simpler and perception-focused, both it and SERVQUAL face scalability limitations in unstructured digital environments. A critical gap therefore persists: the lack of integration between established theoretical frameworks and advanced NLP techniques capable of capturing implicit meanings within texts (Sann et al., 2022).
Recent advances in artificial intelligence (AI) offer novel methodological avenues to address this analytical void. Transformer-based architectures such as BERT can offer significant opportunities (Wang et al., 2025), with bidirectional processing capabilities that enable the context to be understood in a way that traditional bag-of-words approaches do not. Therefore, they directly address the semantic limitations that have hampered SQ research. Automated Machine Learning (AutoML) has also gained recognition and popularity for its ability to automate laborious tasks such as data pre-processing, algorithm selection and hyperparameter tuning (Lee et al., 2023; Salehin et al., 2024). Combining these two technologies and established theoretical frameworks presents a unique opportunity to bridge the methodological divide that has thus far constrained SQ research.
Given the above, this research aims to fill a fundamental gap in hospitality SQ assessment: the absence of theoretically grounded, scalable methods to analyse unstructured customer discourse. The following research question has therefore been formulated to address the theoretical and methodological gap identified in the literature: How can SERVQUAL dimensions be operationalised using NLP to accurately and automatically classify SQ from hotel reviews? Guided by the research question, this study sets two primary objectives: (1) to develop a novel methodological framework called RbQUAL (Review-based Quality) integrating the SERVQUAL model with NLP techniques and BERT-based AutoML algorithms to automatically classify Service Quality Dimensions (SQDs) extracted from customer reviews and map them to specific service areas in the hotel context, and (2) to validate the RbQUAL model through a comparative analysis of the SQ perceptions across two similar hotel establishments, identifying dimension-specific strengths and weaknesses and demonstrating the practical utility of the proposed approach for managerial decision-making.
By bridging the observed theoretical-methodological gap, this work expands SERVQUAL's applicability in the era of big data, establishing an original procedure that uses classical frameworks to interpret unstructured data, and offering substantial practical implications for hospitality management while addressing critical limitations that neither traditional survey-based nor purely computational approaches have resolved individually. This paper is structured as follows: Section 2 reviews the relevant literature; Section 3 describes the method; Section 4 reports the results, and Section 5 presents the conclusions.
2. Literature review
This review synthesises three interconnected lines of research: SQ theoretical frameworks, textual analysis of digital customer reviews in the hotel context, and machine learning technologies with natural language processing applied to service evaluation. The systematic integration of these domains addresses a significant theoretical and methodological gap in the research area.
2.1 Service quality assessment with SERVQUAL
As emphasised by Kalnaovakul and Promsivapallop (2023), SQ management is crucial for the success of hotel operations. Understanding the factors that influence SQ and customer satisfaction during the visitor experience allows hotels to focus their improvement efforts more effectively. Devised by Parasuraman et al. (1985, 1988), the SERVQUAL model remains the most highly developed framework for conceptualising and measuring SQ across multiple dimensions: tangibles (the physical appearance of facilities, equipment, personnel and communications materials), reliability (the ability to perform the promised service dependably and accurately), responsiveness (the willingness to provide customers with help and prompt service), assurance (employees' knowledge and courtesy, and their ability to convey trust and confidence) and empathy (the provision of caring, individualised attention to customers).
In spite of its theoretical robustness and widespread adoption across sectors, SERVQUAL has methodological limitations that hamper its application in contemporary contexts. Its primary weaknesses include reliance on structured data collection (requiring questionnaires at two different points in time, for expectations and perceptions respectively), a considerable operational burden and potential measurement biases. Furthermore, the literature continues to document the ambiguous conceptual distinction between expectations and perceptions (Higgs et al., 2005). Cross-cultural concerns also persist, including construct bias, method bias and item bias arising from translation and linguistic distortion, as well as discriminant validity issues regarding the frequent collapse of dimensions (most notably Responsiveness, Assurance and Empathy) into fewer latent factors in confirmatory factor analyses across diverse service contexts (Ladhari, 2009). Various adaptations of the SERVQUAL model have been developed to address some of these issues. For example, Cronin and Taylor (1992) developed SERVPERF, which focuses exclusively on perceptions rather than the expectations–perceptions gap, and offers a more direct and robust measurement approach with a more coherent factorial structure. Hospitality researchers have further developed hotel-specific adaptations, including LODGSERV (Knutson et al., 1990), HOTELQUAL (Delgado et al., 1999) and HOLSERV (Mei et al., 1999), which enhance contextual relevance but create theoretical fragmentation that limits cross-study comparability.
Despite these refinements, the five SERVQUAL dimensions continue to provide a robust theoretical lens for categorising aspects of service delivery (Allan et al., 2025), and SERVQUAL retains a unique integrative capacity that supports cross-context comparability and theoretical continuity in SQ research. Importantly, most of the limitations described above are primarily related to survey-based and psychometric operationalisations of SERVQUAL rather than to the conceptual integrity of its underlying five-dimensional structure. The present study addresses these issues by adopting automated text analysis of authentic customer discourse, thus enabling service quality dimensions to be identified directly in natural language without relying on predefined questionnaire items or reflective measurement assumptions. This computational approach mitigates interviewer effects, accommodates linguistic and cultural variation and maintains theoretical coherence across heterogeneous contexts (Dong, 2025).
When SERVQUAL is employed as a semantic classification taxonomy rather than as a latent-variable measurement scale, the validity criterion shifts from testing construct independence to evaluating whether dimensions exhibit functionally distinct empirical behaviours in customer narratives, such as different distributions across service areas, sentiment polarities and temporal patterns. Under this framework, partial dimensional overlap in natural discourse reflects the inherent complexity and multidimensionality of service experiences as articulated by customers themselves, rather than a psychometric deficiency or model misspecification. Consequently, SERVQUAL is particularly well-suited to multicultural hospitality contexts when operationalised through computational methods, as it enables scalable, context-sensitive and empirically transparent assessment of service quality across diverse guest populations while remaining firmly grounded in established theory (Özispa, 2025).
2.2 Using online reviews for service quality assessment in the hotel sector
A considerable body of literature uses online reviews to evaluate hotel SQ. These reviews authentically reflect customers' experiences (Kalnaovakul et al., 2025; Wu and Morwitz, 2025), minimise the self-report bias of solicited surveys (Baier et al., 2025), eliminate inconsistencies caused by different survey designs and enable greater generalisation through considerably larger sample sizes than traditional instruments (Liu and Beldona, 2021). Their credibility as instruments for measuring SQ is grounded in their perceived reliability among consumers and their influence on future customers' expectations (Rita et al., 2022).
Over the past decade, numerous studies have utilised online reviews to infer SQ indicators in the hotel industry (see Supplementary Materials, Table SM-1). However, while many of these works have identified factors that partially correspond to some aspects of SERVQUAL dimensions, a deficiency remains in the systematic implementation of the complete, theoretically grounded SERVQUAL framework. Content analysis and word-frequency studies, such as Li et al. (2013), Dong et al. (2014), Zhou et al. (2014) and Kim et al. (2016), identified recurring themes, including location, rooms, cleanliness and staff attitude, that partially align with Reliability and Tangibles, but without exhaustive or explicit mapping to the SERVQUAL structure. Later, LDA-based studies, such as Guo et al. (2017), He et al. (2017), Zhang-C et al. (2021) and Shin et al. (2024), generated empirically derived clusters that, while informative, lacked theoretical anchoring and could not be systematically compared across studies.
Later, more sophisticated approaches emerged that began to approximate SERVQUAL dimensions. Ban et al. (2019), Padma and Ahn (2020), Zhang-J et al. (2021), Kalnaovakul and Promsivapallop (2023) and Leutwiler-Lee et al. (2023) employed keyword extraction, factor analysis, principal component analysis and semantic network analysis to derive constructs broadly corresponding to SERVQUAL dimensions such as tangibles, reliability and empathy. Nevertheless, these factors are typically derived through “bottom-up”, data-driven approaches or defined ad hoc based on frequent terms, rather than being explicitly and exhaustively mapped to the five established SERVQUAL dimensions. This approach often results in a fragmented view of SQ in which studies identify some relevant aspects but fail to benefit from SERVQUAL's holistic and empirically validated structure.
2.3 Machine learning and NLP: advanced frameworks for service quality assessment
Big data analysis has emerged as an innovative research paradigm for inferring and predicting user behaviour, evaluating customer satisfaction and improving business outcomes (Zhang et al., 2023). In hospitality and tourism, companies can analyse large volumes of customer-generated data to tailor strategies, offer personalised experiences and meet changing market demands (Khan and Khan, 2025; Mariani and Baggio, 2022). Machine learning (ML) has gained significant traction in hospitality research (Law et al., 2024), playing a crucial role in analysing consumer behaviour, predicting travel trends and understanding tourists' needs proactively (Nguyen et al., 2024).
The choice of classification algorithm proves crucial in document categorisation (Kowsari et al., 2019). While unsupervised models such as LDA identify patterns solely from input data without human-provided labels, supervised learning uses expert-labelled examples to execute classification, and undepins ML (Zhang, 2010). LDA has become the most widely used topic model for identifying thematic patterns in unstructured datasets (Reisenbichler and Reutterer, 2019); however, it presents significant limitations: the “bag-of-words” approach forfeits sequential word order, a single comment may address multiple customer needs simultaneously causing unstable topic distributions (Huang et al., 2022) and the resulting topics often lack utility for human interpretation.
Recent advances in NLP, particularly BERT's transformer-based architecture, address these limitations by enabling bidirectional contextual understanding that traditional bag-of-words approaches cannot achieve (Gardazi et al., 2025). BERT's pre-training and fine-tuning paradigm allows generalised models to adapt effectively to specific classification tasks with limited labelled data, making it particularly suitable for classifying text segments into predefined categories such as SQDs (Wang et al., 2025). Empirical validation confirms BERT's applicability across diverse domains, with reported accuracy rates of 87% and 94% for aspect-based sentiment analysis and review classification tasks (Gardazi et al., 2025). Research by Hossain et al. (2025) demonstrates BERT's capacity for multi-task learning and combining opinion and sentiment data, while Wang et al. (2025) confirm that AI labelling with human supervision achieves optimal classification results, validating BERT's capacity to bridge automated analysis and theoretically grounded human judgement.
The high costs and technical complexity of model development have led to the emergence of AutoML technologies. These automate traditionally labour-intensive model development processes such as data pre-processing and hyperparameter optimisation, accelerating experimentation and democratising the use of ML beyond specialist computational research communities (Salehin et al., 2024). For SQ research, where domain expertise in hospitality often exceeds computational expertise, but unstructured data volumes increasingly demand sophisticated analysis, AutoML enables the operationalisation of established theoretical frameworks at scale while allowing researchers to focus on theoretical coherence and interpretive validity. The integration of BERT's contextual understanding with AutoML's automated optimisation creates unprecedented opportunities for operationalising established SQ frameworks at scale while maintaining conceptual rigour (Quaranta et al., 2025). Nevertheless, the relationship between big data analytics and theory remains critical, as analysing unstructured data requires algorithms based on theoretical assumptions that must be made explicit (Mariani and Baggio, 2022; Yeh et al., 2025).
2.4 Identifying the research gap
Combining the above three streams, recent developments in NLP and ML offer the opportunity to effectively apply established SQ theoretical frameworks, such as the SERVQUAL model, to the analysis of online hotel reviews. This would address a major extant gap characterised by three interconnected deficiencies: theoretical fragmentation, whereby SERVQUAL dimensions are treated as incidental themes rather than intentional analytical categories; methodological limitations, such as bag-of-words approaches (e.g. Chatterjee et al., 2022) failing to capture semantic nuance or contextual relationships typical of hospitality discourse, and the lack of a unified approach, since, to date, no study has fully operationalised the complete SERVQUAL framework for the automated, large-scale analysis of unstructured hotel review data.
Our research addresses this gap by proposing RbQUAL, an innovative approach that uses the five SERVQUAL dimensions as explicit supervised classification categories, implements BERT-based learning to systematically identify SQDs in unstructured texts, automates the labelling process using AutoML and enables efficient detection of critical areas for improvement in hotel services. This approach contributes to both theoretical advancement and business management by broadening the scope of the SERVQUAL model for analysing textual big data and providing hotel managers with an automated tool to identify specific weaknesses in key service dimensions. Having identified this critical gap in the literature, the following section presents RbQUAL.
3. Method
The RbQUAL methodological framework has been designed to automatically detect and classify SQDs in unstructured online hotel reviews, bridging the gap between the theoretically grounded SERVQUAL model (Parasuraman et al., 1985, 1988) and advanced computational tools, including transformer-based NLP models and AutoML pipelines. The framework is applied across the five core service areas typically evaluated by hotel guests: rooms, restaurants, bars, leisure areas and general hotel services. Review sentences are classified into these areas according to the five SERVQUAL dimensions: Tangibles, Reliability, Responsiveness, Assurance and Empathy. This methodology enables a granular and scalable analysis of service experiences, aligned with both academic theory and managerial relevance. To ensure scientific rigour and reproducibility, the model architecture and evaluation scripts have been made available in a public GitHub repository. The annotated training dataset (with reviews anonymised) is provided in a standardised format to facilitate replication. As illustrated in Figure 1, the methodological process unfolds in three distinct but interdependent phases: (1) data collection and pre-processing, (2) manual annotation and model training, and (3) automated classification and iterative validation. This sequential structure ensures that expert knowledge and machine learning are synergistically integrated to produce accurate, context-aware SQ classifications.
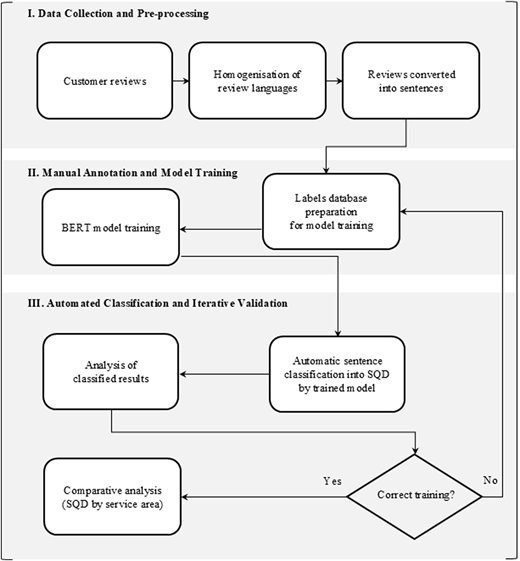
RbQUAL workflow: data preparation, annotation, training and automated SQD classification. Source: Developed by authors
RbQUAL workflow: data preparation, annotation, training and automated SQD classification. Source: Developed by authors
3.1 Phase I: data collection and pre-processing
The initial corpus comprised 9,089 reviews of ten luxury hotels in Seville, Spain. These hotels were selected on 1 May 2024 using TripAdvisor's advanced filters to target establishments with a 4.5 or 5.0 rating (bubble ratings). For the detailed comparative analysis, two hotels were strategically selected based on principles of comparative research design. Both establishments share fundamental operational characteristics (luxury positioning, comparable amenities, target demographics and service offerings), creating a naturally controlled environment in which variations in SQ perceptions can be attributed to operational performance rather than structural disparities. The contrasting TripAdvisor ratings of these two hotels (5.0 versus 4.5) provide an ideal natural experiment to examine how SQDs manifest differently in otherwise comparable establishments. The full distribution of reviews for both hotels, by year and rating category, is provided in Supplementary Materials (Table SM-2).
The dataset spans the period January 2017 to April 2024, encompassing verified user experiences across pre-pandemic, pandemic and post-pandemic years. While this timeframe provides broad temporal coverage, no specific analysis of COVID-19 effects is conducted, as this is beyond the study's scope. In addition, the structure and uneven temporal distribution of reviews do not support the valid isolation of pandemic-related impacts. The reviews were extracted using Data Miner, a web scraping tool for structured HTML data, and stored in Microsoft Excel format. All the customer reviews were obtained from TripAdvisor's publicly accessible platform, where users voluntarily publish their opinions under the platform's terms of service. The reviews were downloaded anonymously, and no identifiable personal information was collected beyond the publicly displayed content.
To conduct a controlled comparative analysis, a subset of 701 reviews was selected from two hotels in the initial group, operated by the same chain. These reviews were translated and homogenised using Microsoft Word 365 and Azure AI Translator to ensure consistency in linguistic structure and improve compatibility with NLP libraries. As recommended by Pawlik (2025), polarised datasets, comprising reviews with clearly positive or negative sentiment, were prioritised to enhance translation reliability and analytical robustness. The 701 reviews were subsequently segmented into 3,798 sentences, maximising granularity and enabling the detection of multiple SQDs in individual reviews.
3.2 Phase II: manual annotation and model training
RbQUAL operationalises the five SERVQUAL dimensions: Tangibles, Reliability, Responsiveness, Assurance and Empathy (Parasuraman et al., 1988) as supervised-learning classification labels rather than survey-based reflective scales. Each sentence in the corpus was assigned to one or more of these dimensions and to one of five hotel service areas (rooms, restaurant, bar, leisure and general hotel services), forming the dual classification schema of the framework. To develop the training dataset, 690 review fragments were selected from the broader ten-hotel pool, ensuring a broad representation of service areas and sentiment polarities.
Two domain experts in hospitality independently annotated each fragment, assigning SERVQUAL dimension labels and service area codes based on the original conceptual definitions (Parasuraman et al., 1988). Discrepancies were resolved through structured discussion, with a third expert consulted when consensus was not reached. Inter-coder reliability was assessed using Cohen's Kappa with κ = 0.82 for SERVQUAL dimensions and κ = 0.91 for service areas, indicating substantial agreement in both cases. The final training dataset was constructed as a stratified random sample with proportional representation of all dimensions and service areas, and partitioned 80% for training and 20% for evaluation. Table 1 illustrates the sentence-level annotation procedure applied to a representative review.
Example of SQD coding for review analysis
| Sentence | Service | Remarks |
|---|---|---|
| In the restaurant, customer service is perfect, and the quality is unbeatable | Restaurant | Reliability: the ability to perform the promised service efficiently and accurately |
| … The rooms are spacious and have the best beds you can imagine | Room | Tangibles: the appearance of physical facilities, equipment and personnel |
| … Describing the views and the location in the city would never do it justice; it is IMPRESSIVE | Hotel | Tangibles: the appearance of physical facilities, equipment and personnel |
| I hope everyone can experience being a guest and feel as good as we do with the service on their perfect terrace | Leisure areas | Assurance: employees' knowledge and courtesy, and their ability to convey trust and confidence |
The machine learning component of RbQUAL uses a BERT-based multi-label classification model, specifically the bert-base-multilingual-cased variant. This model is particularly well-suited to capturing the polysemous, context-dependent nature of language found in online reviews, as it effectively identifies the nuanced expressions typical of user-generated content. The model was implemented using Visual Studio Code, with the Bito AI extension and Python libraries including transformers, scikit-learn, pandas, openpyxl and PyTorch. AutoML functionalities were integrated to enhance training efficiency and reduce human bias. These automated processes enabled optimal hyperparameter selection and increased robustness across multiple training iterations (epochs).
3.3 Phase III: automated classification and iterative validation
Automatic classification was conducted of the 3,798 sentences extracted from the 701 reviews of the two selected hotels, both operated by the same chain and sharing similar characteristics in terms of location, services and brand. The analytical process followed an iterative two-phase training protocol. In the first phase, the model was fine-tuned using sentences from reviews with extreme ratings, corresponding to highly negative (1 and 2 bubbles) and highly positive experiences (5 bubbles), respectively. The classification results were manually evaluated. Misclassified sentences were reviewed, corrected and reintegrated into the training set, yielding a total of 1,303 (690 initial + 613 refined/expanded) updated and stratified sentences for use in the second phase.
Subsequently, the model was further fine-tuned by applying the updated corpus to sentences from reviews with intermediate ratings (3 and 4 bubbles). This iterative refinement process significantly improved the model's accuracy, particularly in detecting underrepresented dimensions such as responsiveness and empathy. Model performance was evaluated using four standard metrics: Accuracy, Precision, Recall and the F1-Score across all hyperparameter configurations. The F1-Score was prioritised as the principal indicator, as its harmonic integration of Precision and Recall provides a balanced assessment under the class-imbalance conditions typical of hospitality review datasets (Dikmen et al., 2025).
4. Results
The empirical results are presented by research objective: model development and validation (Section 4.1), and practical application through hotel comparison (Section 4.2).
4.1 Model development and validation
4.1.1 Descriptive analysis of the review corpus
The distribution of reviews by year and rating category for the two selected hotels is detailed in Supplementary Materials (Table SM-2). Despite the hotels' similar characteristics, the ratings distribution justifies Hotel A receiving the lowest scores, and Hotel B the highest out of the 10 luxury hotels in Seville selected for their similar services and locations. Notably, Hotel A presents a more varied distribution, with 19.33% negative ratings and 46.33% excellent ratings. In contrast, Hotel B demonstrates superior performance with 90% excellent ratings, justifying these hotels' selection for comparative analysis.
4.1.2 Iterative model training and performance evolution
An iterative two-phase strategy was followed to develop the automatic coding model. In Phase 1, the model was applied to reviews with extreme ratings (1–2 and 5 bubbles) using the initial corpus of 690 expert-labelled fragments. Classification outputs were subsequently reviewed manually, and misclassified sentences were corrected and reintegrated into the training dataset, yielding an expanded corpus of 1,303 annotated fragments. Full Phase 1 performance figures by hotel and rating category are provided in Supplementary Materials (Table SM-3). In Phase 2, the enriched dataset was used to fine-tune the model on reviews with intermediate ratings (3–4 bubbles), substantially improving accuracy, particularly for underrepresented dimensions such as Responsiveness and Empathy.
Following this iterative refinement, the model achieved 72.3% and 72.6% operational accuracy for Hotels A and B, respectively, in SQD classification, i.e. real-world deployment performance. Comments classified as residual or irrelevant to SQ evaluation remained at approximately 17% in the second iteration. Regarding service area identification — a secondary but practically relevant output — the model achieved 99.1% accuracy in practical deployment. These results establish the robust automatic coding of SQDs as a reliable foundation for the comparative hotel analysis presented in Section 4.2.
4.1.3 Hyperparameter sensitivity analysis
A systematic hyperparameter sensitivity analysis across four experimental configurations identified the optimal model setup (full results in Supplementary Materials, Table SM-4). The optimal configuration — learning rate = 0.00003, batch size = 16, epochs = 4 — achieved 73.2% accuracy (95% CI: 0.652–0.799) and 0.722 F1-score for SERVQUAL dimension classification. Service area classification performed more strongly, with 82.6% accuracy (95% CI: 0.754–0.881) and 0.827 F1-score. The dominant hyperparameter was learning rate: configurations with higher values (0.00005) exhibited train-validation gaps of 13.0–15.7% points, providing quantitative evidence of overfitting, compared to approximately 3.6% points for the optimal configuration. Extended training across 4 epochs improved validation accuracy from 28.3% to 66.7%, with training loss decreasing consistently from 3.13 to 1.50, indicating convergence without overfitting.
To contextualise these results within the broader hospitality NLP literature, RbQUAL performs competitively. While comparable BERT applications achieve higher accuracies (Jagrič and Herman, 2024: 88.23%, F1 = 0.88; Norouzi et al., 2025, F1 = 0.89), they address simpler binary or multi-class classification tasks, whereas RbQUAL operationalises the complete five-dimensional SERVQUAL framework simultaneously on unstructured text, limiting direct comparability. The 9.4 percentage-point gap between dimension accuracy (73.2%) and service area accuracy (82.6%) parallels the reduction in human inter-annotator agreement between these two tasks, demonstrating that, rather than reflecting model insensitivity, model performance tracks the inherent complexity of human judgement. In this context, the 95% confidence interval for overall accuracy (65.2%–79.9%) indicates adequate performance for exploratory managerial interpretation when supported by human oversight.
4.2 Comparative analysis of service quality in two hotels
This section applies RbQUAL to the comparative SQ assessment of two luxury hotels, first analysing the dimensional patterns, longitudinal evolution and service-area distributions, and secondly conducting inferential statistical tests to validate the differences between establishments.
4.2.1 Descriptive analysis
Hotel A: Classification of SQDs by year and services offered (01/01/2017–30/04/2024)
| Rating | Year | SQ dimension | Subtotal | % year | ||||
|---|---|---|---|---|---|---|---|---|
| Responsiv | Reliability | Empathy | Assurance | Tangibles | ||||
| 1 or 2 | 2019 | 1 | 31 | 2 | 12 | 48 | 94 | 41.41% |
| 2020 | 0 | 5 | 0 | 2 | 6 | 13 | 5.73% | |
| 2021 | 0 | 9 | 2 | 2 | 21 | 34 | 14.98% | |
| 2022 | 1 | 14 | 3 | 6 | 32 | 56 | 24.67% | |
| 2023 | 1 | 6 | 5 | 8 | 10 | 30 | 13.22% | |
| Service Area | Responsiv | Reliability | Empathy | Assurance | Tangibles | Subtotal | % service area | |
| Rooms | 0 | 22 | 1 | 1 | 78 | 102 | 44.93% | |
| Restaurant | 1 | 9 | 0 | 1 | 3 | 14 | 6.17% | |
| Bars | 0 | 2 | 0 | 3 | 2 | 7 | 3.08% | |
| Leisure | 0 | 6 | 0 | 1 | 11 | 18 | 7.93% | |
| Hotel | 2 | 26 | 11 | 24 | 23 | 86 | 37.89% | |
| Subtotal | 3 | 65 | 12 | 30 | 117 | 227 | 100.00% | |
| Percentage | 1.32% | 28.63% | 5.29% | 13.22% | 51.54% | 100.00% | ||
| Rating | Year | Responsiv | Reliability | Empathy | Assurance | Tangibles | Subtotal | % year |
|---|---|---|---|---|---|---|---|---|
| 5 | 2018 | 1 | 0 | 0 | 0 | 2 | 3 | 0.80% |
| 2019 | 5 | 29 | 3 | 12 | 75 | 124 | 33.16% | |
| 2020 | 4 | 10 | 9 | 4 | 25 | 52 | 13.90% | |
| 2021 | 9 | 17 | 5 | 9 | 27 | 67 | 17.91% | |
| 2022 | 2 | 14 | 6 | 9 | 34 | 65 | 17.38% | |
| 2023 | 2 | 13 | 10 | 11 | 27 | 63 | 16.84% | |
| Service Area | Responsiv | Reliability | Empathy | Assurance | Tangibles | Subtotal | % service area | |
| Rooms | 4 | 9 | 2 | 0 | 89 | 104 | 27.81% | |
| Restaurant | 1 | 29 | 3 | 2 | 9 | 44 | 11.76% | |
| Bars | 0 | 2 | 0 | 0 | 0 | 2 | 0.53% | |
| Leisure | 1 | 4 | 0 | 1 | 26 | 32 | 8.56% | |
| Hotel | 17 | 39 | 28 | 42 | 66 | 192 | 51.34% | |
| Subtotal | 23 | 83 | 33 | 45 | 190 | 374 | 100.00% | |
| Percentage | 6.15% | 22.19% | 8.82% | 12.03% | 50.80% | 100.00% |
Hotel B: Classification of SQDs by year and services offered (01/01/2017–30/04/2024)
| Rating | Year | SQ dimension | Subtotal | % year | ||||
|---|---|---|---|---|---|---|---|---|
| Responsiv | Reliability | Empathy | Assurance | Tangibles | ||||
| 1 or 2 | 2019 | 1 | 3 | 0 | 0 | 1 | 5 | 38.46% |
| 2020 | 0 | 0 | 0 | 0 | 0 | 0 | 0.00% | |
| 2021 | 0 | 1 | 0 | 0 | 0 | 1 | 7.69% | |
| 2022 | 0 | 2 | 1 | 0 | 3 | 6 | 46.15% | |
| 2023 | 0 | 1 | 0 | 0 | 0 | 1 | 7.69% | |
| Service Area | Responsiv | Reliability | Empathy | Assurance | Tangibles | Subtotal | % service area | |
| Rooms | 0 | 3 | 0 | 0 | 2 | 5 | 38.46% | |
| Restaurant | 0 | 1 | 0 | 0 | 0 | 1 | 7.69% | |
| Bars | 0 | 0 | 0 | 0 | 0 | 0 | 0.00% | |
| Leisure | 0 | 0 | 0 | 0 | 0 | 0 | 0.00% | |
| Hotel | 1 | 3 | 1 | 0 | 2 | 7 | 53.85% | |
| Subtotal | 1 | 7 | 1 | 0 | 4 | 13 | 100.00% | |
| Percentage | 7.69% | 53.85% | 7.69% | 0.00% | 30.77% | 100.00% | ||
| Rating | Year | Responsiv | Reliability | Empathy | Assurance | Tangibles | Subtotal | % year |
|---|---|---|---|---|---|---|---|---|
| 5 | 2017 | 3 | 57 | 10 | 26 | 50 | 146 | 11.73% |
| 2018 | 15 | 172 | 30 | 51 | 195 | 463 | 37.19% | |
| 2019 | 12 | 112 | 21 | 30 | 120 | 295 | 23.69% | |
| 2020 | 1 | 14 | 3 | 7 | 21 | 46 | 3.69% | |
| 2021 | 4 | 21 | 7 | 9 | 19 | 60 | 4.82% | |
| 2022 | 8 | 32 | 11 | 12 | 46 | 109 | 8.76% | |
| 2023 | 3 | 18 | 6 | 13 | 35 | 75 | 6.02% | |
| 2024 | 3 | 15 | 5 | 12 | 16 | 51 | 4.10% | |
| Service Area | Responsiv | Reliability | Empathy | Assurance | Tangibles | Subtotal | % service area | |
| Rooms | 14 | 47 | 4 | 5 | 188 | 258 | 20.72% | |
| Restaurant | 3 | 144 | 12 | 8 | 41 | 208 | 16.71% | |
| Bars | 0 | 1 | 0 | 0 | 0 | 1 | 0.08% | |
| Leisure | 2 | 13 | 0 | 4 | 60 | 79 | 6.35% | |
| Hotel | 30 | 236 | 77 | 143 | 213 | 699 | 56.14% | |
| Subtotal | 49 | 441 | 93 | 160 | 502 | 1.245 | 100.00% | |
| Percentage | 3.94% | 35.42% | 7.47% | 12.85% | 40.32% | 100.00% |
Hotel A (Table 2) shows 601 SQDs identified over the eight-year period, of which 227 (37.77%) correspond to negative evaluations (scores of 1–2). Tangibles attract the largest share of negative mentions (51.54%, n = 117), followed by Reliability (28.63%, n = 65), Assurance (13.22%, n = 30), Empathy (5.29%, n = 12) and Responsiveness (1.32%, n = 3). The Reliability dimension shows a particularly revealing temporal pattern, with a critical concentration in 2019 accounting for 47.69% (31/65) of all negative mentions for this dimension, and another in 2022 with 21.54% (14/65). This suggests specific periods of operational deterioration that contrast markedly with 2020, when only 5 negative mentions (7.69%) were recorded, a pattern consistent with the general reduction in hotel activity during the COVID-19 pandemic. Tangibles (50.80%, n = 190) continue to dominate the 374 positive evaluations (rating of 5), followed by Reliability (22.20%, n = 83), Assurance (12.03%, n = 45), Empathy (8.82%, n = 33) and Responsiveness (6.15%, n = 23). Notably, Empathy and Responsiveness have a relatively higher proportion of positive evaluations than negative evaluations, suggesting compensatory potential in overall service perception and the capacity to generate differentiated positive experiences.
Hotel B (Table 3) presents a radically different pattern, with 1,258 identified SQDs, of which only 13 (1.03%) correspond to negative evaluations. Despite this low volume, the dimensional distribution of negative mentions is informative: Reliability receives the largest share (53.85%, n = 7), followed by Tangibles (30.77%, n = 4), while Responsiveness and Empathy both register 7.69% (n = 1), and Assurance has no negative mentions. Negative evaluations are temporally concentrated in 2022 (6 mentions, 46.15%) and 2019 (5 mentions, 38.46%). Tangibles account for (40.32%, n = 502) of the 1,245 positive evaluations, followed by Reliability (35.42%, n = 441), Assurance (12.85%, n = 160), Empathy (7.47%, n = 93) and Responsiveness (3.94%, n = 49). The high proportion of Reliability in both positive (35.42%) and negative evaluations (53.84%) suggests a generally favourable perception of this dimension, but with specific vulnerabilities requiring ongoing monitoring.
Longitudinal analysis reveals contrasting evolutionary patterns between the two establishments. In Hotel A, a relative decrease in negative mentions of Reliability and Tangibles is observed in 2023 compared to 2022 (Table 2), accompanied by a concerning increase in the dimensions of Empathy, Responsiveness and Assurance. This transition suggests a shift in the sources of dissatisfaction to relational aspects and security, indicating that although operational and physical problems have been partially addressed, new areas of concern are emerging in human interaction and the perception of security. In Hotel B, the temporal analysis reveals the need to maintain vigilance regarding Reliability, which has received negative mentions in all years except 2020. Furthermore, an investigation is warranted to determine why, having registered no negative mentions in the preceding two years or in 2023, the Tangibles dimension recorded three in 2022.
The service areas analysis reveals further diagnostic detail (Tables 2 and 3). In Hotel A, rooms are the most problematic area, and receive 44.93% of all negative evaluations, with 76.47% of these in the Tangibles dimension (78/102), indicating systematic deficiencies in the physical environment. General hotel services account for a further 37.89% of negative mentions. The restaurant area, while totalling only 6.17% of negative SQDs, shows a significant concentration in Reliability (64.29% of negative restaurant mentions, 9/14), suggesting the need for specific supervision of gastronomic service consistency. Meanwhile, Hotel B receives only a limited number of negative mentions (13, see Table 3). These are primarily concentrated in the Reliability dimension (7 mentions, 53.85%), followed by Tangibles (4 mentions, 30.77%). By service area, general hotel services account for 53.85% of negative mentions, followed by rooms (38.46%) and restaurant services (7.69%). However, general hotel services also emerge as the hotel's principal strength, accounting for 56.14% of all positive evaluations. This is followed by rooms (20.72%) and food and beverage services, i.e. restaurants (16.71%).
4.2.2 Inferential analysis
Inferential tests were conducted to determine whether the observed performance asymmetries reflect statistically significant differences. Given the fundamental differences in ratings distributions (Hotel A: 19.33% negative ratings; Hotel B: 1.25% negative ratings), different statistical approaches were used for negative and positive reviews (Agresti and Coull, 1998). For negative reviews (Ratings 1–2, n = 240 total mentions), substantial sample size disparity (Hotel A: n = 227; Hotel B: n = 13) necessitated Fisher's Exact Test rather than Chi-square approximation to ensure statistical rigour with low expected cell frequencies. Four dimensions showed no significant differences: Responsiveness (p = 0.201), Empathy (p = 0.524), Assurance (p = 0.380) and Tangibles (p = 0.165), indicating convergent failure patterns across establishments (Table 4 Panel A). Reliability demonstrated marginal significance (p = 0.066, OR = 0.34), with Hotel B exhibiting 2.94 times the likelihood of reliability-related complaints (53.8% vs. 28.6%). Tangibles showed a notable (OR = 2.39) but not statistically significant (p = 0.165) effect size, with Hotel A receiving proportionally more complaints concerning physical facilities (51.5% vs. 30.8%).
SQDs: Inferential analysis by hotel and rating valence
| IVa. Fisher's exact test for negative reviews (ratings 1–2) | |||||
|---|---|---|---|---|---|
| Dimension | Hotel A n (%) | Hotel B n (%) | Odds ratio | 95% CI | p-value |
| Responsiveness | 3 (1.3%) | 1 (7.7%) | 0.16 | [0.01, 1.53] | 0.201 |
| Reliability | 65 (28.6%) | 7 (53.8%) | 0.34 | [0.11, 1.06] | 0.066† |
| Empathy | 12 (5.3%) | 1 (7.7%) | 0.67 | [0.08, 5.44] | 0.524 |
| Assurance | 30 (13.2%) | 0 (0.0%) | – | – | 0.380 |
| Tangibles | 117 (51.5%) | 4 (30.8%) | 2.39 | [0.72, 7.98] | 0.165 |
| Notes. Totals: Hotel A = 227; Hotel B = 13. Percentages are calculated within each hotel. p-values are two-sided Fisher exact tests for each 2×2 comparison. “—” indicates that the odds ratio is not estimable due to a zero cell. The omnibus association (reference, χ2-based) is χ2(4) = 8.50, p = 0.075; Cramér's V = 0.19. †p < 0.10 indicates marginal significance | |||||
| IVb. Chi-square test of independence for positive reviews (rating = 5) | ||||||||
|---|---|---|---|---|---|---|---|---|
| Dimension | Hotel A n | Expected A | χ2 contrib A | Hotel B n | Expected B | χ2 contrib B | Odds ratio | 95% CI / p |
| Tangibles | 190 (50.8%) | 159.86 | 5.68 | 502 (40.3%) | 532.14 | 1.71 | 1.53 | [1.24, 1.89], p < 0.001 |
| Reliability | 83 (22.2%) | 121.05 | 11.96 | 441 (35.4%) | 402.95 | 3.59 | 0.52 | [0.39, 0.68], p < 0.001 |
| Responsiveness | 23 (6.2%) | 16.63 | 2.44 | 49 (3.9%) | 55.37 | 0.73 | 1.60 | [0.94, 2.73], p = 0.085 |
| Empathy | 33 (8.8%) | 29.11 | 0.52 | 93 (7.5%) | 96.89 | 0.16 | 1.19 | [0.79, 1.81], p = 0.406 |
| Assurance | 45 (12.0%) | 47.36 | 0.12 | 160 (12.9%) | 157.64 | 0.04 | 0.93 | [0.65, 1.33], p = 0.692 |
Note(s): Total mentions: Hotel A = 374; Hotel B = 1,245
Percentages represent the proportion of mentions within each hotel. Expected values are derived from marginal totals under the assumption of independence. Odds ratios correspond to binary comparisons (mention vs. non-mention) between hotels for each dimension
Chi-square test: χ2(4) = 26.94, p < 0.001. Indicates a significant association between review dimension and hotel
Interpretation guide for χ2 contribution: ≥10.0 = extremely substantial; 5.0–9.99 = highly substantial; 3.0–4.99 = substantial; 2.0–2.99 = moderate; <2.0 = minimal
Positive reviews (Rating 5, n = 1,619 total mentions) present adequate sample sizes (Hotel A: n = 374; Hotel B: n = 1,245), which allows Chi-square testing to evaluate whether excellence patterns differ systematically between establishments (Table 4 Panel B). The overall Chi-square test yielded highly significant results (χ2 = 26.94, df = 4, p < 0.001), confirming that hotels construct competitive value through strategically different dimensional combinations. Reliability emerged as the largest source of variance (χ2_contribution = 15.55, 57.7% of total χ2), with Hotel B receiving significantly higher praise for operational consistency (35.4% vs. 22.2%; p < 0.001). Tangibles constituted the second major differentiator (χ2_contribution = 7.39, 27.4%), with Hotel A receiving significantly more praise for physical facilities (50.8% vs. 40.3%; p < 0.001). Jointly, these dimensions account for 85% of competitive differentiation (combined χ2 = 22.94 of 26.94). Responsiveness showed marginal significance (p = 0.085), while Empathy and Assurance exhibited no significant differences (p > 0.40).
These patterns confirm that while service failures (negative reviews) converge around universal baseline expectations, the mechanisms for generating excellence (positive reviews) diverge sharply. An examination of dimensional representation reveals systematic trends warranting theoretical consideration. The traditional SERVQUAL literature has documented the conceptual fragility of Responsiveness, including factorial instability and a tendency to merge with Assurance and Empathy (Ladhari, 2009). This structural instability predates computational methods, suggesting that automated text analysis reveals genuine customer perception patterns rather than algorithmic bias. The consistent underrepresentation of Responsiveness across both establishments (Hotel A: 6.2% positive, 1.3% negative; Hotel B: 3.9% positive, 7.7% negative), with no statistically significant differences, demonstrates that low frequency reflects authentic customer behaviour in luxury contexts, where prompt service constitutes an internalised baseline expectation, rather than model insensitivity.
5. Discussion and conclusions
5.1 Conclusions
This study introduces RbQUAL, an innovative, scalable methodology that uses the SERVQUAL model to automatically identify and extract SQDs from unstructured online review data. By leveraging advanced NLP techniques, specifically BERT-based supervised learning, RbQUAL directly addresses the research question set: How can SERVQUAL dimensions be operationalised using NLP for accurate automatic SQ classification from hotel reviews?
RbQUAL achieves its first objective by successfully integrating SERVQUAL's conceptual framework with transformer-based NLP, bridging the theoretical–methodological divide that has long constrained SQ research. Through iterative expert-guided refinement (690 → 1,303 annotated fragments), the framework demonstrates operational reliability in real-world deployment, achieving 72.3% and 72.6% accuracy for SERVQUAL dimension classification across Hotels A and B, respectively. Service area identification performs with exceptional precision, with 99.1% accuracy in practical application. This integration preserves SERVQUAL's conceptual integrity while achieving empirical robustness suitable for managerial decision-making.
In fulfilling the second objective, empirical validation demonstrates RbQUAL's diagnostic precision through a comparison of two luxury hotels in Seville, Spain (2017–2024). Hotel A presented 37.77% negative evaluations concentrated in Tangibles and Reliability, whereas Hotel B received 1.03% negative feedback. Critically, inferential testing revealed asymmetric competitive dynamics: service failures converged across establishments (non-significant Fisher's Exact Test), while excellence-generation mechanisms diverged sharply (χ2 = 26.94, df = 4, p < 0.001). The data in this two-hotel comparison suggest redirecting quality management from uniform deficit correction to excellence amplification in the dimensions where competitive divergence occurs: in this case, Reliability and Tangibles, which together account for 85% of observed differentiation. Despite broader validation being required, this pattern offers a methodologically testable proposition for strategic resource allocation.
In synthesising these findings, this study makes three distinctive contributions to service quality research. Firstly, it operationalises SERVQUAL dimensions as supervised-learning categories, transforming a measurement instrument into an analytical framework for unstructured data. Secondly, it demonstrates that classical service quality theories remain relevant and applicable in the era of big data, provided that appropriate computational bridges are constructed. Lastly, it establishes a replicable, open-source methodology that balances theoretical rigour with analytical scalability, addressing the persistent divide between conceptual frameworks and computational capabilities in hospitality research. These contributions position RbQUAL as a methodological template applicable beyond hospitality that offers transferable insights for service quality research across diverse industries.
5.2 Theoretical implications
To the best of our knowledge, this is the first study to fully operationalise the SERVQUAL framework for supervised machine learning classification of SQDs extracted from unstructured text in hotel reviews. Unlike hotel-specific frameworks such as LODGSERV, HOTELQUAL and HOLSERV, which adapt SERVQUAL dimensions to accommodation-specific characteristics to the detriment of cross-study comparability, RbQUAL preserves SERVQUAL's conceptual integrity while enabling automated analysis of spontaneous customer discourse.
The study extends the theoretical framework of service marketing developed by Grönroos (1982) by demonstrating how systematic analysis of the customer voice strengthens interactive marketing, enhances corporate image and reinforces organisational reputation. By translating SERVQUAL dimensions into supervised-learning categories, RbQUAL addresses interpretability issues with purely computational approaches (Kowsari et al., 2019) while overcoming the scalability constraints of survey-based instruments. This approach ensures reliable, theory-informed data generation and higher accuracy than unsupervised models.
The framework identifies the key hotel service areas that shape customer satisfaction, aligning with prior research on how perceptions vary across operational departments (Perdomo-Verdecia et al., 2024). The integration of AutoML and BERT establishes a theory-consistent computational model capable of context-aware SQD classification, while validation across two similarly positioned hotels confirms its ability to reveal dimension-specific strengths and weaknesses for evidence-based decision-making.
Overall, this research establishes a replicable methodological framework that links quantitative computational analysis and qualitative theoretical interpretation. It contrasts with the opacity of unsupervised topic-modelling approaches by offering transparent, theoretically grounded and replicable results that inform both academic inquiry and managerial practice. Additionally, it aligns with the scientific community's ongoing efforts to mitigate biases in selection, clustering and labelling, encouraging reproducibility and methodological transparency (Herhausen et al., 2024).
5.3 Practical implications
RbQUAL transforms reactive problem-solving-based SQ management into proactive experience optimisation by systematically extracting actionable information from customer reviews. By identifying dimension-specific patterns in both positive and negative feedback, hotel managers can implement targeted corrections and strategic adjustments before quality issues escalate into reputational damage or declining satisfaction scores (Xu and Lv, 2022). Understanding customers' perceived value of hotel services provides crucial insights into the alignment between value proposition narratives and the perception of hotel experiences (Kolomoyets and Dickinger, 2023). For practitioners, RbQUAL provides a robust automated monitoring tool that replaces periodic survey-based campaigns with continuous, real-time assessment across multiple service areas. It facilitates early detection of emerging problems, comparative visualisation of performance across operational domains, rooms, restaurants, general hotel services and longitudinal monitoring of SQD trends, enabling data-driven resource allocation directed at the component or components where it yields the greatest impact on guest satisfaction. Beyond individual hotel management, RbQUAL supports cross-establishment benchmarking using consistent theoretical dimensions and overcoming fragmentation from heterogeneous frameworks. Analysing large review corpora also mitigates the influence of false or malicious comments, addressing concerns about the authenticity of online reviews (Arenas-Márquez et al., 2021; Banerjee, 2022) by allowing the system to contextualise and neutralise atypical outliers.
RbQUAL also has broader economic and social implications. By enabling continuous automated monitoring at marginal cost after initial training, it significantly reduces quality assessment expenditure compared to traditional survey campaigns, democratising sophisticated quality assessment and allowing small and medium-sized enterprises (SMEs) to compete through data-driven improvement, particularly in emerging markets and resource-constrained contexts. The methodology's reliance on spontaneous customer reviews incorporates a wider range of voices, reducing the representativeness issues inherent in solicited surveys where response rates often reflect demographic biases. Furthermore, RbQUAL's theory-grounded classification architecture mitigates the algorithmic bias risks endemic to purely data-driven systems: the SERVQUAL framework provides theory-constrained dimensions that prevent the spurious associations that unsupervised topic models might inadvertently learn, while the open-source repository with anonymised training data facilitates independent bias auditing, in contrast to proprietary black box sentiment systems.
5.4 Limitations and future research
Although the dataset scope limits direct generalisation, this constraint is moderated by the methodological flexibility of RbQUAL, which can be retrained for other cultural contexts, market tiers and hotel categories as new datasets and more advanced language models emerge. While findings from Spanish luxury hotels may not fully extend to other regions or segments, and chain-level homogeneity may reduce observable variability, the theory-driven supervised architecture provides a robust and transferable foundation for broader application. This adaptability is further supported by the translation pipeline. Previously employed in recent studies (Prabowo et al., 2024), Azure AI Translator offers a practical solution for multilingual data processing, although, as with any neural machine translation system, it still presents opportunities for improvement through the reduction of potential sentiment distortions during translation (Pawlik, 2025). The use of polarised datasets helps mitigate this risk, enhancing the reliability of the translated corpus for supervised classification.
Future research should pursue several complementary directions. Firstly, targeted annotation of underrepresented dimensions using stratified sampling across hotel types, regions and temporal periods would enhance model robustness and ensure balanced dimensional representation. Secondly, employing native-language training corpora would test RbQUAL's transferability across culturally diverse markets, with particular attention to dimensions exhibiting greater cultural variability, such as Assurance and Empathy. Thirdly, integrating visual features from review images would improve the assessment of visually oriented dimensions, such as Tangibles and enable the detection of inconsistencies between textual and visual cues that may indicate authenticity issues. Finally, adapting RbQUAL to other service sectors such as restaurants, airlines, healthcare, and retail would establish its domain generalisability while revealing sector-specific dimensional weightings. Advancing along these lines collectively would progressively transform RbQUAL into a universal framework for data-driven quality evaluation across a wide range of service industries.
The supplementary material for this article can be found online

