Using smart manufacturing technologies presents potentials for economic, environmental, and social sustainability objectives. Regarding their contribution to sustainability, these potentials are not mutually exclusive but interrelated. This study investigates these interrelationships of utilizing advanced digital technologies for sustainable smart manufacturing. By identifying the importance of the social dimension and its human factor, this study contributes to the recent research on human-centricity in smart manufacturing.
We apply a two-step mixed-method approach. First, through 44 expert interviews supported by a literature review, we identify nine key sustainability potentials that influence sustainable smart manufacturing. Second, we analyze the interrelationships and expand our analysis using data from 68 participants.
We identify the impact of each factor and the cause-and-effect interrelationships. Our findings show that all environmental potentials can be categorized into effect dimensions. Within the economic and social dimensions, only one factor each is classified as an effect factor, whereas two factors in each domain are recognized as cause factors. Interestingly, employee qualification acts as the strongest lever influencing all other key sustainability dimensions.
This study elucidates the interplay between smart manufacturing technologies and sustainability in smart manufacturing, offering valuable insights to navigate the interrelatedness of sustainable potentials, in particular regarding human interoperability.
Quick value overview
Interesting Because - In smart manufacturing, there has been a shift toward situating the human at the heart of many perspectives. In the context of social sustainability, the human factor is becoming increasingly important. Therefore, the interrelationship of the human factor with other dimensions and possible interrelationships must be understood. This study illustrates the interplay between the economic, environmental, and social objectives of smart manufacturing. It highlights that social approaches can act as a lever in this interplay and that a stronger emphasis should be placed on dealing with the human factor.
Theoretical Value - Previous studies have adopted a linear view of sustainability efforts. We show that this linear view is insufficient because various factors are interrelated. In particular, the dimension of social sustainability is considered a lever linking economic and environmental objectives. With the correct qualification measures, humans can directly influence sustainability efforts. Further, we provide evidence that social sustainability is essential for achieving sustainable smart manufacturing.
Practical Value - Industrial companies must consider the interoperability of their various sustainability objectives. Focusing on human factors can enable additional sustainability efforts. Managers should recognize the importance of humans in smart manufacturing. This approach can also help achieve efficiency in economic and environmental objectives, particularly through training, such as workshops or development measures.
1. Introduction
Recent developments through advanced technologies in smart manufacturing environments have enabled sustainable production in industrial companies (Marcon et al., 2022; Nascimento et al., 2019). Transformational changes, such as new customer demands or resource scarcity, require industrial companies to focus on digitalization and sustainability. Traditional manufacturing techniques are becoming automated, and processes are rapidly becoming digitalized through the use of digital technologies such as artificial intelligence (AI), digital twins, or extended reality (XR) (Chiarini, 2021). Digital manufacturing technologies offer several sustainability potentials for the environmental, economic, and social dimensions (Hussain et al., 2024; Wei et al., 2024). Regarding environmental potential, the use of AI optimizes production programs by selecting the most efficient order, thereby reducing high-emission idle runs (Bai and Sarkis, 2017). Economic sustainability is achieved by reducing costs through digital twin technologies or digital platforms to virtually map production processes and detect unnecessary costs (Arcidiacono and Schupp, 2024; Frank et al., 2019). In the social dimension, enhancing transparency facilitates the improvement of working conditions and supports employees (Veile et al., 2020). This information can be exchanged across the value chain to facilitate stakeholder integration in a socially sustainable manner. While the environmental dimension was dominant in the past, the social dimension has gained importance in recent studies (Baig and Yadegaridehkordi, 2024; Cillo et al., 2022).
Combining digitalization and sustainability marks the beginning of a new stage of industrial development (Dieste et al., 2024). Extending the sustainability goals of Industry 4.0, Industry 5.0 focuses on human-centricity and resilience (Baig and Yadegaridehkordi, 2024; Cillo et al., 2022). The importance of the human factor in sustainable manufacturing is particularly interesting as human-machine collaboration is being expanded through Industry 5.0 technologies (Langås et al., 2025). Previous research has emphasized economic benefits and environmental effects, with less focus on social effects (Arcidiacono and Schupp, 2024). However, industrial companies are changing their perspectives on social development in their manufacturing environments.
Smart manufacturing offers drivers that contribute to all three sustainability dimensions (e.g. Birkel and Müller, 2021). However, the drivers do not operate alone but are interdependent. with mutual interrelationships including cause-and-effect factors. While several articles have been published on this intersection, a substantial research gap still exists. Extant research mostly provides an overview of the sustainability aspects of smart manufacturing (e.g. Bohnsack et al., 2022). However, limited attention has been paid to these interrelations and the quantification of these effects (Birkel and Müller, 2021). In particular, the literature lacks a detailed overview of the interrelationships between all three dimensions of the triple bottom line (TBL).
Further, while some authors have discussed the interrelationships of barriers to sustainable manufacturing (e.g. Bag et al., 2022), this study considers the key sustainability potentials of digital technologies in smart manufacturing. It analyzes their interrelationships, focusing on previous research on social sustainability. Measuring human interoperability in relation to these potentials allows for the identification of mutually relationships (Flores et al., 2020). Hence, we aim to answer the following research question:
What is the role of human interoperability within the interrelationships of key sustainability potentials enabled by smart manufacturing technologies?
To answer this research question, this study highlighted the interrelationships between key environmental, economic, and social potentials within the TBL of sustainability. The selected approach first combined 44 expert interviews with a literature review. Second, a total of 68 experts evaluated the key potentials and their interrelationships in an online survey. Additionally, the analysis helped identify the cause-and-effect factors. The resulting insights can provide concrete recommendations for action in practice, offering an in-depth supplement to the extant literature.
2. Related literature and research gap
2.1 Smart manufacturing
The integration of advanced digital technologies into industrial production is a fundamental aspect of the ongoing digital transformation. Digitalization and connectivity characterize the levers that increase efficiency and productivity in smart manufacturing (Frank et al., 2019). This represents a novel approach to manufacturing in which the real and digital worlds are connected, offering new opportunities for real-time communication and autonomous functioning. The foundation of a smart factory is formed by digital technologies, including sensors, data processing units, and actuators, which enable the transfer of real-time data (Peruzzini et al., 2024). These technologies facilitate networking within industrial production, including human-to-human, human-to-object, and object-to-object interactions (Zhang et al., 2023). Additionally, real-time condition monitoring simplifies the remote diagnosis and control of production plants while assisting in the predictive maintenance of machines and production equipment (Frank et al., 2019).
Incorporating digital technologies establishes a comprehensive network connecting the entire value chain, including machines and data, with people. Smart devices are continuously trackable and locatable (Chiarini, 2021; Kong et al., 2021). Production orders can move autonomously through the manufacturing process, and machines can set themselves up and reorganize production when errors are detected. Consequently, the dependability of a smart factory is enhanced by its ability to predict and automatically circumvent potential production errors (Hussain et al., 2024). Standardized processes and data transparency are required to identify appropriate areas for implementing smart manufacturing technologies (Veile et al., 2020).
To explain the concept of advanced technologies in smart manufacturing, this study encompassed eleven core technologies for smart manufacturing, including smart sensors and actuators, Internet of Things (IoT), cyber-physical systems (CPS), AI, digital platforms, cloud computing, big data analytics, industrial robotics, XR, digital twin technology, and additive manufacturing (Peruzzini et al., 2024). These core technologies were mentioned by the majority of the experts and are listed in Table 1.
Smart manufacturing technologies
| Advanced technologies for smart manufacturing | Description | Reference |
|---|---|---|
| Smart sensors and actuators | Smart sensors, actuators, and radio-frequency identification technology can be fitted into machines, products, logistics vehicles, and similar items to monitor and track resources, measure processes, and transmit relevant data | Chiarini (2021) Pacheco et al. (2023) |
| Internet of Things | The IoT utilizes an information technology infrastructure to connect physical devices, facilitating the acquisition and dissemination of data. Moreover, it enables the integration of various services and applications to display information and detect issues | Kiel et al. (2017) |
| Cyber physical systems | The IoT refers to the large network of interconnected objects, whereas CPS connect physical devices to a central processing unit with software integration. This integration enables greater adaptability and enhances the quality of physical processes | Kamble et al. (2020a) |
| Artificial intelligence | AI facilitates the exchange of crucial information, executes necessary actions, and controls machines and processes autonomously. It involves intelligent machines operating independently, responding to changing conditions, and learning from previous tasks and outcomes. AI also enables the visualization and interpretation of the relevant information and meaning of process data | Bai and Sarkis (2017) |
| Digital platforms | Digital platforms connect actors and machines in manufacturing. Data are collected and made available to every user in real-time | Frank et al. (2019) |
| Cloud computing | Cloud computing allows industrial companies to access cloud provider resources such as data storage or analysis, eliminating the need for the company to invest in its own infrastructure | Frank et al. (2019) |
| Big data analytics | Big data analytics provides data analysis tools and algorithms, enabling better decision-making for industrial production | Müller et al. (2018) |
| Industrial robotics | Industrial robotics describes using robots in manufacturing operations to increase productivity and efficiency. Robots can support humans in hazardous and unsafe tasks | Kamble et al. (2020b), Bai and Sarkis (2017) |
| Extended reality | Augmented reality is a technology that superimposes digital content onto the real environment. Virtual reality is comparable to augmented reality, but instead of being overlaid, it shows a completely virtual process replicating a real one | Masood and Egger (2020), Souza Cardoso et al. (2020) |
| Digital twin technology | The digital twin is a virtual representation of systems or objects, allowing for simulations to be conducted and enabling intelligent decision-making, mapping the entire production process in the industrial metaverse is gaining attention | Hussain et al. (2024), Luo et al. (2023) |
| Additive manufacturing | Additive manufacturing, or 3D printing, is a technology directly related to production. It allows for the transformation of digital files into three-dimensional objects, such as spare parts, layer by layer | Hussain et al. (2024), Frank et al. (2019) |
2.2 Sustainability in industrial manufacturing
According to the World Commission on Environment and Development (1987), developing processes and practices without compromising future generations’ needs defines sustainability. Traditionally, companies have primarily focused on maximizing profits. However, prioritizing profit maximization without considering the environmental and social impacts of companies’ actions is no longer adequate (Glavič and Lukman, 2007). The TBL is a useful tool for understanding sustainability as a multidimensional concept (Elkington, 1997). This concept incorporates the environmental, economic, and social aspects to provide a comprehensive view of sustainability. Further, the TBL is the most frequently investigated construct in research on sustainable development through smart manufacturing (Khan et al., 2021). Therefore, this study incorporates the TBL as a definition of sustainability (Birkel and Müller, 2021).
Digital technologies in smart manufacturing provide new opportunities to achieve sustainable value (Bohnsack et al., 2022; Wei et al., 2024).
Environmental sustainability. Smart manufacturing has demonstrated its potential to significantly reduce scrap and waste, thereby minimizing environmental impacts (Veile et al., 2020). Digital technologies enhance energy and resource efficiency by producing high-quality parts within the same time frame. Additionally, the transparency achieved through smart manufacturing can facilitate the use of renewable energy and resources, reduce the necessity for transport and logistics processes by avoiding incorrect deliveries, and highlight their positive impacts on the environment (Sarkis and Zhu, 2018). For instance, smart sensors for emissions reduction can serve as early warning systems, making a substantial contribution to the environment (Chiarini, 2021).
Economic sustainability. Regarding economic advantages, smart manufacturing enables companies to enhance cost transparency and optimize their production planning, leading to increased efficiency and flexibility (Frank et al., 2019). By reducing lead times and improving their market share, companies can maintain their competitiveness and gain overall profits (Dubey et al., 2017). In addition, smart manufacturing facilitates the development of new business models, enhances energy efficiency, and promotes the use of renewable resources (Hussain et al., 2024).
Social sustainability. Smart manufacturing considerably affects social sustainability (Marcon et al., 2022; Wei et al., 2024). Safety can be enhanced by reducing accidents and creating more comfortable working environments for workers with disabilities (Souza Cardoso et al., 2020). This is achieved through the provision of training, higher salaries, and a decreased manual workload (Moon et al., 2023). Additionally, a qualification gap results from the transformation of manual jobs into those requiring digital expertise. Therefore, training, expanding, or replacing the workforce is crucial.
2.3 Human-centricity in smart manufacturing
In recent studies, the social dimension of sustainability has become particularly important. Originating in Industry 4.0, industrial research is evolving from data transfer and process automation to an even more holistic approach (Lu et al., 2022). Under the new paradigm of Industry 5.0, the focus is on human-centricity and resilience (Cillo et al., 2022; Ivanov, 2023). The human-centered dimension in particular influences current research streams on the social dimension of smart manufacturing. Recent studies have shown that the human factor is indispensable to sustainable manufacturing (e.g. Langås et al., 2025; Zahid et al., 2024). This is because employees who work with the new technologies are actively involved in their adoption and implementation through changing workplace settings (Zhang et al., 2023). Smart manufacturing structures combine human needs with technological efficiency (Lu et al., 2022). Human-machine collaboration occurs in human-robot (Langås et al., 2025; Peruzzini et al., 2024) and human-AI applications (Baig and Yadegaridehkordi, 2024). Thus, the human position has shifted from task execution to a supervisory role for machines’ self-executed activities. Employees observe production processes and intervene as necessary, supported by technological systems (Flores et al., 2020). However, the trustworthiness of smart manufacturing applications remains questionable; employees must trust the systems to be able to accept these applications (Zahid et al., 2024). Reservations generally come from an emotional and psychological perspective of fearing job loss or replacement by new technologies (Zhang et al., 2023).
2.4 Evaluating interrelationships
The dimensions of sustainability potentials in smart manufacturing are interrelated and have partially combined effects (Avrampou et al., 2019; Frank et al., 2019; Wei et al., 2024). They share several complementary goals. For instance, environmental sustainability can enhance economic sustainability because a positive environmental image can attract investors to a company. However, interdependencies between dimensions can also result in conflicts (Kiel et al., 2017). For example, the use of digital technologies in industrial production can improve economic sustainability by making processes more efficient. Hence, to assess sustainability potential, the interrelationships between economic, environmental, and social sustainability must be considered. Although this study focused on the positive aspects by examining the sustainability potential of industrial companies to suggest further improvements, the negative aspects should not be underestimated (e.g. Dieste et al., 2024; Rocha et al., 2025). Environmentally, the use of technology can be detrimental, leading to increased energy consumption (Bohnsack et al., 2022). Economically, the introduction of new technologies usually involves large investments and resources such as digital infrastructure and expertise (Peruzzini et al., 2024). In the social dimension, trust issues with new technologies may worsen employee well-being (Zahid et al., 2024).
Recent studies have identified sustainability potentials through qualitative analyses and literature reviews (e.g. Birkel and Müller, 2021; Khan et al., 2021). However, subsequent in-depth analyses have been lacking. Owing to their qualitative or literature-based approaches, the assumptions require a more detailed verification of the identified parameters. This study aims to offer a comprehensive picture of the utilization of digital technologies in smart manufacturing by determining the significance of key potentials and their cause-and-effect factors. It revealed the interrelationships between individual sustainability potentials and simplified future decision-making in the pursuit of objectives (Mangla et al., 2018). This methodology presents an opportunity to supplement qualitative data with quantitative analyses.
3. Methodology
Using two consecutive data collection methods, we comprehensively assessed the sustainability potentials of advanced digital technologies in smart manufacturing. First, we adopted a combined approach, including a literature review and 44 expert interviews with German companies, to explore the sustainability potentials that arise from using digital technologies in smart manufacturing.
Second, we utilized the nine most significant sustainability potentials identified through the literature review and expert interviews for a quantitative analysis using a DEMATEL survey with 68 respondents. This approach determined the potentials that can be achieved through digital technologies and their interrelationships. The methodological approach is illustrated in Figure 1.
 The framework begins with a large dashed rectangular box that contains two sections: Phase 1 on the left and Phase 2 on the right. On the left side, a text box labeled “Phase 1: Identification of key sustainability potentials” is positioned at the top. Two downward branches emerge from this Phase 1 box. The left branch contains a text box labeled “Literature review,” followed by a downward arrow pointing to another text box labeled “Open coding”. The right branch contains a text box labeled “Conduct expert interviews,” followed by a downward arrow pointing to a text box labeled “Open coding”. Both text boxes labeled “Open coding” on the left and right branches are connected with downward arrows that merge together and point toward a text box positioned below labeled “Combine and discuss codes in multiple discussion rounds”. A downward arrow emerges from this text box and points toward another text box positioned below labeled “Finalization of codes and identification of key sustainability potentials”. On the right side, at the top, a text box labeled “Phase 2: Conducting a D E M A T E L survey” is positioned. The final text box from Phase 1, labeled “Finalization of codes and identification of key sustainability potentials,” connects to Phase 2 with a rightward arrow extending to the top right. Below the Phase 2 heading, four vertically arranged text boxes are connected by downward arrows. The first box below the heading is labeled “Build an online questionnaire matrix according to the key sustainability potentials,” followed by a downward arrow pointing to the second box labeled “Search for experts”. Another downward arrow connects to the third box labeled “Conduct online survey,” and the final downward arrow points to the fourth box labeled “Develop an average direct influence matrix”. Outside the dashed box, positioned below, a single downward arrow in the center leads to another section labeled “Phase 3: Analyzing relationships”. Below this heading, four vertically aligned text boxes are arranged and connected by downward arrows. These boxes are labeled sequentially as “Normalize the initial direct influence matrix,” followed by a downward arrow pointing to the second box labeled “Calculate the total influence matrix”. Another downward arrow connects to the third box labeled “Calculate a threshold value,” and the final downward arrow points to the fourth box labeled “Produce the causal diagram”.
Research approach. Source: Authors’ own work
The framework begins with a large dashed rectangular box that contains two sections: Phase 1 on the left and Phase 2 on the right. On the left side, a text box labeled “Phase 1: Identification of key sustainability potentials” is positioned at the top. Two downward branches emerge from this Phase 1 box. The left branch contains a text box labeled “Literature review,” followed by a downward arrow pointing to another text box labeled “Open coding”. The right branch contains a text box labeled “Conduct expert interviews,” followed by a downward arrow pointing to a text box labeled “Open coding”. Both text boxes labeled “Open coding” on the left and right branches are connected with downward arrows that merge together and point toward a text box positioned below labeled “Combine and discuss codes in multiple discussion rounds”. A downward arrow emerges from this text box and points toward another text box positioned below labeled “Finalization of codes and identification of key sustainability potentials”. On the right side, at the top, a text box labeled “Phase 2: Conducting a D E M A T E L survey” is positioned. The final text box from Phase 1, labeled “Finalization of codes and identification of key sustainability potentials,” connects to Phase 2 with a rightward arrow extending to the top right. Below the Phase 2 heading, four vertically arranged text boxes are connected by downward arrows. The first box below the heading is labeled “Build an online questionnaire matrix according to the key sustainability potentials,” followed by a downward arrow pointing to the second box labeled “Search for experts”. Another downward arrow connects to the third box labeled “Conduct online survey,” and the final downward arrow points to the fourth box labeled “Develop an average direct influence matrix”. Outside the dashed box, positioned below, a single downward arrow in the center leads to another section labeled “Phase 3: Analyzing relationships”. Below this heading, four vertically aligned text boxes are arranged and connected by downward arrows. These boxes are labeled sequentially as “Normalize the initial direct influence matrix,” followed by a downward arrow pointing to the second box labeled “Calculate the total influence matrix”. Another downward arrow connects to the third box labeled “Calculate a threshold value,” and the final downward arrow points to the fourth box labeled “Produce the causal diagram”.Research approach. Source: Authors’ own work
3.1 Phase 1: identification of key sustainability potentials
To identify the key sustainability potentials, we conducted a literature review and semi-structured interviews with 44 industry experts. We identified industry experts based on their expertise in smart manufacturing and knowledge of digital technologies. Consistent with the recommendations of Gioia et al. (2013), we conducted the qualitative analysis in three phases: data sampling, data collection, and data analysis.
Data sampling. Based on the five-step approach of Denyer and Tranfield (2009), we conducted a literature review to gain insights into relevant theoretical studies. We found appropriate studies by scanning several articles using the keywords advanced digital technologies, smart manufacturing and sustainability potentials. We combined these keywords across multiple databases (EBSCOhost, Scopus, and IEEE Explore) with AND/OR connectors. These data bases have been successfully used in recent studies (e.g. Zupic and Čater, 2015). Starting with 3,095 scientific articles, we excluded duplicates (n = 2,475), low-quality articles based on an SJR ranking below Q1 (n = 731), and articles that did not fit our thematic fit, lacking aspects such as manufacturing focus and the sustainability potentials of advanced technologies. Consequently, 117 scientific articles were selected for further validation. We combined various statements into codes, which were then compared with the interviews. The exact procedure for the analysis is described in data analysis below.
We also conducted 44 interviews with experts from industrial companies. The companies listed in Table A1 in the Appendix varied in terms of size and manufacturing industry sectors, allowing for the generalization of results and mitigation of potential biases (Edmondson and Mcmanus, 2007). The industry sectors included the automotive, mechanical engineering, electrical, and metal industries. Thus, we analyzed industry sectors with comparable properties rather than the consumer industry or medical equipment with typically different standards and approaches. We identified appropriate experts from these companies based on their professional knowledge of smart manufacturing, experience with smart manufacturing technologies and positions within the company, such as top-level or manufacturing management. This careful selection process ensured the reliability and validity of our results (Eisenhardt and Graebner, 2007).
Data collection. The semi-structured interviews were conducted between September and November 2023. Anonymity was guaranteed to all the experts. The interview guideline (see Appendix Table A2) comprised open- and closed-ended questions, allowing for the collection of data in a structured manner while capturing unexpected insights through follow-up questions (Yin, 2018). All interviews were recorded and subsequently transcribed.
Data analysis. Based on the recent literature and expert interviews, the coding process entailed the sequential development of first-order concepts and aggregate dimensions (Gioia et al., 2013). To categorize the sustainability potentials of digital technology in the manufacturing sector, we utilized the TBL dimensions to aggregate the theoretical dimensions. After several iterations and discussion rounds between the three researchers, including the coding from recent studies, we identified three of the most significant sustainability potentials for each TBL dimension. These included energy conservation (F1), material saving (F2), emission reduction (F3), data efficiency (F4), process optimization (F5), cost reduction (F6), employee motivation (F7), employee qualification (F8) and employee support (F9).
3.2 Phase 2: conducting a DEMATEL survey
The DEMATEL technique uses matrices and digraphs to visualize the structure of complex causal relationships. Unlike conventional multiple-criteria decision-making strategies, it does not depend on the assumption of independence among the criteria (Mangla et al., 2018). Therefore, the analysis can include criteria with conceptual interdependencies. By utilizing these insights, decision-makers can identify, scrutinize, and confirm direct and indirect connections between all components of a system.
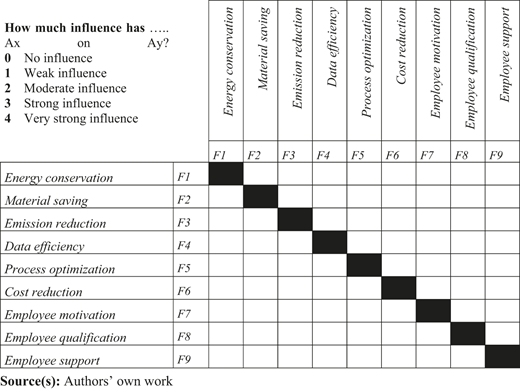
To analyze the interrelationships of sustainability potentials identified in the initial interview study, we created an online questionnaire (see Appendix Table A3). To ensure the validity of the results, a general comprehension question was included. In addition, we gathered the participants’ demographic information and their relationships with digital technologies in smart manufacturing. If the participants were familiar with the topic because of their profession, we asked additional questions regarding the size and industrial sector of their companies. Finally, the participants were asked to rate the direct influence of factor on the remaining factor . The factors corresponding to the sustainability potentials from the first study were energy conservation (F1), material saving (F2), emission reduction (F3), data efficiency (F4), process optimization (F5), cost reduction (F6), employee motivation (F7), employee qualification (F8) and employee support (F9).
The online survey was conducted from November 2023 to January 2024, and potential participants were invited to participate via email, LinkedIn, or private contacts. Three criteria were applied to identify potential experts. First, the experts were familiar with smart manufacturing technologies. Second, the experts were aware of sustainability potentials. Third, the experts could identify interrelationships through their work experience. We included practice and research experts to incorporate their perspectives on future developments using the same criteria. After closing the survey, we recorded 79 completed questionnaires. We excluded responses from participants who answered the comprehension question incorrectly, were unrelated to the topic of digital technologies in manufacturing, or had insufficient experience with digital technologies in manufacturing. Through this process, 11 responses were excluded from the sample, resulting in a final sample of 68 valid responses. The sample comprised 29 women and 39 men. A total of 45 participants had regular contact with smart manufacturing technologies at work, and 23 had gained insights through in-depth studies. The sectors included the automotive (n = 10), mechanical engineering (n = 13), electrical (n = 11), chemical (n = 3), food (n = 1), aviation (n = 1), and research and service management (n = 29) industries. To enhance the generalizability of the results, we recruited a large sample, compared to extant studies using similar methods having typically less than ten participants (e.g. Samaranayake et al., 2024). In doing so, we aimed to provide results that could be transferred to and would be valid in several contexts.
3.3 Phase 3: analyzing relationships
Following data collection, we used a five-step approach for the analysis (Wu et al., 2015).
Step 1: Creating the direct influence matrix. To examine the relationships between the nine () factors , each of the 68 respondents () was asked to indicate the degree of the direct influence of factor on factor . The degree of influence was measured using an integer scale of “no influence (0)”, “low influence (1)”, “medium influence (2)”, “high influence (3)”, and “very high influence (4)”. Subsequently, we created tan individual direct influence matrix for every th expert, where represents the judgment of the corresponding expert regarding the influence of factor on factor . Owing to the pairwise comparison, all entries where equaled 0. We obtained group direct influence matrix by calculating the average for every entry for all 68 experts using Equation (1).
Step 2: Normalizing the initial direct influence matrix. Using Equations (2) and (3), the group direct influence matrix was normalized to produce the normalized direct influence matrix :
Step 3: Calculating the total influence matrix. The total influence matrix is obtained using Equation (4), where represents the identity matrix:
Step 4: Calculating a threshold value. Because the total influence matrix shows all effects between the factors of the system, negligible effects must be filtered out. Therefore, we calculated the threshold value using Equation (5) and highlighted all values in the total influence matrix that exceeded this threshold. These represent the most critical influences of system factors. Although other methods exist, we defined a threshold value consistent with extant studies (Pan and Nguyen, 2015) by calculating the average value of all elements within matrix , where N represents the total number of elements .
Step 5: Producing the causal diagram. The vectors and were obtained by summing the rows and columns of the total influence matrix separately using Equations (6)-(8). First, the horizontal axis vector called “Importance” was calculated by adding vector to vector . In the vector representation, each row indicates the importance of the corresponding factor . Second, the vertical axis vector called “Relation” was obtained by subtracting vector from vector . The results indicated the net effect of each factor on the system. If the result of is positive, factor has a net influence on the remaining factors in the system and belongs to the cause group. Conversely, a negative result for indicates that factor is primarily influenced by the other factors in the system and, therefore, belongs to the effect group. Finally, we mapped the dataset of onto an influential relation map, making it easy to identify the importance and relationships of all the factors within the system.
4. Findings
Based on the interviews, we identified nine key potentials according to the TBL’s sustainability dimensions (Section 4.1), followed by an analysis of their interrelationships (Section 4.2).
4.1 Key sustainability potentials
First, we identified sustainable potentials through the qualitative analysis, including a literature review and 44 expert interviews. The key sustainability potentials represented the three most important factors in each dimension of the TBL. Environmental potentials included energy conservation (F1), material saving (F2), and emission reduction (F3). Economic potentials included data efficiency (F4), process optimization (F5), and cost reduction (F6). Social potentials comprised employee motivation (F7), employee qualification (F8), and employee support (F9). Table 2 shows the nine key sustainability potentials, which are briefly described below.
Nine sustainability potential dimensions derived from interviews and the literature
| Dimension | Key sustainability potentials | Exemplary literature sources | Number of interviews mentioned | |
|---|---|---|---|---|
| Environmental sustainability | F1 | Energy conservation | Cao et al. (2020) Veile et al. (2020) | 21 |
| F2 | Material saving | Hussain et al. (2024) Khan et al. (2021) | 12 | |
| F3 | Emission reduction | Avrampou et al. (2019) Veile et al. (2020) | 11 | |
| Economic sustainability | F4 | Data efficiency | Bohnsack et al. (2022) Kong et al. (2021) | 35 |
| F5 | Process optimization | Bai and Sarkis (2017) Kamble et al. (2020a) Oliveira Santos et al. (2020) | 33 | |
| F6 | Cost reduction | Veile et al. (2020) Yadav et al. (2020) | 17 | |
| Social sustainability | F7 | Employee motivation | Kreye (2016) Salimian et al. (2021) | 15 |
| F8 | Employee qualification | Wei et al. (2024) Luthra et al. (2020) Aldieri et al. (2021) | 12 | |
| F9 | Employee support | Souza Cardoso et al. (2020) Moon et al. (2023) | 11 | |
F1: Energy conservation. The heat generated during production is re-utilized for heat recovery. Digital technologies facilitate optimal distribution and limit external energy requirements (E18). Further, processes with high energy consumption are identified and optimized. Real-time data from production enables successful quality management and reduces unused energy (E27). Energy is a significant cost element for businesses, making it a key consideration in the manufacturing sector (Cao et al., 2020).
F2: Material saving. Material saving involves the reliable use of resources, beginning in the design phase of a product through the use of digital twins (E1, E25). This is because a substantial portion of the future material consumption is already determined during the design phase (Khan et al., 2021). Additionally, well-planned production programs can ensure the efficient use of required materials (E39). A recycling system supported by AI enables the reuse of surplus materials from production (Nascimento et al., 2019), ensuring the responsible use of materials (E25).
F3: Emission reduction. To reduce emissions, companies can use advanced digital technologies to optimize transport routes between production steps and achieve optimum capacity utilization, thereby eliminating empty runs (E3, E34). Additionally, machine emissions can be reduced by optimizing them in the industrial metaverse or using smart sensors with an early warning function (E36).
F4: Data efficiency. Data possess a different meaning in smart manufacturing, forming the basis for using various technologies such as generative AI (E12, E44). Digital technologies support the generation, collection, and analysis of data as the first step (E38). This enables the creation of added value beyond the production of products (Bohnsack et al., 2022). For instance, efficient data handling can help to develop specific recommendations for production and increase customer satisfaction (E14, E20).
F5: Process optimization. The digital mapping of processes enables the optimization of various production steps. Unused times are uncovered and filled with optimum production programs (E39). Error-prone processes are identified and monitored separately (E34). Relocating production to the industrial metaverse allows processes to be tested virtually before being executed in the real world (E1).
F6: Cost reduction. Incorporating digital technologies can achieve cost savings in production by reducing the number of workers through the use of robotic systems or planning for optimum capacity utilization (E3, E9). Information systems can also be used to monitor ongoing production and identify unnecessary costs (Veile et al., 2020).
F7: Employee motivation. Digital technologies make employees more comfortable in their work environment through additional support functions (E27, E29), which foster a positive working atmosphere. This increases productivity and the employer’s attractiveness (E37). Accordingly, employees feel valued and motivated to complete tasks (E5).
F8: Employee qualification. Digital technologies upskill employees. Augmented and virtual reality make it possible to perform tasks on a machine from any location (E7). Errors can be detected more quickly, by integrating other experts using these systems (Luthra et al., 2020). Generative AI also supports employees in their decisions (E33) and offers innovative solutions based on a wide range of data (E35, E38).
F9: Employee support. The use of digital technologies, such as CPS, assists employees in performing their tasks (E9) by making difficult tasks easier or eliminating them (E25). This allows the employees to focus on other tasks. Human error is also minimized, thereby reducing the pressure on individual employees (E19, E27).
4.2 Analysis of interrelationships
Once the key potentials were validated by the experts, the second step was to examine their interrelationships. Potentials can only be realized once the relationships are explored. The average direct influence matrix presented in Table 3 is based on 68 datasets from an online survey of industrial companies and research institutions. According to the average direct influence matrix (Table 3), the normalized direct influence matrix (Table 4) was built. Finally, in a further step the relationships are presented in the total influence matrix (Table 5).
Average direct influence matrix
| F1 | F2 | F3 | F4 | F5 | F6 | F7 | F8 | F9 | |
|---|---|---|---|---|---|---|---|---|---|
| F1 | 0 | 1.6912 | 2.9706 | 1.2059 | 2.0441 | 2.9265 | 1.2500 | 0.8529 | 0.8824 |
| F2 | 2.8382 | 0 | 2.8824 | 1.1176 | 1.9412 | 2.9559 | 1.1912 | 0.8971 | 1.5000 |
| F3 | 2.5735 | 1.7794 | 0 | 1.2647 | 1.9118 | 2.0147 | 1.5441 | 0.7647 | 0.8824 |
| F4 | 2.3971 | 2.0294 | 2.0882 | 0 | 2.9706 | 2.5588 | 1.6471 | 1.4853 | 2.0735 |
| F5 | 2.9559 | 2.8382 | 2.7794 | 2.6324 | 0 | 3.1618 | 2.3676 | 1.9265 | 2.9118 |
| F6 | 2.3235 | 2.3088 | 1.9412 | 1.7647 | 2.7059 | 0 | 1.8529 | 1.5147 | 1.5147 |
| F7 | 1.6618 | 1.6176 | 1.4706 | 1.6618 | 2.5441 | 1.9118 | 0 | 2.3824 | 2.2794 |
| F8 | 1.8676 | 2.0588 | 1.7647 | 2.3235 | 2.8529 | 2.2500 | 2.5441 | 0 | 2.1176 |
| F9 | 0.9853 | 0.8235 | 0.7794 | 1.3971 | 2.0735 | 1.8088 | 3.2794 | 1.7353 | 0 |
Normalized direct influence matrix
| F1 | F2 | F3 | F4 | F5 | F6 | F7 | F8 | F9 | |
|---|---|---|---|---|---|---|---|---|---|
| F1 | 0 | 0.0784 | 0.1377 | 0.0559 | 0.0948 | 0.1357 | 0.0579 | 0.0395 | 0.0409 |
| F2 | 0.1316 | 0 | 0.1336 | 0.0518 | 0.0900 | 0.1370 | 0.0552 | 0.0416 | 0.0695 |
| F3 | 0.1193 | 0.0825 | 0 | 0.0586 | 0.0886 | 0.0934 | 0.0716 | 0.0354 | 0.0409 |
| F4 | 0.1111 | 0.0941 | 0.0968 | 0 | 0.1377 | 0.1186 | 0.0763 | 0.0688 | 0.0961 |
| F5 | 0.1370 | 0.1316 | 0.1288 | 0.1220 | 0 | 0.1466 | 0.1097 | 0.0893 | 0.1350 |
| F6 | 0.1077 | 0.1070 | 0.0900 | 0.0818 | 0.1254 | 0 | 0.0859 | 0.0702 | 0.0702 |
| F7 | 0.0770 | 0.0750 | 0.0682 | 0.0770 | 0.1179 | 0.0886 | 0 | 0.1104 | 0.1057 |
| F8 | 0.0866 | 0.0954 | 0.0818 | 0.1077 | 0.1322 | 0.1043 | 0.1179 | 0 | 0.0982 |
| F9 | 0.0457 | 0.0382 | 0.0361 | 0.0648 | 0.0961 | 0.0838 | 0.1520 | 0.0804 | 0 |
Total influence matrix with α = 0.3104
| F1 | F2 | F3 | F4 | F5 | F6 | F7 | F8 | F9 | |
|---|---|---|---|---|---|---|---|---|---|
| F1 | 0.2333 | 0.2747 | 0.3448 | 0.2278 | 0.3262 | 0.3726 | 0.2524 | 0.1890 | 0.2209 |
| F2 | 0.3694 | 0.2179 | 0.3606 | 0.2384 | 0.3424 | 0.3958 | 0.2677 | 0.2033 | 0.2597 |
| F3 | 0.3232 | 0.2633 | 0.2078 | 0.2176 | 0.3044 | 0.3211 | 0.2498 | 0.1757 | 0.2091 |
| F4 | 0.3866 | 0.3354 | 0.3620 | 0.2184 | 0.4210 | 0.4197 | 0.3201 | 0.2538 | 0.3161 |
| F5 | 0.4650 | 0.4154 | 0.4429 | 0.3704 | 0.3609 | 0.5053 | 0.3989 | 0.3095 | 0.3933 |
| F6 | 0.3645 | 0.3290 | 0.3384 | 0.2783 | 0.3896 | 0.2921 | 0.3092 | 0.2413 | 0.2780 |
| F7 | 0.3308 | 0.2968 | 0.3111 | 0.2729 | 0.3803 | 0.3663 | 0.2311 | 0.2756 | 0.3073 |
| F8 | 0.3744 | 0.3446 | 0.3565 | 0.3245 | 0.4282 | 0.4174 | 0.3651 | 0.1984 | 0.3284 |
| F9 | 0.2628 | 0.2306 | 0.2435 | 0.2328 | 0.3219 | 0.3171 | 0.3323 | 0.2274 | 0.1823 |
The total influence matrix shows the importance of the individual key potentials (rj + cj). It also allows conclusions to be drawn about the relationships based on the cause-and-effect groups (rj−cj). A detailed illustration of the individual key figures is presented in Table 6.
Given and received influence between factors
| Factors | TBL dimensions | Sustainability potentials | (ri + cj) | Rank | (ri−cj) | Cause/Effect |
|---|---|---|---|---|---|---|
| F1 | Environmental | Energy conservation | 5.5516 | 3 | −0.6683 | Effect |
| F2 | Material saving | 5.3629 | 6 | −0.0527 | Effect | |
| F3 | Emission reduction | 5.2397 | 7 | −0.6956 | Effect | |
| F4 | Economic | Data efficiency | 5.4139 | 5 | 0.6519 | Cause |
| F5 | Process optimization | 6.9366 | 1 | 0.3868 | Cause | |
| F6 | Cost reduction | 6.2280 | 2 | −0.5869 | Effect | |
| F7 | Social | Employee motivation | 5.4986 | 4 | 0.0456 | Cause |
| F8 | Employee qualification | 5.2114 | 8 | 1.0635 | Cause | |
| F9 | Employee support | 4.8457 | 9 | −0.1444 | Effect |
Importance. According to the rank of the key potentials based on expert opinions, process optimization (F5) was the highest ranked potential with a value of 6.9366, followed by cost reduction (F6) 6.2280, energy conservation (F1) 5.55163, employee motivation (F7) 5.4986, data efficiency (F4) 5.4139, material saving (F2) 5.3629, emission reduction (F3) 5.2397, employee qualification (F8) 5.2114, and employee support (F9) 4.8457.
Unsurprisingly, the industrial focus is still on economic potentials, with optimized processes and low costs being the main drivers of sustainable smart manufacturing. This is due to the cost-driven approach of companies, whose main goal is to generate as much profit as possible by minimizing costs.
The importance of environmental aspects appears relatively low, which is surprising because sustainability goals typically focus on environmental sustainability. However, energy savings are particularly significant compared with the other two potential areas. This is likely because energy consumption is also a cost driver; therefore, unnecessary energy usage should be avoided.
Employee qualifications, motivation and support should not be considered less important than the other aspects. However, the social sustainability dimension has not yet been fully realized by industrial companies and is given less importance based on their rank.
Effect group. The factors emission reduction (F3) (−0.6956), energy conservation (F1) (−0.6683), cost reduction (F6) (−0.5869), employee support (F9) (−0.1444), and material saving (F2) (−0.0527) categorize the effect key sustainability potentials.
The key potentials of the cause group influence the effect group potentials. The environmental potentials are particularly prominent as effects but not as causes. This is surprising because companies could be expected to prioritize these aspects owing to current demands from customers and society. However, because of the network of relationships, other potentials strongly affect these potentials.
Moreover, cost reduction is considered an important factor of the effect group. Companies generally view cost reduction as a means of unlocking further potentials within the company. However, this is often based on other cause factors.
The only social benefit categorized as an effect dimension is employee support. Advanced digital technologies in manufacturing are expected to provide relief to employees. By contrast, employee qualification serves as a strong cause factor.
Cause group. The cause group of the key sustainability potentials includes employee qualification (F8) (1.0635), data efficiency (F4) (0.6519), process optimization (F5) (0.3868), and employee motivation (F7) (0.0456).
The qualifications of employees are a strong factor for the cause group and influence all other key sustainability potentials. Training employees using digital technologies can unlock additional potentials. First, the virtualization of production processes can enhance training by introducing multiple scenarios. Second, it is possible to train without harming oneself and practice making errors without wasting material. For example, when using XR, employees can prevent contact with the contained material and remain safe in hazardous situations.
Data efficiency affects other factors in sustainable smart manufacturing in several ways, highlighting the importance of data generation and analysis using advanced digital technologies. For example, optimizing processes can increase production efficiency and reduce costs.
Employee motivation is the second key social sustainability potential. We argue that intrinsically motivated employees are more open to new technologies, and thus, are more willing to accept them.
Single-sided and multisided connections. Considering the total influence matrix (Figure 2), this study identified both single-sided and multisided connections. The threshold value classifies multisided (higher) and single-sided (lower) connections. In this study, the threshold value represented the average (α = 0.3104).
 The causal diagram shows a scatter plot with the horizontal axis labeled “(r j plus c j)” ranging from 4 to 7.5 in increments of 0.5 units and the vertical axis labeled “(r j minus c j)” ranging from negative 1.0 to 1.5 in increments of 0.5 units. The diagram contains nine labeled circular nodes connected by multiple directional arrows. The nine nodes are labeled as follows: “F 1: Energy conservation,” “F 2: Material savings,” “F 3: Emission reduction,” “F 4: Data efficiency,” “F 5: Process optimization,” “F 6: Cost reduction,” “F 7: Employee motivation,” “F 8: Employee qualification,” and “F 9: Employee support”. The coordinates of the points are F 1 at (5.54, negative 0.659), F 2 at (5.357, negative 0.03), F 3 at (5.236, negative 0.692), F 4 at (5.405, 0.665), F 5 at (6.936, 0.4), F 6 at (6.216, negative 0.574), F 7 at (5.488, 0.058), F 8 at (5.206, 1.083), and F 9 at (4.841, negative 0.132). Some pointing arrows and some double-headed arrows connect the nodes. The double-headed arrows are as follows: one connects F 4 and F 5, another connects F 9 and F 5, one connects F 2 and F 5, one connects F 7 and F 5, one connects F 2 and F 6, one connects F 3 and F 1, one connects F 3 and F 6, one connects F 1 and F 5, one connects F 1 and F 6, and one connects F 6 and F 5. The eight downward-pointing arrows emerge from F 8 and connect to F 1, F 2, F 3, F 4, F 5, F 6, F 7, and F 9. The six-pointing arrows emerge from F4 and connect to F 9, F 3, F 2, F 7, F 1, and F 6. The two right-pointing arrows emerge from F 9 and connect to F 7 and F 6. The two right-pointing arrows emerge from F 2 and connect to F 3 and F 1. The three downward-pointing arrows emerge from F 7 and connect to F 3, F 1, and F 6. The one downward-pointing arrow emerges from F 5 and connects to F 3.
Single-sided and multisided connections. Source: Authors’ own work
The causal diagram shows a scatter plot with the horizontal axis labeled “(r j plus c j)” ranging from 4 to 7.5 in increments of 0.5 units and the vertical axis labeled “(r j minus c j)” ranging from negative 1.0 to 1.5 in increments of 0.5 units. The diagram contains nine labeled circular nodes connected by multiple directional arrows. The nine nodes are labeled as follows: “F 1: Energy conservation,” “F 2: Material savings,” “F 3: Emission reduction,” “F 4: Data efficiency,” “F 5: Process optimization,” “F 6: Cost reduction,” “F 7: Employee motivation,” “F 8: Employee qualification,” and “F 9: Employee support”. The coordinates of the points are F 1 at (5.54, negative 0.659), F 2 at (5.357, negative 0.03), F 3 at (5.236, negative 0.692), F 4 at (5.405, 0.665), F 5 at (6.936, 0.4), F 6 at (6.216, negative 0.574), F 7 at (5.488, 0.058), F 8 at (5.206, 1.083), and F 9 at (4.841, negative 0.132). Some pointing arrows and some double-headed arrows connect the nodes. The double-headed arrows are as follows: one connects F 4 and F 5, another connects F 9 and F 5, one connects F 2 and F 5, one connects F 7 and F 5, one connects F 2 and F 6, one connects F 3 and F 1, one connects F 3 and F 6, one connects F 1 and F 5, one connects F 1 and F 6, and one connects F 6 and F 5. The eight downward-pointing arrows emerge from F 8 and connect to F 1, F 2, F 3, F 4, F 5, F 6, F 7, and F 9. The six-pointing arrows emerge from F4 and connect to F 9, F 3, F 2, F 7, F 1, and F 6. The two right-pointing arrows emerge from F 9 and connect to F 7 and F 6. The two right-pointing arrows emerge from F 2 and connect to F 3 and F 1. The three downward-pointing arrows emerge from F 7 and connect to F 3, F 1, and F 6. The one downward-pointing arrow emerges from F 5 and connects to F 3.Single-sided and multisided connections. Source: Authors’ own work
Employee qualification offers only a single-sided connection with all other attributes. Therefore, this key potential has a strong influence on other potentials, but other potentials have little influence on employee qualification. The other two social sustainability potentials (employee motivation and employee support) have predominantly one-sided connections. However, both have a two-way relationship with process optimization.
Regarding economic potentials, data efficiency has the most one-sided connections, influencing other potentials. Only process optimization is multi-directional in this TBL dimension. Cost reduction and process optimization have almost exclusively multilateral connections with all other key sustainability potentials. This emphasizes their importance in industrial contexts. Regarding environmental potentials, almost exclusively multilateral connections with other environmental potentials were observed, disregarding the social and economic TBL dimensions.
For all three environmental potentials, only a one-sided connection was observed with employee support. Regarding material saving, the only multisided connection is with cost reduction. Figure 2 shows the single-sided and multisided connections.
5. Discussion
Smart manufacturing unlocked the possibility of performing several processes in a digital environment. The digitalization of processes offers several potential benefits for sustainability that are interrelated as cause-and-effect factors (e.g. Birkel and Müller, 2021; Varriale et al., 2025). Interestingly, all environmental TBL factors were identified as effect dimensions. For the economic and social TBL dimensions, only one factor was identified as an effect dimension, whereas two factors each were identified as causes. Thus, by classifying causes and effects, we contribute to a better understanding of TBL dimensions.
Our findings indicated that the anticipated environmental sustainability outcomes associated with smart manufacturing were contingent on several other factors. These potentials were identified as effect factors and were mutually influenced by other factors. For instance, by qualifying employees for optimal technology use, waste can be reduced, and materials can be saved. This contributes to the understanding of human-centricity in achieving further sustainability potentials (Ivanov, 2023). Besides reducing resource consumption, smart manufacturing technologies can enhance the cost-effectiveness of production (Avrampou et al., 2019; Souza Cardoso et al., 2020). Cost was identified as an effect factor; therefore, it was affected by other factors. For instance, when processes are optimized, costly errors can be detected early.
Despite the increasing prevalence of autonomous digital technologies, which are often driven by AI, humans are a crucial element in the execution and monitoring of these systems, highlighting the concept of human-centricity as an enabler of further sustainability potentials (Ivanov, 2023; Peruzzini et al., 2024). The social dimension has been comparatively less regarded in previous research on smart manufacturing (Zhang et al., 2023). However, recent research has highlighted the importance of the human factor in smart manufacturing environments (e.g. Rocha et al., 2025; Zahid et al., 2024). Our findings confirm the importance of this dimension. Complementary to recent Industry 5.0 approaches, the human dimension strongly affects other dimensions (Ivanov, 2023). Employee motivation and qualification were identified as cause factors. Targeting employee training offers potentials for other sustainability dimensions, reinforcing the necessity to prioritize qualifications; thus, humans act as decision-makers in technology adoption and implementation (Wei et al., 2024).
Human interoperability serves as the cornerstone for realizing the sustainability benefits of smart manufacturing. Standardizing interfaces, ontologies, and cross-functional communication protocols reduces cognitive load, shortens training cycles, and strengthens collaboration in human-machine teams. As human interoperability improves, decision-making becomes faster and more inclusive, transforming process optimization into environmental savings, along with the economic rationale for smart manufacturing (Flores et al., 2020).
6. Conclusion
This study identified nine key sustainability potentials in accordance with the TBL dimensions through a qualitative study, including a literature review and expert interviews. The interrelationships between these potentials were comprehensively analyzed, and the cause-and-effect factors were determined. These findings indicated that the human factor is crucial for effectively using advanced digital technologies.
6.1 Theoretical contribution and propositions for further research
This study contributes to the literature by demonstrating the interrelationships between the key sustainability potentials of advanced digital manufacturing technologies (Hussain et al., 2024; Wei et al., 2024). It provides a cross-dimensional perspective on all three TBL dimensions. The findings extend the research that focuses on environmental or economic aspects but not on the interrelationships with social sustainability between all three dimensions (Birkel and Müller, 2021; Ivanov, 2023).
In detail, employee qualifications influenced other key sustainability potentials but was not influenced by other potentials. Hence, we extended the view that employee qualification is a crucial factor in smart manufacturing technologies (Müller et al., 2018; Wei et al., 2024). Further, employee support and employee motivation mutually influenced process optimization. Hence, by extending the findings on social sustainability, we found the human factor is decisive in realizing the potential of smart manufacturing technologies (Frank et al., 2019; Peruzzini et al., 2024). A further analysis of the impact of human operators can be conducted through field studies in smart manufacturing environments (Ivanov, 2023). Tus, we propose the following.
The impact of employee motivation and qualification acts as an enabler for output and green production techniques by enhancing human interoperability.
Regarding data efficiency, we found that several one-sided connections were influenced by other potentials. Hence, to achieve data efficiency, several other factors act as enablers (Kong et al., 2021). Further, process optimization mutually influenced with data efficiency, highlighting that the extant process must be optimized to enhance data efficiency, and vice versa. Thus, we extended existing research by quantifying this relationship, which has mostly been described qualitatively (Bohnsack et al., 2022; Müller et al., 2024). We suggest investigating the drivers of data efficiency, leading to the following proposition.
Data handling remains a core activity in smart manufacturing.
Cost reduction and process optimization had multilateral connections almost exclusively. This confirmed that many industrial companies focus on cost efficiency as an enabler and outcome of many decisions in smart manufacturing technologies, thus extending the extant research (Yadav et al., 2020). Further, cost-driven approaches are at the core of many industrial firms’ decisions (Peruzzini et al., 2024). Thus, enhancing economic aspects while enabling environmental and social potentials is the second core contribution of this study (Chiarini, 2021; Marcon et al., 2022; Sarkis and Zhu, 2018). Hence, we suggested the validation of our results in the following proposition.
Cost-driven logics must be regarded as interrelated with further sustainability potentials.
6.2 Managerial implications
In managerial practice, following a specific sustainability potential can lead to the optimization of other potentials. These findings can assist decision-makers in industrial companies to effectively plan their sustainability efforts by considering the human factor. We summarized our recommendations for managers as follows.
First, this study highlights how companies can efficiently achieve their sustainability goals by including advanced technologies in smart manufacturing. Managers should recognize the connection between digital technologies and sustainability. Digital technologies can bring transparency to value chains, which can help improve processes and workplace settings. Simultaneously, addressing multiple potentials can help managers effectively implement advanced digital technologies in their smart manufacturing environments. Although cost-driven logics must be considered, the human factor should not be overlooked.
Second, companies are forced to become more sustainable and use advanced digital technologies. The optimal pursuit of objectives creates synergies between economic, environmental, and social potentials, as highlighted by the results. By emphasizing the interrelationships between the sustainability dimensions and the human operators’ importance, the synergies impact each other. Therefore, positive and negative interactions should be considered.
Third, our results demonstrated that digital technologies can enhance employee well-being and improve economic and environmental efficiencies. So far, many companies have prioritized economic potential over social factors; however, our results indicated that both are interrelated. Thus, managers should consider these interrelated potentials and support employee training on the use of advanced technologies to unlock further potential. Employee qualifications unlock several potentials in other TBL dimensions. Hence, they should be developed simultaneously, emphasizing their interrelationships.
6.3 Limitations and future research
Our results highlighted the complex interrelationships between key sustainability potentials when using advanced digital technologies in smart manufacturing as well as the importance of the human factor. Our sample was limited to German manufacturing firms and contained a self-reported cross-sectional dataset. This led to several limitations regarding generalizability. Hence, for future research, we recommend a longitudinal study in additional countries that potentially integrate secondary data, such as performance, supplier, or customer data, to validate our findings. Furthermore, additional decision-making techniques such as the analytic hierarchy process, the technique for order of preference by similarity to ideal solution, and the best-worst method can be utilized to verify the results.
Existing studies on smart manufacturing typically focus on technical aspects. However, our findings indicated that social aspects should not be overlooked. Consequently, research must investigate the effects of employee deployment, establishing a clear link between the employees and the benefits of using technology. As our findings demonstrated that successfully implementing digital technologies in production is contingent on the recognition of interrelationships, it is crucial to analyze the relative importance of individual potentials and substantiate this through further studies, such as additional interviews. Finally, the advantages of digital technologies extend beyond economic considerations. In this study, we orientated ourselves toward a classification in accordance with the TBL. Further classifications according to sustainability definitions other than the TBL could provide an even more comprehensive overall picture to supplement the literature.
Appendices
Overview of interviews
| Interview no. | Management position | Industry | Number of employees (in 2023) | Sales in billion EUR (in 2023) |
|---|---|---|---|---|
| 1 | Project Manager Digital Production | Automotive industry | ]50.000–100.000] | ]50–100] |
| 2 | CEO | Electronics industry | ]50–250] | ]1–10] |
| 3 | CEO | Glass industry | ]50–250] | >1 |
| 4 | CEO | Synthetics industry | ]50–250] | n/a |
| 5 | Expert Smart Factory and Digitalization | Automotive industry | ]10.000–50.000] | ]1–10] |
| 6 | Digitalization Manufacturing Powertrain | Automotive industry | ]10.000–50.000] | ]10–50] |
| 7 | Manager | Medical engineering | ]50.000–100.000] | ]10–50] |
| 8 | Head of Technology Planning | Conglomerate | <100.000 | ]50–100] |
| 9 | Function Owner Vehicle Connectivity | Automotive industry | <100.000 | >100 |
| 10 | Project Manager Smart Factory | Metal industry | ]1.000–10.000] | >1 |
| 11 | Development Engineer Digitalization | Mechanical engineering | ]50–250] | n/a |
| 12 | Head of Logistics | Automotive industry | <100.000 | ]50–100] |
| 13 | IT Specialist | Automotive industry | <100.000 | ]10–50] |
| 14 | Head of Digital Office | Electronics industry | <100.000 | ]50–100 |
| 15 | Head of Brake Systems Production | Automotive industry | <100.000 | ]50–100] |
| 16 | Head of Department | Conglomerate | ]10.000–50.000] | ]1–10] |
| 17 | Senior Data Scientist | Electronics industry | <100.000 | ]50–100] |
| 18 | Managing Director | Building industry | ]250–1.000] | <1 |
| 19 | Plant Manager | Mechanical engineering | ]50.000–100.000] | ]10–50] |
| 20 | Project Manager Smart Manufacturing | Synthetics industry | ]1.000–10.000] | <1 |
| 21 | Plant Manager | Automotive industry | ]10.000–50.000] | ]1–10] |
| 22 | Head of Department | Electronics industry | <100.000 | ]50–100] |
| 23 | Engineer for Digitalization and Automation | Automotive industry | <100.000 | >100 |
| 24 | Head of Production Development | Consumer goods | <100.000 | ]10–50] |
| 25 | Agile Coach Digital Industries Software | Electronics industry | <100.000 | ]50–100] |
| 26 | CEO | Mechanical engineering | ]1.000–10.000] | ]1–10] |
| 27 | Plant Manager | Automotive industry | <100.000 | >100 |
| 28 | Engineer for Automated Driving | Automotive industry | <100.000 | >100 |
| 29 | CEO | Automotive industry | ]10.000–50.000] | <1 |
| 30 | CTO | Electronics industry | n/a | <1 |
| 31 | Plant Manager | Mechanical engineering | ]10.000–50.000] | ]1–10] |
| 32 | Vice President Information Technology | Automotive industry | <100.000 | >100 |
| 33 | CEO | Metal industry | [0–50] | <1 |
| 34 | CEO | Synthetics industry | [0–50] | <1 |
| 35 | Lead Digitalization | Mechanical engineering | ]50–250] | <1 |
| 36 | CEO | Metal industry | ]50–250] | <1 |
| 37 | CEO | Consumer goods | ]50–250] | <1 |
| 38 | CFO | Medical engineering | ]50–250] | <1 |
| 39 | CEO | Synthetics industry | ]50–250] | n/a |
| 40 | CEO | Medical engineering | [0–50] | <1 |
| 41 | CEO | Medical engineering | [0–50] | n/a |
| 42 | CEO | Synthetics industry | [50–250] | <1 |
| 43 | Production Manager | Synthetics industry | ]50–250] | n/a |
| 44 | Head of Controlling | Medical engineering | ]50–250] | n/a |
Interview guideline
| Interview section | Interview questions |
|---|---|
| Block 1 - digital technologies and sustainability |
|
| Block 2 - Application in Smart Manufacturing |
|
| Block 3 - Person |
|