

As artificial intelligence (AI) becomes more embedded into higher education, it is essential to understand why some students remain sceptical. This study aims to develop and validate a scale that measures university students' distrust of AI within the context of entrepreneurship education.
A three-phase mixed-method research design was used, combining qualitative item development with quantitative psychometric validation. Data was collected from 662 business students in Catalonia using a quota-based sampling strategy. Exploratory and confirmatory factor analyses were conducted to assess the scale's dimensional structure, reliability and validity.
The results support a robust three-factor model of AI distrust comprising: (1) data protection distrust – contextual concerns about data use, (2) functional distrust – cognitive doubts about educational effectiveness and (3) distrust of AI replacing humans – emotional resistance to losing human interaction in learning. The final 9-item scale demonstrated strong internal consistency, convergent and discriminant validity and model fit across independent samples.
Although the study is regionally focused, the findings provide a foundation for future cross-cultural validation and longitudinal research to explore how student attitudes toward AI evolve over time. Cultural and technological variables should be considered when applying the scale beyond the original context.
The scale can serve as a practical diagnostic tool for educators, curriculum designers, and developers to identify and address student distrust toward AI to ensure more inclusive AI adoption in entrepreneurship education.
This is the first validated scale specifically designed to measure student distrust of AI in entrepreneurship education, offering both theoretical and practical value to researchers and practitioners.
1. Introduction
As artificial intelligence (AI) becomes more embedded in higher education, academic debate is shifting from whether AI should be used to how it can be implemented it effectively, ethically, and fairly (Hardaker and Glenn, 2025; Ifenthaler et al., 2024). To avoid ambiguity about the term “AI”, we follow Russell and Norvig's (2022) distinction between a system's functional architecture and its cognitive capability. Most AI tools currently used in education are limited in capability. They are task-specific systems that, at best, show reactive or limited-memory behaviour and therefore align with Artificial Narrow Intelligence (ANI) rather than Artificial General Intelligence (AGI) or Artificial Superintelligence (ASI) (Bostrom, 2014). Accordingly, this study focuses on ANI tools currently deployed in educational settings, particularly generative AI such as ChatGPT and comparable tools (Bell and Bell, 2023; Somià and Vecchiarini, 2024; Vaswani et al., 2017) that students use for ideation, content generation, and analytical support.
In entrepreneurship education, AI is often introduced to improve learning experience through personalized feedback, simulated market conditions, and rapid business analysis (Arendt et al., 2025). Yet its implementation remains challenging. Although existing research has largely examined AI adoption through technology acceptance perspectives that emphasize positive enablers, such as perceived usefulness, ease of use, and behavioural intention (Ayanwale and Molefi, 2024; Tiwari et al., 2024; Venkatesh et al., 2003), far less attention has been paid to the reasons why students might feel uncomfortable or even resistant to using these tools (Paaßen et al., 2023; Wang and Wang, 2022). In practice, students may hesitate to engage with AI due to concerns about data misuse, limited transparency, and potential exposure of intellectual contributions (Chan and Hu, 2023; Memarian and Doleck, 2023). They may also question the credibility and reliability of outputs, and express preference for human-led support, particularly in learning settings where mentoring, judgement under uncertainty, and personal engagement are vital (Chalmers et al., 2021; Kang et al., 2023).
This study contributes to this ongoing discussion by examining a critical yet underexplored issue of student distrust of AI in entrepreneurship education. Although existing instruments measure trust in AI in various contexts, such as healthcare (Stevens and Stetson, 2023), social robotics (Chi et al., 2021), and educators' views of AI-enabled educational technology (Nazaretsky et al., 2022), distrust is still commonly treated as the mere absence of trust rather than as a distinct, multidimensional construct. Without a dedicated measure, we remain theoretically and empirically unequipped to capture distinct psychological and relational mechanisms that may drive students' resistance to AI. This gap is especially relevant in entrepreneurship education, where learners engage in creative intellectual work, share valuable ideas, and rely on human guidance and mentoring alongside technological support. Based on prior scholarship, this study conceptualizes student distrust in AI stems across three dimensions.
Contextual dimension that is linked to privacy, surveillance, and regulatory compliance (Ifenthaler et al., 2024; Leschanowsky et al., 2024; Regan and Jesse, 2019),
Cognitive dimension that involves scepticism about AI's accuracy, performance, and usefulness (Dwivedi et al., 2023; Jain and Raghuram, 2024; Vecchiarini and Somià, 2023), and
Emotional dimension that is rooted in discomfort with AI replacing human support and social connection interaction (Chalmers et al., 2021; Chan and Tsi, 2024; Kang et al., 2023).
Building on this conceptual framework, this study aims to develop and validate a new student-centred AI Distrust Scale for entrepreneurship education, with potential for adaptation and application to other educational contexts. From a theoretical standpoint, the study advances technology acceptance research by conceptualizing distrust as a distinct construct rather than the inverse of trust (Dimoka, 2010; Lewicki et al., 1998) with three measurable dimensions, thereby addressing the limitations of aggregated attitude measures and adoption-focused models. From a methodological perspective, the scale is grounded in a strong conceptual framework and has been carefully tested through a stepwise validation process including item development, pilot testing, and factor-analytic procedures. On a practical level, this research equips educators, curriculum designers, and institutional decision-makers with a diagnostic tool to identify key sources of student distrust and to implement more precise and targeted interventions that facilitate effective integration of AI tools in entrepreneurship education.
2. Understanding distrust in AI within entrepreneurship training
Although trust and distrust are often treated as opposites, conceptually they are distinct constructs, and it can be misleading to define distrust as merely the absence or low level of trust. Distrust is a specific psychological state characterized by negative expectations and vigilant monitoring of others' actions (Lewicki et al., 1998). Whereas trust facilitates cooperation and risk-taking, distrust serves a protective function by inducing caution when individuals perceive vulnerability (Dimoka, 2010). In technology contexts, distrust is commonly theorized to arise from institutional conditions, performance-related evaluations, and interpersonal concerns (Söllner et al., 2016). This framing is quite relevant in educational settings, where students may experience vulnerability due to opaque systems, limited accountability, and uncertainty about how their data and academic work are collected and used (Ifenthaler et al., 2024; Memarian and Doleck, 2023).
Entrepreneurship education is a particularly sensitive context for distrust because learning depends on experimentation, judgement under uncertainty, and supportive mentoring relationships (Arendt et al., 2025). At the same time, universities and business schools increasingly integrate AI tools to personalize learning, improve feedback, and to align curricula with real-world business practices (Chen et al., 2024; Zulfiqar et al., 2025). However, the adoption of AI in educational settings still encounters significant barriers. Many of these reflect both operational and psychological sources of distrust (Memarian and Doleck, 2023), including concerns about data handling practices, doubts about tool reliability and its usefulness, and a broader scepticism about AI deployment in educational settings.
2.1 Existing trust/distrust measures
A large body of research has developed measures of trust in AI, but these instruments differ considerably in their application and conceptual scope (Table A1, Annex). For example, the Social Service Robot Interaction Trust (SSRIT) scale focuses on trust in AI-powered service robots by examining dimensions such as interaction quality and reliability (Chi et al., 2021). Other broader instruments, like the General Attitudes Towards Artificial Intelligence Scale (GAAIS), assess complex attitudes by combining psychological traits (e.g. introversion, conscientiousness) with contextual scepticism such as corporate distrust (Schepman and Rodway, 2023). In professional settings, models such as Trust and Acceptance of AI in Technology (TrAAIT) operationalize trust through perceived credibility, usefulness, and reliability in clinical AI use (Stevens and Stetson, 2023). Complementing these, usability-oriented instruments evaluate interaction quality in conversational agents and chatbots (Borsci et al., 2023). These studies indicate that trust in AI is multidimensional, involving both cognitive evaluations and affective responses (Pelau et al., 2021).
However, these approaches leave important omissions for entrepreneurship education. First, many instruments measure trust or broad attitudes, but they do not assess distrust as a distinct construct with its own drivers and behavioural consequences (Dimoka, 2010; Lewicki et al., 1998). Second, highly specialized scales (e.g. for service robots) often have limited transferability to generative AI in student learning, while very broad measures often lack the diagnostic precision needed to determine whether resistance stems from privacy, performance, or relational concerns (Chi et al., 2021; Schepman and Rodway, 2023). Third, education-focused adoption research (Sudan et al., 2024; Tiwari et al., 2024; Venkatesh et al., 2003) often relies on a Technology Acceptance Model (TAM) or a Unified Theory of Acceptance and Use of Technology 2 (UTAUT 2) model that explain AI appropriation mainly through positive drivers (e.g. usefulness, ease of use, habit), which can understate the role of negative expectations pertinent to distrust. Empirical work also indicates that students may acknowledge potential benefits yet still resist AI due to moral risk, diminished human agency, or the lack of ethical transparency, which are the concerns that align more closely with distrust than with low perceived usefulness (Ahmad et al., 2023; Ayanwale and Molefi, 2024).
Therefore, despite the growing literature on trust and AI adoption, a clear measurement gap remains. Existing instruments tend to measure trust or general attitudes rather than distrust as a distinct construct. They are often designed for non-student or non-educational settings or are too broad to identify the specific concerns that hinder AI use in entrepreneurship education. As a result, they provide limited insight into why students may reduce or avoid AI use even when tools are available and their benefits are acknowledged. To address this gap, this study develops and validates a student-centred AI Distrust Scale that offers a theoretically grounded and practical diagnostic tool for entrepreneurship education and related learning contexts.
2.2 Conceptual framework of AI distrust scale in entrepreneurship education
This section introduces the conceptual framework that supports the development of the AI Distrust Scale. Recognizing that distrust in AI is a complex phenomenon, the suggested framework distinguishes between three core sources of student distrust: data protection distrust, functional distrust, and distrust of AI replacing humans (see Figure 1). These factors correspond to contextual, cognitive, and emotional dimensions, respectively, and help explain why students may resist or limit AI use in entrepreneurship education.
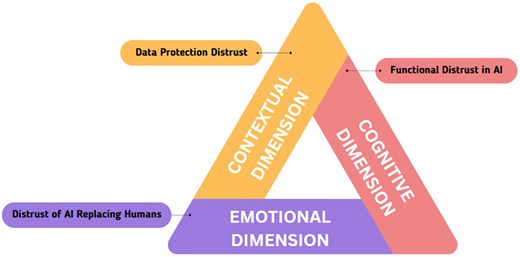
Three dimensions of AI distrust in entrepreneurship education. Source: Authors’ own work
Three dimensions of AI distrust in entrepreneurship education. Source: Authors’ own work
2.2.1 Data protection distrust: contextual dimension
Data protection distrust reflects students' concerns about how their data are collected, stored, and used later, and whether existing rules and safeguards adequately protect them from misuse, surveillance, or loss of control (Ifenthaler et al., 2024; Regan and Jesse, 2019). In this context, it is useful to distinguish security from privacy. While security refers to the protection of data through technical measures such as encryption, authentication, and access control, privacy relates to individuals' rights to decide how their personal information is collected, used, and shared (Leschanowsky et al., 2024). However, strong security does not ensure privacy, especially if data are collected without informed consent or used beyond its originally intended purpose.
This dimension is especially relevant in entrepreneurship education, where students may share sensitive project details and early-stage venture ideas. When data policies are unclear, or when students suspect that their information could be reused beyond the learning context, perceived vulnerability increases and distrust is likely to intensify (Chan and Hu, 2023; Mittelstadt, 2021; Vaassen, 2022). Such concerns are often reinforced by broader societal scepticism toward AI, particularly when tools are developed or controlled by large corporations or public agencies, and by doubts about the adequacy of accountability mechanisms, especially when learners cannot easily verify how their data are handled (Dwork and Minow, 2022; Regan and Jesse, 2019).
2.2.2 Functional distrust in AI: cognitive dimension
Functional distrust refers to students' doubts about whether AI tools work reliably and provide educationally useful support. It reflects students' cognitive evaluations of output accuracy and consistency, as well as the perceived transparency and plausibility of the responses (Araujo et al., 2020; Dwivedi et al., 2023). In entrepreneurship education, students often use AI for tasks such as idea generation, market research, customer profiling, and basic financial analysis (Vecchiarini and Somià, 2023). However, these tasks rarely have a single “correct” answer, which makes it difficult for students to judge whether an output is valid, particularly when the tool presents responses with high confidence (Jain and Raghuram, 2024; Kang et al., 2023).
For generative AI, perceptions of unreliability are reinforced when outputs are vague, generic, or inconsistent, or when the tool produces convincing but incorrect information which is often referred to as “hallucinations” (Choi et al., 2023). These issues can reduce perceived educational usefulness of AI and may also undermine learning if students replace verification and judgement with uncritical acceptance (Ahmad et al., 2023; Chan and Tsi, 2024; Thanasi-Boçe and Hoxha, 2024). From a distrust perspective, the key problem is not that the tool produces occasional errors, but that students may expect it to mislead them in situations where mistakes are hard to detect (Dimoka, 2010; Lewicki et al., 1998).
2.2.3 Distrust of AI replacing humans: emotional dimension
The emotional dimension reflects students' discomfort with AI replacing human involvement in learning, especially in areas that depend on mentoring, relational support, and socio-emotional interaction. As AI becomes more present in professional and educational roles, it can elicit anxiety and perceived threat to human judgement and social value (Middleton et al., 2022). Similar feelings may also arise when AI systems appear human-like but still feel socially incongruent, creating a sense of unease rather than comfort – an effect often described by the “uncanny valley” argument (Mori et al., 2012),
In entrepreneurship education, students consistently express a strong preference for human-led instruction not only because of AI accuracy concerns, but because effective learning frequently requires empathy, context-sensitive feedback, and supportive mentoring relationships (Chalmers et al., 2021; Pelau et al., 2021). Empirical work suggests that trust in AI can erode rapidly when tools produce repeated errors or when students cannot access human support when needed (Dwork and Minow, 2022). Moreover, even when AI assists with analytical tasks, it may be perceived as insufficient for the development of judgement, ethical reasoning, and interpersonal skills that are central to entrepreneurial practice (Chan and Tsi, 2024; Chen et al., 2024; Gerlich, 2024). This dimension therefore represents distrust rooted in the expectation that AI may reduce human support rather than complement it.
Building on this three-dimensional framework which is based on data protection distrust (contextual), functional distrust (cognitive), and distrust of AI replacing humans (emotional), the next section describes the procedures used to develop and validate the AI Distrust Scale.
3. Methodology
3.1 Study context and sample characteristics
In line with the study's primary objective to develop and validate a measurement scale of AI distrust in entrepreneurship education, a quantitative survey-based strategy was employed. This approach is well-suited for validating psychometric instruments and ensuring statistical generalizability across a defined population (Fonseca et al., 2013). The target population for this research comprises university students enrolled in Economics and Business programmes across universities and business schools in Catalonia.
This population was selected for two primary reasons. First, while entrepreneurship education is widely present across many fields of study, Economics and Business faculties remain the main providers of formal entrepreneurship training within higher education. Second, these faculties and business schools continue to serve as traditional institutional hubs for developing entrepreneurial competencies and business innovation curricula (Lilischkis et al., 2021).
According to the Statistical Institute of Catalonia (IDESCAT, 2025), 231,979 students were enrolled in undergraduate programmes in Catalonia in 2022–2023, and the total university population (including postgraduate and doctoral levels) exceeded 270,000. National statistics from the Ministry of Science, Innovation and Universities (2025) indicate that approximately 35–38% of students in Spain pursue studies in Social Sciences, Economics, and Business. Applied to Catalonia, this implies roughly 80,000 undergraduates and up to 105,000 students overall are engaged in business-related education, including postgraduates and those enrolled across more than 20 active business schools in Barcelona. Given this size, the population can be considered statistically infinite for sampling purposes and inferential analysis.
Because random sampling was not feasible due to limited access to student lists and institutional privacy restrictions, we relied on quota-based sampling technique and partly classroom-based recruitment. While appropriate when a complete sampling frame is unavailable, this approach may introduce self-selection or classroom participation bias and may limit generalizability (Moser and Kalton, 2017). To reduce this risk, we validated the scale across independent cohorts and multiple data-collection waves, consistent with recommended scale-development practice (DeVellis, 2016; Hair et al., 2019b).
The final sample consisted of 662 participants and closely reflected the demographic profile of Catalonia's university students, thereby ensuring representativeness. Gender distribution (50.9% female, 47.6% male, 1.5% non-binary) aligns with national enrolment data for Business, Administration, and Law programs, where women represent about 55% (Ministerio de Ciencia, Innovación y Universidades, 2025). Age distribution was also consistent with national figures: 38.8% of participants were aged 17–19 and 43.9% were aged 20–22, comparable to the 55.4% reported for ages 18–21. Younger students predominated, with only 4.5% aged 26 or older versus 13.4% nationally for those over 30. Institutional representation matched regional data, with 67.5% attending public and 32.4% private universities, reflecting the approximate 75% public university enrolment in Business and Law in Catalonia (IDESCAT, 2025). Table 1 provides a detailed breakdown of the demographic and institutional characteristics of the sample across all phases of data collection.
Demographic and institutional characteristics of study samples
| Initial experiment (N = 35) | Sample 1 (N = 309) Phase 1. Pilot study | Sample 2 (N = 118) Phase 2. Psychometric ref. | Sample 3 (N = 200) Phase 3. Confirmation | Total participants (N = 662) | |
|---|---|---|---|---|---|
| Gender | Female (65.7%) | Female (48.2%) | Female (48.3%) | Female (54.0%) | Female (50.9%) |
| Male (34.3%) | Male (49.9%) | Male (50.0%) | Male (45.0%) | Male (47.6%) | |
| Non-binary (1.9%) | Non-binary (1.7%) | Non-binary (1.0%) | Non-binary (1.5%) | ||
| Age | 17–19 years (0.0%) | 17–19 years (46.9%) | 17–19 years (68.6%) | 17–19 years (15.5%) | 17–19 years (38.8%) |
| 20–22 years (25.7%) | 20–22 years (36.8%) | 20–22 years (26.3%) | 20–22 years (68.5%) | 20–22 years (43.9%) | |
| 23–25 years (51.4%) | 23–25 years (9.4%) | 23–25 years (2.5%) | 23–25 years (10.0%) | 23–25 years (12.8%) | |
| 26 years or older (22.8%) | 26 years or older (6.5%) | 26 years or older (1.7%) | 26 years or older (6.0%) | 26 years or older (4.5%) | |
| University | Public (100%) | Public (75.4%) | Public (45.8%) | Public (62.5%) | Public (67.5%) |
| Private (24.5%) | Private (54.2%) | Private (37.5%) | Private (32.4%) |
For the total sample, the margin of error was calculated at a 95% confidence level (assuming an infinite population, as per standard practice in social sciences) for each independent quantitative phase. Phase 1 (N = 309) has a margin of error of ±5.6%; Phase 2 (N = 118), ±9.0%; and Phase 3 (N = 200), ±6.9%. These values demonstrate the robustness of the findings, as even the smallest sample (N = 118) maintains an acceptable margin of error below 10%, ensuring statistical reliability for entrepreneurship research.
3.2 Scale development procedure
The scale development followed an established multi-phase process based on psychometric principles outlined by DeVellis (2016) and Hair et al. (2019a). The complete process is illustrated in Figure 2 and described in the subsections below.
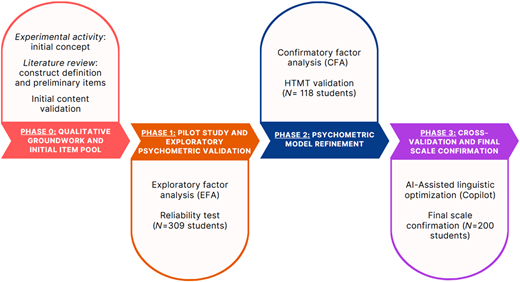
Development and validation process of the measurement scale. Source: Authors’ own work
Development and validation process of the measurement scale. Source: Authors’ own work
3.2.1 Phase 0: qualitative groundwork and initial item pool
The research originated from a Master's-level entrepreneurship course at the University of Barcelona, in which 35 students participated in an experimental activity using generative AI tools to evaluate their business ideas. Before and after the session, students shared their concerns and reflections with the instructors, expressing uncertainty and discomfort about sharing their ideas with AI. This revealed a gap in students' understanding and ability to manage the perceived risks and challenges of using generative AI in entrepreneurship education, pointing to a clear need for further research.
To address this, the researchers aimed to understand the theoretical phenomenon of distrust in AI, specifically within the context of entrepreneurship education. A comprehensive literature review was conducted, focussing on the intersection of distrust, AI, and entrepreneurship education, with particular emphasis on peer-reviewed studies published in high-impact academic journals. This process led to the identification of key factors and dimensions shaping the phenomenon, which informed the initial development of measurement items. To ensure theoretical coherence and psychometric robustness, the researchers also reviewed existing validated scales.
In line with Carpenter's (2018) recommendations, the initial pool of items was subjected to expert review for content validation, involving two researchers specializing in entrepreneurship, one in statistics, and one in digitalization.
3.2.2 Phase 1: pilot study and exploratory psychometric validation
The pilot phase aimed to evaluate the scale's initial psychometric performance, focussing on reliability, factor structure, and item clarity. It also sought to identify any issues related to participant comprehension of the items before proceeding with further survey administration. Following best practices in instrument development (DeVellis, 2016), this phase was designed to empirically test the scale and ensure its suitability for the target population of business and management students.
Following approval from the Bioethics Committee of the University of Barcelona on September 27, 2024, data collection began using a mixed-mode approach to maximize participation and assess methodological consistency. The scale was administered both digitally, through the university's virtual platform (Moodle), and in-person via QR codes distributed in class. To ensure linguistic inclusivity, the survey was made available in English, Spanish, and Catalan, with all translations verified through back-translation to ensure conceptual equivalence. To minimize potential response biases common to self-report surveys, such as social desirability, participation was voluntary and anonymous (DeVellis, 2016; Hair et al., 2019b), and students were reminded that there were no “right” or “wrong” answers. All responses were handled in compliance with institutional ethical standards and the EU General Data Protection Regulation (GDPR). In addition, the scale was tested across three separate phases with independent samples, reducing the influence of any single administration context on the results.
Data collection took place from October 8 to November 15, 2024, yielding 322 initial responses. After removing incomplete entries (N = 13), a final sample of 309 valid responses was retained for analysis. This dataset was used to perform item-level analysis and exploratory factor analysis (EFA) to examine the scale's dimensional structure and guide item refinement.
3.2.3 Phase 2: psychometric model refinement
The main objective of this phase was to empirically refine the revised instrument by confirming its internal consistency, structural validity, and conceptual clarity. Building on the initial validation results, the updated scale comprised three independent subscales, each reflecting a distinct theoretical construct. In accordance with best practices in psychometric evaluation (Childers, 1986), this stage tested the instrument's reliability using a new, independent sample. Data collection occurred between November 18 and December 13, 2024.
For this phase, the questionnaire was administered solely in person to ensure a higher response rate. Participants completed the survey in the classroom by scanning a QR code linked to Microsoft Forms. After removing four incomplete or invalid responses, the final sample consisted of 118 participants. While this sample size resulted in a relatively larger margin of error (±9.0%), it was sufficient to perform confirmatory factor analysis (CFA) and heterotrait-monotrait ratio (HTMT) tests to assess model fit and discriminant validity (Childers, 1986).
3.2.4 Phase 3: cross-validation and final scale
The third phase aimed to test the scale's generalizability using an independent student sample and to refine item wording to ensure clarity and conceptual equivalence across the English, Spanish, and Catalan versions. Minor edits were introduced to improve readability without altering meaning. Microsoft Copilot (2025) was used only as a linguistic aid to suggest simpler wording. For example, in English, “without my consent” was revised to “without my permission” to improve accessibility while maintaining conceptual equivalence. All suggested changes were reviewed by the research team and accepted only when they improved clarity while preserving the intended construct and dimensional alignment. Any changes that threatened conceptual equivalence were rejected. This researcher-led verification process ensured accessibility while maintaining content validity (DeVellis, 2016).
For this phase, data were collected between February 21 and April 9, 2025, using Microsoft Forms with improved response control protocols to reduce incomplete submissions. This phase also introduced a new quality-control measure by tracking response times to identify and exclude rushed or inattentive answers. This approach was not used in earlier phases because the mixed-mode, classroom-based administration did not produce response-time data that were comparable across participants. The final dataset comprised 200 valid responses.
3.3 Measurement scale
The measurement scale developed for this study was designed to assess university students' distrust of AI within the context of entrepreneurship education. Grounded in the study's conceptual framework, this construct of distrust was theorized to comprise three dimensions: contextual, cognitive, and emotional (Chalmers et al., 2021; Chan and Tsi, 2024; Dwivedi et al., 2023; Jain and Raghuram, 2024; Kang et al., 2023; Leschanowsky et al., 2024; Vecchiarini and Somià, 2023). Each dimension represents a specific source of concern influencing students' attitudes toward the use of AI in educational settings.
Drawing from these three dimensions and existing literature, an initial pool of 13 items was created and adapted to the context of entrepreneurship education. Responses were collected using a five-point Likert scale ranging from 1 (“strongly disagree”) to 5 (“strongly agree”), with higher scores indicating greater levels of distrust toward AI.
The scale underwent a rigorous, three-phase refinement process (see Section 3.2), which included statistical validation techniques such as exploratory and confirmatory factor analysis (EFA and CFA), expert review for content validity, and AI-assisted linguistic refinement to improve clarity, coherence, and cross-cultural equivalence. The final factor structure and item composition were confirmed in Phase 3, ensuring both theoretical alignment and psychometric reliability.
3.4 Data analysis
All analyses were conducted using IBM SPSS Statistics (v.28). Multivariate outliers in the Likert-scale data were identified using Mahalanobis distance (p < 0.001), due to its ability to detect atypical response patterns more effectively than univariate Z-scores (Leys et al., 2018).
The analysis began with principal component analysis (PCA) for initial dimensionality reduction, followed by maximum likelihood (ML) factor analysis to examine the scale's underlying structure, which is a common approach when moving from exploratory to confirmatory analysis (Costello and Osborne, 2005).
In Phase 1 (pilot study), exploratory psychometric validation involved the following steps.
Descriptive item analysis (means, standard deviations, skewness/kurtosis within ±2 thresholds);
Reliability testing (Cronbach's alpha (α ≥ 0.70) to assess internal consistency)
Exploratory factor analysis (EFA) using principal axis factoring with Varimax rotation (retaining factors with eigenvalues >1 and item loadings ≥0.50) (DeVellis, 2016; Hair et al., 2019b).
In Phases 2 and 3, further psychometric refinement and cross-validation were conducted using ML-based confirmatory factor analysis (CFA) in SPSS. This stage aimed to validate the hypothesized three-factor model by assessing.
Composite reliability for each factor to ensure internal consistency;
Convergent validity using average variance extracted (AVE ≥0.50) for each construct;
Discriminant validity through low inter-factor correlations (r < 0.30), which were significantly lower than the square roots of the corresponding AVEs (DeVellis, 2016; Hair et al., 2019b).
4. Results
Before proceeding with the analysis, the responses of the participants who did not provide explicit consent were excluded from all three samples. Although some outliers were identified, they were retained, as their influence on the results was not statistically significant (Leys et al., 2018).
Univariate normality was assessed across the three samples (n = 309, 118, and 200) using the Shapiro-Wilk test, which yielded significant results (p < 0.001) for all variables, indicating deviations from normality. However, since normality tests are known to be highly sensitive and can detect even minor discrepancies in samples exceeding 50 participants, we complemented this analysis with additional checks. The skewness (−1 to +1) and kurtosis (−3 to +3) values fell within acceptable ranges, and Q–Q plots revealed no major deviations from the expected normal distribution. These complementary results support the assumption of approximate univariate normality, justifying the use of parametric methods in subsequent analyses (Hair et al., 2019b; Tabachnick and Fidell, 2007).
4.1 Results from phase 1: pilot study and initial psychometric validation
Using a sample of 309 respondents, we conducted an exploratory factor analysis (EFA) to refine the number of items and assess internal consistency of our scale. Sampling adequacy was confirmed by a Kaiser–Meyer–Olkin (KMO) value of 0.797 and a significant Bartlett's test of sphericity (p < 0.001). To ensure a robust factor structure, we applied a conservative factor loading threshold of 0.60, despite 0.40 being acceptable per Carpenter (2018). Items with loadings below 0.60 or with cross-loadings (i.e., less than a 0.30 difference between primary and secondary loadings) were excluded. In addition to statistical thresholds, decisions about item deletion were guided by theoretical considerations, with the aim of avoiding redundancy and that each item contributed substantially to representing the underlying construct.
An initial principal component analysis (PCA) resulted in a four-factor solution with eigenvalues greater than 1.0, explaining 60.14% of the variance. Through iterative refinement, i.e., removing low-loading and cross-loading items, we arrived at a more concise 8-item scale representing three distinct factors, explaining 70.38% of the total variance. This exceeds the minimum 50% variance threshold recommended by Hair et al. (2019a). Cronbach's alpha values were calculated to assess internal consistency. Overall reliability was good, although we saw the possibility of improving the first factor, which included only two items.
To strengthen the scale's coherence and reliability, several modifications were introduced. For example, a negatively worded item in the “Data Protection Distrust” factor was replaced with a positively phrased alternative to improve internal alignment. Additionally, item wording was refined to better suit younger respondents and ensure clarity. These revisions led to a second version of the scale that was tested in subsequent phases of the study (see Table 2).
Factor loadings, reliability, and variance explained (N = 309)
| Factors | Item | Factor Loadings | Cronbach's α | Variance explained, % |
|---|---|---|---|---|
| Factor 1: Data protection distrust | I am concerned that my personal and academic data might be disclosed to third parties without my consent. (V1) | 0.878 | 0.743 | 20.550 |
| I fear that stored and processed data could be altered or manipulated without authorization. (V2) | 0.845 | |||
| Factor 2: Functional distrust | I am concerned that the technology may not effectively enhance specific skills or competencies as promised. (V7) | 0.752 | 0.706 | 23.507 |
| I am apprehensive that regular updates may disrupt current functionalities or fail to align with personalized user experiences. (V8) | 0.767 | |||
| I am uncertain about how continuous innovations align with personalized educational needs and preferences. (V9) | 0.802 | |||
| Factor 3: Distrust of AI replacing humans | An AI tool can never compete with the experience of a specialized trainer in entrepreneurship. (V10) | 0.797 | 0.775 | 26.325 |
| With long-term experience, a trainer can teach more than an AI can. (V11) | 0.855 | |||
| Trainers have a better understanding of what happens in the entrepreneurial process than AI can have. (V12) | 0.811 | |||
| Total variance explained (%) | 70.382 | |||
Note(s): KMO = 0.731
Extraction method: Principal Component Analysis
Rotation method: Varimax with Kaiser normalization
4.2 Results from phase 2: psychometric refinement
While EFA conducted in Phase 1 supported reducing the scale to 8 items, a revised 13-item version was used in Phase 2 for the confirmatory factor analysis (CFA). This decision was driven by a need to assess the fit of the original theoretical model and allowed us better understanding how each item contributed to the overall construct validity before making final decisions about item retention.
The second sample included 118 participants. To verify the robustness of the proposed three-factor model, we used a Maximum Likelihood Factor Analysis (MLFA), constraining the solution to three factors. MLFA was selected because it provides goodness-of-fit indices (e.g. χ2, RMSEA), which in turn facilitate direct comparisons with our initial model and help validate the consistency of the latent structure across independent samples (Kanyongo and Schreiber, 2009).
To refine the scale structure in alignment with the theoretical model, we applied an iterative process. Items with low communalities (<0.30) or problematic cross-loadings (i.e., a difference <0.50 between primary and secondary factor loadings) were removed to improve both internal consistency and structural clarity. Beyond statistical thresholds, item removal was also guided by the need to maintain theoretical coherence and clear differentiation between construct dimensions. Items that did not contribute uniquely to the conceptual definition of their respective factor, or that introduced overlap with related aspects of distrust, were excluded. The resulting model explained 58.3% of the total variance and preserved clear differentiation among the three factors, indicating strong representation of the underlying constructs (see Table 3 for detailed factor loadings).
Despite these efforts, the refinement did not lead to significant improvement. As shown in Table 3, Cronbach's alpha values remained largely unchanged, and it was not possible to retain a third item for Factor 1, which is an important limitation. Moreover, the model's overall fit was poor, with the Root Mean Square Error of Approximation (RMSEA) of 0.134 (χ2(7) = 21.691, p = 0.003), exceeding the commonly accepted threshold of 0.06. These findings indicate that the proposed three-factor structure failed to adequately reproduce the observed data, thereby creating a need for further refinement.
Factor loadings, reliability, and variance explained (N = 118)
| Factors | Item | Factor loadings | Cronbach's α | Variance explained, % |
|---|---|---|---|---|
| Factor 1: Data protection distrust | I am concerned that my personal and academic data might be disclosed to third parties without my consent. (V1) | 0.665 | 0.797 | 12.580 |
| I fear that stored and processed data could be altered or manipulated without authorization. (V2) | 0.999 | |||
| Factor 2: Functional distrust | I doubt that the suggestions or recommendations it provides are suitable for learning. (V6) | 0.685 | 0.754 | 21.881 |
| I am concerned that the technology will not be able to effectively improve specific skills or competencies as promised. (V7) | 0.642 | |||
| I am uncertain about how continuous innovations align with personalized educational needs and preferences. (V9) | 0.838 | |||
| Factor 3: Distrust of AI replacing humans | An AI tool can never compete with the experience of a specialized trainer in entrepreneurship. (V10) | 0.723 | 0.758 | 23.885 |
| With long-term experience, a trainer can teach more than an AI can. (V11) | 0.683 | |||
| Trainers have a better understanding of what happens in the entrepreneurial process than AI can have. (V12) | 0.741 | |||
| Total variance explained (%) | 58.347 | |||
Note(s): Extraction method: Maximum Likelihood Factor Analysis (MLFA)
Promax rotation with Kaiser normalization (κ = 4)
Model fit indices: χ2(7) = 21.691, p = 0.003 RMSEA: 0.134
It is also important to note that the sample size was at the lower bound of commonly recommended guidelines – not less than five participants per parameter and a minimum of 100 cases (Mundfrom et al., 2005). This constraint further justified the need for an additional round of scale development.
It is also important to note that the sample size was at the lower bound of commonly recommended guidelines, i.e. at least five participants per parameter and a minimum of 100 cases (Mundfrom et al., 2005). This constraint further supported the need for an additional round of scale development.
4.3 Cross-validation and final scale
4.3.1 Principal component factor analysis (PCA)
In the final phase of scale development, the research team collaborated with an AI assistant to refine the wording of items across all three factors. The primary objective was to improve clarity, ensure internal consistency, and raise cultural relevance, particularly for a diverse student population. Using Microsoft Copilot, item phrasing was revised for greater precision and to reduce potential bias stemming from non-native language use. The updated scale was then carefully reviewed to ensure conceptual alignment with the original constructs and to maintain scientific rigour.
This version of the measurement instrument consisted of 13 items across three dimensions: four items each for data protection distrust and functional distrust, and five items for distrust of AI replacing humans. An initial PCA confirmed a clear three-factor structure. However, the total variance explained was relatively low at 57.99%. To strengthen both clarity and reliability, items with low factor loadings were removed, retaining only those with loadings above 0.70. In addition to statistical criteria, each item was examined to determine whether it contributed uniquely to the conceptual definition of the construct. Items exhibiting conceptual overlap with retained items and not adding distinct theoretical meaning were excluded to improve conceptual parsimony. For example, the item “Human trainers can provide personalized insights that AI tools cannot replicate” was removed because its meaning conceptually overlapped with retained items referring to expertise and professional judgement. The final structure of the instrument, shown in Table 4, resulted in nine items, most of which exhibited loadings approaching or exceeding 0.80, and a total explained variance of 68.49%. Cronbach's alpha values for all retained factors exceeded the recommended threshold of 0.70, indicating satisfactory internal consistency.
Final scale – factor loadings, reliability, and variance explained (N = 200)
| Factors | Item | Factor loadings | Cronbach's α | Variance explained, % |
|---|---|---|---|---|
| Factor 1: Data protection distrust | I am concerned that my personal and academic data could be shared with third parties without my permission. (V1) | 0.827 | 0.812 | 24.325 |
| I am afraid that stored and processed data might be changed or manipulated without authorization. (V2) | 0.811 | |||
| I am concerned that my stored information could be used for purposes other than those originally intended without my knowledge or consent. (V4) | 0.876 | |||
| Factor 2: Functional distrust | I doubt that the suggestions or recommendations it provides effectively support my learning needs. (V5) | 0.796 | 0.706 | 21.475 |
| I am concerned that the technology may not adequately address specific learning goals or objectives. (V6) | 0.801 | |||
| I am sceptical about the tool's ability to deliver meaningful educational outcomes for me. (V8) | 0.787 | |||
| Factor 3: Distrust of AI replacing humans | A trainer with extensive experience can teach more effectively than an AI. (V10) | 0.855 | 0.752 | 22.685 |
| Experienced trainers have a deeper understanding of the entrepreneurial process than AI can achieve. (V11) | 0.787 | |||
| A human trainer can better understand my emotional needs and adapt their teaching accordingly, which AI tools cannot do. (V13) | 0.781 | |||
| Total variance explained (%) | 68.485 | |||
Note(s): KMO = 0.709
Extraction method: Principal Component Analysis
Rotation method: Varimax with Kaiser normalization
Before proceeding to Maximum Likelihood Factor Analysis (MLFA), discriminant validity was reassessed to ensure the conceptual distinctiveness of the three constructs. In line with contemporary psychometric guidelines, the Heterotrait-Monotrait (HTMT) ratio of correlations was used to evaluate discriminant validity. As presented in Table 5, all HTMT values ranged from 0.156 to 0.319, remaining well below the commonly accepted cutoff of 0.85 (DeVellis, 2016; Hair et al., 2019b). These results provide strong evidence for adequate discriminant validity of the three factors, confirming that they represent empirically distinct dimensions of the construct under investigation.
4.3.2 Maximum likelihood factor analysis (MLFA)
To confirm the validity of the three-factor structure, a Maximum Likelihood factor extraction was conducted, followed by Promax rotation with Kaiser normalization (κ = 4) to allow for correlations among factors. As shown in Table 6, the analysis yielded satisfactory psychometric results. All retained items loaded above 0.60, and the three-factor solution explained over 50% of the total variance. These values exceed commonly used benchmarks for both item reliability (factor loadings >0.50) and model explanatory power (total variance >50%) (Hair et al., 2019b).
Results of maximum likelihood factor analysis with promax rotation: Factor loadings, AVEs, and model fit indicators (N = 200)
| Factors | Item | Factor loadings | Composite reliability (CR) | Average variance extracted (AVE) | |
|---|---|---|---|---|---|
| Data protection distrust | V1 | 0.708 | 0.817 | 0.599 | |
| V2 | 0.736 | ||||
| V4 | 0.869 | ||||
| Functional distrust | V5 | 0.687 | 0.727 | 0.471 | |
| V6 | 0.733 | ||||
| V8 | 0.635 | ||||
| Distrust of AI replacing humans | V10 | 0.830 | 0.756 | 0.512 | |
| V11 | 0.649 | ||||
| V13 | 0.653 | ||||
| Total variance explained (%) | 53.354 | ||||
Note(s): Extraction method: Maximum Likelihood Factor Analysis (MLFA)
Rotation method: Promax rotation with Kaiser normalization (κ = 4)
Model fit indices: χ2(12) = 16.200, p = 0.182. RMSEA: 0.041
Model fit was further supported by a non-significant chi-square test (χ2(12) = 16.20, p = 0.182), and a low RMSEA was 0.041 (Hair et al., 2019b), confirming a good model fit. Convergent validity and internal consistency were assessed using composite reliability (CR) and average variance extracted (AVE). CR ranged from 0.727 to 0.817, meeting the recommended threshold of 0.70 (Hair et al., 2019b). AVE values ranged from 0.471 to 0.599; although one construct fell slightly below 0.50, this is considered acceptable in early-stage scale development when CR exceeds 0.70 and item loadings remain strong (Panahi et al., 2023). Overall, these results support the validity and reliability of proposed the three-factor solution and provide no evidence of major model misspecification.
5. Discussion and implications
This study aimed to develop and validate a measurement scale to assess students' distrust of AI in entrepreneurship education. The findings support a stable three-factor model – data protection distrust, functional distrust, and distrust of AI replacing humans – measured with a nine-item instrument that shows strong reliability and clear discriminant validity across independent samples. This result reinforces the view that distrust is not simply the “low trust”, but a distinct judgement grounded in negative expectations and high concern about risk (Dimoka, 2010; Lewicki et al., 1998). In other words, students may refrain from AI-supported learning not because they dislike technology, but because they expect specific dangers or problems that they feel unable to monitor or control in the learning setting.
5.1 Conceptual and empirical implications of the three-factor model
Most research on AI adoption in higher education relies on acceptance-focused frameworks such as TAM and UTAUT, which explain engagement mainly through positive beliefs like perceived usefulness and ease of use (Davis et al., 1989; Tiwari et al., 2024; Venkatesh et al., 2003). While this approach has generated valuable insights, it does not adequately explain why learners may resist AI even when it is available or actively promoted by institutions (Paaßen et al., 2023; Wang and Wang, 2022). Our findings respond to this gap by showing that distrust in AI within entrepreneurship education is better understood as a multidimensional construct, rather than a single general attitude.
Conceptually, the three factors align with prior research on technology distrust that distinguishes between institutional conditions, performance evaluations, and relational concerns (Söllner et al., 2016). These issues are also frequently treated as separate debates in AI-in-education research, e.g. ethics and governance (Ifenthaler et al., 2024; Memarian and Doleck, 2023), output quality and error risks (Choi et al., 2023; Dwivedi et al., 2023), and the preservation of human judgement and support (Chan and Tsi, 2024; Middleton et al., 2022). The present study contributes by integrating these perspectives into a single, student-focused measurement model that can be tested and applied across different contexts. The low HTMT ratios between the three factors further indicate that these represent empirically distinct concerns, suggesting that aggregated attitude measures may obscure which specific concern is driving resistance.
5.2 Implications for practice and policy
Because the three distrust dimensions are distinct, interventions are unlikely to be effective if they treat distrust as a general attitude. For instance, stronger technical security may not reduce concern when students' main issue is unclear consent, data retention, or third-party access (Leschanowsky et al., 2024; Regan and Jesse, 2019). Likewise, messages promoting innovation will not reduce functional distrust if students repeatedly encounter vague or inconsistent outputs (Choi et al., 2023; Dwivedi et al., 2023). Finally, even accurate tools may not reduce emotional resistance if students interpret AI use as reducing or replacing human support (Dwork and Minow, 2022; Middleton et al., 2022).
5.2.1 Using the scale in teaching and course design
Beyond measurement, the scale can be used as a practical diagnostic tool to guide how AI is introduced, taught, and governed in entrepreneurship education. We recommend administering it at three stages: (1) at the start of a course or module, before students use AI tools, to assess baseline concerns, (2) after the first AI-supported learning task, to detect early changes in trust based on actual experience; and (3) at the end of the module, to evaluate whether teaching practices, transparency measures, and tool features reduce distrust over time. Instructors can use the subscales to identify the dominant barrier to adoption in a cohort.
Because distrust levels can differ across institutions, AI tools, and course designs, it is not appropriate to propose universal cut-off scores based on a single regional validation. Thereby, we recommend interpreting results using local benchmarks, such as cohort percentiles, and paying particular attention to elevated subscale scores. For instance, students with scores in the upper quartile of a given cohort on any subscale (≥75th percentile) may benefit from additional support, while those in the upper decile (≥90th percentile) may require more proactive follow-up. At cohort level, high central tendencies on a subscale can inform course adjustments (e.g. more privacy guidance, more verification support, or stronger human mentoring). Table 7 summarizes recommended pedagogical and governance responses aligned to each distrust profile.
Recommended responses by AI distrust dimension
| Distrust dimension | Distrust indicators (top quartile/decile) | Pedagogical and governance response |
|---|---|---|
| Contextual: Data Protection Distrust |
| Prioritizing transparency and safeguards by providing clear guidance on what data may be entered into AI tools, anonymization of sensitive inputs, use of institution-approved platforms, and explicit information on data storage and third-party access |
| Cognitive: Functional Distrust |
| Increasing instructional support and verification practices such as activities to evaluate output quality, instructor demo of strong vs. weak AI outputs, introduction of assessment criteria that reward error-spotting and comparison of AI outputs to validated sources |
| Emotional: Distrust of AI Replacing Humans |
| Reinforcing human mentoring by explicit positioning of AI as augmentative, increasing instructor interaction, introducing assessments emphasizing judgement and reflection |
When data protection distrust is high, students need stronger transparency and governance with clear rules, explicit information on data storage and retention, and the use of tools that meet institutional accountability standards (Ifenthaler et al., 2024; Memarian and Doleck, 2023; Regan and Jesse, 2019). When functional distrust is salient, the key response could be to provide guided practice that helps students understand what AI can and cannot do. This should include verification routines, comparisons with validated sources, and reflection on uncertainty (Dwivedi et al., 2023; Khosravi et al., 2022). When distrust of AI replacing humans is high, the focus should be on human-in-the-loop pedagogy that makes instructor presence and judgement visible, so AI is positioned as support rather than a substitute for mentoring (Chalmers et al., 2021; Chan and Tsi, 2024; Middleton et al., 2022).
5.2.2 Institutional governance and investment decisions
At the programme level, repeated administration of the scale across cohorts can serve as a quality-assurance indicator for AI integration. It can help educational decision-makers identify which distrust dimension is dominant and prioritize interventions accordingly, rather than assuming that increased access to AI will automatically translate into learning gains. At the institutional level, the scale can also inform investment decisions by detecting adoption risks early, thereby reducing the likelihood of high-cost, low-usage deployments of AI tools purchased or subscribed to for educational purposes.
5.2.3 Implications for AI developers
The scale can inform tool design and procurement by indicating which features students find most important and which ones are questioned or missing. High data protection distrust signals the need for privacy-by-design defaults, clear consent procedures, transparent data-retention policies, and easy-to-use controls. High functional distrust underscores the importance of reliable and transparent features that support learning. High AI-human replacement distrust suggests tools should be designed to make human guidance visible and supported (e.g. designs that preserve teacher–student interaction).
5.2.4 Societal, equity, and policy implications
Student distrust can also point to governance and ethics issues in educational AI adoption. If distrust varies across student groups, ubiquitous AI integration may unintentionally increase inequality by creating uneven access to AI-supported learning. The scale can help institutions monitor these differences and ensure that AI adoption does not disadvantage students who are more privacy-sensitive or less confident in AI-mediated learning.
At the policy level, the findings suggest that institutions can establish clear guidelines that specify when AI tools are permitted, what types of tasks require disclosure, and how to avoid academic misconduct. They can also offer training for both students and staff on safe and ethical use, including data privacy, responsible prompting, verification of outputs, and appropriate attribution. Finally, regular monitoring of student perceptions, using the scale as part of internal quality assurance, can show whether concerns rise or decline over time and whether certain groups of students require additional support.
5.3 Limitations and future research
Several limitations of this study should be acknowledged. First, the scale was developed and validated within the regional context of Catalonia. Although the sample was diverse in terms of age, gender, and type of institution, cultural and technological factors specific to this setting may limit broader applicability of the findings. Future research should replicate and validate the scale across other countries and educational systems with different levels of digital literacy, AI adoption, and pedagogical practices.
Second, criterion-related validity with external constructs, such as trust in AI, perceived usefulness, or intention to use AI, was not examined in the present study. While the scale demonstrated strong internal structure, reliability, and discriminant validity, future research should explore how the three distrust dimensions relate to these theoretically related constructs. Such analyses would further strengthen the nomological validity of the scale and provide stronger external validation of the instrument. It is also important to note that Phase 2 showed that the initial measurement model did not achieve satisfactory fit. This issue guided the revisions and re-testing in Phase 3, which improved item clarity and strengthened the scale's psychometric performance.
Third, this study addressed the technology that is still evolving. As generative AI becomes more embedded in education, the nature of student distrust may also change over time. Thereby, new concerns may emerge around such issues as algorithmic bias, misinformation, or overreliance on automation, while others may diminish as user familiarity and institutional safeguards increase. Longitudinal research therefore is needed to track these evolving perceptions of distrust to ensure that the scale remains relevant and reliable over time.
Fourth, this study focused on business and entrepreneurship programmes in higher-education. Future work could test whether the same distrust dimensions apply in other academic disciplines, such as engineering, design, or social sciences, where learning tasks and norms differ. Cross-disciplinary work could help to refine the scale and clarify which aspects of AI distrust are general versus context-specific.
Lastly, the scale provides a foundation for future research on non-adoption and cautious adoption of educational technologies. It can be used to study why some students avoid AI, use it only in limited ways, or rely on it uncritically. In this way, the instrument can help researchers and educators move from broad “acceptance” discussions to more precise, evidence-based explanations of how students respond to AI in higher education.
6. Conclusion
This research contributes to the growing discourse on human–AI interaction by developing and validating a student-centred scale of AI distrust in entrepreneurship education. By focussing on learners, who are directly affected by the expanding use of AI in the classroom, the study identifies three distinct dimensions of distrust: contextual concerns about data protection, cognitive doubts about functional performance, and emotional concerns about human replacement. In doing so, it provides both a clearer conceptual understanding of student distrust in AI and a rigorously tested instrument to measure and interpret it.
The findings underscore that technological innovation must be accompanied by ethical, pedagogical, and psychological considerations to ensure that trust is preserved. As AI tools become more common in entrepreneurship education, it is crucial that their use supports and strengthens personal, relational, and experiential elements of learning. Trust remains a cornerstone of entrepreneurship education, where confidence, collaboration, and mentorship are essential. By helping educators and institutions diagnose which concerns are driving student distrust, this study supports the development and governance of more inclusive, responsible, and engaging AI-enabled learning environments.
Annex
Key scales and models measuring trust and AI adoption in education and other sectors
| Study | Scale name/Model | Sector | Key factors/Constructs | Main outcome |
|---|---|---|---|---|
| Ahmad et al. (2023) | N/A (Exploratory) | Education | Perceived laziness, moral risk, human agency | Human concern and resistance to AI |
| Ayanwale and Molefi (2024) | Extended DOI-Based Scale | Education | Relative advantage, compatibility, trialability, trust, usefulness, ease of use | Behavioural intention to adopt AI |
| Borsci et al. (2023) | Chatbot Usability Scale (BUS-15) | Tech/UX | Conversational efficiency, accessibility, chatbot functionality | Usability satisfaction |
| Chi et al. (2021) | Social Service Robot Interaction Trust (SSRIT) | Service Industry | AI-human interaction quality, robot trust dimensions | Trust in AI service robots |
| Gerlich (2024) | N/A (Attitudinal survey) | General/Public | Impartiality, accuracy, media distrust, human scepticism | Trust orientation: AI vs. humans |
| Kang et al. (2023) | AI-Assisted Medical Consultation Attitudes Scale | Healthcare | Health literacy, digital literacy, distrust, efficiency | Attitudes toward AI-assisted consultations |
| Kumar and Chand (2024) | Usability Evaluation Questionnaire (UEQ) | Mobile Learning Apps | Content organization, control layout, customization, feedback, navigation etc | Usability of mobile learning applications |
| Pelau et al. (2021) | CASA-based Acceptance and Trust Scale | Service Industry | Anthropomorphism, empathy, interaction quality | AI device acceptance and trust |
| Schepman and Rodway (2023) | General Attitudes Towards AI Scale (GAAIS) | General/Public | Personality traits, corporate distrust, positive/negative attitude dimensions | Attitude toward AI |
| Stevens and Stetson (2023) | TrAAIT (Trust and Acceptance of AI in Technology) | Healthcare | Information credibility, perceived value, reliability | Clinician trust and acceptance |
| Sudan et al. (2024) | ChatGPT Adoption Model (UTAUT2 + Perceived Benefits) | Education | Performance expectancy, effort expectancy, social influence, habit, hedonic motivation, perceived benefits | Behavioural intention to use ChatGPT |
| Tiwari et al. (2024) | ChatGPT Adoption Model (TAM-based) | Education | Usefulness, ease of use, credibility, social presence, hedonic motivation | Intention to use ChatGPT for education |
