This paper addresses the lack of quantitative frameworks for evaluating smart container investments by developing a comprehensive system dynamics model to analyse adoption trajectories and financial performance of tracking- and tracing-enabled containers across container types, technology tiers and deployment strategies.
The model integrates S-curve technology diffusion theory, feedback-driven adoption dynamics, fleet lifecycle management and financial flow tracking. Multiple deployment scenarios, combining different adoption strategies, and portfolio compositions were simulated across baseline and premium trade route conditions to evaluate net present value, discounted payback period and profitability index.
All scenarios demonstrate positive net present value (NPV) and achieve discounted payback within the simulation horizon. Premium route deployment increases NPV and accelerates capital recovery. Active Internet of Things (IoT) delivers the highest absolute NPV, but results in longer payback periods. Conversely, passive radio frequency identification (RFID) achieves superior capital efficiency with faster payback. Sensitivity analysis identifies benefit realisation rates as the most influential parameter. When benchmarked against standard capital budgeting practices, smart container investments occupy the outer boundary of acceptability, with Active IoT in baseline scenarios frequently exceeding thresholds.
The findings provide actionable guidance for shipping and leasing companies regarding route prioritisation, portfolio composition, technology tier selection and deployment timing based on organisational capital constraints and strategic objectives.
This study provides a comprehensive system dynamics framework comparing investment performance across dry and reefer containers, technology tiers and multiple deployment strategies. The analysis reveals that while smart containers are technically mature, current cost structures position them at a financial tipping point.
1. Introduction
Global maritime shipping sector is responsible for transporting over 80% of world trade by volume, and it is mostly dependent on Asia, and particularly, China (UNCTAD, 2024). Growth of sea transportation has been modest in recent years (barely reaching 2%), but still container transportation is showing double growth rates in comparison to general level. In addition, transportation in distance terms has been on the rise (UNCTAD, 2025). Despite its scale, containerised cargo is subject to persistent challenges such as theft, damage, temperature excursions, incomplete location tracking and documentation discrepancies. Industry estimates suggest these challenges result in significant economic losses across the global supply chain with cargo theft alone costing companies tens of billions of dollars annually (TT Club and BSI, 2024). Dependence on traditional container management methods, including manual inspections and periodic check-ins, limits the visibility during ocean transit and creates information gaps that hinder operational efficiency and risk management (Tran-Dang and Kim, 2022).
Smart container technology constitutes a significant advancement in maritime logistics by integrating IoT sensors, global positioning system (GPS) tracking, wireless communication systems and cloud-based data analytics platforms (Tran-Dang and Kim, 2022). These containers continuously monitor critical parameters, including location, temperature, humidity, shock, vibration, door status and light exposure. Real-time data transmission through cellular, satellite or long range wide area networks (LoRaWANs) enhances supply chain visibility and enables stakeholders to detect and address anomalies before they result in substantial losses (Song and Yu, 2020). Around 20% of the global container fleet now consists of smart containers, with a figure projected to rise to 30% by 2027 due to the advancements in telematics (GGI, 2025; TGL, 2023).
The economic feasibility of smart container technology depends on diverse operational variables and robust communication infrastructure (Aslam et al., 2020). Despite potential benefits, adoption faces barriers like technological integration and low user acceptance (Liu et al., 2025), notably in developing regions (Bauk et al., 2017).
Maritime containers are classified into two primary categories, each possessing distinct characteristics that significantly influence the value proposition of smart technology (Castelein et al., 2020).
Dry containers constitute approximately 85% of the global container fleet and are utilised for transporting non-perishable cargo, including manufactured goods, textiles, electronics, automotive parts and raw materials (Drewry Shipping Consultants, 2023). Standard dry containers (20-foot and 40-foot units) require a lower capital investment per unit and are exposed to relatively modest cargo loss risks, primarily from theft, handling damage, and routing errors (TT Club and BSI, 2024). Key operational priorities for dry containers include location tracking, security monitoring and efficient asset utilisation (Tran-Dang and Kim, 2022).
Reefer containers, or refrigerated containers, account for approximately 15% of containers in use, but these represent a disproportionately high share of cargo value and associated risk (Container Market Annual Review, 2024). These specialised units maintain controlled-temperature environments ranging from −30°C to +30°C, which are essential for transporting pharmaceuticals, fresh produce, frozen foods, flowers and other temperature-sensitive goods. Reefer containers require a substantially higher capital investment and are subject to greater cargo loss risks from temperature excursions, equipment failures and spoilage. Critical operational requirements for reefer containers include continuous temperature monitoring, predictive maintenance, rapid anomaly detection and comprehensive cold chain documentation to ensure regulatory compliance (Cil et al., 2022).
Specialised containers for radioactive materials necessitate sophisticated tracking systems due to critical safety risks (Bauk, 2020). However, given their limited commercial deployment and highly specialised regulatory frameworks, containers for nuclear waste transportation fall outside the scope of this research.
An important consideration in smart container investment is the spectrum of available tracking technologies, each with distinct cost-benefit profiles (Ruiz-Garcia and Lunadei, 2011; Cil et al., 2022). This research examines three technology categories:
Active Smart Containers: Full internet of things (IoT) integration with GPS, cellular/satellite communication, real-time sensor monitoring and edge computing capabilities. These systems provide continuous, real-time visibility, but require the highest capital investment.
Semi-Passive Systems: Battery-powered sensors with passive data transmission triggered by reader proximity. Data are collected at checkpoints rather than continuously, which is suitable for monitoring conditions during transit without real-time intervention capability.
Passive radio frequency identification (RFID) Tags: No onboard power source; activated by reader electromagnetic fields. It provides location and basic event logging at equipped checkpoints. Suitable when retrospective visibility is acceptable.
Despite increasing industry interest, the existing literature lacks quantitative frameworks for comparing the financial performance of smart container investments across container types, technology tiers and deployment strategies. Previous studies (Bauk and Ntshangase, 2023; Durlik et al., 2023) have either addressed smart containers in general terms or focused narrowly on specific applications such as pharmaceutical cold chains, without systematically evaluating how these variables interact to determine investment viability. This gap leaves decision-makers without the evidence base needed to justify capital allocation, select appropriate technologies or prioritise deployment across trade routes. This study addresses that gap by developing a system dynamics simulation model to analyse adoption trajectories and financial outcomes under varied scenarios with the detailed methodology, objectives and research questions.
This research is structured as follows: Section 2 reviews smart container technology and the system dynamics methodology underpinning our analysis. Section 3 presents the simulation model and parameters. Section 4 analyses results for three tracking technologies (Active IoT, Semi-Passive, and Passive RFID) across adoption scenarios. Section 5 concludes with discussion and future research directions.
2. Literature review
The development of smart container technologies has evolved through multiple phases, driven by security imperatives and operational efficiency requirements. Early research focused on specialised applications, including Argonne National Laboratory's 2008 RFID tracking system for radioactive material packages during storage and rail transportation (Tsai et al., 2010), alongside explorations of passive sensor technologies for detecting illicit materials and ensuring cargo integrity (Janssens-Maenhout et al., 2010). However, the concept gained significant momentum following 9/11, driven by U.S. focus on enhancing national security and improving global container transport efficiency (Xu, 2014). This convergence of security concerns and technological advancements led to the integration of advanced tracking, monitoring and communication technologies into standard shipping containers, transforming traditional opaque shipping processes into transparent, data-driven systems with unprecedented visibility over cargo movement. Early systems relied on standalone data loggers that required manual data retrieval at the destination, offering only retrospective visibility and no real-time intervention (Jedermann et al., 2009). The subsequent proliferation of cellular IoT networks, low-power sensor technologies and cloud computing platforms after 2010 facilitated the shift to continuously connected smart containers (Ben-Daya et al., 2019; Mekki et al., 2019).
Contemporary smart container systems include a range of sensors, such as GPS for geolocation, accelerometers for shock detection, door sensors for security and environmental sensors for temperature, humidity and light exposure (Jedermann et al., 2009; Cil et al., 2022). Communication strategies utilise hybrid connectivity, combining cellular (LTE-M, NB-IoT, etc.), satellite (Inmarsat, Iridium, VSAT, (S-)AIS, Starlink, Thuraya, etc.) and low-power wide-area network (LPWAN) technologies like LoRaWAN and Sigfox to ensure connectivity throughout maritime transit (Mekki et al., 2019; Aslam et al., 2020).
Recent developments incorporate edge computing capabilities, enabling on-device analytics, machine learning models for predictive maintenance and integration with blockchain platforms for immutable supply chain records (Jović et al., 2019; Durlik et al., 2023; Idrissi et al., 2024). Leading technology providers, including Naxiot, and Traxens, have deployed systems on many containers globally, demonstrating technical feasibility at scale (Brechemier et al., 2024). Lyu et al. (2023) conducted a bibliometric analysis of 2,897 publications from 2003–2022 to examine how digital technologies (such as IoT, blockchain and AI) are transforming container logistics supply chain management. The research reveals that the adoption of digital technologies significantly improves operational efficiency, resilience and sustainability in container logistics through intelligent operations, real-time monitoring and optimised decision-making. The findings provide researchers and practitioners with insights into current research themes and future opportunities for digital technology-enabled innovation in container-based supply chains.
The application of IoT technologies in maritime shipping extends beyond container monitoring to include vessel performance optimisation, port operations management and supply chain coordination. A comprehensive review by Durlik et al. (2023) indicates that IoT-driven data analysis is critical for driving operational efficiency, safety and sustainability across the maritime sector. Specifically, the study reports substantial benefits, including the reduction of unplanned vessel downtime through predictive maintenance, enhanced port terminal efficiency via intelligent situational awareness systems and improved navigation safety through real-time environmental monitoring and collision risk assessment. However, widespread adoption faces challenges, including high initial costs, lack of global standards, cybersecurity risks and the need for workforce adaptation (London Maritime Academy, 2026).
Maritime IoT encounters distinct technical challenges that are not present in terrestrial logistics, such as limited connectivity during ocean transit, wave shielding, multi-path fading, atmospheric radiation and cybersecurity threats (Erbas et al., 2024). Additionally, harsh environmental conditions pose significant obstacles, including salt spray, vibration, electromagnetic fields from mechanical and navigation equipment, ship hull structural barriers, temperature extremes, six degrees of ship dynamic freedom, power limitations for battery-operated sensors and complex multi-stakeholder data sharing requirements (Aslam et al., 2020).
Beyond technical barriers, human and organisational factors present equally significant impediments to smart container adoption. These include the absence of government regulations and standardised IoT frameworks; lack of trust toward emerging technologies among traditional operators; privacy and business information sharing concerns among competitive stakeholders; insufficient understanding of technology capabilities among decision-makers; resistance from stakeholders who fear disruption to established business models; substantial capital requirements creating financial barriers for smaller operators; and the lack of early adopters to demonstrate proof-of-concept and return on investment (Bauk and Ntshangase, 2023).
The selection among Active IoT, Semi-Passive, and Passive RFID tag technologies involves trade-offs between monitoring capability, power requirements, connectivity needs and total cost of ownership that vary significantly by application context (Ruiz-Garcia and Lunadei, 2011). Successful implementation requires not only addressing the technical and environmental challenges inherent to maritime operations, but also navigating the complex landscape of stakeholder relationships, regulatory frameworks and organisational readiness that characterise the global shipping industry (Liu et al., 2025; Bauk and Ntshangase, 2023).
System dynamics provides the methodological foundation for this research, offering analytical capabilities uniquely suited to technology adoption and investment analysis. Developed by Jay Forrester at MIT in the 1950s, system dynamics applies feedback control theory to business and social systems, as established in foundational works including Industrial Dynamics (Forrester, 1961) and Urban Dynamics (Forrester, 1969). The approach emphasises that system behaviour emerges from internal structure rather than external events, with reinforcing loops amplifying change and balancing loops seeking equilibrium. Stocks (accumulations) and flows (rates of change) represent system structure, while delays between actions and consequences create dynamic complexity.
Previous system dynamics applications in maritime and logistics contexts provide precedent for this research. Multiple studies have applied system dynamics to port capacity planning, vessel investment decisions, fleet sizing optimisation, supply chain, hinterland connectivity, the economic feasibility of new vehicle technologies and environmental sustainability (Gao et al., 2023; Ghisolfi et al., 2022; Hilmola and Heljanko, 2025; Li et al., 2026; Tsaples et al., 2021; Zhang et al., 2025; Zhong et al., 2023).
3. Methodology
This study adopts a positivist research paradigm, employing quantitative modelling and simulation techniques to examine smart container investment performance. The research assumes an objective reality that can be modelled through system dynamics, with causal relationships between adoption feedback loops, fleet composition, technology selection and financial outcomes being systematically measured and analysed, dominantly by maritime business and industry actors. The paradigm prioritises empirical parameterisation, replicability of simulation experiments and generalisability of findings to inform strategic decision-making in maritime logistics.
The main goal of this study is to develop a comprehensive system dynamics framework for evaluating smart container investment performance and adoption trajectories across different container types, technology tiers and deployment strategies in maritime logistics. To achieve this goal, specific objectives are pursued:
Compare investment performance across three technology tiers (Active IoT, Semi-Passive, and Passive RFID) using net present value (NPV), discounted payback period and profitability index.
Analyse how container portfolio compositions (pure reefer, mixed and balanced) influence investment outcomes and capital efficiency.
Quantify the effect of trade route conditions (baseline vs. premium) on smart container economics and adoption acceleration.
Identify key drivers of investment performance through sensitivity analysis of cost, benefit and operational parameters.
Based on these four specific objectives, we formulate the corresponding research questions to guide our investigation in reaching the main goal of developing a comprehensive framework for evaluating smart container investment performance as follows:
How do Active IoT, Semi-Passive, and Passive RFID technologies compare in terms of absolute NPV, capital efficiency and payback periods?
What portfolio compositions optimise investment performance under varying capital constraints and strategic priorities?
How do premium trade route conditions alter the economic case and adoption dynamics compared to baseline routes?
Which parameters most critically influence smart container investment outcomes, and where should managers focus their attention?
Aiming to address these research questions, this study employs a systems dynamics modelling approach integrating technological, operational and financial dimensions. Parameters are derived from industry benchmarks and calibrated assumptions, with sensitivity analysis to assess robustness. The model focuses on strategic carrier-level decisions because shipping companies and container leasing firms are the primary investment decision-makers for smart container technology, controlling fleet composition, technology selection and deployment strategy. The research was conducted through four systematic stages: (1) System conceptualisation, identifying the causal structures governing technology adoption and capital flows; (2) Data collection and parameterisation, synthesizing baseline inputs from maritime industry reports; (3) Model construction, translating causal loops into mathematical stock-and-flow relationships; and (4) Scenario simulation and data analysis, generating 120-month projections across a full factorial design to evaluate capital budgeting metrics.
Data analysis employs three complementary approaches: (1) scenario comparison across a 3×3 factorial design (three adoption strategies × three portfolio compositions) to isolate effects of each strategic variable; (2) sensitivity analysis using ±20% parameter perturbation on the base case to identify key value drivers; and (3) trade route comparative analysis using baseline (multiplier 1.0) and premium (multiplier 1.32) conditions to assess route-dependent investment viability. Financial performance is evaluated using standard capital budgeting metrics: NPV, discounted payback period, and profitability index (PI).
Based on this methodological foundation, the simulation model design operationalises the theoretical constructs and parameter values into a computational framework that captures the dynamic interactions between adoption feedback loops, fleet evolution and financial performance. The following section details the structure, subsystems and mathematical formulations that constitute the system dynamics model implemented in InsightMaker.
3.1 Simulation model approach
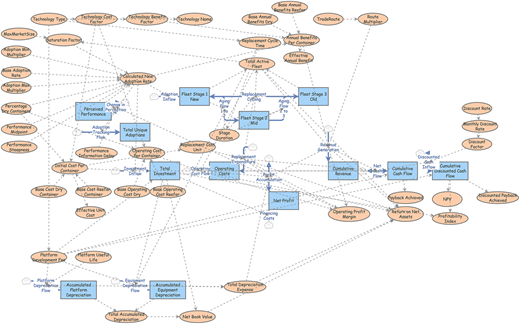
The system dynamics model comprises five interconnected subsystems that collectively capture the essential dynamics of smart container adoption and financial performance. First, the Adoption Dynamics subsystem governs S-curve diffusion patterns through performance-dependent feedback mechanisms. Second, the Fleet Ageing Chain subsystem manages container progression through three lifecycle stages with eventual hardware replacement. Third, the Financial Flow subsystem tracks net revenue generation, cost accumulation and investment requirements. Fourth, the Asset Depreciation Subsystem tracks book values and depreciation for platform and hardware. Fifth, the Investment Appraisal Subsystem calculates NPV, discounted payback and profitability index. The simulation horizon spans 120 months (10 years), with a time step of one month. Figure 1 illustrates the exported system dynamics model from Insight Maker, illustrating the core structure used in our analysis.
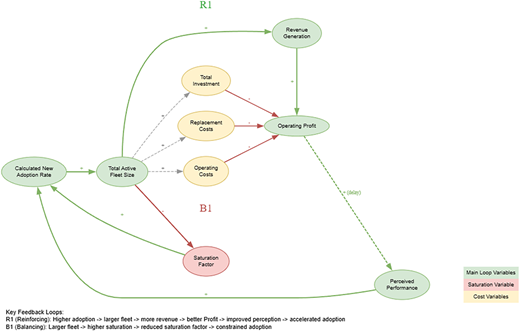
The causal loop diagram presented in Figure 2 illustrates the feedback structure underlying model behaviour. Two primary loops drive system dynamics: a reinforcing loop (R1) connecting adoption, fleet size, revenue, perceived performance and adoption; and a balancing loop (B1) connecting fleet size, saturation factor and adoption. The theoretical basis for this feedback structure draws on two established frameworks. The reinforcing loop (R1) reflects the core mechanism of Bass (1969) diffusion theory, wherein positive adoption experiences generate word-of-mouth effects that accelerate further adoption. The balancing loop (B1) captures the market saturation mechanism inherent in all logistic growth models (Verhulst, 1838), where finite market size progressively constrains adoption regardless of performance. The R1 loop creates momentum effects: higher adoption increases fleet size, generating more revenue, improving performance, enhancing perceived performance and further stimulating adoption. The B1 loop provides natural stabilisation: as fleet size approaches market saturation, the saturation factor decreases, constraining further adoption regardless of performance.
The interaction between R1 and B1 generates S-curve adoption pattern (Bass, 1969). During early deployment phases when fleet size is small relative to market potential, the saturation factor remains high and R1 dominance produces accelerating adoption. As fleet size grows, the saturation factor progressively decreases; eventually B1 dominance emerges, and adoption decelerates toward market equilibrium. The timing and shape of this transition depends on base adoption rate, performance and market size parameters.
Information delays introduce additional dynamic complexity. The performance information delay (calibrated at 12 months) represents the time required for financial results to propagate through organisational reporting systems and influence adoption decisions.
The built simulation model is structured to analyse financial and operational dynamics of adopting smart container technologies.
The core engine of the model is adoption logic, which is driven by a feedback loop based on operational performance. Unlike static cost models, this simulation incorporates a Bass-diffusion style adoption curve modified by a perceived performance delay. The Bass diffusion model was chosen because it is a well-established framework for predicting how new technologies (smart containers) spread, with parameters that capture both innovation (early adoption) and imitation (social influence). As highlighted by Vijay Mahajan et al. (1990), these factors align closely with the drivers behind rational technology adoption.
The model employs stocks representing system accumulations. We selected an ageing chain structure (Sterman, 2000) over a single-stock model to explicitly capture age-dependent replacement dynamics. Fleet stocks comprise three stages representing container lifecycle position: fleet stage 1 (new), fleet stage 2 (mid-life) and fleet stage 3 (old). Containers enter stage 1 through new adoption or hardware replacement cycling, progress through stages via ageing flows and exit stage 3 through replacement cycling back to stage 1. Replacement cycle time varies depending on the selected technology (60–84 months). This ageing chain structure enables explicit modelling of replacement dynamics that influence long-term costs.
The calculated new adoption rate is not linear; it is driven by perceived performance. As the operating profit margin improves, it feeds into perceived performance (with a 12-month information delay), which in turn accelerates adoption via a logistic function defined by steepness and midpoint thresholds. This creates a realistic “S-curve” adoption behaviour constrained by a saturation factor relative to the MaxMarketSize.
The model utilises if-then-else logic to enable the selection of three distinct technology types, each representing a specific trade-off between performance and lifecycle attributes. These are Active IoT, characterised by high costs and high benefits but a shorter lifespan; Semi-Passive, which offers a balanced medium-cost and medium-benefit profile; or Passive RFID tag, a low-cost, low-benefit alternative distinguished by its longer operational life. These technologies were compared because they represent the tracking solutions currently available in the maritime market, enabling a systematic evaluation of their respective investment outcomes and operational benefits.
Financial stocks track cumulative monetary outcomes. Cumulative revenue accumulates benefit flows from the active fleet, calculated monthly based on container count, annual benefits per container (adjusted for technology and portfolio mix) and route multipliers. Total Investment accumulates initial hardware costs for newly adopted containers plus the initial platform development fee, which varies by technology type. Operating costs accumulates ongoing maintenance, connectivity and data management expenses proportional to fleet size.
Net profit accumulates accounting profits after deducting operating costs, replacement expenditures and depreciation expenses from revenue. Cumulative cash flow shows net cash, which starts negative from platform investment and turns positive once revenue surpasses costs and capital spending. The Cumulative discounted cash flow reflects the present value using monthly discount rates based on an 8% annual rate. The perceived performance smooths actual operating profit margin through the 12-month information delay, creating the lagged signal that drives adoption decisions. The platform development fee is treated as a fixed sunk cost amortised over 72 months. Larger-scale adoption can improve financial performance not only by generating benefits earlier, but also by spreading the fixed platform investment across a larger deployed fleet.
Table 1 presents the complete parameter set employed in the model simulations. Triangulated parameters were cross-referenced across multiple independent sources, published industry market reports (IMARC Group, n.d.; MarketsandMarkets, 2022; Orion Market Research, 2026; 360 Research Reports, 2026; 6WResearch, 2025; Tse, 2025) and institutional statistics (UNCTAD, 2025; Drewry Shipping Consultants, 2024). This comparative benchmarking ensured that values reflect converging evidence from independent sources rather than isolated estimates. Calibrated parameters were set by the authors through reasoned estimation and validated through the ±20% sensitivity analysis (Section 4.2, Figure 6), which confirms that the model's investment feasibility conclusions remain stable across plausible parameter ranges. The model assumes smart functionality is achieved primarily through retrofitting conventional containers with sensors and communication equipment, rather than through purpose-built smart containers.
Due to limited availability of industrial data, the model relies on certain assumptions. To address the resulting uncertainties, a sensitivity analysis was conducted to evaluate the impact of these assumptions on the model outcomes.
The mathematical equations governing the simulation (detailed in Tables 2–5) were developed by the authors to operationalise the conceptual system dynamics structure. These equations synthesise two established theoretical frameworks. First, the financial performance metrics (Table 4) and flow accumulations (Table 5) are direct adaptations of standard corporate finance and discounted cash flow (DCF) accounting principles, calculating NPV, PI, and return on net assets (RONA). Second, the technology adoption dynamics (Table 3) are modelled using the Bass diffusion framework, which is widely applied in the literature to represent the adoption of new technologies and innovations (Bass, 1969).
Table 2 defines the technology-specific and portfolio-weighted parameters used to initialise each simulation scenario. These equations translate scenario assumptions regarding smart-container technology type and dry/reefer composition into model inputs such as cost, benefit potential, andfleet-average financial characteristics.
Table 3 presents the behavioural core of the model. These equations govern the adoption process by linking perceived operating performance to deployment speed, while constraining adoption within lower and upper bounds. The resulting structure generates an S-shaped adoption trajectory in which diffusion accelerates when perceived returns improve and slows as the market approaches saturation.
Table 4 contains the financial equations used to evaluate investment attractiveness. These equations are based on standard discounted cash-flow and investment-appraisal logic, adapted to the monthly simulation structure of the model. Their function is to convert operational deployment outcomes into financial performance indicators such as revenue, net cash flow, NPV, discounted payback period and profitability index.
Table 5 presents the stock-flow equations that generate the dynamic fleet structure over time. These relations describe how containers enter service, age through successive lifecycle states, exit through replacement, and contribute to depreciation and cash accumulation. This part of the model provides the dynamic backbone that links adoption decisions to long-run fleet evolution and investment outcomes.
The simulation-based research examines nine scenarios formed by combining three adoption strategies with three container portfolio compositions, as presented in Table 6. This factorial design enables systematic isolation of adoption rate effects and portfolio mix effects, while providing comprehensive coverage of the strategic decision space facing shipping companies.
The 3×3 factorial structure was chosen to provide a balanced experimental design that allows main effects and interactions to be identified. The three adoption rates (10,000, 20,000 and 40,000 containers/month) span the range from cautious pilot deployment to aggressive market capture, reflecting the strategic options available to a medium-sized container shipping company with a fleet potential of 1,000,000 containers.
Adoption strategies span a range from aggressive deployment targeting rapid market saturation to conservative approaches prioritizing capital preservation and risk mitigation. Aggressive strategies (40,000 containers/month base rate) reflect organisational commitment to rapid technology deployment, suitable for well-capitalised companies seeking competitive advantage through early technology leadership. Normal strategies (20,000 containers/month) represent measured deployment balancing growth objectives with capital constraints and implementation capacity. Conservative strategies (10,000 containers/month) prioritise cautious expansion, appropriate for organisations with limited capital availability or higher risk aversion.
Portfolio compositions reflect different container fleet characteristics and strategic priorities. Reefer-dominant portfolios (0% dry) maximise per-container returns by focusing on the higher-value temperature-controlled segment but require substantially higher capital investment per unit. Mixed portfolios (30% dry) balance return optimisation with capital efficiency, representing a typical composition for diversified shipping operations. Balanced portfolios (40% dry) further emphasise capital efficiency, accepting moderately lower returns in exchange for reduced per-unit investment requirements.
Scenario S5 (Normal-mixed), featuring a 30% dry and 70% reefer mix paired with a normal deployment rate (20,000 containers/month), was selected as the simulation base case to mirror a realistic, hybrid deployment strategy. It reflects how carriers prioritise tracking high-margin refrigerated units ahead of standard dry containers.
4. Results: data analysis
This section presents simulation results specifically for the Active IoT for the baseline case employing trade route multiplier of 1.0, representing average global operating conditions. Results are organised into adoption dynamics, financial performance and sensitivity analysis subsections. Section 5 subsequently examines the impact of premium route deployment (multiplier 1.32) through comparative analysis.
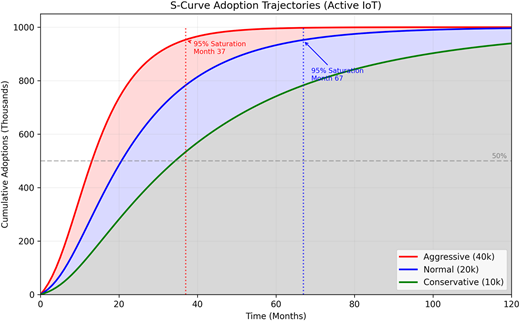
Figure 3 presents S-curve adoption trajectories for Active IoT under the three adoption strategies with mixed portfolio composition (30% dry). The characteristic of S-shaped pattern emerges from the interaction between the reinforcing performance feedback loop (R1) and the balancing saturation loop (B1). During initial deployment phases, low fleet size maintains high saturation factor while positive performance feedback accelerates adoption beyond base rates. As fleet size increases, saturation effects progressively constrain growth, eventually dominating to produce the characteristic deceleration toward market equilibrium. Aggressive adoption reaches 95% market saturation by month 37, normal adoption by month 67, and conservative adoption does not reach 95% saturation within the 10-year period.
Table 7 presents detailed adoption milestone metrics for Active IoT across all nine scenarios. The 50% coverage milestone (500,000 containers) provides a useful reference point for comparing adoption speed across strategies. Aggressive strategies achieve 50% coverage at approximately months 13–15, normal strategies at month 21, and conservative strategies at months 34–35. This progression reflects the combined effects of different base adoption rates and the moderating influence of lower operating profit margin feedback under baseline trade conditions.
Peak adoption rates demonstrate the amplifying effect of the operating profit margin feedback loop. Under baseline conditions (multiplier 1.0), Aggressive strategies achieve peak rates of approximately 46,117–47,707 containers per month, representing a 115–119% utilisation of base capacity (40,000/month). Normal strategies peak at approximately 29,390–30,365 containers per month (147–152% of base capacity), while conservative strategies peak approximately at 17,712–18,261 (177–183% of base capacity). The higher percentage amplification for slower strategies reflects longer exposure to the growth phase before saturation constraints dominate.
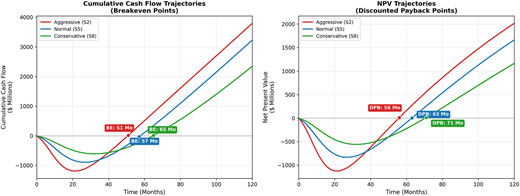
Figure 4 presents the cumulative cash flow and NPV trajectories, with the breakeven point and discounted payback period indicated. All scenarios begin with negative cash flow reflecting initial platform investment ($5M) and ongoing capital deployment during growth.
The left panel shows cumulative cash flow crossing zero at the breakeven point, while the right panel shows NPV (cumulative discounted cash flow) crossing zero at the discounted payback point. The discounted payback is consistently 5–6 months longer than simple payback, reflecting the time value adjustment that reduces the present value of future cash flows. This difference is particularly important for capital budgeting decisions, as it represents a financially accurate assessment of investment recovery.
Table 8 presents comprehensive investment appraisal metrics across all nine scenarios under baseline conditions (Technology type = Active IoT, trade multiplier 1.0) using an 8% annual discount rate.
All scenarios achieve positive NPV under baseline conditions, indicating value creation above the 8% cost of capital. Profitability index ranges from 1.5 to 1.97, with all values exceeding 1.0, confirming that every dollar invested generates more than one dollar in present-value returns. Reefer-dominant portfolios consistently outperform mixed and balanced configurations due to higher per-unit benefit generation, though they require substantially higher capital investment. In addition, the higher NPV and PI values for aggressive strategies relative to conservative strategies partly reflect the fixed-cost dilution effect: faster fleet growth spreads the platform development fee across a larger revenue base earlier in the simulation horizon, which results in improving cumulative discounted returns.
4.1 Technology comparison analysis
The comparative analysis of smart container tracking and tracing technologies reveals distinct cost-benefit profiles across the three technology tiers.
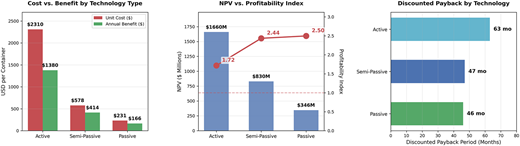
Figure 5 compares investment outcomes across the three technology types (Active, Semi-Passive and Passive) for the normal-mixed scenario on baseline routes. The left panel reveals the cost differences between technologies: Active IoT technology commands the highest unit cost at $2,310 per container, reflecting its comprehensive real-time tracking capabilities, continuous connectivity and advanced sensor integration. However, this premium investment yields correspondingly substantial annual benefits of $1,380 per container through enhanced cargo visibility, reduced theft and loss, improved supply chain optimisation, and real-time condition monitoring. Semi-Passive technology offers a compelling middle-ground solution at $578 per unit with annual benefits of $414, while Passive RFID represents the most economical entry point at $231 per container, generating $166 in annual benefits. The centre panel shows the NPV-PI trade-off: Active systems generate the highest NPV ($1,660M), but have the lowest PI (1.72), while Passive systems generate the lowest NPV ($346M) but achieve the highest PI (2.5). Passive RFID achieves capital recovery in 46 months, marginally outperforming Semi-Passive technology at 47 months, while Active IoT requires 63 months to reach payback, i.e. 37% longer capital recovery period.
Organisations with shorter investment horizons, limited capital availability or higher cost-of-capital constraints may find Passive or Semi-Passive technologies more aligned with their financial objectives, despite the reduced functionality. Conversely, operators prioritizing comprehensive supply chain visibility and willing to accept extended payback periods may justify Active IoT investment based on its superior absolute NPV and enhanced operational capabilities.
4.2 Sensitivity analysis
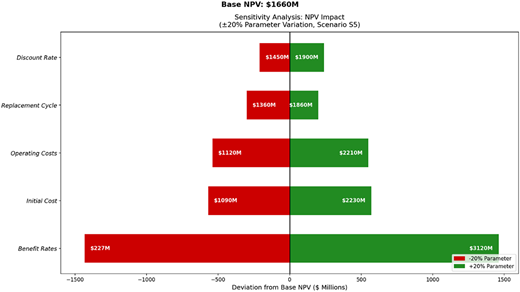
Figure 6 presents sensitivity analysis results examining the impact of ±20% parameter variations on NPV. Benefit rates emerge as the most influential parameter, with NPV ranging from $227M (−20% benefits) to $3,120M (+20% benefits), having a $2,893M impact range representing 174% of base NPV. This finding underscores the importance of accurate benefit estimation and robust benefit measurement systems for smart container deployments. Organisations should invest significantly in establishing baseline metrics and tracking actual benefit realisation.
Initial hardware cost ranks second, with an impact range of $1,140M ($1,090M to $2,230M). The asymmetric effect reflects the capital denominator: cost increases compress margins. Operating costs show similar sensitivity ($1,090M range, from $1,120M to $2,210M), highlighting the importance of controlling ongoing operational expenditure. Replacement cycle sensitivity ($500M range, from $1,360M to $1,860M) demonstrates a moderate impact from equipment lifecycle assumptions. Discount rate sensitivity ($450M range, from $1,450M to $1,900M) shows that NPV is moderately sensitive to cost of capital assumptions, i.e. organisations with lower discount rates will see higher NPV valuations.
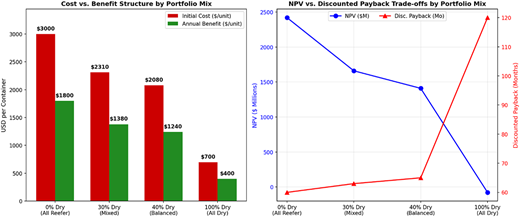
Figure 7 presents portfolio analysis examining cost-benefit structures and NPV trade-offs across different container mix compositions with the base adoption rate of 20,000, technology type of Active IoT and baseline trade route.
The left panel shows how initial costs and annual benefits are scaled with portfolio composition. Pure reefer portfolios (0% dry) incur $3,000 cost per container but generate $1,800 annual benefit. As dry percentage increases, both decline proportionally, with 100% dry at $700 cost and $400 benefit. The right panel reveals a critical finding: while all-reefer portfolios generate the highest NPV ($2,420M) with the fastest discounted payback (60 months), the 30% dry mixed portfolio offers strong performance ($1,660M NPV, 63 months payback) with significantly lower capital requirements.
Notably, the 100% dry portfolio exhibits negative NPV (-$77M) and extended discounted payback (120+ months), making it financially unattractive under baseline conditions. This implies that refer container inclusion is essential for viable smart container investment economics when using Active IoT technology, unless premium trade routes or lower-cost technology types (such as Semi-Passive or Passive RFID) can compensate for lower per-unit margins.
4.3 Trade route analysis
This subsection examines the impact of trade route characteristics on smart container investment performance by comparing baseline results (multiplier 1.0) with premium route deployment (multiplier 1.32, representative of Asia-Europe trade). As described in Section 3, the 32% benefit enhancement is a derived and assumed factor reflecting mechanisms through which premium routes increase the economic value of smart containers: extended transit time amplifying monitoring value, demurrage and detention cost avoidance at congestion-prone hub ports, higher cargo value density increasing the per-event value of loss prevention and demonstrated carrier ability to charge premium visibility service fees on these corridors.
Table 9 presents comparative financial metrics for Active IoT technology type normal-mixed scenario (S5) across both trade route conditions, illustrating the impact of route selection on investment outcomes. Premium route deployment increases NPV by 142% (from $1,660M to $4,010M), accelerates discounted payback by 21 months (from 63 to 42 months), and achieves faster market penetration across all milestones.
The adoption acceleration on premium routes (1 month faster to 50% coverage, 5 months faster to 95% coverage) results from stronger NPV feedback effects. Higher benefits generate improved operating margins, enhancing perceived performance and stimulating faster adoption. Peak adoption rates increase by 7.9% on premium routes (from 29,718to 32,047 containers/month), demonstrating the amplifying effect of the reinforcing feedback loop when benefit conditions are favourable.
Table 10 extends the comparison across all nine scenarios, revealing consistent patterns in trade route effects. NPV improvements range from 118 to 174% points across scenarios. Discounted breakeven acceleration ranges from 18 to 26 months, with conservative strategies showing larger absolute improvements due to their longer baseline breakeven periods.
The performance differential between baseline and premium route conditions carries important strategic implications for deployment prioritisation. Companies operating on multiple trade routes should consider phased deployment strategies that prioritise premium routes for initial deployment, establishing positive NPV track records that build organisational confidence and generate cash flows supporting subsequent expansion to baseline routes.
The interaction between adoption strategy and trade route creates a strategic decision matrix. Aggressive strategies on premium routes offer the fastest path to profitability (36–38 months to discounted payback) but require substantial capital commitment and organisational capacity. Conservative strategies on premium routes still achieve attractive NPV ($2,680M-$4,210M) with more manageable capital requirements, potentially suitable for organisations seeking to validate technology before full commitment. Conservative strategies on baseline routes remain viable with positive NPV ($978M-$1,730M) but require extended investment horizons (68–73 months to discounted payback), suggesting this combination may be most appropriate for organisations with patient capital and limited premium route exposure.
The 100% dry portfolio presents a noteworthy edge case. Under baseline conditions with Active IoT technology, pure dry portfolios exhibit negative NPV (-$77M) and dramatically extended discounted payback (120+ months), rendering them financially unviable. Premium route deployment transforms this outcome, enabling dry-only portfolios to achieve positive NPV with reduced discounted payback, though returns remain below those from mixed portfolios. This finding suggests that organisations with exclusively dry container fleets should either target premium routes, consider lower-cost technology tiers (such as Semi-Passive or Passive RFID) or implement hybrid strategies incorporating reefer containers to improve investment economics.
5. Concluding discussion
This research demonstrates that smart container investments generate positive NPV across all examined scenarios, with premium route deployment substantially outperforming baseline conditions. Trade route selection emerges as the primary determinant of investment performance, while technology-tier choices create distinct cost-benefit trade-offs between absolute value creation and capital efficiency. Benefit realisation rates represent the most critical success factor affecting investment outcomes.
The simulation results corroborate the theoretical frameworks identified in the literature review. The S-curve adoption trajectories (Figure 3) confirm Bass's (1969) diffusion theory. This demonstrates that, in capital-intensive deployments, adoption speed is a dynamic function of investment return. The predominance of benefit realisation rates in the sensitivity analysis supports Durlik et al.’s (2023) conclusion that data analytics capability, rather than hardware, is the critical differentiator in maritime IoT. The results also corroborate the existing literature's emphasis on the viability of smart containers in high-value cold chain applications (Cil et al., 2022; Castelein et al., 2020). Consistent with adoption patterns observed in pharmaceutical logistics (Sykes, 2018), the financial analysis indicates that smart container adoption is likely to follow a “reefer-first, dry-later” trajectory. When benchmarked against standard capital budgeting practices, these results warrant cautious interpretation. Research indicates that acceptable payback periods typically range from under three years for small and medium-sized enterprises (SMEs) (Block, 1997) to three-to-five years more broadly (Hasan, 2013; Mota and Moreira, 2023), with technology-intensive sectors often requiring sub-two-year thresholds reflecting what Grove (1999) characterised as the “paranoid” survival mentality necessary, when technological disruption reshapes competitive landscapes.
Against these benchmarks, smart container investments occupy the outer boundary of acceptable payback horizons. Active IoT technologies in baseline scenarios frequently exceed general industry thresholds and fail to meet more aggressive technology-sector criteria. This marginal performance implies that while smart containers are functionally viable, current cost structures remain a barrier to widespread adoption.
The financial challenge for pure dry container fleets indicates that smart technology diffusion is unlikely to achieve critical mass through organic market incentives alone. Adoption appears contingent upon cross-subsidisation via high-margin reefer operations, targeted premium route deployment or adoption of lower-cost passive technologies. This economic dependency mirrors adoption patterns observed in pharmaceutical cold chains, where regulatory mandates rather than market efficiency drive uptake (Sykes, 2018). Furthermore, while the model's S-curve outputs align with diffusion theories of Bass (1969) and Rogers (2003), this study extends those frameworks by identifying operating profit margins as the decisive feedback loop affecting adoption cycles. Overcoming the “organisational readiness gap” (Bauk and Ntshangase, 2023) requires demonstrable shifts in operating margins to neutralise institutional resistance.
The high sensitivity of investment outcomes to benefit realisation rates highlights that technology is merely an enabler. Economic value derives from the organisational capability to utilise data for loss prevention and operational efficiency. This supports the conclusion that data analysis capabilities are the critical differentiator in maritime IoT applications (Durlik et al., 2023). Smart containers have reached a financial tipping point. While they are technically mature and operationally beneficial, they occupy the outer limits of acceptable payback horizons for standard commercial investments. Widespread adoption is likely to depend on the industry's ability to either reduce unit costs or access premium value streams that shorten payback periods.
The findings offer practical recommendations for shipping executives and leasing firms. Technology selection should be closely aligned with organisational capital constraints and investment timeframes. To reduce risk and boost confidence, companies are advised to implement a phased deployment strategy, initially focusing on premium trade routes to generate cash flow early on, which can then be used to support subsequent fleet expansion. Furthermore, smart container portfolios should include a minimum proportion of high-margin reefer units to ensure financial viability. As benefit realisation determines investment returns, organisations must invest in robust data analytics capabilities to leverage data fully for greater operational efficiency.
This research contributes to the literature on technology adoption by demonstrating that system dynamics modelling can integrate diffusion theory (Bass, 1969) with endogenous financial performance feedback to generate adoption trajectories. By identifying financial performance as the endogenous imitation signal, Bass diffusion theory is extended into contexts where adoption is motivated by demonstrated investment returns rather than social influence. This establishes a conceptual link between innovation diffusion and capital budgeting theory. This methodology can be applied to other maritime technology investments, such as autonomous vessel systems, port automation and alternative fuel infrastructure, where comparable dynamics between performance demonstration and deployment commitment are expected. Key limitations include the model's reliance on triangulated and calibrated parameters due to the limited availability of proprietary deployment data; the absence of modelling of competitive dynamics; binary trade route classification that does not capture variation specific to individual routes; and an incomplete capture of the risks of technological evolution and obsolescence. Future research should model competitive, multi-agent scenarios, incorporate stochastic elements to account for uncertainty and validate findings using real-world deployment data. Engaging with major shipping industry players and applying the Delphi method would strengthen parameter estimation and model calibration.