


The purpose of this study is to clarify the findings and criticisms in the extant literature concerning the theory of consumption values (TCV) by conducting a meta-analysis to (1) examine the extent to which consumption values influence consumer behavior and (2) to explore contextual and methodological factors that may account for between-study variance in the focal relationship.
The study employs a random-effects model and psychometric meta-analysis approach to examine 82 studies with 297 effect sizes in 34 countries between 1991 and 2022, inclusive.
Results reveal that consumption values have a positive significant and moderate effect on consumer behavior. Moreover, emotional value is the most influential predictor of consumer behavior, while social value is the weakest. Furthermore, the study's findings show that some contextual and methodological factors moderate the relationship between consumption values and consumer behavior.
The findings highlight that managers can work on consumption values to prompt positive consumer responses like attitude, intention, satisfaction and overall value perception. However, managers must consider that the relevance of the consumption values depends significantly on the outcome variable and the context, which calls for a tailored-made marketing strategy to appeal to consumers' diverse needs and wants.
Besides providing empirical evidence of the broad validity of the TCV, this study is the first meta-analytic review of the TCV, which integrates several insights to provide valuable research directions for future researchers and insightful implications for practitioners.
1. Introduction
The theory of consumption values (TCV) is one of the most widely used models to explain consumer choices (Sheth et al., 1991). At its core, the TCV posits that an individual's final choice is influenced by five values: functional, emotional, social, epistemic and conditional values (Sheth et al., 1991). The TCV explains how these five consumption values predict consumer preferences to buy a product or service. Sheth et al. (1991) postulate that this framework might apply to more than 200 buying situations, from home appliances (Dilotsotlhe and Duh, 2021), food consumption (Chakraborty and Dash, 2023; Jebarajakirthy et al., 2021), touristic products (Rousta and Jamshidi, 2020), food delivery apps (Chakraborty et al., 2022a; Kaur et al., 2021), online brands (Fathima et al., 2022), to ayurveda products (Chakraborty et al., 2022b). These studies establish the relevance of the TCV across diverse contexts and provide a multidimensional view of consumption value and behavioral outcomes. The extensive research on consumption values has resulted in a substantial body of knowledge. Consequently, marketing scholars have conducted comprehensive literature reviews to synthesize the existing findings and provide valuable insights into the predictive capacity of TCV (e.g. Kushwah et al., 2019; Tanrikulu, 2021).
However, there are still some important issues that require further attention. First, empirical research reveals mixed and contradictory findings regarding the effect of consumption values on consumer behavior. For instance, some authors reported that all the consumption values have positive effects on consumer behavioral outcomes (Chakraborty et al., 2023; Du et al., 2021), while others observed that social, conditional and emotional values have non-significant or even negative effects on consumer behaviors (e.g. Khan and Mohsin, 2017; Rahnama and Rajabpour, 2017; Suki and Suki, 2015). Yet, a meta-analysis that synthesizes the knowledge about the consumption values → consumer behavior (CVs → CB) relationship is non-existent. In addition, there is no knowledge about how elements related to study characteristics – whether methodological or contextual – may alter the focal relationship. Hence, the nature of the CVs → CB relationship remains unclear, and research is scattered and fragmented across contexts and disciplines. This ambiguity is not due to an absence of studies on consumption values. Instead, we miss an organizing conceptual framework and a large pool of data from different contexts to enable us to ascertain whether each consumption value exerts a similar effect on consumers and under what conditions.
To investigate this problem, it is necessary to theorize the nature of consumption values and their sub-dimensions more carefully for marketing research and to build a contextualized perspective that considers contextual and methodological factors (Tanrikulu, 2021). More specifically, we aim to address the following research questions:
What is the direction and magnitude of the effect of consumption values (small, moderate, or large) on consumer behavior?
What contextual and methodological factors moderate the relationship between consumption values and consumer behavior?
Our study addresses these research questions using a meta-analytic approach. A meta-analysis is a systematic review of the literature that statistically synthesizes existing empirical research by estimating the true effect size (corrected for sampling bias of original studies and unreliability). It allows researchers to discover substantive and methodological boundary conditions (Combs et al., 2019). Specifically, we conducted a random-effects meta-analysis of 82 studies with 141,409 observations to calibrate and combine studies on consumption values, integrating evidence across disciplines, cultures, timeframes and 34 countries. We performed a psychometric meta-analysis, sub-group analysis and meta-analysis regressions based on best practices guidelines (Combs et al., 2019; Hunter and Schmidt, 2000).
By doing so, we contribute to marketing research and practice in the following ways. First, we provide a more profound theoretical understanding of consumption values. We analyze their overall effect on consumer behavior, recognize their diverse nature and explore their relationships with different behavioral outcomes. This helps us reconcile the mixed and inconsistent findings in the field and determine whether consumption values have a positive, negative, or non-significant effect on various consumer responses. Second, our study highlights the importance of considering contexts and methodological designs in understanding the relationship between consumption values and consumer behavior. Previous research has often overlooked the role of these important elements, assuming that this relationship is independent of factors such as the human development index, product type, sector, or the methods used. Addressing this, our study takes a context and methodologically-sensitive perspective and recognizes that these factors can significantly influence the impact of consumption values on behavioral responses. By incorporating the contexts and the methods into our analysis, we contribute to a more nuanced understanding of how consumption values operate in different settings. Third, we propose a comprehensive and organized conceptual framework that includes consumption values and their dimensions, as well as consumer responses and their dimensions. Taken together, and unlike systematic reviews (e.g. Tanrikulu, 2021), which do not account for sampling, stochastic, measurement and external validity issues (Hunter and Schmidt, 2000), a meta-analytic review enables us to take an objective and quantitative approach to synthesizing studies on consumption values and behavioral outcomes. This approach helps us to obtain statistically precise and dependable conclusions regarding the strength and direction of the relationships between variables, a theoretical value that may not be forthcoming in qualitative reviews. Additionally, meta-analysis assists in resolving conflicting findings from prior studies by examining the influence of moderator variables. Finally, from a managerial perspective, our meta-analysis can serve as a valuable guide for marketers. By identifying the joint and relative effects of consumption values on consumer behavior, this study can help managers to identify and operationalize successful targeted strategies. For instance, leveraging emotional appeals in advertising can tap into consumers' emotional values, fostering a stronger connection and resonance with the target audience and enhancing brand loyalty and positive consumer responses. Moreover, offering special deals, discounts, seasonal promotions and loyalty programs can bolster conditional and functional values, encouraging repeat purchases and fostering positive attitudes toward the brand or product. This is relevant since marketing strategies will fail if the way services and products are designed and delivered is unrelated to what consumers value.
The rest of the paper is structured as follows. Section 2 briefly reviews the TCV framework and formulates the hypotheses underlying our meta-analysis. Section 3 describes the methodological approach. In section 4, the meta-analytical results are presented. Section 5 discusses the results and highlights the contributions to theory and practice. Finally, section 6 reports the study's limitations and future research directions.
2. Background literature and development of hypotheses
2.1 Theory of consumption values and consumer behavior
The TCV provides an understanding of the fundamental drivers behind an individual's choices via the lens of consumption values. These values are consumers' perceived utility of a product or service in terms of its performance, association with a social group, capacity to arouse emotions or curiosity, novelty and compatibility in different circumstances. Sheth et al. (1991) noted that the unidimensional conceptualization of value rarely explains the multidimensional nature of consumer behavior: consumers' judgments depend on numerous functional and non-functional components (Peng et al., 2014). Hence, Sheth and colleagues proposed the TCV by including five core values: functional, emotional, social, epistemic and conditional. Accordingly, TCV is well-recognized for explaining consumers' inherent reasons for buying (vs. not buying) a product or service.
The TCV has three fundamental propositions: (1) consumer behavior is a function of five consumption values, (2) all five consumption values are independent of each other and perceived at an individual level and (3) they have different contributions in different purchase situations (Gonçalves et al., 2016). This implies that one individual may purchase a specific mobile phone to conform with other individuals within its reference group (i.e. social value), while another may buy it for its long battery time (i.e. functional value) (Ramkissoon et al., 2009). However, the TCV is criticized for its narrow approach, as it is mainly used to examine the effect of consumption values on just choice behavior (i.e. intention to buy something). Consumers' responses to consumption values can manifest in various outcomes, including satisfaction and attitude (Tanrikulu, 2021). Thus, the present study also accounts for the influence of consumption values on diverse behavioral outcomes, namely intention, satisfaction, attitude and overall value perception.
Research exploring the relationship between consumption values and behavioral outcomes has reported mixed findings. Some studies indicate that all consumption values influence consumers' responses positively and significantly (e.g. Du et al., 2021; Suki et al., 2022), although this positive effect is not present transversally in all the TCV-based studies. As relevant examples, Khan and Mohsin (2017) reported no significant effects between functional value and green choice behavior. Omigie et al. (2017) found that social value does not influence consumer choice behavior of mobile services. Rahnama and Rajabpour (2017) revealed that conditional value does not significantly influence consumer choice of dairy products. Finally, Moon et al. (2021) also found emotional value to be one of the main obstacles to the transition toward more environmentally friendly behavior. Thus, it is clear from the literature that findings are mixed and conflicting, rendering it challenging to ascertain the actual influence of consumption values on consumer behavior. Despite the contradictory findings, we follow the theoretical proposition of the TCV to argue that consumption values positively and significantly influence consumer behavior. Thus, we hypothesize:
Consumption values have a positive effect on overall consumer behavior.
2.2 Functional value and consumer behavior
Functional value is the “perceived utility acquired from an alternative's capacity for functional, utilitarian or physical performance” (Sheth et al., 1991, p. 160). It reflects value for money, quality, price, reliability and durability. Prior research noted that this specific value leads to multiple customer responses toward a market offering. For example, empirical studies showed that functional value may increase consumers' likelihood of buying something (Baek and Oh, 2021; Muhamed et al., 2019). Moreover, studies revealed that product quality and price significantly impact consumers' attitudes (e.g. Chang and Geng, 2022; Lee et al., 2021; Zhang et al., 2020). Similarly, scholars report positive effects of functional values on consumer satisfaction (e.g. Peng et al., 2020; Sthapit et al., 2019) and perceived overall value (Alix and Vallespir, 2010). However, some studies, for example, report that functional value may not significantly influence purchase intention (e.g. Awuni and Du, 2016; Joibi and Annuar, 2021; Kaur et al., 2021). Despite the mixed results, we draw on the TCV to hypothesize the following:
Functional value has a positive and significant impact on consumer responses: (1) purchase intention, (2) attitude, (3) overall perceived value and (4) satisfaction.
2.3 Emotional value and consumer behavior
Emotional value is the “perceived utility acquired from an alternative's capacity to arouse feelings or affective states” (Sheth et al., 1991, p. 161). Emotional value is a product's capacity to connect with customers and arouse positive feelings. Some recent studies have established a positive relationship between emotional value and purchase intention (Joibi and Annuar, 2021; Koay et al., 2022). Some researchers have argued that a product's capacity to arouse pleasant feelings might positively impact consumer attitudes (e.g. Chang and Geng, 2022). Moreover, both Kim and Park (2017) and Turel et al. (2010) found that emotional value positively affects overall value perception. Finally, Carlson et al. (2015) reported evidence that customers' emotional value perception positively affects satisfaction with online channels. Drawing upon the above discussion, the following hypothesis is made:
Emotional value has a positive and significant impact on consumer responses: (1) purchase intention, (2) attitude, (3) overall perceived value and (4) satisfaction.
2.4 Social value and consumer behavior
Social value is the “perceived utility acquired from an alternative's association with one or more specific groups” (Sheth et al., 1991, p. 161). Social value assists a customer in representing himself/herself as a member of a particular social group. Literature suggests that social value has a significant, positive relationship with different consumer responses. For instance, social value positively affects purchase intention (Jamrozy and Lawonk, 2017; Joibi and Annuar, 2021), consumer attitude (Rousta and Jamshidi, 2020), consumer satisfaction (Peng et al., 2020) and overall value perception (Kim and Park, 2017) However, some studies provide contradictory results (e.g. Amin and Tarun, 2021; Chakraborty et al., 2023; Omigie et al., 2017). Notwithstanding the mixed results, we hypothesize the following relationships:
Social value has a positive and significant impact on consumer responses: (1) purchase intention, (2) attitude, (3) overall perceived value and (4) satisfaction.
2.5 Epistemic value and consumer behavior
Epistemic value is “the perceived utility acquired from an alternative's capacity to arouse curiosity, provide novelty and/or satisfy a desire for knowledge” (Sheth et al., 1991, p. 162). Epistemic value reflects a product's ability to convey knowledge and a sense of discovery. Some studies found that epistemic value has a significant positive relationship with different consumer responses. For instance, Jamrozy and Lawonk (2017) found a positive effect of epistemic value on purchase intention. Nevertheless, some researchers reported a non-significant relationship (Awuni and Du, 2016; Joibi and Annuar, 2021). Moreover, Ghufran et al. (2022) found that epistemic value leads to a positive consumer attitude. Karjaluoto et al. (2019) observed that product novelty positively correlates with overall perceived value. Similarly, multiple studies provide evidence of how product innovation, novelty and creativity are linked with customer satisfaction (e.g. Horn and Salvendy, 2009; Kim and Shim, 2014). Thus, we hypothesize the following relationships.
Epistemic value has a positive and significant impact on consumer responses: (1) purchase intention, (2) attitude, (3) overall perceived value and (4) satisfaction.
2.6 Conditional value and consumer behavior
Conditional value is “the perceived utility acquired by an alternative as the result of the specific situation or set of circumstances facing the choice maker” (Sheth et al., 1991, p. 162). Conditional value reflects a product's ability to respond appropriately in certain situations: some products may follow seasonality (e.g. heavy coats), while others may acquire much value during emergencies or specific occurrences (e.g. wedding rings, funeral services). The literature has highlighted the influence of conditional values in different contexts and on different consumer responses. For example, Qasim et al. (2019) and Chakraborty et al. (2022b) found that conditional value significantly impacts consumer purchase intention. Similarly, previous literature suggests that conditional value has a significant positive relationship with customer attitude (Suhartanto et al., 2022; Woo and Kim, 2019) and consumer satisfaction (Yeo et al., 2016). However, Awuni and Du (2016) and Joibi and Annuar (2021) reported a non-significant relationship. Considering the above, we hypothesize that:
Conditional value has a positive and significant impact on consumer responses: (1) purchase intention, (2) attitude, 3) overall perceived value and (4) satisfaction.
2.7 The moderating role of contextual factors
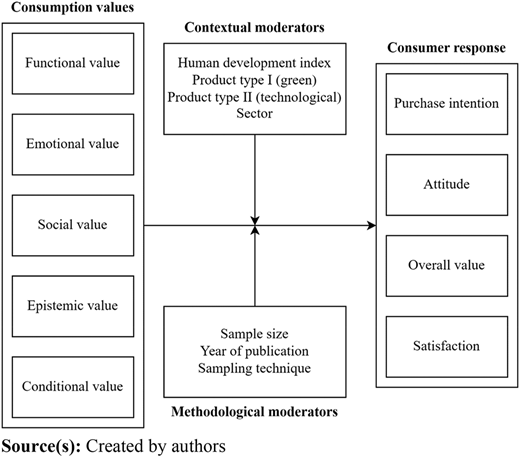
Given the mixed findings on consumption values and their outcomes, exploring what contextual and methodological factors may moderate the focal relationship is utterly relevant. To this end, we considered the moderating effect of contextual variables such as the Human Development Index (HDI), sector and product type. We selected these variables according to their potential to influence the outcomes of interest.
Consumer literature suggests that the insights generated in developed markets are rarely replicable in developing markets (Borah et al., 2020). Accordingly, we considered HDI as an indicator to differentiate developing markets from developed ones. Economic development highlights a nation's overall wealth and economic growth using different parameters or indicators like level of education, GDP, per capita income and resource endowment. Variations in these parameters may alter consumers' behaviors. Research, for instance, shows that higher education levels correspond to an increased citizens' environmental awareness and a more positive perception of green innovations (Bitencourt et al., 2020). Therefore, we expect variations in HDI to be mirrored in an altered strength and direction of the relationship between consumption values and consumer responses. This is also supported by the contingency theory perspective, which affirms that many contradictory findings in the literature may find acceptable justification in the variation of the business environment (Fang and Zhang, 2018).
The second contextual moderator considered is product type. Since different products imply different business environments, we expect a variation in empirical results due to product type. We consider two different categorizations (i.e. green vs. non-green products and technological vs. non-technological products). Green products are designed and produced to have the least environmental impact possible throughout their life cycle. Specifically, minimal non-renewable resources are consumed, toxins are avoided and renewable resource consumption occurs at the replenishment rate (Durif et al., 2010). Previous literature has demonstrated that consumers' behaviors may differ based on this product typology (Atuahene-Gima et al., 2005; Codini et al., 2018; Tariq et al., 2017). In synthesis, consumers may react differently when buying or evaluating a green or a non-green product (Tripathi and Pandey, 2018). Regarding the second product typology, research highlights that customers react differently to technological and non-technological products (Taylor et al., 2019). For example, technological products are by their very nature innovative (Opitz et al., 2016), and consumers' motivations to use them are also based on curiosity and novelty (Peng et al., 2014; Turel et al., 2010). Thus, we expect consumer choice to be driven by different consumption values regarding technological and non-technological products.
The final contextual moderator is the sector (manufacturing vs. services). Consumers' behavior in service and manufacturing may differ. For instance, consumers in the service sector may emphasize intangible factors such as convenience, customer service and personal attention, while those in the manufacturing industry may place more importance on tangible factors such as price and quality. This is supported by the recent meta-analysis from Barari et al. (2021), which shows a moderating effect of the business sector in the development of customer engagement. Together, we hypothesize the following relationships:
(1) HDI, (2-3) product type, (4) sector moderate the relationship between consumption values and consumer responses.
2.8 The methodological moderators
We also test for the effects of three method moderators: sample size, year of publication and sampling technique. Sample size has been reported as a significant moderating variable in a meta-analysis concerning usage intention (Jadil et al., 2021). Similar significant influences were also noted concerning the sampling technique, which may influence effect sizes (Kirca et al., 2005). Probabilistic samples have been found to minimize random variance errors and therefore generate stronger effect sizes than non-probabilistic samples (Fern and Monroe, 1996; Oduro et al., 2022). The last method moderator is the year of publication. As Khan (2022) argued, publication year may significantly moderate the magnitude of relationships, as consumer behaviors change over time and the appreciation of specific consumption values may have also changed. Moreover, TCV has received greater attention in the last few years. Hence, the increased application to several fields united with methodological improvements may lead to relevant variations in the results over the years. Thus, we divided our data into three periods (i.e. 1991–2001, 2002–2008 and 2009–2022). Based on the above, we hypothesize the following:
(1) Sample size, (2) year of publication, (3) sampling technique moderate the relationship between consumption values and consumer responses.
Based on the literature examined above and the hypotheses made, the meta-analytical framework of the current investigation is displayed in Figure 1.
3. Methodology
3.1 Search protocol and inclusion criteria
First, we defined the key terms to identify the articles, search boundaries, timeframe and inclusion criteria. Accordingly, the following keywords were used: “Theory of consumption values”, “Consumption values theory”, “Functional Value*”, “Conditional Value*”, “Social Value*” “Emotional Value*”, “Epistemic Value*” in combination with “Consumer” AND “Theory”. Based on these terms, we systematically searched for articles in the ISI Web of Knowledge (WOK) database between 1991 and April 2022. In the initial search, we found 320 articles. Subsequently, we restricted our sample to the studies that (1) used the TCV as a theoretical lens and (2) used original variables of the theory. As a result, we selected 119 for this meta-analysis.
Next, for a study to be included in our meta-analysis, it had to meet the following four criteria: (1) it analyzed at least one dimension of the consumption theory values as an independent variable or antecedent, (2) the study's dependent variables mirror one of our model's dependent variables (i.e. attitude, purchase intention, overall value perception and satisfaction), (3) it was quantitatively manipulated, that is, it provided enough statistical information, including correlation coefficient or its r-contrast like Beta, p-value, T-value, F-value of the relationships examined and (4) it had to be independent, where two different results are presented from the same sample. Based on the inclusion and exclusion criteria, 37 papers were removed, leaving 82 articles for data analysis.
3.2 Meta-analytic models
The two principal models for conducting a meta-analysis are fixed and random-effects models (Borenstein, 2009). Under the fixed model, the studies are assumed to be homogenous, in which sampling error is the sole reason for the variability in the results. In contrast, the random effects model assumes heterogeneity across the studies, attributing variability to sampling error and other methodological variabilities such as operationalization and external validity factors (Hunter and Schmidt, 2000). In this investigation, since we integrated studies across divergent industries, country contexts and methodological disparities, we used the random effects model as it allows us to account for between-study variance (i.e. heterogeneity) across the studies (Zubeltzu-Jaka et al., 2018).
3.3 Effect size metric and integration
Research identifies four main metrics for assessing effect sizes in a meta-analysis: correlation coefficient, standard mean difference, risk ratio and odds ratio (Borenstein, 2009). We employed the correlation coefficient as the effect-size metric in this study. Our choice was based on the following reasons: (1) it is the commonly employed meta-analytic metric in marketing studies (De Nisco, 2010; Roschk et al., 2017), (2) it is simple to interpret and (3) it permits r-contrast to be estimated in situations where a study does not report the correlation coefficients directly (Wang and Yang, 2008). The r-contrast represents correlation coefficient variants (e.g. F-statistics, T-statistic, p-value) (Rosenthal, 1995; Rosenthal and DiMatteo, 2001) and regression coefficient (Peterson and Brown, 2005). In integrating the effect sizes, we either hand-picked the correlation coefficients directly from the studies or computed them from the r-contrast based on the conversion procedures of Rosenthal and DiMatteo (2001) and de Matos et al. (2007). The regression coefficients and betas were converted using the formula: r = 0.98 B + 0.05λ with λ = 1 when B > 0 and λ = 0 when B < 0 (Peterson and Brown, 2005). For the studies that reported only p-values, we used the conversion procedure recommended by Rosenthal and DiMatteo (2001) to convert them to correlation coefficients, while the studies that reported non-significant effects were set equal to zero. Finally, we averaged the effect sizes to overcome the bias originating from the overrepresentation of samples in the articles that reported more than one measure of correlations for the same association (Schmidt and Hunter, 2015).
3.4 Robustness checks
We also carried out some robustness checks to ensure the reliability and symmetry of our data. First, we checked for outliers in the effect sizes; however, the distribution of the mean effect sizes revealed no outliers since the effect sizes did not have more than two standard errors below or above the effect size (Rosenbusch et al., 2019). Moreover, we followed the suggestion of Huffcutt and Arthur (1995) and Geyskens et al. (2009) to compute the sample-adjusted meta-analytic deviancy statistics to account for the influential effect of large sample sizes on results. We discovered three potential outliers; nevertheless, running the meta-regression without those studies did not alter the findings. Finally, we checked whether our findings held if we used the number of study objects rather than the number of observations as the sample size. Here again, our findings revealed robustness.
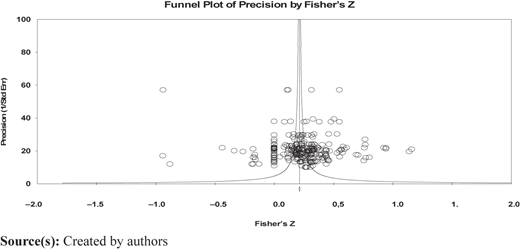
Moreover, we used funnel plots and Fail-safe N approaches to examine publication bias. Publication bias is the concern that studies with significant outcomes or subgroups may be given precedence over non-significant ones (Cooper et al., 2009). Our funnel plot shows that the effect sizes are symmetrically distributed around the underlying effect size and are evenly spread around the funnel, indicating that error in publication bias is no problem in our data (Figure 2). Supportively, the Fail-safe N, which considers how many new studies are required to bring the overall true effect to non-significance (Rosenthal, 1979), was 11,566. This exceeded the critical value of 5*K+10 (5*297 + 10) = 1,495, suggesting no significant bias across studies.
3.5 Data analysis tool
We used comprehensive meta-analysis version 3.0 for the data analysis (Borenstein et al., 2013). This software allows researchers to check the sampling and measurement errors across the studies, automatically calculate the homogeneity and heterogeneity indices, and analyze the publication bias and the fail-safe N statistic. Our results are presented in the next section.
4. Findings and analysis
Table 1 reports the effects of consumption values on consumer behavior, attitude, intention, overall value perception and satisfaction. Our findings suggest that the average strength of the aggregate effect sizes is small-moderate (0.06–0.41). We considered Cohen's (1988) criteria to interpret the effect sizes (i.e. 0.20 for small, 0.50 for medium and 0.80 for large). Table 1 shows that the aggregate effect of consumption values on overall consumer behavior is positive and significant (rz = 0.21; p. < 0.01) since the confidence interval does not include zero. Although moderate, this effect indicates that consumption values positively and significantly affect consumers' responses and behavior. Accordingly, H1 is supported. Moreover, analyzing the individual effects, we observed that emotional value (rz = 0.24; p. < 0.01) has the strongest effect, followed by epistemic value (rz = 0.23; p. < 0.01), functional value (rz = 0.22; p. < 0.01), conditional value (rz = 0.20; p. < 0.01) and social value (rz = 0.18; p. < 0.01).
Overall effects of Consumption values (CVs) on overall consumer behavior (CB)
| N | K | rz | −CI | +CI | Z | p | Q | I-S | |
|---|---|---|---|---|---|---|---|---|---|
| Aggregate effects | |||||||||
| CVs → Overall CB | 141,409 | 297 | 0.21*** | 0.18 | 0.25 | 13.08 | 0.00 | 11,322.12 | 97.30 |
| Overall effect of CVs dimensions | |||||||||
| Conditional value → Overall CB | 21,549 | 46 | 0.20*** | 0.14 | 0.27 | 5.95 | 0.00 | 936.23 | 93.06 |
| Emotional value → Overall CB | 30,995 | 66 | 0.24*** | 0.18 | 0.29 | 8.25 | 0.00 | 8,923.15 | 97.30 |
| Epistemic value → Overall CB | 27,406 | 52 | 0.23*** | 0.17 | 0.30 | 6.91 | 0.00 | 2,218.8 | 98.66 |
| Functional value → Overall CB | 30,419 | 66 | 0.22*** | 0.12 | 0.31 | 4.27 | 0.00 | 27,662.6 | 92.71 |
| Social value → Overall CB | 31,040 | 67 | 0.18*** | 0.13 | 0.23 | 7.30 | 0.00 | 37,662.6 | 92.61 |
| Overall effect on CB dimensions | |||||||||
| Purchase intentions | 95,621 | 226 | 0.21*** | 0.19 | 0.25 | 13.85 | 0.00 | 4,257.59 | 94.81 |
| Attitude | 11,178 | 22 | 0.19*** | 0.11 | 0.26 | 4.76 | 0.00 | 18,704.9 | 98.24 |
| Overall value | 21,134 | 15 | 0.23*** | 0.03 | 0.45 | 1.77 | 0.08 | 1,671.54 | 92.70 |
| Satisfaction | 13,476 | 34 | 0.22*** | 0.14 | 0.29 | 5.76 | 0.00 | 1,677.54 | 96.70 |
Note(s): K (effect sizes); N (observations); rz (standardized correlations coefficient). Significance levels: * Significant at 0.1; **significant at 0.05; *** Significant at 0.001
Source(s): Created by authors
Table 2 shows the empirical findings of the disaggregate effects of consumption values on the different consumer responses considered. Our results revealed that epistemic value (rz = 0.25, p. < 0.01), emotional value (rz = 0.23, p. < 0.01), social value (rz = 0.18, p. < 0.01) and conditional value (rz = 0.20, p. < 0.001) have a significant and positive impact on purchase intention, but functional value (rz = −0.06, p. = 0.92) does not. However, it is worth noting that the effect of epistemic value was the strongest. Coherently, we can accept H3a, H4a, H5a and H6a, and reject H2a. Furthermore, we found that the consumption value with the strongest effect on attitude is social value (rz = 0.28, p. < 0.01), followed by emotional value (rz = 0.25, p. < 0.001) and functional value (rz = 0.10, p. < 0.05). Epistemic value (rz = 0.14, p. = 0.30) and conditional value (rz = 0.13, p. = 0.35) do not significantly influence attitude. Hence, H2b, H3b and H4b are accepted, while H5b and H6b are rejected. Moreover, findings showed that epistemic value (rz = 0.41; p. < 0.01), conditional value (rz = 0.30; p. < 0.01), emotional value (rz = 0.28; p. < 0.001) and social value (rz = 0.17; p. < 0.01) have a significant and positive effect on overall value perception, while functional value (rz = −0.06, p. = 0.92) does not. Here again, the influence of epistemic value is deemed as the strongest. This leads to the acceptance of H3c, H4c, H5c and H6c and the rejection of H2c. Finally, conditional value (rz = 0.17; p. < 0.05), emotional value (rz = 0.29; p. < 0.01), social value (rz = 0.10; p. < 0.05) and functional value (rz = 0.34; p. < 0.01) have a significant, positive effect on customer satisfaction, with the effect of functional value being the strongest. However, epistemic value showed a non-significant effect on satisfaction (rz = 0.01, p. = 0.94). Thus, we confirm H2d, H3d, H4d and H6d while disconfirming H5d. Overall, our findings imply that the strength and relevance of the consumption values depend on the outcome variable considered.
Disaggregate effects of consumption values on different consumer responses
| Disaggregate effects | N | K | rz | −CI | +CI | Z | p | Q | I-S |
|---|---|---|---|---|---|---|---|---|---|
| Conditional value → Intention | 16,267 | 38 | 0.20*** | 0.12 | 0.28 | 4.91 | 0.00 | 765.070 | 95.97 |
| Emotional value → Intention | 20,595 | 49 | 0.23*** | 0.15 | 0.30 | 5.97 | 0.00 | 1990.05 | 93.09 |
| Epistemic value → Intention | 18,836 | 41 | 0.25*** | 0.18 | 0.31 | 7.07 | 0.00 | 775.01 | 95.35 |
| Functional value → Intention | 4,416 | 03 | −0.06 | −0.82 | 0.78 | −0.10 | 0.92 | 11,834.90 | 93.61 |
| Social value → Intention | 20,525 | 50 | 0.18*** | 0.12 | 0.25 | 5.56 | 0.00 | 11,824.90 | 92.61 |
| Conditional value → Attitude | 303 | 02 | 0.13 | −0.14 | 0.38 | 0.94 | 0.35 | 775.07 | 94.97 |
| Emotional value → Attitude | 2,707 | 05 | 0.25*** | 0.16 | 0.33 | 5.22 | 0.00 | 1990.00 | 97.09 |
| Epistemic value → Attitude | 2,707 | 05 | 0.14 | −0.12 | 0.39 | 1.04 | 0.30 | 775.01 | 95.35 |
| Functional value → Attitude | 2,754 | 05 | 0.10** | 0.00 | 0.19 | 2.03 | 0.04 | 1834.90 | 93.61 |
| Social value → Attitude | 2,707 | 05 | 0.28*** | 0.15 | 0.41 | 4.16 | 0.00 | 1834.90 | 97.71 |
| Conditional value → Overall value | 3,432 | 02 | 0.30*** | 0.27 | 0.33 | 18.40 | 0.00 | 725.07 | 92.97 |
| Emotional value → Overall value | 4,592 | 04 | 0.28*** | 0.13 | 0.42 | 3.63 | 0.00 | 1994.05 | 92.09 |
| Epistemic value → Overall value | 4,347 | 03 | 0.41*** | 0.29 | 0.51 | 6.46 | 0.00 | 775.01 | 91.35 |
| Functional value → Overall value | 4,416 | 03 | −0.06 | −0.82 | 0.78 | −0.01 | 0.92 | 11,134.90 | 91.61 |
| Social value → Overall value | 4,347 | 03 | 0.17*** | 0.09 | 0.26 | 3.86 | 0.00 | 11,234.90 | 93.61 |
| Conditional value → Satisfaction | 1,547 | 04 | 0.17** | 0.03 | 0.30 | 2.41 | 0.02 | 745.07 | 95.97 |
| Emotional value → Satisfaction | 3,101 | 08 | 0.29*** | 0.12 | 0.43 | 3.42 | 0.00 | 1990.05 | 99.09 |
| Epistemic value → Satisfaction | 1,516 | 03 | 0.01 | −0.18 | 0.19 | 0.07 | 0.94 | 775.01 | 95.35 |
| Functional value → Satisfaction | 3,851 | 10 | 0.34*** | 0.22 | 0.46 | 5.30 | 0.00 | 11,234.90 | 93.61 |
| Social value → Satisfaction | 3,461 | 09 | 0.10** | 0.02 | 0.18 | 2.36 | 0.02 | 11,634.90 | 95.61 |
Note(s): K (effect sizes); N (observations); rz (standardized correlations coefficient). Significance levels: * Significant at 0.1; **significant at 0.05; *** Significant at 0.001
Source(s): Created by authors
Since Q statistic and Higgin's value demonstrate that the effect sizes contain heterogeneity, we considered subgroup analysis and MARA to perform moderator analysis (see Tables 3–5). The subgroup analysis results offered support for the moderating effect of HDI (QB = 2.79, p. < 0.05), while the MARA (Coeff. = 0.09, p. = 0.79) does not. Thus, H7a is partially supported. For product type I, the relationship between overall consumption values and consumption behavior was more robust in green products (rz = 0.22, p. < 0.01) than in non-green products (rz = 0.21, p < 0.01). The MARA showed significant results (Coeff. = 0.08, p. < 0.05), verifying H7b. Moreover, our subgroup analysis revealed no significant moderation effect of product type II (QB = 2.92, p = 0.06; MARA: Coeff. = 0.02, p = 0.48), thus rejecting our H7c. Finally, the moderating effect of sector, grouped into manufacturing and service, is also not supported (QB = 1.92, p. = 0.07; MARA: Coeff. = 0.06, p. = 0.79). Therefore, we cannot confirm H7d.
Effects of contextual moderators on the overall CVs → CB relationship
| Contextual moderators | N | K | rz | −CI | +CI | Z | p | QB | p |
|---|---|---|---|---|---|---|---|---|---|
| Product Type I | 3.92* | 0.054 | |||||||
| Green products | 66,759 | 142 | 0.22*** | 0.17 | 0.26 | 7.58 | 0.00 | ||
| Non-green products | 74,650 | 155 | 0.21*** | 0.18 | 0.24 | 12.47 | 0.00 | ||
| Product Type II | 2.94* | 0.062 | |||||||
| Technological | 72,021 | 180 | 0.21*** | 0.17 | 0.25 | 11.00 | 0.00 | ||
| Non-technological | 69,388 | 117 | 0.22*** | 0.17 | 0.27 | 7.85 | 0.00 | ||
| Human development index | 2.79** | 0.031 | |||||||
| Developed country | 95,935 | 210 | 0.20*** | 0.16 | 0.24 | 9.93 | 0.00 | ||
| Developing country | 45,474 | 87 | 0.25*** | 0.19 | 0.30 | 9.08 | 0.00 | ||
| Sector | 1.92* | 0.078 | |||||||
| Manufacturing | 74,295 | 178 | 0.21*** | 0.18 | 0.25 | 11.23 | 0.00 | ||
| Service | 67,114 | 119 | 0.22*** | 0.16 | 0.27 | 7.74 | 0.00 | ||
Note(s): K (effect sizes); N (observations); rz (standardized correlations coefficient). Significance levels: * Significant at 0.1; **significant at 0.05; *** Significant at 0.001
Source(s): Created by authors
Effects of method moderators on the overall CVs → CB relationships
| Method moderators | N | K | rz | −CI | +CI | Z | p | QB | p |
|---|---|---|---|---|---|---|---|---|---|
| Sample size | 6.02** | 0.01 | |||||||
| Large sample | 140,169 | 287 | 0.22*** | 0.19 | 0.25 | 13.30 | 0.00 | ||
| Small sample | 1,240 | 10 | 0.04 | −0.21 | 0.29 | 0.32 | 0.75 | ||
| Year of publication | 4.33** | 0.012 | |||||||
| 1991–2001 | 725 | 05 | −0.18 | −0.53 | 0.22 | −0.89 | 0.37 | ||
| 2002–2008 | 1,080 | 03 | 0.30** | 0.06 | 0.52 | 2.41 | 0.02 | ||
| 2009–2022 | 139,604 | 289 | 0.22*** | 0.19 | 0.25 | 13.33 | 0.00 | ||
| Sampling technique | 0.11 | 0.74 | |||||||
| Non-probabilistic | 117,792 | 249 | 0.21*** | 0.18 | 0.25 | 11.78 | 0.00 | ||
| Probabilistic | 23,617 | 48 | 0.23*** | 0.15 | 0.30 | 5.80 | 0.00 | ||
Note(s): K (effect sizes); N (observations); rz (standardized correlations coefficient). Significance levels: * Significant at 0.1; **significant at 0.05; *** Significant at 0.001
Source(s): Created by authors
Meta-regression of moderators on the overall CVs→CB relationships
| Coeff | S.E. | −CI | +CI | Z | p | R2 | |
|---|---|---|---|---|---|---|---|
| Product type I | 0.081* | 0.06 | 0.03 | 0.18 | 1.89 | 0.050 | 0.059 |
| Product type II | 0.024 | 0.03 | −0.09 | 0.04 | 0.71 | 0.480 | 0.013 |
| Human development index | 0.09 | 0.01 | −0.37 | 0.02 | 0.79 | 0.749 | 0.020 |
| Sector | 0.067 | 0.04 | −0.02 | 0.15 | 1.49 | 0.790 | 0.135 |
| Sample size | 0.291*** | 0.08 | 0.39 | 0.45 | 2.82 | 0.001 | 0.098 |
| Year of publication | 0.501** | 0.21 | 0.09 | 0.91 | 2.39 | 0.020 | 0.124 |
| Sampling technique | 0.007 | 0.05 | −0.08 | 0.10 | 0.17 | 0.867 | 0.001 |
Note(s): Significance levels: * Significant at 0.1; **significant at 0.05; *** Significant at 0.001
Source(s): Created by authors
In addition, the results of methodological variables showed that the relationship between overall consumption values and consumption behavior was stronger for large samples (rz = 0.22; p. < 0.01) than for small samples (rz = 0.04, p = 0.75). The MARA showed similar results (Coeff. = 0.29, p. < 0.01), thus verifying H8a. Moreover, the year of publication accounts moderate the CVs → CB relationship (QB = 4.33, p. = 0.012; MARA: Coeff. = 0.50, p. < 0.05), thus confirming H8b. However, sampling technique (QB = 0.11; p = 0.74; MARA: Coeff. = 0.007, p = 0.86) was not found to moderate the relationship between consumption values and behaviors, thereby disconfirming H8c.
5. Discussion
The TCV framework has gained significant attention in recent years in consumer research. However, the influence of consumption values on consumer behavior has yielded contrasting results in prior literature, mainly due to its heavy dependence on the study context (Sheth et al., 1991). These mixed findings have created a need to clarify the existing evidence and establish a more comprehensive understanding of the relationship between consumption values and consumer behavior. Therefore, the primary objective of the current study was to address this research gap by conducting a meta-analysis that explores and synthesizes research on the CVs → CB relationships.
In addressing the first research question, our findings reveal a positive, moderate effect of consumption values on consumer behavior. This implies that the overall impact of consumption values on consumer behavior is significant and supports the notion that the TCV framework is a reliable tool for investigating consumer behavior across various contexts. Moreover, considering individual consumption values, our findings show that emotional value has the strongest influence on consumer behavior, while social value has the weakest effect. This finding aligns with previous studies examining the effect of emotional components in different situations, albeit with larger samples (e.g. Jamrozy and Lawonk, 2017; Rahnama and Rajabpour, 2017; Thomé et al., 2019). Therefore, it can be inferred that emotional value, which is the ability of a product to evoke an emotional response, generally plays a central role in influencing customer behavior. The weaker impact of social values aligns with previous literature that found marginal or non-significant effects on consumer responses (e.g. Liu et al., 2021; Şener et al., 2023; Shin et al., 2021). One possible explanation for this trivial impact is that the products studied via the TCV lens are mainly either “merely visible” or “invisible” or associated with a social stigma (such as recycled fashion). In such cases, the effects related to self-image enhancement or association with a specific group may be limited and weak, as Chakraborty et al. (2023) and Chakraborty and Paul (2023) sustain.
Furthermore, our analysis reveals that the effects of consumption values vary across different behavioral responses. On the one hand, emotional and social values emerged as relevant factors across all consumer responses. On the other hand, no significant effects were found between epistemic value and attitude and satisfaction and between conditional value and attitude. Additionally, no significant effects were observed between functional values, purchase intention and overall value perception. Regarding epistemic values, which encompass aspects such as novelty seeking, curiosity arousal and the desire for knowledge (Sheth et al., 1991), it is important to note that consumers' appreciation for these “epistemic” aspects may not apply to all products. These aspects may be less relevant in determining consumers' attitudes concerning well-known products or everyday commodities. A similar line of reasoning may be applied to explain the non-significant effect of conditional value on attitude. Conditional value is tied to the evaluation of a product in specific circumstances. Thus, its relevance and impact may be contingent upon specific situational factors. In the absence of those contextual elements, the impact of conditional values on attitude may not be as pronounced. Furthermore, the lack of a significant relationship between epistemic value and satisfaction suggests that these values may be less relevant in explaining post-purchase behaviors. This indicates that the influence of epistemic values concerns mostly pre-purchase situations and the initial stages of the consumer journey. Finally, results indicate that functional values affect only satisfaction and attitude. This may be due to the nature of functional values, which are based on perceived performance. In fact, according to Oliver (1980), satisfaction originates from positive disconfirmation, where the actual performance of a product or service exceeds consumers' prior expectations. Since functional values are strictly related to product performance, it is reasonable that they impact satisfaction more strongly than the other values. Hence, when a product or service delivers on its functional promises, customers are more likely to experience satisfaction and positive attitudes toward the offering.
Responding to the second research question, our subgroup and MARA analyses reveal heterogeneity in the strength of the link between consumption values and consumer responses, indicating that some contextual and methodological factors may indeed influence the focal relationship. Among the contextual moderators, we found that product type I (green and non-green products) significantly moderates the CVs—CB relationship. This implies that consumers assign a higher value to products that can address contemporary environmental concerns. This finding aligns with previous research, which found green products to positively affect customer attitudes and willingness to pay (Filieri et al., 2021; Park et al., 2022). However, we did not observe any significant moderating effects for product type II (technological vs. non-technological) or sector (manufacturing vs. service). The lack of a significant moderating effect for product type II suggests that consumers' response toward technological products may be driven by the same consumption values that drive the response toward non-technological products: a smartphone is not chosen only considering its technological nature; it also has an emotional and epistemic appeal to consumers (Wong et al., 2019). Moreover, we found that HDI partially moderates the CVs—CB relationship. This partial moderation effect may be that since HDI provides a broad understanding of a country's development and may not fully capture the specific contextual factors that influence the relationship between consumption values and consumer behavior. Other country-level factors, such as culture and market dynamics, may play a more direct role in shaping consumer behavior. Furthermore, unlike Barari et al. (2021), sector does not moderate the CVs → CB relationship. Hence, consumption values may represent the underlying drivers of consumer behavior regardless of the sector type.
Finally, for method moderators, a significant effect was observed for the year of publication and sample size. This finding aligns with the results of Jadil et al. (2021), who found that sample size moderates the relationship between facilitating conditions and usage intention. However, differently from them, we found the CVs → CB relationship to be more substantial in larger samples compared to smaller ones. Analogously, we found support for the moderating role of publication year in line with Mishra and Maity (2021), who observed a significant moderating role of publication year in the relationship between the influence of socialization agents and attitude. We observed that the effect sizes in the 2002–2008 and 2009–2022 studies produced more robust effect sizes than those in the pre-2000. This finding could be attributed to an evolution of the appreciation of consumption values in recent years. Finally, we found that sampling techniques play a non-significant moderating role in the key relationships of this meta-analytic investigation, akin to previous studies (De Nisco and Oduro, 2022).
5.1 Theoretical contribution
The theoretical contribution of this meta-analysis is threefold. First, this paper provides empirical evidence for the general validity of the TCV framework. In more detail, our findings demonstrate that consumption values have a positive and moderate effect on consumer behavior. This confirms that the original conceptualization of value proposed by the TCV captures the underlying factors that drive an individual to respond to market offerings. The finding is significant as it reaffirms that value has a multidimensional nature (Leroi-Werelds et al., 2014). Nevertheless, the moderate effect size raises questions about the completeness of Sheth et al. (1991) ‘s framework. Given this modest magnitude, it may be plausible that another fundamental element(s) of what is perceived as value by the consumer is present. It appears condescending to believe that the TCV framework is complete and all that the other elements that may be perceived as value are context-specific or “additional values”' and somehow re-conductible to an original consumption value (Tanrikulu, 2021). Hence, another value or a set of values applicable and relevant in multiple consumption situations may exist. This value(s) may expand the TCV framework by capturing factors for which the current consumption values do not entirely account.
Second, we empirically address one of the main criticisms related to the TCV, which concerns its narrow approach in predicting just the consumers' choice (i.e. intentions) (Tanrikulu, 2021). Specifically, we report significant effects of the different values on diverse consumer responses. Thus, it is not that the TCV is incapable of explaining phenomena other than the consumers' intention. Instead, it is its application–as it may also be appreciated by looking at the number of effect sizes per consumer response in Table 2 - that is restricted to the study of intentions. Moreover, disentangling the individual effect of consumption value on the different outcomes investigated allowed for observing two novel insights: (1) Consumer satisfaction relates more to functional values; (2) emotional values relate significantly to all the consumers' responses. The first observation points out that satisfaction levels are explained – for the most – by a product's performance. Nevertheless, functional values do not affect intentions. Hence, post-purchase behaviors seem to be the realm where these values count. The second observation, instead, marks a dominance of emotional values on consumers' responses. Despite the varying magnitude of its effect, all consumer responses are influenced by a product's capacity to generate arousal and a positive affective state. Emotions – with their primary role in determining human consumption – seem to drive consumer behavior in the era of commoditization (Gaur et al., 2014).
Furthermore, an intriguing question regarding the apparent lack of value perception emerges from the finding that consumption values also have non-significant and varying impacts on various consumers' responses. The different outcomes we evaluated pertain to distinct consumer journey stages (e.g. pre-purchase with intention, post-purchase with satisfaction). Hence, when a consumption value exerts a non-significant influence on consumer response, it does not necessarily imply that consumers do not perceive that value or that it is unimportant. Instead, it may indicate that the impact of that value may be mitigated or overshadowed by other elements in that stage of the consumer journey. Exploring this further may lead to relevant and interesting results.
Last, regarding how the CVs → CB relationship varies based on contextual and methodological factors, we report significant interaction effects concerning product type I, year of publication and sample size. The former result embraces a vision that buckles green consumption to a higher value perception. It is plausible that green products can respond better to some market instances: the environmental and social benefits they grant may connect directly with the social and conditional values. Furthermore, some emotional benefits may be attached to them as individuals may experience the pleasant feelings of safeguarding the environment while buying and consuming green products (Tsai and Tsai, 2008). Hence, it may be that green products are capable of better answering modern consumers' needs and thus connected to a higher value perception. This seems to be corroborated by the studies that observed a higher willingness to pay for green alternatives (e.g. Berger, 2019; Wei et al., 2018). As for the year of publication, the stronger effect size observed in more recent studies may signal that consumer choice is becoming more focused on a holistic evaluation of all the benefits connected to a specific product. This evolution may be due to several factors. For example, technological advancements have empowered consumers to gather and assess a wide range of information, compare market offerings and ultimately base their choices on a plethora of factors (Pires et al., 2006). To conclude, the significant interaction effect observed with sample size indicated that a large sample yields a more accurate and robust result. Such a finding remarks that future research should rely upon large samples (e.g. 250 statistical units).
5.2 Practical contributions
Given the practical relevance of the TCV, our meta-analytic review provides several implications for managers. First, the overall positive impact of consumption value on consumers validates investments in this area. Accordingly, a properly designed market offering conveys many benefits within one product, from the most functional and concrete to those more emotional and abstract. Emphasizing and promoting all the consumption values related to an offering can yield favorable outcomes in terms of consumer responses. Moreover, the considerable influence associated with emotional value on all the consumers' outcomes may suggest that it is utterly important to design market offerings capable of eliciting a positive emotional response despite what is offered. This can be done by paying attention to, for instance, branding and storytelling, thus building a strong brand identity sustained by a narrative that echoes consumers' emotions. In particular, for some offerings, the emotional value delivered may be increased by working on more tangible aspects: visual appeal and sensory experiences to trigger consumers' emotional responses. Overall, reasoning on the emotional content to deliver to consumers via the product may be a proper strategy to survive and rise during the commoditization era.
Furthermore, managers may consider that the relevance of the consumption values depends on the outcome variable considered. For example, firms with low satisfaction rates may address these by improving the functional characteristics of their goods. Hence, improving the functionality of a product and focusing on its core benefits seems a proper strategy to address low satisfaction levels. Likewise, focusing on conditional and epistemic aspects seems a proper strategy to improve the perceived overall value and increase the palatability of new market offerings. For example, firms may adopt marketing strategies structured around consumers' specific conditions, requirements, or expectations to increase conditional value perception. This may involve customization and personalization, as well as ensuring that the product or service meets the specific needs or expectations of the target audience. To improve epistemic value perception, firms may focus on creating opportunities for consumers to engage with their products, especially if these are novel to the market. Demos, trial periods and free samples may be used here to stimulate curiosity and satisfy the desire for novelty. Additionally, for some products, offering educational materials from which the consumer may learn alternative uses and get a deeper understanding of the product may be fruitful in terms of epistemic value perception.
6. Limitations and future research
The limitations of this study are as follows. The articles in our meta-analysis review are acquired from the Web of Science database. We encourage future scholars to enlarge their search to other databases such as Google Scholar and Scopus. In addition to the moderators examined in our study, future meta-analyses could consider exploring other variables to better understand the CVs → CB relationship. Researchers could investigate the moderating role of demographic variables, such as gender, education and income, on the relationship between consumption values and consumer behavior. These variables may influence individuals' perceptions and responses to consumption values. In addition, consumer knowledge about a market offering can significantly impact their perceptions and behaviors. Future researchers could also examine the moderating role of consumer knowledge in the relationship between consumption values and consumer behavior. This would shed light on how a person's level of knowledge influences their response to different consumption values. In addition, the TVC framework seems eligible for a theoretical extension. Future scholars should investigate if other values – applicable to several consumption situations and thus not contextual – may be rightfully included in the original framework. Finally, the non-significant effects observed between specific values and some consumers' responses highlight the nuanced nature of consumer decision-making and call for future investigation.
Since the acceptance of this article, the following author(s) have updated their affiliations: Stephen Oduro is at the “Faculty of Economics and Management, Free University of Bolzano, Bolzano, Italy” and Rana Muhammad Umar is at the “Department of Economics and Management, University of Trento, Trento, Italy”.

