


This study aims to analyse productivity change and its determinants in Australian public universities from 2001 to 2022.
The study uses bootstrap data envelopment analysis (DEA) and the Malmquist Productivity Index to examine productivity trends.
The main findings reveal that technological improvement has been the primary driver of productivity growth in universities. The technological frontier generally drives productivity, while the relative distance of universities from this frontier has changed only marginally, except during the COVID-19 period. During the pandemic, technological advancements slowed, but individual universities improved their relative positions. However, this trend reversed in 2021–2022, marking the worst period for productivity in the last two decades.
This study highlights the advantages of using multi-inputs and multi-outputs models over traditional ratio measures in accounting literature. The findings are expected to be of interest to universities, higher education policymakers and researchers.
The productivity changes in Australian public universities have significant social implications. Enhanced productivity, driven by technological advancements, can improve educational quality and accessibility, thereby making public higher education more sustainable. This can also lead to better educational outcomes and greater social equity aligned with Sustainable Development Goals.
This study provides a comprehensive analysis of productivity trends over two decades, contributing to the existing literature on higher education productivity in Australia.
1. Introduction
The COVID-19 pandemic profoundly disrupted Australian universities, leading to significant financial, operational and educational challenges. The closure of international borders caused a sharp decline in international student enrolments, resulting in substantial revenue losses and widespread job cuts, particularly among sessional staff. Universities were forced to transition rapidly to online teaching, uncovering digital divides and difficulties in fostering student engagement and motivation, and requiring major adaptations in curriculum delivery. Research activities were also hindered due to laboratory closures and travel restrictions. In response, Australian universities implemented substantial cost-reduction measures and workforce redundancies, while accelerating the adoption of online and hybrid teaching models and strategies to enhance resilience in the post-pandemic context. Despite the profound impact of the pandemic, there is a lack of recent studies examining its effects on the efficiency and productivity of Australian universities. Moreover, existing studies (e.g. Avkiran, 2001; Abbott and Doucouliagos, 2003; Carrington et al., 2005; Moradi-Motlagh et al., 2016) are largely outdated and have primarily focused on relatively short timeframes. Given the scale and significance of these disruptions, it is essential to investigate their impact on university productivity from both policy and practical perspectives.
Performance evaluation has long been one of the key topics in the field of accounting (Cao et al., 2024; Deville et al., 2014). Efficiency analysis is a key aspect of performance evaluation, providing a lens through which to assess the ability of a system or process to convert its given inputs (such as time, labour or materials) into desired outputs (such as products or services). Data envelopment analysis (DEA) is a non-parametric method used in various fields for analysing efficiency of decision-making units (DMUs). In the accounting context, DEA has found its application in performance assessment and target-setting (Malmi, 2016). DEA provides a robust framework for evaluating efficiency and setting benchmarks for performance improvement. Despite the widespread use of DEA in efficiency analysis in many disciplines, its application in accounting literature is still limited, and its potential capabilities and values are often overlooked. This study aims to demonstrate the application of DEA in efficiency and productivity analysis in the context of Australian universities. Australian public universities are under pressure to perform more efficiently and improve delivery of their teaching and research services in recent years (Duan, 2019). This pressure has been increased since the COVID pandemic as well as recent changes regarding the quota for the number of international students. In response, Australian universities need to use their resources more efficiently and focus on enhancing productivity now more than ever before. This paper uses production theory and the efficient production frontiers to examine the performance of 37 public Australian universities over the period 2001–2022.
This study contributes to the literature in the following ways. First, to the best of my knowledge this study provides the most recent and longest productivity analysis of Australian universities. By doing so, it sheds light on how productivity changes in the last two decades, a period of significant changes affecting the higher education sector. It specifically reveals the impact of the COVID-19 pandemic on efficiency and productivity of Australian universities. Second, it decomposes the productivity change into efficiency and technology changes to reveal the main drivers of productivity growth or regress for individual universities and the whole sector during the study period. Third, it discusses productivity improvement opportunities referencing to different individual or group of universities which provides decision makers with useful information regarding efficiency and productivity enhancement of individual universities and the whole sector. Fourth, this study discusses the advantages of the non-parametric models as an alternative to the traditional efficiency ratio measures commonly used in accounting literature.
2. Literature review
In a recent systematic literature review, Badiee et al. (2024) analyse the critical role of Operations Research (OR) and Management Science (MS) methodologies in enhancing the efficiency and productivity of universities, offering both theoretical frameworks and empirical validation for their application in higher education research and practice. They assess 203 peer-reviewed papers from Q1 journals, revealing that 44% of the studies focused on university-level efficiency evaluations. Descriptive analytics dominated these studies, accounting for 62% of the total, followed by predictive (24%) and prescriptive analytics (14%). As discussed by Badiee et al. (2024), DEA was frequently employed to benchmark performance and identify areas for improvement. Moreover, they highlight that empirical studies linked financial inputs to performance indicators like research output and student success, highlighting the relevance of OR/MS techniques in performance evaluation.
Rella and Vitolla (2025) conducted a systematic literature review using the PRISMA (Preferred Reporting Items for Systematic reviews and Meta-Analyses) framework to classify 122 peer-reviewed articles, revealing that nonparametric methods, especially DEA, dominate the field, appearing in 101 studies. DEA is favoured for its flexibility in handling multiple inputs and outputs without requiring a predefined functional form, making it suitable for the complex operations of higher education institutions. Rella and Vitolla (2025) also identify key input variables such as total academic staff, total expenditures and non-academic staff, which reflect the human and financial resources available to institutions. Output variables commonly include the number of publications, graduate students, and patents, representing research productivity and educational outcomes. Despite the prevalence of DEA, Rella and Vitolla (2025) highlight a methodological gap, noting the underutilization of parametric approaches like stochastic frontier analysis (SFA).
Given the extent of efficiency analysis in higher education, the rest of this section reviews a number of key studies that have used DEA and SFA methodologies. Berbegal-Mirabent et al. (2013) examine how Spanish public universities incorporate knowledge transfer into their operations alongside teaching and research. Using DEA and cluster analysis, the study finds that efficiency levels vary widely across institutions due to differences in internal strategies and regional conditions, and it recommends customized policies to support university–industry collaboration and improve performance. Johnes (2006) applied DEA to 109 universities in England, demonstrating high average technical efficiency scores (93%–95%) and validating the method’s utility for institutional benchmarking. Her study incorporated robustness checks such as bootstrapping and subgroup comparisons, reinforcing the reliability of DEA in policy analysis while cautioning against overinterpretation of scores without contextual understanding.
The widespread adoption of non-parametric techniques, particularly DEA, reflects a methodological preference for models that accommodate multiple inputs and outputs without requiring predefined functional forms. This flexibility has made DEA especially suitable for the complex, multi-dimensional nature of university operations. DEA has been widely used to evaluate the efficiency and productivity of educational institutions worldwide (Emrouznejad and Yang, 2018). Studies such as those by Johnes (2006) and Johnes and Yu (2008) demonstrate the robustness of DEA in assessing institutional performance across diverse national contexts, including the UK and China, respectively. These works underscore DEA’s utility in benchmarking and policy analysis, while also highlighting the need for contextual interpretation of efficiency scores. Methodological innovations have further refined traditional DEA models to address limitations in benchmark selection and environmental sensitivity.
Thanassoulis et al. (2011) evaluate the cost efficiency of higher education institutions in the UK using DEA, and compare the results with those from SFA reported in Johnes and Yu (2008). They find a broad consistency between the two methods, reinforcing the robustness of the efficiency estimates and highlighting potential cost savings and productivity improvements across different types of institutions. Letti et al. (2022) assess the efficiency of Brazilian federal universities using both SFA and DEA. Their study is notable for incorporating third mission activities and patents as outputs. Their findings reveal that while both methods identify inefficiencies, the efficiency scores and rankings vary significantly between approaches. DEA tends to favour specialized institutions, whereas SFA rewards balanced performance across outputs. The inclusion of third mission activities generally improves efficiency scores, particularly under DEA, highlighting the importance of model choice and output specification in higher education efficiency assessments. Ruiz et al. (2015) incorporated expert preferences into DEA using analytic hierarchy process weight restrictions, enabling more realistic and actionable target setting for Spanish universities. Ghimire et al. (2021) introduced a stochastic DEA framework that accounts for uncertainty in qualitative outputs such as student satisfaction and enrolment, offering a more nuanced understanding of institutional performance under variable conditions. These enhancements reflect a broader trend toward integrating stakeholder perspectives and real-world variability into efficiency modelling.
The determinants of university efficiency have also been extensively studied, revealing the influence of institutional characteristics, funding structures and faculty composition. Wolszczak-Derlacz and Parteka (2011), in a cross-national study of European higher education institutions, found that older institutions, those with medical faculties, and those with a higher proportion of female academic staff tended to be more efficient. Their findings also suggest that reliance on core government funding may reduce efficiency, pointing to the potential benefits of diversified revenue sources. Similarly, Zoghbi et al. (2013) used SFA to compare public and private universities in Brazil, controlling for non-discretionary inputs such as student socioeconomic background. Their results indicated that private institutions were generally more efficient, despite public universities attracting better-prepared students, and they advocated for performance-based funding mechanisms to enhance public sector outcomes.
Research productivity has emerged as a critical dimension of university efficiency, with several studies disaggregating institutional functions to capture more granular performance dynamics. Yang et al. (2018) used a two-stage network DEA model to evaluate Chinese research universities, distinguishing between teaching/research and technology transfer activities. Their findings revealed that elite institutions exhibited higher efficiency but experienced technological regression, suggesting the need for reforms in budgeting and interdisciplinary collaboration. At the individual level, Sahoo et al. (2017) developed a composite indicator using DEA to assess faculty research output in Indian management schools. Their analysis highlighted disparities linked to doctoral training and institutional affiliation, with foreign-trained faculty and those at Indian Institutes of Technology outperforming their peers, thereby pointing to systemic issues in domestic research culture.
Environmental and contextual factors have also been shown to condition university efficiency. Rella et al. (2024) demonstrated that municipal digitalization positively influences research performance in Italian universities, with conditional DEA and Malmquist productivity index analyses revealing regional disparities and temporal improvements linked to technological adoption during the COVID-19 pandemic. These findings align with broader evidence from Johnes and Yu (2008), who observed regional and administrative variations in Chinese university efficiency, and reinforce the importance of incorporating external variables into performance assessments. Micro-level applications of efficiency analysis have provided valuable insights into pedagogical effectiveness. Ghaffarian Asl and Osam (2021) applied DEA to evaluate English for Academic Purposes instructors, identifying student satisfaction with assessments and grading as key drivers of teaching efficiency. Their mixed-methods approach illustrates the potential of DEA to inform faculty development and curriculum design, particularly when combined with qualitative data.
Given the extensive international literature and for the sake of brevity, the remaining literature review focuses on studies that assess the efficiency and productivity of Australian universities. Avkiran (2001) is among the first to investigate the technical and scale efficiency of Australian universities via DEA based on 1995 data, finding high performance in both areas. He also finds that more universities were experiencing decreasing returns to scale, suggesting a potential need for downsizing. Abbott and Doucouliagos (2003) conduct a similar analysis to Avkiran (2001) with different input-output combinations, concluding that regardless of the mix used, Australian universities demonstrate a high level of relative efficiency. Carrington et al. (2005), Worthington and Lee (2008), Moradi-Motlagh et al. (2016) and Carrington et al. (2018) assess productivity changes in Australian universities, consistently finding productivity enhancements driven primarily by technological change. Their studies report average annual growth rates of 1.8% (1996–2000), 3.3% (1998–2003), 2.6% (2007–2013) and 1.1% (2005–2010), respectively.
Lee (2011) and Szuwarzyński (2019) investigate research efficiency in Australian universities. Szuwarzyński (2019) ranks universities and identifies top and poor performers, while Lee (2011) identifies factors influencing research efficiency, such as location and the ratio of professors to total academic staff. Lee and Worthington (2016) assess research efficiency using a network DEA model, finding that traditional DEA models tend to overstate efficiency levels. Their study indicates that universities perform better in the initial stage of publication production but struggle more in generating research income. Duan (2019) examines the teaching and research efficiency of Australian universities from 2011 to 2015. Her study indicates high overall and research efficiency, with teaching efficiency requires significant improvement. While analysis of the efficiency and productivity of Australian universities has attracted attention from academics and policymakers to the best of my knowledge no study has examined the impact of COVID-19 in productivity changes of Australian universities.
3. Methodology
DEA, first introduced by Charnes et al. (1978), is a widely used non-parametric method that utilises the linear programming technique to estimate the efficiency of DMUs. DEA is widely used to evaluate the relative performance of DMUs, such as universities, by comparing how efficiently they convert inputs (e.g. staff, expenses) into outputs (e.g. student education, research publications). Unlike traditional ratio-based approaches, DEA accommodates multiple inputs and outputs without requiring a specific functional form, making it particularly suitable for complex institutions like universities. The Malmquist Productivity Index (MPI), used in conjunction with DEA (Simon et al., 2011), measures changes in productivity over time by decomposing them into two components: efficiency change and technological change. Efficiency change reflects how well a university improves its performance relative to peers, while technological change captures shifts in the overall performance frontier, often driven by sector-wide innovations (Fuentes and Lillo-Bañuls, 2015; Nigsch and Schenker-Wicki, 2014). Estimating MPI using DEA can provide a holistic and dynamic view of productivity trends in higher education.
Partial productivity, the ratio of total outputs to a single input, is often used by directors, media, and academics to measure organizational productivity (Oum et al., 2003). In contrast, total factor productivity (TFP) measures the ratio of total outputs to aggregate inputs, providing a comprehensive view of performance. One popular method for measuring TFP using a distance function is the Malmquist TFP index (Kumar, 2006). Initiated by Caves et al. (1982a, 1982b) and further developed by Fare et al. (1992), the MPI has become a popular tool for estimating TFP changes over two time periods for a DMU (Coelli et al., 2005). DEA has been utilised in estimating the MPI as a standard approach in productivity analysis within the non-parametric literature (Simon et al., 2011). The MPI compares the efficiency of a DMU at two points in time and decomposes it to changes in efficiency and technological changes to identify sources that have caused that change (Fuentes and Lillo-Bañuls, 2015; Nigsch and Schenker-Wicki, 2014).
The output-oriented Malmquist TFP index for Kth DMU within a sample of N DMUs, measured between time periods and , is defined as follows:
where and refer to the vectors of inputs and outputs, respectively. s are the output distance functions that can be formulated as follows:
and represent the distances of a given business unit k in time periods and , respectively, relative to the technology frontier in the sample at time . Similarly, and measure the corresponding distances relative to the technology frontier at time. indicates positive TFP growth between times and , while shows a decline, and implies no change in TFP.
Fare et al. (1992) decompose the MPI into technical and technological efficiency change as shown below:
The first ratio, , represents changes in technical efficiency between the two periods, and while the second ratio, TC, reflects technological change over the same timeframe. Specifically, measures the change in the relative distance of the kth DMU to the frontiers at and , capturing the efficiency improvement (or decline) of the DMU. In contrast, TC quantifies the effect of a shift in the technological frontier on the relative position of the kth DMU, often referred to as the industry effect. It is important to note that this shift in the frontier, representing technological change, suggests a transformation affecting the entire industry. Such a shift can be viewed as a systematic or structural change in the technological landscape.
DEA is used to estimate the distance functions described above. However, since DEA is not a statistical tool, the resulting estimates of E, TC and TFP lack statistical significance. As Tortosa-Ausina et al. (2008) note, “the inability to allow for random error has led many authors to label it [DEA] as deterministic”. Simar and Wilson (1998, 1999, 2000) address this limitation by introducing a bootstrap methodology, enabling the derivation of statistical properties for efficiency and productivity estimates within the framework of non-parametric frontier models. Specifically, Simar and Wilson (1999) propose a bootstrap approach that provides insights into the statistical properties of TFP and its components, including significance levels, bias, and confidence intervals. For further details on this method, see Simar and Wilson (1999).
DEA was selected for this study due to its flexibility and suitability for evaluating the performance of institutions with multiple inputs and outputs. Unlike parametric methods such as SFA, DEA does not require a predefined functional form for the production process, making it particularly useful in the context of universities where outputs (e.g. student education and research publications) and inputs (e.g. staff and expenses) are heterogeneous and not easily modelled by a single equation. Panel data models, although useful for longitudinal analysis, often rely on aggregated measures and may not capture the nuanced efficiency dynamics across institutions. DEA’s non-parametric nature and ability to benchmark performance against a frontier of best practices make it a reliable and transparent tool for assessing university productivity and efficiency over time.
4. Sample and data
The sample includes 37 Australian public universities from 2001 to 2022. Input and output variables are collected from two main sources: the Department of Education and the Scopus database. We follow a production approach, where universities use resources such as academic and non-academic staff and facilities to generate teaching and research outputs. Specifically, total expenses are used as a proxy for all resources used (inputs), while the load of full-time equivalent students and total number of publications from Scopus are considered the primary outputs. The number of input and output variables is limited to three for the following reasons. Firstly, Cram (2011) demonstrated that over 97% of the variation in expenses at Australian universities is explained by student numbers and publications. Secondly, limiting the number of variables enhances the precision of efficiency estimates (Dyson et al., 2001). Finally, the chosen variables strongly correlate with other possible inputs or outputs. For example, the correlation between grants and publications for Australian universities is around 97%, as noted by Moradi-Motlagh et al. (2016). Furthermore, given that only publications listed in the reputable Scopus database are used, it can be claimed that a level of research quality has been ensured. Table 1 provides summary statistics for total expenses, student load, and publications for 37 Australian universities from 2001 to 2022. On average, total expenses increased from $664m in 2001 to $936m in 2022, although there was a decline in 2020 and 2021. Student load grew steadily until 2019 but decreased from 2020 onward, likely due to the COVID-19 pandemic, reaching an average of 25,926 by 2022. Meanwhile, research output continued to rise, with publications increasing from an average of 676 in 2001 to 4,181 in 2022, despite a slower growth rate in later years.
Summary statistics
| Expenses in $m | Student load | Publication | ||||||||||
|---|---|---|---|---|---|---|---|---|---|---|---|---|
| Year | Min | Average | Max | SD | Min | Average | Max | SD | Min | Average | Max | SD |
| 2001 | 65 | 664 | 1,647 | 449 | 2,346 | 15,790 | 35,175 | 8,516 | 22 | 676 | 2,579 | 720 |
| 2002 | 76 | 701 | 1,945 | 497 | 2,642 | 16,780 | 37,505 | 8,991 | 25 | 727 | 2,781 | 790 |
| 2003 | 80 | 710 | 1,996 | 500 | 2,701 | 17,393 | 38,833 | 9,240 | 27 | 896 | 3,499 | 964 |
| 2004 | 91 | 714 | 2,108 | 507 | 2,838 | 17,602 | 40,552 | 9,225 | 37 | 997 | 3,871 | 1,071 |
| 2005 | 99 | 712 | 2,055 | 503 | 2,931 | 17,800 | 40,429 | 9,061 | 58 | 1,179 | 4,449 | 1,243 |
| 2006 | 119 | 737 | 2,143 | 530 | 3,081 | 18,148 | 40,576 | 9,150 | 48 | 1,298 | 5,024 | 1,389 |
| 2007 | 132 | 769 | 2,308 | 562 | 3,451 | 18,643 | 41,665 | 9,400 | 90 | 1,401 | 5,515 | 1,483 |
| 2008 | 145 | 809 | 2,432 | 593 | 3,587 | 19,304 | 42,826 | 9,728 | 113 | 1,525 | 6,046 | 1,599 |
| 2009 | 154 | 810 | 2,314 | 581 | 3,923 | 20,547 | 46,231 | 10,187 | 168 | 1,692 | 6,491 | 1,747 |
| 2010 | 166 | 830 | 2,362 | 602 | 4,267 | 21,716 | 48,553 | 10,762 | 201 | 1,832 | 6,983 | 1,863 |
| 2011 | 178 | 844 | 2,342 | 603 | 4,509 | 22,207 | 49,591 | 10,829 | 209 | 2,081 | 7,920 | 2,086 |
| 2012 | 190 | 857 | 2,388 | 606 | 5,135 | 22,817 | 49,626 | 10,881 | 256 | 2,339 | 8,581 | 2,295 |
| 2013 | 206 | 853 | 2,341 | 585 | 5,599 | 23,576 | 50,882 | 11,348 | 334 | 2,640 | 9,363 | 2,512 |
| 2014 | 226 | 865 | 2,445 | 597 | 6,132 | 24,404 | 52,992 | 11,771 | 411 | 2,779 | 9,482 | 2,598 |
| 2015 | 226 | 853 | 2,360 | 589 | 6,583 | 24,903 | 55,788 | 12,252 | 437 | 2,982 | 9,815 | 2,716 |
| 2016 | 224 | 876 | 2,458 | 614 | 6,573 | 25,581 | 59,036 | 12,814 | 539 | 3,215 | 10,570 | 2,882 |
| 2017 | 201 | 897 | 2,569 | 638 | 6,350 | 26,423 | 62,433 | 13,550 | 513 | 3,366 | 11,107 | 3,008 |
| 2018 | 204 | 936 | 2,718 | 681 | 6,247 | 27,262 | 67,074 | 14,220 | 521 | 3,524 | 12,004 | 3,177 |
| 2019 | 201 | 969 | 2,743 | 716 | 6,706 | 28,009 | 70,085 | 14,820 | 557 | 3,729 | 12,917 | 3,370 |
| 2020 | 192 | 939 | 2,619 | 681 | 7,954 | 27,596 | 67,993 | 14,378 | 645 | 3,928 | 13,746 | 3,579 |
| 2021 | 207 | 913 | 2,685 | 689 | 8,027 | 27,247 | 67,753 | 15,109 | 771 | 4,167 | 14,891 | 3,850 |
| 2022 | 220 | 936 | 2,871 | 739 | 7,535 | 25,926 | 63,059 | 14,548 | 738 | 4,181 | 14,606 | 3,780 |
Expenses refer to total expenses excluding bad and doubtful debts and investment losses, and are adjusted using the education CPI obtained from the Australian Bureau of Statistics website (Link to the cited article). Specifically, total expenses include employee benefits, depreciation and amortisation, buildings and grounds or repairs and maintenance, finance or borrowing costs, and other operating expenses
5. Results
We used a series of DEA models to estimate the MPI and its components, including changes in efficiency and technology over different time periods. We used the FEAR package provided by Wilson (2008) for these estimations. Although the analysis covers all years from 2001 to 2022, Table 2 presents only the productivity change estimates for pairs of consecutive years between 2015 and 2022 for brevity. The results for the entire period can be seen in Figure 1 for group of universities. The mean values across all universities reveal a general trend of productivity improvement, with the average productivity consistently close to or above 1.
 The graph reports how five university groups change in their index values from 2001 to 2022. All groups rise and fall over time, with noticeable peaks around 2003 to 2004 and again between 2011 and 2014. After 2016, the values move downward for most groups, followed by brief increases around 2020. The final years show declines across all groups. Vertical markers identify three moments when policy changes or external shocks occur, and each moment aligns with shifts in the direction of the group trends. The overall pattern shows repeated movement rather than steady growth or decline.
Productivity change among different university groups (2001–2022)
The graph reports how five university groups change in their index values from 2001 to 2022. All groups rise and fall over time, with noticeable peaks around 2003 to 2004 and again between 2011 and 2014. After 2016, the values move downward for most groups, followed by brief increases around 2020. The final years show declines across all groups. Vertical markers identify three moments when policy changes or external shocks occur, and each moment aligns with shifts in the direction of the group trends. The overall pattern shows repeated movement rather than steady growth or decline.Productivity change among different university groups (2001–2022)
Productivity change
| University | =2015 =2016 | =2016 =2017 | =2017 =2018 | =2018 =2019 | =2019 =2020 | =2020 =2021 | =2021 =2022 | Mean |
|---|---|---|---|---|---|---|---|---|
| ACU | 0.97*** | 1.00*** | 1.06*** | 0.98*** | 0.98*** | 1.02*** | 0.94*** | 0.99 |
| ANU | 1.00*** | 1.05*** | 0.98 | 0.99*** | 0.92*** | 1.14*** | 0.92*** | 1.00 |
| CQU | 1.01*** | 0.98*** | 1.01*** | 0.96*** | 0.99 | 1.00* | 1.05*** | 1.00 |
| CDU | 1.06*** | 1.09*** | 0.95*** | 1.21*** | 1.18*** | 0.99*** | 0.96*** | 1.06 |
| CSU | 0.96*** | 0.99*** | 0.95*** | 1.01*** | 1.16*** | 1.05*** | 0.93*** | 1.01 |
| Curtin | 1.05*** | 1.07*** | 1.01*** | 1.04*** | 0.99*** | 1.04*** | 0.96*** | 1.02 |
| Deakin | 1.00 | 1.01*** | 0.97*** | 0.98*** | 1.09*** | 1.03*** | 1.02* | 1.01 |
| ECU | 0.99*** | 1.05*** | 1.05*** | 1.03*** | 1.08*** | 0.97*** | 1.04v | 1.03 |
| Fedu | 0.96*** | 0.95*** | 1.05*** | 1.00 | 1.06*** | 1.05*** | 0.93*** | 1.00 |
| Flin | 1.07*** | 1.01*** | 1.04*** | 1.01 | 1.11*** | 1.08*** | 0.98*** | 1.04 |
| Griff | 1.02* | 1.08*** | 0.96*** | 1.02*** | 1.05*** | 1.05*** | 0.92*** | 1.02 |
| JCU | 1.01 | 1.06*** | 1.02*** | 0.96*** | 1.08*** | 0.98*** | 0.99*** | 1.02 |
| La Trobe | 1.01*** | 1.04*** | 1.01*** | 0.97*** | 1.03*** | 1.13*** | 0.98*** | 1.02 |
| Macq | 1.02*** | 1.01*** | 1.00 | 1.02*** | 1.04*** | 1.11*** | 0.98*** | 1.03 |
| Monash | 1.00*** | 1.02*** | 1.01*** | 0.99*** | 1.13*** | 1.00 | 0.93*** | 1.01 |
| Murd | 0.99 | 1.03*** | 1.02*** | 1.03*** | 1.01*** | 1.02*** | 0.95*** | 1.01 |
| QUT | 1.06*** | 1.02*** | 1.01*** | 0.99*** | 1.09*** | 1.03*** | 0.94*** | 1.02 |
| RMIT | 1.01 | 0.99*** | 0.94*** | 1.02*** | 0.99 | 1.08*** | 1.02*** | 1.01 |
| SCU | 1.02*** | 1.00 | 0.96*** | 0.99*** | 1.08*** | 1.09*** | 0.90*** | 1.01 |
| Swin | 1.05*** | 0.96*** | 0.97*** | 1.10*** | 0.97*** | 1.13*** | 0.97*** | 1.02 |
| UAdel | 1.06*** | 1.00 | 1.00*** | 1.05*** | 1.07*** | 1.05*** | 0.97*** | 1.03 |
| UC | 1.04*** | 0.97*** | 1.02*** | 1.03*** | 1.05*** | 1.02*** | 0.99 | 1.02 |
| UMelb | 1.03*** | 1.00*** | 1.01*** | 1.07*** | 1.07*** | 1.06*** | 0.91*** | 1.02 |
| UNE | 1.06*** | 1.01 | 0.97*** | 1.04*** | 0.94*** | 1.10*** | 0.88*** | 1.00 |
| UNSW | 1.05*** | 0.95*** | 0.96*** | 1.00*** | 1.12*** | 1.08*** | 0.91*** | 1.01 |
| UoN | 1.01** | 1.05*** | 0.96*** | 1.02*** | 1.05*** | 1.06*** | 0.97*** | 1.02 |
| UQ | 1.03*** | 1.04*** | 1.02*** | 0.97*** | 1.08*** | 1.06*** | 0.96*** | 1.02 |
| UniSA | 1.01*** | 0.97*** | 0.97*** | 1.04*** | 1.01** | 1.09*** | 0.93*** | 1.00 |
| USQ | 0.99*** | 0.94*** | 1.09*** | 0.99*** | 1.06*** | 0.99** | 1.02*** | 1.01 |
| USyd | 1.01*** | 1.03*** | 0.98*** | 1.00*** | 1.07*** | 1.11*** | 0.93*** | 1.02 |
| UTas | 1.10*** | 1.01* | 1.01 | 0.98*** | 1.10*** | 0.95*** | 0.94*** | 1.01 |
| UTS | 1.06*** | 1.02** | 1.01** | 1.01 | 1.05*** | 1.10*** | 0.99 | 1.04 |
| USC | 1.09*** | 1.02*** | 0.95*** | 1.09*** | 1.01*** | 1.08v | 0.90*** | 1.02 |
| UWA | 1.05*** | 1.07*** | 1.03*** | 0.99*** | 1.07*** | 1.03*** | 1.05*** | 1.04 |
| WSU | 0.99 | 1.01*** | 1.01*** | 0.97*** | 1.07*** | 1.03*** | 0.98 | 1.01 |
| UOW | 1.05*** | 1.00 | 0.95*** | 1.06*** | 1.03*** | 1.02*** | 0.97*** | 1.01 |
| VU | 1.00 | 0.93*** | 1.18*** | 1.04*** | 0.98v | 0.97*** | 1.00 | 1.01 |
| Mean | 1.02 | 1.01 | 1.00 | 1.02 | 1.05 | 1.05 | 0.96 |
*, ** and *** significant differences from unity at 10, 5 and 1%, respectively; The statistical significance of productivity change estimates using the bootstrap procedure is assessed by constructing a confidence interval from the distribution of bootstrap estimates. If the interval does not include the value 1, the change is considered statistically significant
The mean productivity value peaks at 1.05 for the periods 2019–2020 and 2020–2021, indicating a notable improvement during the COVID-19 pandemic. However, a decline to 0.96 in the final period, 2021–2022, suggests that while universities managed to mitigate the initial impact of the pandemic through stringent policies and significant cost-cutting, the sector has not fully recovered in the subsequent high inflation period and may not recover soon. The results also show that UWA is the only university that experienced stable or improving productivity throughout the entire period. In contrast, a few universities such as ACU, UNE and VU show productivity decline in three out of six time periods. It is worth noting most results are statistically significant.
Tables 3 and 4 report the decomposition of productivity change into efficiency and technological change, respectively. The results show that technological improvement is the main source of productivity growth in most time periods, except for 2019–2020 and 2021–2022. This suggests that, generally, the movement of the frontier (technological change) drives productivity improvement, while the relative distance of universities to the frontier changed little, with the exception of the COVID-19 period. A possible explanation is that during the COVID-19 period, technological advancement (i.e. shifts in the frontier) had a reduced impact on productivity growth. In contrast, efficiency change, which reflects improvements in the relative position of individual universities to the frontier, was the main driver of productivity enhancement during the 2020–2019 and 2021–2020 periods. This trend reversed in 2021–2022, with most universities experiencing a considerable decline in technical efficiency improvement, leading to the worst period in terms of productivity decline in the last two decades.
Efficiency change
| University | =2015 =2016 | =2016 =2017 | =2017 =2018 | =2018 =2019 | =2019 =2020 | =2020 =2021 | =2021 =2022 | Mean |
|---|---|---|---|---|---|---|---|---|
| ACU | 0.9s8* | 1.02 | 0.93*** | 0.95 | 1.01 | 1.05 | 0.95* | 0.98 |
| ANU | 0.94*** | 0.98 | 0.96 | 0.99 | 0.86*** | 1.12*** | 0.87*** | 0.96 |
| CQU | 1.02 | 1.00 | 0.89*** | 0.92** | 1.01 | 1.02* | 1.03 | 0.98 |
| CDU | 1.02 | 1.10*** | 0.97 | 1.17*** | 1.17*** | 0.98 | 0.96*** | 1.05 |
| CSU | 0.96*** | 1.01 | 0.84*** | 0.98 | 1.17*** | 1.07** | 0.92*** | 0.99 |
| Curtin | 1.00 | 1.07*** | 1.05** | 1.00 | 0.97 | 1.02* | 0.97** | 1.01 |
| Deakin | 0.96*** | 1.02 | 1.00 | 0.94*** | 1.08*** | 1.01 | 1.02 | 1.01 |
| ECU | 0.99 | 1.07** | 1.00 | 1.00 | 1.08*** | 0.97 | 1.02 | 1.02 |
| Fedu | 0.97** | 0.96** | 0.95* | 0.96 | 1.08*** | 1.06*** | 0.91*** | 0.99 |
| Flin | 1.02 | 1.01 | 1.08*** | 0.96** | 1.08** | 1.03 | 1.00 | 1.03 |
| Griff | 0.98 | 1.08*** | 1.01 | 0.98 | 1.03* | 1.04*** | 0.93*** | 1.01 |
| JCU | 0.96** | 1.06*** | 1.05** | 0.92*** | 1.05 | 0.96 | 1.00 | 1.00 |
| La Trobe | 0.98 | 1.05** | 1.03 | 0.93*** | 1.02 | 1.11*** | 0.99 | 1.02 |
| Macq | 0.98* | 1.01 | 1.04** | 0.98 | 1.01 | 1.09*** | 0.99 | 1.01 |
| Monash | 0.95*** | 1.00 | 1.03 | 0.95*** | 1.08*** | 0.95** | 0.94*** | 0.99 |
| Murd | 0.96*** | 1.04** | 1.04 | 0.99 | 1.00 | 1.02* | 0.95*** | 1.00 |
| QUT | 1.02 | 1.02* | 1.04** | 0.95*** | 1.07*** | 1.01* | 0.94*** | 1.01 |
| RMIT | 1.00 | 1.00 | 0.94 | 0.99 | 0.99 | 1.09*** | 1.00 | 1.00 |
| SCU | 1.01 | 1.01 | 0.93** | 0.96 | 1.08*** | 1.10*** | 0.89*** | 1.00 |
| Swin | 1.04** | 0.97 | 0.97 | 1.06*** | 0.96** | 1.13*** | 0.96*** | 1.01 |
| UAdel | 1.01 | 0.95** | 0.99 | 1.04 | 1.01 | 1.01 | 0.95** | 0.99 |
| UC | 1.01 | 0.98 | 1.02 | 1.00 | 1.04*** | 1.02** | 0.97** | 1.01 |
| UMelb | 0.98 | 0.95** | 1.01 | 1.07** | 1.01 | 1.02 | 0.87*** | 0.99 |
| UNE | 1.03* | 1.02 | 0.98 | 1.00 | 0.94*** | 1.11*** | 0.87*** | 0.99 |
| UNSW | 1.00 | 0.91*** | 0.95* | 0.98 | 1.06* | 1.03* | 0.89*** | 0.98 |
| UoN | 0.96*** | 1.05** | 0.99 | 0.97* | 1.03 | 1.04** | 0.98 | 1.00 |
| UQ | 0.98 | 0.99 | 1.00 | 0.97* | 1.02 | 1.02 | 0.93*** | 0.99 |
| UniSA | 0.97** | 0.97 | 1.00 | 1.00 | 1.00 | 1.09*** | 0.92*** | 0.99 |
| USQ | 0.99 | 0.95*** | 1.06** | 0.96** | 1.06*** | 0.99 | 1.01 | 1.00 |
| USyd | 0.96** | 0.97 | 0.97 | 0.99 | 1.02 | 1.06*** | 0.92*** | 0.98 |
| UTas | 1.04** | 1.01 | 1.04* | 0.93*** | 1.08*** | 0.93*** | 0.95*** | 1.00 |
| UTS | 1.02 | 1.02 | 1.05** | 0.97** | 1.02 | 1.05 | 1.01 | 1.02 |
| USC | 1.06*** | 1.04 | 0.95 | 1.06*** | 1.00 | 1.08*** | 0.88*** | 1.01 |
| UWA | 1.00 | 1.00 | 1.00 | 1.00 | 1.00 | 1.00 | 1.00 | 1.00 |
| WSU | 0.98 | 1.02 | 1.01 | 0.94*** | 1.07*** | 1.03** | 0.97*** | 1.00 |
| UOW | 1.00 | 1.00 | 0.99 | 1.01 | 1.00 | 1.00 | 0.99 | 1.00 |
| VU | 1.01 | 0.95*** | 1.05 | 1.00 | 1.00 | 1.00 | 1.00 | 1.00 |
| Mean | 0.99 | 1.01 | 1.00 | 0.99 | 1.03 | 1.04 | 0.96 |
*, ** and *** significant differences from unity at 10, 5 and 1%, respectively; The statistical significance of efficiency change estimates using the bootstrap procedure is assessed by constructing a confidence interval from the distribution of bootstrap estimates. If the interval does not include the value 1, the change is considered statistically significant
Technological change
| University | =2015 =2016 | =2016 =2017 | =2017 =2018 | =2018 =2019 | =2019 =2020 | =2020 =2021 | =2021 =2022 | Mean |
|---|---|---|---|---|---|---|---|---|
| ACU | 1.00 | 0.98 | 1.14*** | 1.03 | 0.97 | 0.97 | 0.99 | 1.01 |
| ANU | 1.06** | 1.07** | 1.02 | 0.99 | 1.07 | 1.02 | 1.05** | 1.04 |
| CQU | 1.00 | 0.98 | 1.14*** | 1.05 | 0.98 | 0.98 | 1.02** | 1.02 |
| CDU | 1.03** | 0.99 | 0.98 | 1.04*** | 1.01 | 1.01 | 1.00 | 1.01 |
| CSU | 1.00 | 0.98 | 1.12*** | 1.03 | 0.99 | 0.98 | 1.02 | 1.02 |
| Curtin | 1.05*** | 1.00 | 0.97* | 1.05** | 1.02 | 1.02 | 0.99 | 1.01 |
| Deakin | 1.04*** | 1.00 | 0.97* | 1.04** | 1.01 | 1.01 | 0.99 | 1.01 |
| ECU | 1.00 | 0.98 | 1.06 | 1.03 | 1.00 | 1.00 | 1.02** | 1.01 |
| Fedu | 0.99 | 0.98 | 1.11*** | 1.04 | 0.98 | 0.99 | 1.02** | 1.02 |
| Flin | 1.05*** | 1.00 | 0.96** | 1.05** | 1.03 | 1.05 | 0.98 | 1.02 |
| Griff | 1.04** | 1.00 | 0.96** | 1.04*** | 1.02 | 1.02 | 0.99 | 1.01 |
| JCU | 1.05*** | 1.00 | 0.97 | 1.05** | 1.03 | 1.03 | 0.99 | 1.02 |
| La Trobe | 1.03** | 0.99 | 0.98 | 1.04** | 1.01 | 1.02 | 0.99 | 1.01 |
| Macq | 1.04*** | 1.00 | 0.96** | 1.05** | 1.02 | 1.02 | 0.99 | 1.01 |
| Monash | 1.06*** | 1.02 | 0.98 | 1.04** | 1.04 | 1.06* | 0.99 | 1.03 |
| Murd | 1.03** | 0.99 | 0.98 | 1.04** | 1.00 | 1.00 | 1.00 | 1.01 |
| QUT | 1.04*** | 1.00 | 0.97* | 1.04** | 1.01 | 1.01 | 1.00 | 1.01 |
| RMIT | 1.01 | 0.99 | 1.01 | 1.03 | 1.00 | 0.99 | 1.02** | 1.01 |
| SCU | 1.01 | 0.99 | 1.04 | 1.03 | 0.99 | 0.99 | 1.02** | 1.01 |
| Swin | 1.01 | 0.99 | 0.99 | 1.04** | 1.01 | 1.00 | 1.01 | 1.01 |
| UAdel | 1.05** | 1.06** | 1.01 | 1.00 | 1.06 | 1.04 | 1.02 | 1.03 |
| UC | 1.03** | 0.99 | 0.99 | 1.04** | 1.00 | 1.00 | 1.01* | 1.01 |
| UMelb | 1.05*** | 1.05* | 1.01 | 1.00 | 1.06 | 1.03 | 1.04* | 1.04 |
| UNE | 1.03*** | 0.99 | 0.99 | 1.04** | 1.00 | 1.00 | 1.01* | 1.01 |
| UNSW | 1.05*** | 1.05* | 1.00 | 1.01 | 1.06 | 1.04 | 1.02 | 1.03 |
| UoN | 1.06*** | 1.01 | 0.97 | 1.05** | 1.02 | 1.02 | 0.99 | 1.02 |
| UQ | 1.05** | 1.06** | 1.01 | 1.00 | 1.06 | 1.04 | 1.03* | 1.04 |
| UniSA | 1.04** | 1.00 | 0.96** | 1.04** | 1.01 | 1.00 | 1.01 | 1.01 |
| USQ | 1.00 | 0.98 | 1.03 | 1.03* | 1.00 | 1.00 | 1.00 | 1.01 |
| USyd | 1.05*** | 1.05* | 1.01 | 1.01 | 1.06 | 1.05 | 1.01 | 1.03 |
| UTas | 1.06*** | 1.00 | 0.97* | 1.05** | 1.02 | 1.02 | 0.98 | 1.01 |
| UTS | 1.04*** | 1.00 | 0.96** | 1.05** | 1.03 | 1.05* | 0.98 | 1.02 |
| USC | 1.03** | 0.99 | 1.00 | 1.03* | 1.01 | 1.00 | 1.02** | 1.01 |
| UWA | 1.05** | 1.07** | 1.03 | 0.99 | 1.07 | 1.03 | 1.05** | 1.04 |
| WSU | 1.01 | 0.99 | 1.00 | 1.03 | 1.00 | 0.99 | 1.02** | 1.01 |
| UOW | 1.05*** | 1.00 | 0.96** | 1.05** | 1.03 | 1.03 | 0.98 | 1.01 |
| VU | 1.00 | 0.98 | 1.13*** | 1.04 | 0.98 | 0.97 | 1.00 | 1.01 |
| Mean | 1.03 | 1.01 | 1.01 | 1.03 | 1.02 | 1.01 | 1.01 |
*, ** and *** significant differences from unity at 10, 5 and 1%, respectively; The statistical significance of technology change estimates using the bootstrap procedure is assessed by constructing a confidence interval from the distribution of bootstrap estimates. If the interval does not include the value 1, the change is considered statistically significant
An individual analysis reveals that while top performers in technological change include Go8 universities like UOW, ANU, UQ and UMelb, several universities within this group, such as ANU, UNSW and USyd, rank among the lowest in efficiency change. This indicates that productivity gains in Go8 universities are primarily driven by sector-wide improvements, particularly an increase in publication output, rather than shifts in their relative positions within the group. In contrast, non-Go8 universities such as WSU, RMIT, USQ and Murd rank among the lowest in technological change, while universities like CDU, Flinders, UTS and ECU demonstrate the highest efficiency improvements. These findings indicate that the primary driver of productivity gains in non-Go8 universities lies in efficiency enhancements, potentially reflecting heightened competition within this group.
Figure 1 illustrates the trend of productivity change among different university groups. The university groups are labelled as ATN (Australian Technology Network), Go8 (Group of Eight), IRU (Innovative Research Universities), NoG (Not member of any group) and RUN (Regional Universities Network). The full list of universities and their associated groups is provided in the Appendix. While average productivity growth has declined over time, some groups perform considerably better or worse than others. As shown in Figure 1, the Go8 performs better than most other groups during most of the study period. In contrast, universities in the RUN, on average, demonstrate lower productivity growth in most years of the last two decades. Figure 1 also reveals the impact of significant events such as the global financial crisis (GFC) in 2008, the capping and uncapping policy [1] for domestic ungraduated degrees (Commonwealth Supported Places), and the COVID-19 pandemic on different groups of universities.
While different trends can be observed in Figure 1, productivity growth is evident in most years. During the post-GFC period (2009–2015), Australian universities experienced considerable productivity growth. This growth can be attributed to an increase in the number of both domestic and international students. The undergraduate uncapping policy introduced in 2009 allowed universities to enrol higher numbers of domestic students in most undergraduate courses. Moreover, in 2013, the Labor government simplified the visa process and expanded post-study work rights for international students, based on the recommendations of the 2011 Knight Review. It is evident from Figure 1 that the abolition of the uncapping policy in 2017 had a negative impact on productivity growth, which persisted until the COVID-19 pandemic. Finally, for the first time in two decades, all university groups experienced a productivity setback during the post-pandemic era in 2021–2022.
Table 5 presents the average of productivity change and its components (efficiency and technology changes) among university groups in three time intervals: 2002–2008, 2009–2015 and 2016–2022. A comparison reveals that overall productivity growth was positive across all groups, with the highest increase observed in the Go8 universities. Technological change was the primary driver of productivity growth, particularly in the 2009–2015 period, while efficiency changes were relatively insignificant and less consistent. However, A noticeable slowdown in the rate of productivity and technological growth occurred in the most recent period (2016–2021), although both remained above unity. This moderation is possibly due to external challenges such as the reversal of the uncapping policy and the disruptions caused by the COVID-19 pandemic. Despite general stability in efficiency, some groups, like the RUN, experienced declines, indicating geographic challenges and limited economies of scale. Overall, consistent with the prior literature (e.g. Moradi-Motlagh et al., 2016; Carrington et al., 2018), the results suggest that technological advancements were more influential than efficiency improvements in driving productivity growth among all university groups.
Comparing average productivity change and its components
| Productivity change | Efficiency change | Technological change | |||||||
|---|---|---|---|---|---|---|---|---|---|
| Group | 2002–2008 | 2009–2015 | 2016–2022 | 2002–2008 | 2009–2015 | 2016–2022 | 2002–2008 | 2009–2015 | 2016–2022 |
| ATN | 1.059 | 1.067 | 1.017 | 1.019 | 1.009 | 1.005 | 1.043 | 1.062 | 1.012 |
| Go8 | 1.062 | 1.079 | 1.019 | 0.998 | 1.002 | 0.985 | 1.065 | 1.077 | 1.035 |
| IRU | 1.042 | 1.062 | 1.019 | 1.003 | 1.007 | 1.009 | 1.040 | 1.056 | 1.011 |
| NoG | 1.038 | 1.047 | 1.021 | 1.007 | 0.998 | 1.010 | 1.033 | 1.011 | 1.011 |
| RUN | 1.011 | 1.032 | 1.007 | 1.008 | 0.994 | 0.995 | 1.005 | 1.039 | 1.013 |
| Mean | 1.042 | 1.057 | 1.017 | 1.007 | 1.002 | 1.001 | 1.037 | 1.049 | 1.016 |
5.1 Robustness analysis
DEA results are known to be sensitive to the selection of input and output variables. To examine the robustness of the productivity analysis in this study, an alternative set of input variables is employed. Specifically, total expenditure is replaced with two non-monetary variables: the number of academic and non-academic staff. These variables are widely used in the existing literature and serve as credible proxies for university inputs. They also assist addressing limitations associated with financial data, such as variations in accounting practices and the challenges of accurately deflating financial values over time. Table 6 presents the results of the robustness analysis, comparing the original model based on total expenditure (Model 1) with an alternative model that incorporates staff numbers (Model 2). The table reports the average productivity changes derived from both models across different university groups and time periods, allowing for an assessment of the consistency and robustness of the productivity change estimates when using alternative input proxies. Where there is a discrepancy between the two models (that is, one shows improvement while the other indicates a decline in productivity), the relevant row is highlighted in grey. As shown in Table 6, only a few such discrepancies are observed, primarily within the RUN group.
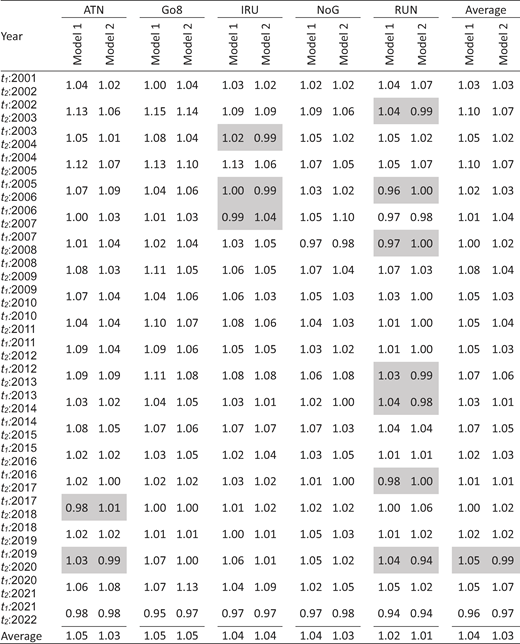
A comparison of the results from both models in Table 6 reveals a broadly consistent pattern of productivity improvement across the various university groups and time periods. This consistency supports the robustness of the productivity estimates, regardless of the input proxy used. The results are particularly consistent for the Go8 and NoG groups, which show no discrepancies throughout the entire study period. Similarly, the IRU group records an average productivity change of 1.04 under both models over the full period, further confirming the stability of the findings. Year-by-year comparisons also show consistency in average productivity changes (see the last column), with the exception of the 2019–2020 period. While both models indicate productivity improvements during that year, Model 1 reports an average change of 1.05 compared to 0.99 in Model 2. A similar pattern is evident across all university groups, suggesting that institutions were effective in reducing non-staff-related expenses during the first year of the pandemic. However, the average productivity declines of 0.96 (Model 1) and 0.97 (Model 2) in 2021–2022 confirm the ongoing negative impact of the pandemic in its second year.
One possible reason for lower productivity during the pandemic when using staff numbers instead of total expenditure is that staff inputs tend to remain relatively stable over short periods and show less variability than financial inputs. This limits the model’s ability to detect short-term efficiency gains or responses to external shocks. For example, during the COVID-19 pandemic, many universities reduced discretionary spending on travel, events, casual staff and operational costs. These reductions are reflected in total expenditure but not in staff headcounts. As a result, productivity improvements driven by cost-saving measures may be underestimated when using staff-based inputs. However, redundancies and cutting the staff numbers in the following years, both models in 2021–2022 show relatively similar level of productivity regress. Therefore, it can be argued that Model 1 may offer a more reliable measure in situations where universities significantly increase or reduce non-staff-related costs, such as during a crisis, whereas in other ordinary times, both models yield consistent results. Overall, the evidence suggests that despite some fluctuations arising from the use of different input variables, the original findings are robust. The results for individual universities under Model 2 are provided in the Appendix (Tables A2–A4).
6. Discussion
Our findings indicate a notable improvement in productivity, especially in the early years of the study period. The rate of growth declined significantly in the years preceding the COVID-19 pandemic. The impact of COVID-19 is also notable on productivity change. Although public universities are not-for-profit institutions that play a crucial role in the economy and society (Moodie, 2020), the Coalition Australian government intentionally excluded them from the JobKeeper wage subsidy scheme (Universities Australia, 2020). This decision left public universities to handle the significant loss of revenue from international students and some research projects on their own (McGaughey et al., 2022). Furthermore, the government declined to maintain funding levels for domestic students to support universities during this challenging time (Universities Australia, 2020).
Figure 2 illustrates the total expenses (adjusted for inflation) of all 37 public universities from 2001 to 2022. A sharp decline in total expenses in 2020 and 2021 aligns with our findings that universities improved their productivity during the first two years of the pandemic. Faced with the challenges of the pandemic and a lack of federal government support, universities had few options but to implement significant cost-cutting measures, including reducing operational expenses and laying off staff. Productivity growth increased during the first two years of the pandemic, demonstrating that the cost-cutting measures effectively offset the decline in student numbers.
 The image depicts a line graph illustrating total expenses measured in millions of dollars over a period from 2001 to 2022. The x-axis represents the years, ranging from 2001 to 2022, while the y-axis indicates expenses, spanning from twenty-two thousand to thirty-eight thousand dollars in increments of two thousand. The line moves upward overall, with noticeable fluctuations in specific years. Key data points include a sharp rise between 2015 and 2016, followed by a gradual increase towards a peak around 2020, before showing some decline and stabilization in the subsequent years. The graph emphasizes the changes in expenses over time without identifying any particular trends or conclusions.
Total expenditure of all 37 public universities (2001–2022)
The image depicts a line graph illustrating total expenses measured in millions of dollars over a period from 2001 to 2022. The x-axis represents the years, ranging from 2001 to 2022, while the y-axis indicates expenses, spanning from twenty-two thousand to thirty-eight thousand dollars in increments of two thousand. The line moves upward overall, with noticeable fluctuations in specific years. Key data points include a sharp rise between 2015 and 2016, followed by a gradual increase towards a peak around 2020, before showing some decline and stabilization in the subsequent years. The graph emphasizes the changes in expenses over time without identifying any particular trends or conclusions.Total expenditure of all 37 public universities (2001–2022)
Figure 3 shows the trend of total student load and publications of all universities in the sample during the study period. It clearly indicates that the total number of students has sharply declined since 2020 after two decades of continuous growth. This reduction was primarily due to the border closures during the pandemic and the follow-on effect of losing international students in the first and second years of the pandemic, resulting in a continued impact on student load even after the borders reopened and international students returned. In contrast, the number of publications continued to increase in the first two years of the pandemic. The growth in publications can be attributed to several factors. First, there is often a delay between completing a research project and its subsequent publication. Consequently, some of the work on published documents may have been started or even completed before the pandemic, which minimised the pandemic’s impact on these projects due to the delay in publication. Second, the pandemic itself provided new research opportunities, and some journals expedited the publication process for pandemic-related topics. Third, working from home allowed some academics to dedicate more time to their research projects. However, it can be observed that the continuous growth in publications nearly ceased in 2022. This aligns more with the pipeline effect of publications, where the initial increase in the number of publications was primarily due to the delay between completing a research project and its acceptance as a peer-reviewed article or book chapter.
 The chart presents two time series from 2001 to 2022 that track total student load and total publications. The student load begins near six million in 2001 and rises steadily to reach about ten million by 2019 before falling slightly after 2020. Total publications start below two million in 2001 and increase each year, reaching roughly one point six million by 2022. Both measures follow upward trajectories for most of the period, with publications showing faster proportional growth. The student load displays minor fluctuations around 2006 and 2017, while publications rise more smoothly.
Total student load and publications of all 37 public universities from (2001–2022)
The chart presents two time series from 2001 to 2022 that track total student load and total publications. The student load begins near six million in 2001 and rises steadily to reach about ten million by 2019 before falling slightly after 2020. Total publications start below two million in 2001 and increase each year, reaching roughly one point six million by 2022. Both measures follow upward trajectories for most of the period, with publications showing faster proportional growth. The student load displays minor fluctuations around 2006 and 2017, while publications rise more smoothly.Total student load and publications of all 37 public universities from (2001–2022)
Figures 4 and 5 present complementary perspectives on teaching and research efficiency in Australian universities from 2001 to 2022. Figure 4 shows trends in average student load and publications relative to one million dollars ($m) of expenses, highlighting changes in financial efficiency over time. Figure 5 depicts average student load and publications per academic, offering insights into workload and staff productivity. These figures provide a holistic view of how universities have balanced teaching and research activities relative to both financial resources and academic staff capacity, and how these dynamics shifted during the COVID-19 pandemic. Between 2001 and 2019, both student load per $m and per academic increased moderately, reflecting growing teaching demands on institutional budgets and staff. However, publications per $m and per academic rose much more sharply, indicating that improvements in research productivity relative to expenses and staff inputs were significantly higher than in teaching. This divergence highlights the structural differences between teaching and research activities. Teaching efficiency is inherently limited because universities cannot indefinitely increase class sizes or reduce per-student expenditure without compromising quality. In contrast, research productivity faces fewer constraints. Universities have increasingly embedded research outputs into performance expectations for academics, driven by competition for prestige, external funding, and global rankings. The culture of “publish or perish” has amplified this trend, enabling universities to increase research outputs without directly scaling expenditure or staffing in proportion to those gains.
 The chart displays two indicators from 2001 to 2022 that relate activity to funding: average student load per million dollars and average publications per million dollars. The student load measure begins near twenty-six in 2001, rises gradually to about thirty-three by 2015, remains steady for several years, and then dips slightly after 2021. The publication measure starts near eight tenths in 2001 and climbs consistently to exceed four by 2021 before a minor decline in 2022. Both indicators show sustained increases over the period, suggesting rising efficiency in teaching activity and research output relative to financial resources. The two trends progress independently but share similar long term growth patterns.
Average student load and number of publications per $1m in expenses (2001–2022)
The chart displays two indicators from 2001 to 2022 that relate activity to funding: average student load per million dollars and average publications per million dollars. The student load measure begins near twenty-six in 2001, rises gradually to about thirty-three by 2015, remains steady for several years, and then dips slightly after 2021. The publication measure starts near eight tenths in 2001 and climbs consistently to exceed four by 2021 before a minor decline in 2022. Both indicators show sustained increases over the period, suggesting rising efficiency in teaching activity and research output relative to financial resources. The two trends progress independently but share similar long term growth patterns.Average student load and number of publications per $1m in expenses (2001–2022)
 The image presents a line graph depicting two datasets over the years from 2001 to 2022. The vertical axis is labelled with values indicating student load per academic, ranging from 20 to 26, while the right vertical axis indicates publications per academic, ranging from 0 to 3. The horizontal axis represents the years, spanning from 2001 to 2022. Two distinct lines illustrate the trends: a solid line for average student load per academic and a dotted line for average publication per academic. The graph highlights variations in these metrics over time, particularly observing fluctuations in average student load and a general increase in academic publications through the years.
Average student load and publications per academic (2001–2022)
The image presents a line graph depicting two datasets over the years from 2001 to 2022. The vertical axis is labelled with values indicating student load per academic, ranging from 20 to 26, while the right vertical axis indicates publications per academic, ranging from 0 to 3. The horizontal axis represents the years, spanning from 2001 to 2022. Two distinct lines illustrate the trends: a solid line for average student load per academic and a dotted line for average publication per academic. The graph highlights variations in these metrics over time, particularly observing fluctuations in average student load and a general increase in academic publications through the years.Average student load and publications per academic (2001–2022)
From 2020 onwards, the COVID-19 pandemic introduced additional dynamics. Student load per $m and per academic initially remained stable or rose slightly as universities retained existing enrolments and shifted to online delivery. By 2022, however, both measures declined, likely reflecting the lagged effects of international border closures, reduced new enrolments and changes in workload allocation. Publications per $m and per academic continued to rise sharply in 2020 and 2021, suggesting that during lockdowns, academics reallocated time from face-to-face teaching and administrative tasks to research activities. By 2022, the upward trend in research plateaued or declined slightly, possibly due to pandemic fatigue, disrupted projects and financial pressures. This slowdown may also reflect inherent lags in the research and publication process, given that academic research typically requires substantial time to complete and is often subject to additional delays during peer review and publication. It can therefore be argued that the observed increase in research productivity during the pandemic was primarily driven by projects initiated prior to its onset, rather than by new research activities commenced during this period. The combined findings of Figures 4 and 5 underscore that universities achieved sustained gains in research productivity relative to both financial and staff inputs, whereas improvements in teaching were more constrained. These trends reflect a broader institutional focus on research outputs as the primary driver of performance and competitiveness in the higher education sector which may not be sustainable in a long-term.
Examining changes in input and output variables reveals the reasons behind the productivity results and highlights the profound impact of the pandemic on the university sector. Specifically, it can be argued that the gains observed during the first two years of the pandemic were primarily due to significant emergency cost savings and reductions in system capacity, which may have long-term negative effects, as evidenced by the 2022 results. Although productivity improved in 2020 and 2021, owing to cost savings outweighing the negative impact of the reduction in student numbers, the significant decline in 2022 suggests that universities may need to deal with the adverse consequences of the drastic measures taken during the pandemic for some time. The ongoing pressure to restrict the number of international students is likely to hinder output growth, compounded by inflationary pressures that have significantly raised costs. Consequently, the sector’s productivity growth is expected to remain constrained in the near future. It is also important to note that while productivity gains during the pandemic were achieved, they may have come at the expense of quality and may not be sustainable. For example, universities increased class sizes, and the student-to-staff ratio significantly worsened. Therefore, it is critical to ensure that productivity and efficiency improvements do not compromise the quality of education and research.
The findings reveal that, after two decades, productivity growth in the sector has stagnated and major policy changes are necessary to restore productivity to the high levels experienced following the GFC. Moreover, a key takeaway is the role of benchmarking and learning from successful peers. Using frontier techniques such as DEA, universities and policy makers can identify best performers and learn from the best practices. The findings also suggests that Australian universities can improve productivity and efficiency by leveraging technological advancements. Key opportunities include investing in digital technologies, such as online learning platforms, digital libraries, research databases and collaboration tools, to enhance teaching and research capabilities. Improving student services is another area of opportunity. To attract and retain students, universities can improve the quality of education, provide student support services and enhance the level of engagement.
In the accounting context, frontier analysis methods such as DEA offer several advantages over traditional ratio measures in efficiency analysis. DEA provides a comprehensive efficiency measurement by comparing multiple inputs and outputs simultaneously (Alhassan and Boakye, 2020). For instance, in the efficiency analysis of universities, DEA can handle multiple outputs, such as the number of students and research publications, offering a holistic view of how resources, including the efforts of academic and non-academic staff, are converted into outputs. This contrasts with traditional ratios which focus on a single aspect of performance at a time that can overlook the multifaceted nature of university operations. Another advantage of DEA is its ability to benchmark against the best performers. By constructing a frontier of best practices based on the performance of all universities in the sample, DEA identifies which universities are performing at the highest efficiency level and uses them as benchmarks in efficiency analysis. Therefore, considering the successful application of advanced benchmarking techniques in various fields and abundant of software applications, it is the right time for accounting researchers also to adopt more advance efficiency analysis and performance measurement methods beyond conventional approaches like financial ratios.
7. Summary and conclusion
The impact of COVID-19 on productivity is particularly relevant in the Australian higher education context due to several structural and policy-related factors. First, Australian public universities are highly dependent on international student fees, which were severely affected by border closures. Second, unlike other sectors, universities were excluded from the federal JobKeeper wage subsidy scheme, leaving them to absorb financial shocks without government support. Third, the pandemic necessitated a rapid transition to online delivery, which challenged existing infrastructure and workflows. These conditions created a unique environment where universities had to implement emergency cost-saving measures, restructure operations, and adapt to reduced capacity – all of which directly influenced productivity. Therefore, examining this period offers valuable insights into institutional resilience and the long-term implications of crisis-driven efficiency strategies.
The paper examines the application of bootstrap DEA in evaluating the efficiency and productivity of Australian public universities from 2001 to 2022. DEA, a non-parametric method for estimating production frontiers, is used to measure and benchmark the productive efficiency of these institutions. The study contributes to the literature by providing a comprehensive productivity analysis over the last two decades, including the impact of the COVID-19 pandemic, and decomposing productivity changes into efficiency and technological components. This analysis covers 37 Australian universities and uses the MPI to assess changes in productivity and its components (efficiency and technology changes).
The results reveal a general trend of productivity improvement across the universities, with a peak in productivity during the first two years of the COVID-19 pandemic, followed by a sharp decline in the subsequent year (2022). The findings show that the productivity gains observed during the first two years of the pandemic were primarily due to significant emergency cost savings and reductions in system capacity, which may have long-term negative effects. The significant decline in productivity in 2022 suggests that universities may need to deal with the adverse consequences of the drastic measures taken during the pandemic for some time. Therefore, universities and policy makers need to balance cost-cutting measures with the potential impact on quality and sustainability.
The productivity changes in Australian public universities have significant implications for several Sustainable Development Goals (SDGs). Improving productivity in universities significantly impacts SDG 4 (Quality Education) by enhancing the affordability and accessibility of education. Higher productivity allows universities to allocate resources more efficiently, leading to advanced teaching practices and knowledge dissemination. Technological advancements driving productivity align with SDG 9 (Industry, Innovation and Infrastructure), promoting innovation and the development of resilient educational infrastructure. Furthermore, by improving productivity and efficiency, universities can help reduce inequalities (SDG 10: Reduced Inequalities), ensuring that educational benefits are more affordable and can be evenly distributed across different social groups. Therefore, enhancing productivity of universities can contribute to a more inclusive and sustainable higher education system.
This study emphasises the advantage of frontier analysis approach in providing a reliable benchmarking framework for performance evaluation in higher education. The results offer valuable insights for university decision-makers, highlighting the importance of continuous efficiency improvements and technological advancements. The study advocates for further exploration of DEA’s capabilities in accounting to enhance performance assessment and target-setting in the education sector. This study has two main limitations. First, no quality adjustment has been made due to the lack of reliable quality measures. Although the DEA models are capable of incorporating quality measures, this can be explored as a topic for future research. Second, the study assumes that universities provide only two main outputs of teaching and research. Providing service to the community is also one of the primary responsibilities of academic institutions (Su and Baird, 2017). Therefore, including this third dimension and recognising this output can add value to such productivity analysis.
The contribution to the existing literature lies in offering new theoretical insights into the dynamics of productivity in higher education. The analysis demonstrates that productivity growth in Australian universities is more strongly influenced by technological progress at the sector level than by individual universities efficiency improvements. This challenges the conventional view that institutional performance is primarily driven by managerial or operational changes within individual universities. Instead, the findings suggest that systemic innovations, such as digital infrastructure and research dissemination platforms, play a more critical role in shaping productivity outcomes. Furthermore, the study highlights the limitations of traditional ratio-based performance metrics commonly used in accounting and advocates for the broader adoption of frontier-based methods like DEA. These methods provide a multidimensional understanding of performance by accounting for multiple inputs and outputs simultaneously. In doing so, this study not only substantiates the practicality of the applied method for researchers in accounting and higher education, but also encourages a shift in focus from isolated institutional metrics to sector-wide technological and structural factors in the analysis of higher education efficiency. Finally, the robustness test analysis demonstrated that the expenditure-based model captured short-term efficiency changes during the pandemic more effectively than the staff-based model, owing to greater variability in financial inputs. Although both models aligned in most years, the expenditure-based approach may be more reliable during periods of financial disruption. Overall, the findings appear robust across different input choices.
Possible avenues for future research include the use of parametric methods to complement the current analysis. As noted by Rella and Vitolla (2025), parametric approaches can offer additional insights into efficiency dynamics by distinguishing inefficiency from random noise. Incorporating techniques such as SFA could therefore enhance the robustness of findings and provide a deeper understanding of performance variations. Furthermore, while this study applies a common frontier approach to evaluate efficiency across all universities, future studies could benefit from adopting a meta-frontier framework. This would allow for the consideration of technological heterogeneity among different university groups, such as research-intensive and teaching-focused institutions, thereby enabling more accurate and context-sensitive benchmarking. Finally, future research could explore changes in the relative virtual weights or shadow prices assigned to teaching and research outputs over time. Such an analysis may offer deeper insights into how institutional priorities between teaching and research outputs, as well as efficiency dynamics, evolve, especially in response to external shocks.
Acknowledgements
The author wish to thank the editor and the two anonymous referees for their thoughtful and constructive comments, which have contributed to improving the overall quality of this manuscript. He also used Microsoft Copilot to assist with language refinement, including grammar correction and improvements to clarity.
Note
The “uncapping policy” refers to the introduction of a demand-driven funding system in 2009, which removed government-imposed limits on the number of domestic undergraduate students that universities could enrol. Prior to this, caps were in place, including during the pre-GFC period, which restricted growth in student numbers. The uncapping policy aimed to increase participation and equity in higher education, and led to significant growth in enrolments and research output. However, in 2017, the policy was reversed due to concerns about rising costs and limited gains in access for disadvantaged students. Please see Link to timeshighereducation for more details.
References
Appendix
The list of 37 public Australian universities by group and abbreviation
| Group | University | Abbreviation |
|---|---|---|
| ATN | Curtin University | Curtin |
| ATN | Deakin University | Deakin |
| ATN | RMIT University | RMIT |
| ATN | University of Newcastle | UoN |
| ATN | University of South Australia | UniSA |
| ATN | University of Technology, Sydney | UTS |
| Go8 | Australian National University | ANU |
| Go8 | Monash University | Monash |
| Go8 | University of Adelaide | UAdel |
| Go8 | University of Melbourne | UMelb |
| Go8 | University of New South Wales | UNSW |
| Go8 | University of Queensland | UQ |
| Go8 | University of Sydney | USyd |
| Go8 | University of Western Australia | UWA |
| IRU | Flinders University | Flin |
| IRU | Griffith University | Griff |
| IRU | James Cook University | JCU |
| IRU | La Trobe University | La Trobe |
| IRU | Murdoch University | Murd |
| IRU | University of Canberra | UC |
| IRU | University of Western Sydney | WSU |
| NoG | Australian Catholic University | ACU |
| NoG | Charles Darwin University | CDU |
| NoG | Edith Cowan University | ECU |
| NoG | Macquarie University | Macq |
| NoG | Queensland University of Technology | QUT |
| NoG | Swinburne University of Technology | Swin |
| NoG | University of Tasmania | UTas |
| NoG | University of Wollongong | UOW |
| NoG | Victoria University | VU |
| RUN | Central Queensland University | CQU |
| RUN | Charles Sturt University | CSU |
| RUN | Federation University Australia | Fedu |
| RUN | Southern Cross University | SCU |
| RUN | University of New England | UNE |
| RUN | University of Southern Queensland | USQ |
| RUN | University of the Sunshine Coast | USC |
Productivity change (Model 2)
| University | =2015 =2016 | =2016 =2017 | =2017 =2018 | =2018 =2019 | =2019 =2020 | =2020 =2021 | =2021 =2022 | Mean |
|---|---|---|---|---|---|---|---|---|
| ACU | 0.99*** | 1.03*** | 1.04*** | 1.02 | 0.95*** | 0.98*** | 0.94*** | 0.99 |
| ANU | 1.02*** | 1.04*** | 0.99 | 0.98*** | 0.92*** | 1.11*** | 1.00*** | 1.01 |
| CQU | 0.93*** | 0.95*** | 1.00* | 1.01*** | 0.86*** | 0.92*** | 0.96*** | 0.95 |
| CDU | 1.04*** | 0.97 | 1.01 | 1.17*** | 1.21*** | 1.10*** | 0.95 | 1.07 |
| CSU | 1.04*** | 1.01*** | 0.99 | 0.97*** | 0.94*** | 1.08*** | 0.89*** | 0.99 |
| Curtin | 1.02** | 1.03*** | 1.05*** | 1.07*** | 1.01*** | 1.05*** | 0.98*** | 1.03 |
| Deakin | 0.98 | 1.02*** | 1.00 | 1.01 | 1.00* | 1.08*** | 1.06*** | 1.02 |
| ECU | 1.02*** | 0.98*** | 0.99 | 1.00** | 1.05*** | 0.99 | 1.04*** | 1.01 |
| Fedu | 0.89*** | 0.94*** | 1.27*** | 1.11*** | 0.89*** | 0.86*** | 0.92*** | 0.98 |
| Flin | 1.10*** | 1.02** | 1.06*** | 1.03** | 1.02** | 1.17*** | 0.97*** | 1.05 |
| Griff | 1.04*** | 1.05*** | 0.98*** | 1.01** | 1.03*** | 1.08*** | 0.97 | 1.02 |
| JCU | 1.03*** | 1.00 | 1.03*** | 0.95*** | 1.02*** | 1.02*** | 0.95*** | 1.00 |
| La Trobe | 1.01*** | 1.00 | 1.00 | 0.99** | 0.99 | 1.23*** | 1.05*** | 1.04 |
| Macq | 1.06*** | 1.00* | 0.97** | 1.05*** | 1.02*** | 1.12*** | 1.01 | 1.03 |
| Monash | 1.03*** | 0.99*** | 1.00 | 1.05*** | 1.01 | 1.14*** | 0.96*** | 1.03 |
| Murd | 1.06*** | 1.02*** | 1.03*** | 1.10*** | 0.97*** | 1.07*** | 0.97*** | 1.03 |
| QUT | 1.03*** | 1.06*** | 1.03*** | 0.99*** | 1.02*** | 1.03** | 0.96*** | 1.02 |
| RMIT | 1.01 | 0.98*** | 1.00 | 1.00 | 0.93** | 1.09*** | 0.93*** | 0.99 |
| SCU | 1.09*** | 1.06*** | 1.10*** | 0.99*** | 0.97 | 1.10*** | 0.95** | 1.04 |
| Swin | 1.11*** | 1.01*** | 0.92*** | 0.99 | 0.98 | 1.17*** | 0.98** | 1.02 |
| UAdel | 1.05*** | 0.99*** | 1.02*** | 1.05*** | 1.03*** | 1.14*** | 0.99 | 1.04 |
| UC | 1.05*** | 0.98 | 0.99*** | 0.99 | 0.93*** | 0.99*** | 0.95*** | 0.98 |
| UMelb | 1.04*** | 1.05*** | 1.02*** | 1.04*** | 0.98*** | 1.15*** | 0.93*** | 1.03 |
| UNE | 1.09*** | 1.02* | 1.05*** | 1.00** | 0.94*** | 1.11*** | 0.94*** | 1.02 |
| UNSW | 1.07*** | 1.01 | 0.98 | 0.97*** | 1.06*** | 1.17*** | 0.93*** | 1.03 |
| UoN | 0.99*** | 1.04*** | 0.98*** | 1.00*** | 1.03*** | 1.05*** | 1.01** | 1.01 |
| UQ | 1.08*** | 1.02*** | 1.05*** | 0.98 | 1.02 | 1.10*** | 0.93*** | 1.02 |
| UniSA | 1.06*** | 0.93*** | 0.98*** | 1.04*** | 0.98*** | 1.05 | 0.92*** | 0.99 |
| USQ | 0.96*** | 0.93*** | 1.07*** | 0.99*** | 1.06*** | 1.02 | 0.98 | 1.00 |
| USyd | 1.03*** | 1.01*** | 0.98 | 1.02*** | 0.99*** | 1.13*** | 0.97*** | 1.02 |
| UTas | 1.04*** | 1.01* | 1.03*** | 0.99** | 1.02*** | 0.96*** | 1.00 | 1.01 |
| UTS | 1.07*** | 1.00 | 1.02** | 1.01** | 1.00 | 1.18*** | 1.00 | 1.04 |
| USC | 1.06*** | 1.07*** | 0.96*** | 1.10*** | 0.93*** | 1.08*** | 0.92*** | 1.02 |
| UWA | 1.07*** | 1.07*** | 1.00 | 1.02*** | 1.00 | 1.08*** | 1.00 | 1.04 |
| WSU | 0.98 | 1.07*** | 1.06*** | 1.00 | 1.09*** | 1.06*** | 0.95*** | 1.03 |
| UOW | 1.13*** | 0.99*** | 0.97*** | 1.05*** | 0.99 | 1.08*** | 0.99 | 1.03 |
| VU | 1.00 | 0.95 | 1.20*** | 1.04*** | 0.97*** | 1.00 | 1.00 | 1.02 |
| Mean | 1.03 | 1.01 | 1.02 | 1.02 | 0.99 | 1.07 | 0.97 |
*, ** and *** significant differences from unity at 10, 5 and 1%, respectively
Efficiency change (Model 2)
| University | =2015 =2016 | =2016 =2017 | =2017 =2018 | =2018 =2019 | =2019 =2020 | =2020 =2021 | =2021 =2022 | Mean |
|---|---|---|---|---|---|---|---|---|
| ACU | 1.02 | 1.00 | 0.99 | 0.97 | 0.99 | 0.98 | 0.94** | 0.99 |
| ANU | 0.98 | 0.97* | 1.00 | 0.96 | 0.92*** | 1.03 | 1.01 | 0.98 |
| CQU | 0.95 | 0.92*** | 1.05 | 1.02 | 0.93 | 0.84*** | 0.98* | 0.96 |
| CDU | 0.92*** | 0.96 | 1.08** | 1.17*** | 1.18*** | 0.97 | 0.96 | 1.03 |
| CSU | 1.05* | 0.98 | 1.00 | 0.95** | 1.01 | 1.03 | 0.89*** | 0.99 |
| Curtin | 0.97 | 1.00 | 1.07*** | 1.05** | 1.00 | 0.93*** | 0.96*** | 1.00 |
| Deakin | 0.88*** | 0.98 | 1.05*** | 0.99 | 0.97** | 0.95*** | 1.08*** | 0.99 |
| ECU | 1.05* | 0.96* | 0.98 | 0.99 | 1.01 | 0.93*** | 1.04 | 0.99 |
| Fedu | 0.92*** | 0.91*** | 1.19*** | 1.07* | 0.90** | 0.82*** | 0.93*** | 0.96 |
| Flin | 1.05** | 0.98 | 1.10*** | 1.01 | 1.01 | 1.02 | 1.00 | 1.02 |
| Griff | 0.99 | 1.01 | 1.00 | 0.99 | 1.01 | 0.95*** | 0.96*** | 0.99 |
| JCU | 0.98 | 0.97** | 1.04** | 0.94*** | 1.01 | 0.90*** | 0.93*** | 0.97 |
| La Trobe | 0.97 | 0.94** | 1.06*** | 0.98 | 0.96** | 1.07** | 1.06*** | 1.01 |
| Macq | 0.97* | 0.97 | 1.01 | 1.03 | 1.01 | 0.96 | 1.03 | 1.00 |
| Monash | 0.99 | 0.96** | 1.02* | 1.02 | 1.00 | 0.98 | 0.99 | 1.00 |
| Murd | 1.03 | 0.97* | 1.09*** | 1.08*** | 0.93*** | 0.97* | 0.96** | 1.00 |
| QUT | 0.98 | 1.02 | 1.07*** | 0.97** | 0.99 | 0.91*** | 0.95*** | 0.98 |
| RMIT | 1.00 | 0.95* | 1.05 | 1.00 | 0.95 | 1.01 | 0.96** | 0.99 |
| SCU | 1.10** | 1.02 | 1.11*** | 0.97* | 0.97 | 1.05* | 0.95*** | 1.02 |
| Swin | 1.00 | 1.00 | 1.00 | 1.00 | 0.97 | 1.03 | 1.00 | 1.00 |
| UAdel | 1.02 | 0.97 | 1.04** | 1.03 | 1.04 | 1.00 | 1.02 | 1.02 |
| UC | 0.98 | 0.92*** | 1.06*** | 0.99 | 0.95 | 0.90*** | 0.98* | 0.97 |
| UMelb | 1.02 | 1.02 | 1.00 | 1.00 | 1.00 | 1.00 | 1.00 | 1.00 |
| UNE | 1.05** | 0.97** | 1.12*** | 0.98 | 0.90*** | 1.02 | 0.94*** | 1.00 |
| UNSW | 1.04 | 0.99 | 1.00 | 0.95** | 1.08* | 1.01 | 0.97 | 1.01 |
| UoN | 0.94*** | 1.01 | 0.99 | 0.99 | 1.02 | 0.93*** | 0.99 | 0.98 |
| UQ | 1.03 | 0.99 | 1.05** | 0.97 | 1.01 | 1.01 | 0.93*** | 1.00 |
| UniSA | 1.01 | 0.90*** | 1.02 | 1.03* | 0.93*** | 0.93** | 0.94** | 0.97 |
| USQ | 0.99 | 0.90*** | 1.10*** | 0.97** | 1.02 | 0.92*** | 0.98 | 0.98 |
| USyd | 1.00 | 1.00 | 1.00 | 1.00 | 1.00 | 1.00 | 0.97 | 1.00 |
| UTas | 0.98 | 0.97 | 1.07*** | 0.98 | 1.00 | 0.83*** | 1.01 | 0.98 |
| UTS | 1.03 | 0.96** | 1.04* | 1.00 | 0.99 | 1.01 | 1.00 | 1.00 |
| USC | 1.03 | 1.02 | 1.02 | 1.08*** | 0.89*** | 1.00 | 0.92*** | 0.99 |
| UWA | 1.02 | 1.00 | 1.00 | 1.00 | 1.00 | 1.00 | 1.00 | 1.00 |
| WSU | 0.98 | 1.03 | 1.14*** | 0.99 | 1.05* | 1.00 | 0.96*** | 1.02 |
| UOW | 1.03 | 0.97 | 1.02* | 1.02 | 0.98 | 0.94*** | 1.00 | 0.99 |
| VU | 0.94** | 0.95 | 1.17** | 1.00 | 1.00 | 1.00 | 1.00 | 1.01 |
| Mean | 1.00 | 0.97 | 1.05 | 1.00 | 0.99 | 0.97 | 0.98 |
*, ** and *** significant differences from unity at 10, 5 and 1%, respectively
Technological change (Model 2)
| University | =2015 =2016 | =2016 =2017 | =2017 =2018 | =2018 =2019 | =2019 =2020 | =2020 =2021 | =2021 =2022 | Mean |
|---|---|---|---|---|---|---|---|---|
| ACU | 0.97 | 1.03 | 1.05* | 1.04* | 0.95 | 1.00 | 1.00 | 1.01 |
| ANU | 1.05 | 1.07** | 0.99 | 1.02 | 1.00 | 1.08 | 1.00 | 1.03 |
| CQU | 0.97 | 1.03 | 0.95 | 0.99 | 0.92** | 1.09*** | 0.98 | 0.99 |
| CDU | 1.14*** | 1.02 | 0.94*** | 1.00 | 1.03 | 1.13*** | 0.99 | 1.04 |
| CSU | 0.99 | 1.03 | 0.99 | 1.02 | 0.94** | 1.05 | 0.99 | 1.00 |
| Curtin | 1.05* | 1.04** | 0.99 | 1.01 | 1.01 | 1.13*** | 1.02** | 1.03 |
| Deakin | 1.11*** | 1.04** | 0.95*** | 1.01 | 1.04** | 1.15*** | 0.98 | 1.04 |
| ECU | 0.97 | 1.03 | 1.01 | 1.02 | 1.04** | 1.07*** | 0.99 | 1.02 |
| Fedu | 0.97 | 1.03 | 1.06** | 1.03 | 0.98 | 1.05*** | 0.99 | 1.02 |
| Flin | 1.04 | 1.04** | 0.96*** | 1.02* | 1.01 | 1.15*** | 0.97* | 1.03 |
| Griff | 1.05** | 1.04** | 0.98* | 1.02 | 1.02 | 1.13*** | 1.02** | 1.03 |
| JCU | 1.05** | 1.03** | 0.99 | 1.02 | 1.01 | 1.14*** | 1.02* | 1.04 |
| La Trobe | 1.03 | 1.06*** | 0.95*** | 1.01 | 1.04* | 1.15*** | 0.99 | 1.03 |
| Macq | 1.09*** | 1.03** | 0.96*** | 1.02 | 1.01 | 1.16*** | 0.98 | 1.04 |
| Monash | 1.05** | 1.03 | 0.98 | 1.02 | 1.00 | 1.16*** | 0.97 | 1.03 |
| Murd | 1.03 | 1.06*** | 0.94*** | 1.02 | 1.04** | 1.10*** | 1.00 | 1.03 |
| QUT | 1.05** | 1.04*** | 0.96*** | 1.02 | 1.03 | 1.13*** | 1.01* | 1.03 |
| RMIT | 1.01 | 1.03 | 0.95* | 1.00 | 0.98 | 1.08*** | 0.97 | 1.00 |
| SCU | 1.00 | 1.04 | 0.98 | 1.02 | 1.00 | 1.05** | 0.99 | 1.01 |
| Swin | 1.11*** | 1.01 | 0.92*** | 0.99 | 1.01 | 1.13*** | 0.98 | 1.02 |
| UAdel | 1.03 | 1.02 | 0.98 | 1.02 | 0.99 | 1.13*** | 0.97 | 1.02 |
| UC | 1.07** | 1.06*** | 0.93*** | 1.01 | 0.98 | 1.10*** | 0.98 | 1.02 |
| UMelb | 1.02 | 1.03 | 1.02 | 1.04 | 0.98 | 1.15*** | 0.93*** | 1.02 |
| UNE | 1.04 | 1.06*** | 0.94*** | 1.01 | 1.04** | 1.09*** | 0.99 | 1.02 |
| UNSW | 1.02 | 1.03 | 0.98 | 1.02 | 0.99 | 1.16*** | 0.96* | 1.02 |
| UoN | 1.05** | 1.03* | 0.99 | 1.02 | 1.01 | 1.14*** | 1.02** | 1.04 |
| UQ | 1.05 | 1.03 | 0.99 | 1.02 | 1.00 | 1.09** | 1.00 | 1.03 |
| UniSA | 1.05* | 1.04** | 0.97** | 1.01 | 1.05** | 1.12*** | 0.97 | 1.03 |
| USQ | 0.97 | 1.03 | 0.97 | 1.02 | 1.04** | 1.10*** | 1.00 | 1.02 |
| USyd | 1.03 | 1.01 | 0.98 | 1.02 | 0.99 | 1.13*** | 1.00 | 1.02 |
| UTas | 1.06** | 1.04* | 0.96** | 1.01 | 1.02* | 1.15*** | 0.98 | 1.03 |
| UTS | 1.05** | 1.04** | 0.98 | 1.01 | 1.01 | 1.16*** | 1.00 | 1.04 |
| USC | 1.03 | 1.05** | 0.94*** | 1.02 | 1.04** | 1.09*** | 0.99 | 1.02 |
| UWA | 1.05 | 1.07** | 1.00 | 1.02 | 1.00 | 1.08* | 1.00 | 1.03 |
| WSU | 1.00 | 1.05* | 0.93*** | 1.01 | 1.03** | 1.06*** | 0.99 | 1.01 |
| UOW | 1.10*** | 1.02 | 0.95*** | 1.02 | 1.01 | 1.16*** | 0.98 | 1.03 |
| VU | 1.06* | 1.00 | 1.03 | 1.04 | 0.97 | 1.00 | 1.00 | 1.01 |
| Mean | 1.04 | 1.04 | 0.97 | 1.02 | 1.01 | 1.11 | 0.99 |
*, ** and *** significant differences from unity at 10, 5 and 1%, respectively

