


This study evaluates a multidimensional hierarchical scale of smart policing service quality.
Qualitative and quantitative analysis tools were used to develop a smart policing service quality scale based on the integrative psychometric scale development methodology. A multidimensional hierarchical structure was proposed for smart policing service quality; a group of preliminary items selected from literature was used for the qualitative analysis. For data collection, users of smart policing services were selected through the United Arab Emirates (UAE) research centre. Several statistical methods were employed to verify reliability and validity of the construct and nomological validity of the proposed scale.
A smart policing service quality scale of 23 items was developed based on a hierarchical factor model structure. Nomological testing indicated that overall smart policing service quality is positive and significant, thus contributing to user satisfaction, intention to continue using the system and enhanced quality of life.
This study enables managers to evaluate types of policing quality and effectively implement strategies to address security and sustainability issues that exist currently in smart services.
Previous studies on policing service quality have not sufficiently addressed the role of smart policing service quality; the nature of discussion in this area is primarily based around concepts. The development of the smart policing service quality scale provides a measurement tool for researchers to use to enhance the understanding of smart policing service quality.
Introduction
Smart policing services are a component of the smart government ecosystem; they share significant characteristics with those of a smart government, such as transparency and integrity (Chatfield and Reddick, 2019; Liou, 2019). The application of some of these common characteristics, such as responsivity and interactivity, can be easily transferred from traditional service-based industries to smart policing service quality assessment (De Keyser et al., 2019; Nowak, 2019). However, other features of the smart government policing system require adaptation to the rapid changes in digital and technological advancements in order to enhance user satisfaction (Ali and Raza, 2017; Kennedy, 2019). Therefore, it is imperative to understand the factors influencing users' perceptions of service in order to improve user experience and satisfaction level with the service provided (Li and Shang, 2020). Service performance is a subjective construct that depends on the confluence of user perceptions and expectations of the services based on users' service experience. Service quality is a difficult concept to understand (Parasuraman et al., 1991) due to its intangible nature, particularly in meeting the unique expectations of users.
Studies on smart governance indicate that the critical role played by successful service performance in public services lies in improving the participation of urban residents through social and relational capital, in addition to achieving social and environmental sustainability (Argento et al., 2019). Due to the frequent occurrence of conflicts between residents and the police, studies on the quality of smart policing services can be challenging. Smart policing quality should be addressed collectively with the issues associated with the use of smart technologies to create public value. Liou (2019) provided evidence of conflicts arising between smart technologies and police services in the United States. As residents are more aware of their rights and duties as citizens at present, the use of the traditional policing model to address their issues is not sufficient. The user experience with smart policing services is considered to be different from their experience with traditional policing practices that have been criticised as ineffective and inflexible in addressing different issues faced by residents, instead increasing tension and distance between the residents and the police.
There have also been instances where the services offered were neither requested, solicited, nor used frequently by residents. Therefore, it is important to focus on the users of this public service to understand users' perceptions and expectations regarding the services delivered. Ultimately, the implementation of smart policing services promotes sustainability as well as the utilisation of social and relational capital that requires modern, progressive and contemporary policing services (Hu and Lovrich, 2019; Liou, 2019).
Kankanhalli et al. (2019) performed a comprehensive review of the conceptual framework of various industry-specific smart services inspired by smart government. The authors identified several common factors among studies performed across cultures. Specifically, transparency, integrity, interactivity, responsivity and serviceability, as well as their interrelationships, were the key factors and issues identified as variables to be investigated. As the constructs of smart policing service quality must be evaluated using an appropriate measurement scale, this study aims to develop a scale to do that measuring. The study also assesses the scale's validity and reliability using measures such as convergence and discriminant validity tests, predictive validity and factor invariance. Therefore, the two primary objectives of this study are to:
construct and validate an adequate instrument to measure the service quality of smart policing; and
investigate the nomological validity of the relationships between smart policing service quality and its theoretical constructs.
Literature review
Multidimensional views on service quality
The perception of quality is complex and wide-ranging (Kunz et al., 2019; Nowak, 2019). Service quality refers to the judgement of attitude based on the performance of the service (Cronin et al., 2000; Parasuraman et al., 1991). This concept has been investigated extensively in literature studies related to service and marketing, with rather limited studies on policing. Service quality is frequently described as the key success factor of competitive advantage and as something that can be used to build a strong customer base (Li and Shang, 2020; Nowak, 2019). A vast number of literature studies related to service have indicated that service quality differs from user satisfaction, perception of value and behavioural intention (Ali and Raza, 2017; Kunz et al., 2019; Li and Shang, 2020; Nowak, 2019). These studies illustrate the growing need to explore the dimensions of service quality that are important for users. There should be a distinction between the concept of service quality and the development of models that depict the relationships among service quality, user satisfaction, perceived value, user intention and behaviour.
For a better perspective of the constructs in service quality, conceptual and empirical studies have been performed to conceptualise and measure service quality. Based on the initial study on the disconfirmation paradigm (Oliver, 1980), it was suggested that quality is derived from the comparison of users' expectations and perceptions of service performance (Cronin et al., 2000; Parasuraman et al., 1988). Grönroos (2001) indicated that perception of service quality is assessed based on expected service quality that consists of functional (users' perceptions of the service delivery) and technical (users' perceptions of the outcome of the service) qualities. Following the disconfirmation paradigm, SERVQUAL (Parasuraman et al., 1988) was developed to measure users' expectations and perceptions of service received. Consistent with these initial conceptualisations of service quality, subsequent studies were performed on aspects of service quality, including identifying the structure of service quality (Chen et al., 2017; Li and Shang, 2020), developing modified versions of SERVQUAL, known as SERVPERF (Cronin and Taylor, 1992) and POLQUAL (Sarrico et al., 2013), creating new measurement models such as PubHosQual (Aagja and Garg, 2010) and COBRA (Osman et al., 2014) and adapting existing models to incorporate specific smart government features such as security and public safety (Chatfield and Reddick, 2019). Based on studies by Grönroos (2001) and Brady and Cronin (2001), the central idea proposed in this study is that service quality should be regarded as a multidimensional construct, with a hierarchical structure. Hence, this study aims to identify the sources of smart policing service quality and develop an adequate scale to measure it.
Police service quality
Police service quality has enabled the police and public to access, use and feed information through meaningful interaction, offering more personal experiences (Sarrico et al., 2013). However, the robustness of smart government affects police service quality because it offers a holistic capacity that benefits the public now and in the future (Ekaabi et al., 2020). The growth of police service quality is considered inevitable, as an effect of new public management movements and consequent public sector reforms that directly affect quality as perceived by users (Ahmad and Khalid, 2017). To satisfy smart society, effective strategies are needed to highlight and promote the benefits and perceived values of police service quality (Ekaabi et al., 2020; Sarrico et al., 2013). While earlier studies on police service quality have focussed primarily on police service quality and user satisfaction (Bouranta et al., 2015; Chen et al., 2014; Sarrico et al., 2013), it is important to examine police service quality from the smart government perspective, an approach rarely observed in the policing literature.
Sources of smart policing service quality
Previous studies performed on the concept of service quality have identified several quality dimensions. After comprehensively analysing dimensions from sources covering all aspects of smart policing service qualities, the dimensions specified by Grönroos (2001) based on functional quality and outcome quality were adopted as the basis of investigation in this study. Based on Grönroos's model (Grönroos, 2001, 2006), this study describes the features of functional and technical qualities as the primary dimensions of smart policing service quality. Accordingly, both of these primary dimensions were developed further in this study to measure smart policing service quality.
Dimensions of smart policing service quality
Functional quality dimensions have been identified in previous studies focussed on the measurement of users' perceptions of service delivery (Brady and Cronin, 2001; Elnaghi et al., 2018; Rahman et al., 2017; Santos, 2003). In this study, the primary dimensions of functional quality were identified by synthesising the literature studies and evaluating users' perceptions of functional quality (interactivity, responsivity and serviceability) using mobile and electronic platforms. Previous studies have indicated that interactivity was an important service quality factor due to the meaningful interactions between, and reciprocal activities of, police and users through smart-technology-enabled platforms (Ahmad and Khalid, 2017; Elnaghi et al., 2018; Santos, 2003). Grönroos (2006) noted that responsivity involves speed and agility, while Zaithaml et al. (1993) described responsivity as a quick response in fixing issues in an unexpected situation. Similarly, Menezes et al. (2016) grouped several descriptions of responsivity, which included speed and agility as well as helpfulness in solving problems, particularly in unexpected situations. Likewise, Parasuraman et al. (2005) indicated that access, flexibility and ease of navigation were regarded as important serviceability dimensions. Jung et al. (2018) and Karjaluoto et al. (2018) suggested that the usefulness and usability of service content and functions were factors noted by the users.
Technical quality is based on users' perceptions of the outcomes of the service (Brady and Cronin., 2001; Grönroos, 2001). Kankanhalli et al. (2019) suggested two important dimensions in technical quality for smart services: transparency and integrity. Van Ryzin (2011) indicated that transparency and integrity were important elements in the public service processes that rely on outcomes and trust. Similarly, transparency was highlighted as a crucial factor distinguishing between public and commercial services (Jansen and Olnes, 2016; Lee et al., 2019a; Sá et al., 2016). Several other researchers indicated that integrity is the central technical value in the assessment of public-sector service quality (Huberts, 2018; Lee et al., 2019b; Van der Wal et al., 2006; Wu et al., 2018).
Methodology
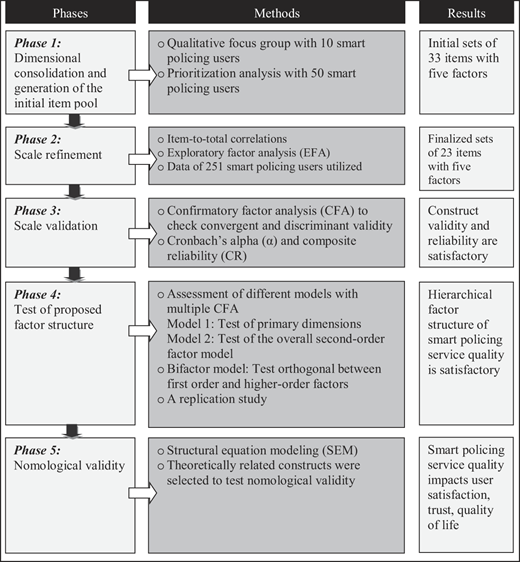
This study explores and measures the constructs of smart policing service quality and validates the items designed to measure these constructs. Validation is crucial to confirming psychometrically robust measurements. Consistent with earlier studies in organisational and information management studies, a sequential exploratory mixed methods design was used in this study (Chen et al., 2017; Dabholkar et al., 1996). Data from the qualitative component of this study were used to validate constructs developed from the literature. The quantitative study was conducted following the qualitative study in order to verify and validate the constructs. The study drew upon 33 items and five factors from literature across marketing, organisational and information-management disciplines. To specify and verify these constructs, the study performed five phases of a scale development process. In phase 1, the qualitative methods of focus group and prioritisation analysis were employed. In phase 2, the quantitative method of exploratory factor analysis (EFA) was employed for scale refinement. In phase 3, the quantitative method of confirmatory factor analysis (CFA) was used for scale validation. In phase 4, CFA and bifactor analysis were utilised to test proposed factor structure. In phase 5, nomological validity was tested in relationships between smart policing service quality and theoretically related constructs. Figure 1 illustrates the overview of the scale development process.
Results
Phase 1: consolidation of dimensions and generation of an initial item pool
A focus group discussion methodology was used to consolidate the dimensions of smart policing service quality. This approach was crucial to understanding users' personal experiences in using smart policing services. Users' responses were examined for additional details of any underlying dimensions. The information derived from the focus group discussion demonstrated that users' perceptions of the pooled items and dimensions of smart policing service quality were consistent with the literature. The results of the focus group discussion highlighted five primary dimensions (transparency, integrity, interactivity, responsivity and serviceability) for smart policing service quality.
In total, 33 candidate items were selected to generate the initial item pool, whereby each construct consisted of three to five measurement items. A preliminary test was conducted to ascertain the content validity of smart policing service quality. Study participants were 50 users of smart policing services who were given the definition of the target construct and asked to rank in order 33 candidate items based on the suitability of the item to the target construct. From this prioritisation analysis, ten items with lower priority rankings were eliminated and 23 items were retained for further analysis.
Phase 2: scale refinement
A randomly distributed questionnaire was employed, whereby users of smart policing services at least once during the past 12 months were surveyed through the online portal of the Ministry of Interior (MOI) at the UAE research centre. A total of 251 participants completed the online survey on scale refinement successfully. All participants were ensured anonymity; the confidentiality of their information was also ensured. The organisation of the survey instrument was based on a seven-point Likert scale shown in Table 1. The demographic profiles of the participants are presented in Table 2.
The survey instrument
| Sections | Subsections | Number of items |
|---|---|---|
| Demographics | Gender | |
| Age | ||
| Education | ||
| Experience using smart policing services | ||
| Smart policing | Integrity | 5 |
| Service quality | Transparency | 3 |
| Interactivity | 5 | |
| Responsivity | 5 | |
| Serviceability | 5 |
Demographic profile of the respondents
| Demographics | Levels | Frequency | Percentage (%) |
|---|---|---|---|
| Gender | Male | 131 | 52 |
| Female | 120 | 48 | |
| Age | 18–35 | 191 | 76 |
| 36–49 | 53 | 21 | |
| 50 and above | 7 | 3 | |
| Education | High school certificate and lower | 123 | 49 |
| Undergraduate | 445 | 46 | |
| Graduate | 13 | 5 | |
| Frequency of use (yearly) | Once | 58 | 23 |
| 2–5 | 93 | 37 | |
| 6–10 | 48 | 19 | |
| 11 and more | 52 | 21 |
The item-total correlations were examined for reliability and scale purification (Anderson and Gerbing, 1988). The Cronbach's alpha (α) value obtained for the dimensions met the threshold level of 0.60 (Nunnally and Bernstein, 1994). The item-total correlations for the 23 measurement items were higher than the conventional value of 0.40 (Field, 2013) and, thus, retained for further analyses.
Next, EFA was performed for each primary dimension of smart policing service quality, in which no evidence of multicollinearity was observed for all of the constructs. Bartlett's test of sphericity confirmed the significance of the relationships among the items at p < 0.000; the Kaiser–Meyer–Olkin (KMO) test for the measurement of sampling adequacy (MSA) was greater than 0.50 for all of the constructs (Hair et al., 2010). Likewise, the eigenvalues and factor loadings obtained in this study met the proposed threshold values (Hair et al., 2010). The EFA was considered satisfactory, as all items congregated under the individual factors. The eigenvalues and the factor loadings were higher than 1 and 0.50, respectively. A summary of results is shown in Table 3. Results indicated that all factor loadings were higher than 0.50, with a total explained variance of more than 60% (Hair et al., 2010). Following these processes, all 23 items within the five dimensions were retained for further testing.
Summary of smart policing service quality scale
| Dimensions | Number of items | Range of loadings | Total explained variance | KMO | Sig |
|---|---|---|---|---|---|
| Integrity | 5 | 0.91–0.94 | 85.93 | 0.89 | 0.000 |
| Transparency | 3 | 0.91–0.93 | 84.26 | 0.75 | 0.000 |
| Interactivity | 5 | 0.89–0.92 | 82.529 | 0.90 | 0.000 |
| Responsivity | 5 | 0.89–0.91 | 80.37 | 0.90 | 0.000 |
| Serviceability | 5 | 0.89–0.92 | 82.42 | 0.91 | 0.000 |
The scale-refinement approach employed in this study provided evidence that this study was consistent with the theoretical perspectives of smart policing service quality (e.g. literature-based analysis) and users' perception of smart policing service quality (e.g. empirical assessment using the survey). Therefore, transparency, integrity, interactivity, responsivity and serviceability were identified as the primary dimensions of smart policing service quality in this study. The smart policing service quality instruments are presented in Table A1.
Smart policing service quality instruments
| Dimension | Code | Item statement |
|---|---|---|
| Integrity | IG1 | performs as promised |
| IG2 | service is reliable | |
| IG3 | service is fulfilled | |
| IG4 | truthful about its offerings | |
| IG5 | provides personal data protection | |
| Transparency | T1 | disclosing the negative testimonials |
| T2 | discloses sufficient information | |
| T3 | provides the contact details of the person in-charge | |
| Interactivity | I1 | adapts to user's needs |
| I2 | access to data and information from any location | |
| I3 | captures real-time evidence | |
| I4 | enables real-time communication | |
| I5 | allows real-time collaboration | |
| Responsivity | R1 | quick completion of transaction |
| R2 | easy to navigate | |
| R3 | well organised | |
| R4 | high performing | |
| R5 | is consistent | |
| Serviceability | S1 | compatible with smart technologies platforms |
| S2 | live chat support | |
| S3 | provides constantly new updates | |
| S4 | do not crash | |
| S5 | secures communications |
Phase 3: scale validation
CFA was performed using AMOS statistical software to assess the measurement model of the 23 items and verify the construct validity and internal reliability of smart policing service quality. The data exhibited a satisfactory fit of the model based on the following parameters:
χ2/df = 2.62;
Comparative Fit Index (CFI) = 0.94;
Tucker–Lewis Index (TLI) = 0.93;
Root Mean Square Error of Approximation (RMSEA) = 0.07; and
Standardised Root Mean Square Residual (SRMR) = 0.03.
The data obtained in this study were compared to the proposed values of less than 5.0 for χ2/df, greater than 0.9 for CFI and TLI and less than 0.08 for RMSEA and SRMR (Bentler, 1990; Byrne, 2010; Forza and Filippini, 1998; Hair et al., 2010; Hu and Bentler, 1999), thus indicating an acceptable model.
All items in this study had factor loadings and average variance extracted (AVE) values of more than 0.5. The AVE values were higher than the values of the construct intercorrelations (Byrne, 2010; Hair et al., 2010), thus supporting adequate discriminant validity. Cronbach's alpha (α) and CR values were greater than 0.70 (Nunnally and Bernstein, 1994), thus supporting construct reliability. The test measurement model also indicated that all five subdimensions were significant at p < 0.001. Thus, the 23 items within the five dimensions analysed in this study serve as an acceptable instrument for measuring smart policing service quality. A summary of results is shown in Table 4.
Construct intercorrelations, means, standard deviations, Cronbach's α, CR, factor loadings and square root of AVE
| Variables | Integrity | Transparency | Interactivity | Responsivity | Serviceability |
|---|---|---|---|---|---|
| Integrity | (0.85) | ||||
| Transparency | 0.61 | (0.87) | |||
| Interactivity | 0.78 | 0.70 | (0.88) | ||
| Responsivity | 0.77 | 0.67 | 0.74 | (0.87) | |
| Serviceability | 0.71 | 0.75 | 0.63 | 0.62 | (0.88) |
| Mean | 5.59 | 5.38 | 5.49 | 5.58 | 5.52 |
| Standard deviation | 1.42 | 1.47 | 1.40 | 1.38 | 1.42 |
| Cronbach's α | 0.91 | 0.87 | 0.88 | 0.86 | 0.88 |
| CR | 0.97 | 0.80 | 0.94 | 0.94 | 0.95 |
| Range of loadings | 0.90–0.93 | 0.87–0.88 | 0.87–0.89 | 0.85–0.89 | 0.86–0.91 |
Note(s): Values on the diagonal are the square root of AVE for each construct
Phase 4: evaluation of the proposed hierarchical factor structure of smart policing service quality
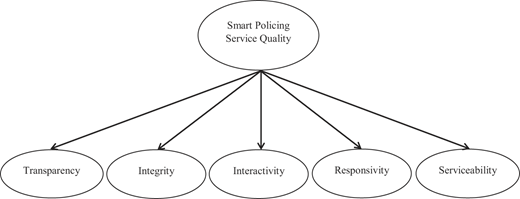
As mentioned previously, the smart policing service quality proposed in this study is based on a hierarchical structure with a multidimensional construct (Figure 2). The conceptualisation of smart policing service quality is regarded as a second-order model. Hence, the method established by Brady and Cronin (2001) to confirm the proposed hierarchical structure of smart policing service quality was employed to test a series of CFAs.
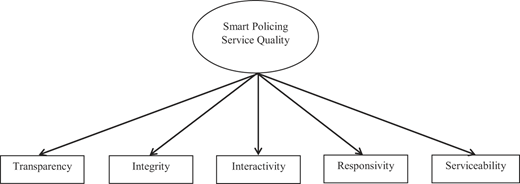
In the first step, transparency, integrity, interactivity, responsivity and serviceability were measured as a first-order model (Figure 3). For this procedure, the subdimensions under each primary dimension were aggregated and averaged. The model indicated a satisfactory fit to the data (χ2/df = 1.96, CFI = 0.98, TLI = 0.98, RMSEA = 0.05 and SRMR = 0.01). This observation suggested that the five primary dimensions proposed in this study were capable of measuring smart policing service quality.
In the second step, the overall hierarchical model was evaluated (Figure 2). The results shown in Table 5 (main study, n = 330) indicated a satisfactory fit of the model to the data (χ2/df = 2.51, CFI = 0.95, TLI = 0.93, RMSEA = 0.06 and SRMR = 0.03). All paths were positively correlated and statistically significant at p < 0.001. The higher-order model exhibited a slightly better fit as compared to the correlational model. The change in CFI was less than 0.01 (ΔCFI = 0.001), thus indicating that no significant differences were observed between the models (Cheung and Rensvold, 2002).
Summary of CFA analyses
| Model assessment | χ2/df | CFI | TLI | RMSEA | SRMR |
|---|---|---|---|---|---|
| Main study (n = 330) | |||||
| Model 1: Test of primary dimensions | 2.12 | 0.97 | 0.96 | 0.05 | 0.02 |
| Model 2: Test of overall model | 1.99 | 0.99 | 0.99 | 0.04 | 0.01 |
| Model 3: Test of bifactor model | 2.21 | 0.96 | 0.95 | 0.06 | 0.03 |
| Validation study (n = 251) | |||||
| Model 1: Test of primary dimensions | 1.96 | 0.98 | 0.98 | 0.05 | 0.01 |
| Model 2: Test of overall model | 2.51 | 0.95 | 0.93 | 0.06 | 0.03 |
| Model 3: Test of bifactor model | 2.82 | 0.94 | 0.92 | 0.07 | 0.03 |
In the third step, the bifactor model was evaluated to measure the loading of each item onto the five respective dimensions as an indicator of the general smart policing service quality factors. The higher-order smart policing service quality and five subdimensions were orthogonal to one another. The bifactor model exhibited a slight decrease in fit as compared to the hierarchical model (χ2/df = 2.82, CFI = 0.94, TLI = 0.92, RMSEA = 0.07 and SRMR = 0.03). However, the change in CFI was less than 0.01 (ΔCFI = 0.00), thus indicating no significant differences observed between the models (Cheung and Rensvold, 2002).
In the fourth step, the comparison between the tested models based on the differences in CFI criterion of 0.01 showed no major differences in the correlational model, higher-order model and bifactor model evaluated in this study (Cheung and Rensvold, 2002). The fit indices indicated that all tested models fit well with the data; the correlational model fit extremely well with the data. Thus, results support the conceptualisation of smart policing service quality.
Finally, for the assessment of robustness and generalisation, the same instrument used in this study was employed to replicate the findings with data from new samples. This replication procedure is important in order to mitigate errors that may arise from the capitalisation of chance (MacCallum et al., 1996). Hence, data collection was replicated based on the main study; a total of 330 new study participants with similar user profiles were selected. The summary results for this validation study are shown in Table 5 (validation study, n = 251). Specifically, the data from the models examining the five primary dimensions and the overall second-order showed a good fit. Thus, the replication study supported the validity of the comprehensive model of smart policing service quality (Figure 2).
As previously indicated by Fuller et al. (2016), this study employed CFA to evaluate any incidences of potential common method bias (CMB). This procedure was also supported by Jordan and Troth (2020), who suggested that CFA was the most sophisticated approach to identify potential CMB. The results indicated an inadequate fit to the data (χ2/df = 6.84, CFI = 0.78, TLI = 0.77, RMSEA = 0.13 and SRMR = 0.10), thus showing no effect on the results of this study.
Phase 5: nomological validity
Structural equation modelling was performed using AMOS to evaluate the nomological validity of the relationship between smart policing service quality and its theoretical constructs (Li and Shang, 2020). Several studies have identified the relationships among police service quality, satisfaction and attitudes (Bouranta et al., 2015; Chen et al., 2014). It was previously suggested that consistent service and qualities of smart policing can lead to a better quality of life, satisfaction, trust and continued intention to use the services (Chatterjee et al., 2018; El-Haddadeh et al., 2019; Kankanhalli et al., 2019; Nowak, 2019). Therefore, it is helpful to describe and predict user perceptions, satisfaction level and trust regarding the smart services offered; in this study, these constructs were assessed based on smart policing service quality. Due to the conceptualisation of smart policing service quality as a hierarchical model, the primary dimensions in this study were first aggregated by averaging the score of items in the primary dimensions scale.
As shown in Table 6, all path coefficients in the nomological model were positively correlated and significant (p < 0.001), thus exhibiting a satisfactory fit to the data (χ2/df = 2.95, CFI = 0.95, TLI = 0.94, RMSEA = 0.06 and SRMR = 0.03). These results demonstrate that smart policing service quality can be used to explain the satisfaction level and trust of users, thus supporting the criterion-based evidence provided by the nomological validation of the smart policing service quality scale. The measurement items of the criterion-based outcomes were adapted from the validated scale using the seven-point Likert scale. A self-rated user approach was adopted based on the measurement of other constructs from previous studies. A five-item scale was adapted from Cronin et al. (2000) and adjusted to measure users' self-reported satisfaction level. Three items pertaining to intention to continue using the service were adapted from Bhattacherjee (2002) to measure continuous intentions to use the smart policing services. Quality of life was assessed based on a four-item construct adapted from Chatterjee et al. (2018), measuring the quality of life in the context of smart government.
Summary results of the nomological test of smart policing service quality
| Structural paths | Path coefficients | t-value | R2 |
|---|---|---|---|
| Smart policing service quality → satisfaction | 0.92*** | 20.44 | 0.85 |
| Smart policing service quality → trust | 0.90*** | 18.87 | 0.81 |
| Smart policing service quality → intention to continue using | 0.85*** | 12.03 | 0.73 |
| Smart policing service quality → quality of life | 0.96*** | 18.07 | 0.92 |
Note(s): ***p < 001
Discussion and conclusion
Theoretical implications
Previous studies in policing have mostly employed the SERVQUAL scale that focusses on users' perceptions of quality and the measurement of quality as a single entity. Other relevant issues in policing, such as integrity and transparency, have received far less attention. This study's outcomes contribute to the research on the measurement of smart policing service quality and form the basis for future studies within this context.
First, this study adds to existing literature by defining policing service quality in the context of smart services. Specifically, smart policing service quality is defined by a group of constitutive elements that may vary in their service quality. The smart policing user perceives and organises policing service quality as a hierarchical structure with a multidimensional construct comprising five dimensions. Second, this study presents a theoretically sufficient and relevant conceptualisation of smart policing service quality with an adequate measurement scale. By providing a scale for measuring policing service quality, this study encourages future studies aimed at understanding and enhancing smart policing service quality. Finally, the results obtained in this study may also pave the way for academicians to investigate methods of improving policing service quality within the context of smart services. The expanding role of smart devices will likely lead to the improvement of policing service quality. This study will also assist researchers studying smart policing service quality and its correlation with the general views on smart government service quality.
Managerial implications
First, defining smart policing service quality allows the manager or the police officer supervisors to understand comprehensively and systematically the factors comprising policing service quality within the context of smart services. This understanding will prevent mistakes in managing service quality in policing activities. Additionally, the study's smart policing service quality scale can be employed to assess other domains of the smart government system, such as healthcare, energy and utilities. The dimensions of the scale developed in this study may also help managers evaluate other service quality dimensions present in smart services.
Various smart government domains and relevant organisations may also utilise smart policing service quality as an indicator of performance, measuring the overall improvement of smart government services. The hope is that the hierarchical structure and smart policing service quality scale proposed in this study will be used as diagnostic tools to help government organisations identify both smart services areas where use of the tools is feasible and areas needing improvement. Managers can adapt the scale to measure and manage smart services according to the specific needs of the respective domains. Finally, by utilising the smart policing service quality scale, sources of smart services and design management strategies can be identified to address the security and sustainability issues that persist in smart services. Managers will be able to implement efficient strategies to improve the perception of smart services quality based on objective measurements.
Limitations and future directions
One of the study limitations is the inclusiveness of the dimensions analysed in this study, as the smart policing service quality dimensions were identified through a focus group discussion. Not all of the service quality dimensions mentioned in extant literature were included in this study, as some dimensions were not found to be relevant and were subjected to the interoperability of the smart services. Participants may also have had limited experience using these smart services; their responses may have excluded certain dimensions that would have been meaningful to smart policing service quality. Future studies could incorporate these possible dimensions to advance the understanding of smart policing service quality.
The second limitation is the scope of the study, as only general issues of policing service quality were considered. Hence, specific issues in policing, such as crime mitigation and traffic services, were not addressed specifically. Future research studies should consider adopting the scales developed in this study to measure other policing services that are crucial to enhancing general policing service quality. Lastly, while the use of residents may seem appropriate for this study, future studies are recommended that consider the specific characteristics of the sample (e.g. expatriates, citizens, geographical locations) to provide evidence that supports the generalisation of this study's findings. Future studies incorporating samples from different geographical locations and with varying income per capita status should be considered to provide more insight about smart policing service quality.

