


We investigate the impact of climate transition risk on the European financial system, evaluating the expected capital shortfall of the major European banks in a climate stress scenario. Following the methodology proposed by Jung et al. [(2021). “Climate stress testing”. FRB of New York Staff Report. (977).], we measure the dynamic transition risk betas and compare them to the non financial corporate loans exposure, obtained from EBA, of each bank towards the energy sector. Furthermore, we estimate the dynamic risk premium associated with the selected climate transition risk factor in order to explain and eventually exploit stock market anomalies. Finally we estimate the countries’ exposures and we find that at the end of 2022, aggregated European CRISK can be quantified in about EUR 165 bn. As far as the climate premium is concerned, we find evidence of a dynamic climate risk premium negatively correlated to transition risk exposure.
1 Introduction
Nowadays, climate change plays a key role in daily debates since it represents a relevant issue for many aspects of our society. From a financial perspective, climate change is expected to have broad-ranging implications, since risks arising from it represent a material concern for the banking system.
Financial supervisors have identified two main sources of climate risks: transition risk and physical risk (Gourdel et al., 2022). The former risk results from policy actions taken to transition to a low-carbon economy, the latter results from the possible damages caused by catastrophic climatic events.
In recent years, the finance literature has made substantial progress in understanding the effects of climate change. Among others, Giglio et al. (2021) provide a brilliant and extensive review on the emerging literature regarding climate finance. Given the recent rise in investors’ and institutions’ attention to climate risk, many researchers have focused on investigating how climate change is priced in asset markets. Like all the other risks, asset markets may experience winners and losers depending on their positive or negative exposure to different types of climate risks, including physical and transition risk. For instance, it is likely that renewable energy companies would benefit while coal companies would suffer from the realization of transition risk. In this context, obtaining measures of asset exposures to both physical and transition risks is a critical challenge for all approaches that seek to explore how climate risk impact asset markets. Many studies suggest that climate risk is, in fact, priced in the equity market. For example, based on the analysis of the US equity market, Bolton and Kacperczyk (2021) find that firms with high carbon emissions are priced at discount with respect to the others. Engle et al. (2020) find that stocks of firms with high environmental scores, present higher returns during periods with negative news about the future path of climate change. Among others, Chava (2014) and Ginglinger and Moreau (2019) examine the effects of climate change on banks’ loan pricing. In particular,Chava (2014) find that firms with environmental concerns such as hazardous chemical, substantial emissions and climate change concerns, have lower institutional ownership and fewer banks participate in their loan syndicate than firms without such environmental concerns. These results suggest that exclusionary socially responsible investing and environmentally sensitive lending, and the consequent increase in the cost of equity and debt capital, have the potential to prompt firms to internalize their environmental externalities.
Given the importance of climate change as a risk factor determining asset pricing, some researchers have investigated how investors can mitigate the risks that climate change poses to their portfolio. For example, Engle et al. (2020) propose an approach to hedge climate risk combining traditional dynamic trading arguments from financial theory with novel statistical measurements using text analysis. More recently, similar statistical tools have been implemented by Bua et al. (2022).
In the growing body of literature on climate risk and regulation matters, physical risk is still playing a secondary role in empirical literature. An attempt to consider both sources of risks is in Batten et al. (2016), who focus on understanding the impact both of physical and transition risk on asset prices, examining the channels via which climate risk and mitigation policies could affect a central bank’s ability to meet its monetary and financial stability objectives. More recently, Acharya et al. (2022) exploit regional differences in exposure to heat stress in order to study whether physical climate risk is priced in municipal and corporate bonds as well as in equity markets.
Our analysis focuses on the systemic impact of transition risk, more prominent and potentially more impactful from a financial perspective.1 Transition risk refers to the financial risks that arise from the transition to a low-carbon economy as efforts to mitigate climate change accelerate and governments and businesses implement policies to reduce greenhouse gas emissions. The transition to a low-carbon economy will require significant changes in energy systems, transportation, and other sectors, as well as shifts in consumer behaviour and social attitudes. These changes can create significant financial risks for companies and investors, including banks.
One of the keyways in which transition risk can impact banks is either through their lending or their investment portfolios. Banks that have significant exposure to, or investments in, carbon-intensive industries, such as coal mining, oil and gas exploration, and heavy manufacturing, may face risks related to stranded assets.2 Potentially, banks with large exposure to these industries face an increased risk of loan defaults and credit losses, which can negatively impact their financial performance.
Moreover, transition risk can impact banks through regulatory measures: as governments and international organizations implement policies to reduce greenhouse gas emissions and mitigate climate change, banks may face new regulatory requirements, such as carbon taxes, cap-and-trade systems, and other policies aimed at reducing greenhouse gas emissions. Banks that are not prepared for these regulatory changes may face penalties, legal action, and reputational damages if perceived as supporting the industries that contribute to climate deterioration.
Concerns about climate risk have been increasingly raised also among government institutions. Recently, the European Central Bank (“ECB”) has carried out a climate stress test among the significant institutions as its annual stress test. The exercise revealed that “ banks made considerable progress with respect to their climate stress-testing capabilities. At the same time, the exercise revealed many deficiencies, data gaps and inconsistencies across institutions”.3 The quantification of the sensitivity and the impacts of climate risk are becoming more and more relevant to companies and investors as governments and international organizations implement policies to mitigate climate change.
This paper contributes to investigate the impact of climate transition risk on the European financial system at country level. We estimate the expected capital shortfalls, the CRISK proposed by Jung et al. (2021), of the major European financial institutions in a climate stress scenario, and aggregate them at country level in order to get a clear picture of the European exposure to climate risk. A transition stress scenario is a hypothetical situation in which there is a sudden shift in market conditions, caused by factors such as policy changes, technological breakthroughs, or climate-related events, that result in a significant repricing of carbon-intensive assets and a rapid decline in the value of these assets. In our study, in line with main literature, the stress scenario involves a severe decline in the climate stranded asset factor (equal to -50%). In such a scenario, banks that have relevant exposures to carbon-intensive industries may face significant losses as the value of these assets declines rapidly. If these losses are large enough, this could result in a capital shortfall, where the bank’s capital levels fall below regulatory requirements or below the level needed to maintain investor confidence. A capital shortfall in a transition stress scenario could have significant consequences for the affected bank. In some cases, the bank may be forced to take actions to raise additional capital, such as issuing new shares or selling assets. In extreme cases, the bank may be at risk of insolvency or may require a government bailout.
CRISK methodology offers a number of benefits. First, it does not require any private information and can be easily computed using publicly available data on the balance sheet and market information of each financial institution and the return on stranded asset portfolio, making the methodology widely applicable and relatively inexpensive to implement (Brownlees and Engle, 2017). Moreover, it is easily extendible, and it allows to include risk factor categories previously not considered, providing a good starting point for the extension to the physical risk analysis.
In our analysis we exploit the dynamic conditional beta (“DCB”) model to estimate the dynamic exposure to the climate transition risk and the CRISK of 35 European banks, with an aggregate market capitalization approximately equal to EUR 608 bn by the end of December 2022. Considering that total market capitalization of components of STOXX Europe 600 Banks Index was about 875 bn EUR by the end of 2022, the sample in use offers an extensive coverage of the European banking sector in terms of market capitalization. Banks have been chosen among those that made disclosure of assets breakdown during the risk assessment carried out by EBA.4 Since the selected banks also offers an extensive coverage in terms of geography (15 countries), this allows us to aggregate the CRISK figures at country level, once we have estimated the dynamic transition risk betas. Moreover, computed betas are compared to the non financial corporate (“NFC”) loan exposure towards the energy sector of each bank obtained from EBA, finding a quarterly positive correlation with the exception of June 2022, when the correlation becomes negative. This may suggest a general change of managing transition risk. Finally, we estimate the risk premium associated with climate transition risk factor in order to explain and eventually exploit stock market anomalies.
2 Methodology
The climate stress testing procedure elaborated by Jung et al. (2021), involves three steps.
Step 1: Identification of the climate transition risk factor
The first step is to measure the climate transition risk factor, by using an appropriate proxy. The canonical approach to represent a candidate risk factor, first posited by Jensen et al. (1972) and popularised by Fama and French (1993), involves identifying tradeable assets with high and low exposures to a characteristic and then forming value-weighted long-short portfolio (Gostlow, 2021). The advantage of such portfolios is that they measure the extra return (positive or negative) respect to a given benchmark, isolating the impact of specific risk factors from all the other ones.
Step 2: Climate betas estimation
The second step is to estimate the climate betas of financial institutions.
Following SRISK methodology proposed by Brownlees and Engle (2017) and Jung et al. (2021), the dynamic betas are obtained via the GJR-GARCH DCC model (Engle, 2000). Let consider C countries and denote ric,t the centered return of bank i bank in country c at time t with c ∈ {1,..., C}. We assume that conditional on the information set ξt-1 available at time t − 1, the return 3-tuple has a multivariate normal distribution with zero mean and time varying covariance, where ri,t is computed as the centered difference of logarithmic daily closing prices of stocks (in Euros) at time t. Similarly rm,t and rCTFactor,t are the market and transition risk returns at time t.
where ri,t is computed as the centered difference of logarithmic daily closing prices of stocks (in Euros) at time t. Similarly rm,t and rCTFactor,t are the market and transition risk returns at time t. The GJR-GARCH equation for the univariate stock conditional variance is:
with . Similar equations for the market and CTFactor hold.
Let Ric,t be the correlation matrix at time t for bank ic among the the volatility adjusted returns obtained as follows:
where Qic,t is the so-called pseudo covariance matrix of the standardized residuals for bank ic. The DCC model then specifies the evolution of the pseudo-covariance matrix Qic,t,t as:
where Sic is the unconditional covariance matrix of the standardized residuals of bank ic, the market and the CTFactor. Finally, the conditional covariance matrix for bank ic’s returns is computed as:
Given the linearity assumption of banks’ stock returns with respect to market and CTFactor returns, dynamic climate and market betas are estimated via the dynamic conditional covariance matrix Ht rewriting the joint distribution in (1) as
where is a partitioned matrix of Ht such as:
Hx,t is the conditional covariance matrix of market and CTFactor returns at time t ;
Hxy,t and Hyx,t are the vectors of conditional covariance of market and CTFactor with respect to bank i’s return at time t (of compatible dimensions);
Hy,t is the conditional variance of bank i’s return at time t.
Finally, estimates of the time-varying coefficients inferred from the regression of banks’ returns with respect to market and CTFactor can be retrieved from Ht as follows (Aloy et al., 2021):
Step 3: Country CRISK estimation
Finally, given an estimate of climate betas, it is possible to quantify the impact of climate risk in a stress scenario computing the CRISK for each bank as a function of a given bank’s size, leverage, and expected equity loss conditional on climate stress.
As already specified, climate capital at risk is a measure of the potential financial losses that companies and investors may face due to risks associated with climate change. More specifically, it represents the fraction of capital reserves a financial institute needs to hold (because of regulation and/or prudential management) after netting off the bank’s equity. When the capital shortfall is negative, it means that the bank has a capital surplus. In contrast, when this quantity is positive, the bank experiences distress (Brownlees and Engle, 2017). Following metholodgy of Jung et al. (2021), CRISK for each European bank is computed as follows:
where:
k is the prudential capital fraction, set to 5.5%, based on main literature;
EQUITYic,t is current equity market value;
DEBTic,t is outstanding measure of total liabilities netted of banks’ deposits. As a matter of fact, between 2013 and 2022 banks’ deposit costs have been almost close to zero, and in some case we have evidence that actually the bank was charging customers to maintain a deposit bank account, because of negative interest rates brought by super accommodating monetary policy. On the main assumption that debt is a costly liability, we netted it of deposits to come to the real banks’ level of indebtedness.
LRMESic,t is the long run marginal expected shortfall in a climate crisis. Following previous studies5, we define a climate crisis as occurring when the stranded asset portfolio falls by more than the crisis threshold in a six month period. Specifically, it is calculated as:
with θ (crisis threshold for risk factor decline) set to be 50%.
It is quite trivial remarking that dynamic and magnitude of CRISK is influenced not only by climate betas, but also by bank’s market capitalization and leverage. Yet, a negative climate beta is not sufficient per se to have a capital surplus (opposite to shortfall) in case of crisis, due to non linearity of climate risk transmission to capital. Moreover, CRISK presents several benefits with respect to other risk measures. In particular, differently from beta, it is a monetary measure (i.e., it is quantified in EUR or in any other currency), and this makes it easily comparable across time and countries, without forgetting banks’ size. For this reason, it is not rare to find banks with high exposure to climate risk with a very limited impact on a systemic basis or, conversely, banks with low sensitivity to climate risk and an overall relevant impact.
Then, for each bank ic of the c country, we compute annual CRISK (as of CRISK at the end of December of each year between 2019 and 2022) and which can be decomposed into three components.6
where
this is the contribution to CRISK of the bank i’s debt. As a bank assumes more liabilities, the contribution to CRISK will be positive. Since this data is reported no more frequently than on a quarterly basis, month-to month values can show no change in ΔDEBTi,t;
this measure shows how changes in a firm’s equity position affects CRISK. A decline in the market capitalization of a company will increase CRISK, conversely, an increase in equity value will decrease CRISK.
an increase in the risk attributes of a firm, such as the correlation or volatility, also contributes to CRISK. In this case, the source of external risk taken into account is related to climate.
We analyse CRISK aggregated at a country/region level. The aggregate CRISK of country c at time t can be interpreted as the amount of capital injection needed for the country in a climate stress test scenario. The total amount of
systemic climate risk at country level is measured as:
where t represents a specific date and n is the total number of banks analysed in country c. Only positive CRISK have been considered, since it is unlikely that eventual capital surpluses can reduce the overall systemic risk in a stress test scenario.
Finally, aggregating the contribution to leverage, equity and climate risk of each bank in country c, such as:
where n is the number of banks in country c, we formally derive a measure of country-level annual sensitivity of systemic CRISK to its component.
3 Data
Stock prices and accounting data of banks are sourced from Bloomberg and additional data on the exposure towards the energy sector are sourced from EBA website.
From an initial sample of 57 banks, we have excluded private banks and banks with stocks listed after January 1, 2013. Also, we have excluded banks that have shown loose correlation7 with respect to European stock market (Greece and Cyprus). All data are in Euros and stock prices have been adjusted for stock splits. The final sample is composed by 35 European banks, with an aggregated market capitalization of EUR 608 bn on December 30, 2022 (Table 1). Banks have their registered office in 15 European countries. We consider about 6,000 daily observations from January 3, 2000 to December 2022 for the stock price series. Descriptive statistics of centered bank stock returns about daily stock returns are referred to the period January 2, 2000, to December 31, 2022. When more than one class of shares is listed, class-A shares have been chosen. When number of observations is less than 5,999, this means that the bank is listed on stock market in more recent date than January 2, 2000. No bank has been selected if listed after January 1, 2013. We report in brackets the number of banks for each country: Italy (7), Spain (5), France (3), Germany (3), Norway (3), Sweden (2), Denmark (2), Austria (2), Poland (2), Netherlands (1), Finland (1), Belgium (1), Ireland (1), Hungary (1), Portugal (1).
Abstract and keyword occurrence, and geographical distribution of unique economics and finance publications (as ranked by WoS).
| # | Bank | Bloomberg Ticker | Acronym | Country | Mkt Cap at Dec, 30th, 2022 (ebn) | Min | Max | Mean | St. Dev. | Skewness | Kurtosis | Count |
|---|---|---|---|---|---|---|---|---|---|---|---|---|
| 1 | BNP PARIBAS | BNP FP EQUITY | BNP | FRANCE | 65,7 | -0,19 | 0,19 | 0,00 | 0,02 | 0,07 | 8,78 | 5999 |
| 2 | BANCO SANTANDER SA | SAN SM EQUITY | SAN | SPAIN | 47,1 | -0,22 | 0,21 | 0,00 | 0,02 | -0,09 | 7,76 | 5999 |
| 3 | ING GROEP NV | INGA NA EQUITY | INGA | NETHERLANDS | 42,4 | -0,32 | 0,26 | 0,00 | 0,03 | -0,10 | 14,02 | 5999 |
| 4 | INTESA SANPAOLO | ISP IM EQUITY | ISP | ITALY | 39,5 | -0,26 | 0,18 | 0,00 | 0,02 | -0,39 | 8,22 | 5999 |
| 5 | NORDEA BANK ABP | NDA SS EQUITY | NDA | FINLAND | 36,6 | -0,15 | 0,18 | 0,00 | 0,02 | 0,09 | 6,45 | 5999 |
| 6 | BANCO BILBAO VIZCAYA ARGENTA | BBVA SM EQUITY | BBVA | SPAIN | 34,0 | -0,18 | 0,20 | 0,00 | 0,02 | 0,08 | 6,39 | 5999 |
| 7 | CREDIT AGRICOLE SA | ACA FP EQUITY | ACA | FRANCE | 29,9 | -0,18 | 0,23 | 0,00 | 0,02 | 0,04 | 7,60 | 5491 |
| 8 | CAIXABANK SA | CABK SM EQUITY | CABK | SPAIN | 29,6 | -0,20 | 0,16 | 0,00 | 0,02 | -0,14 | 6,01 | 3972 |
| 9 | DNB BANK ASA | DNB NO EQUITY | DNB | NORWAY | 28,7 | -0,21 | 0,21 | 0,00 | 0,02 | -0,24 | 10,24 | 5999 |
| 10 | UNICREDIT SPA | UCG IM EQUITY | UCG | ITALY | 25,7 | -0,27 | 0,19 | 0,00 | 0,03 | -0,24 | 7,93 | 5999 |
| 11 | KBC GROUP NV | KBC BB EQUITY | KBC | BELGIUM | 25,1 | -0,29 | 0,40 | 0,00 | 0,03 | -0,16 | 21,30 | 5999 |
| # | Bank | Bloomberg Ticker | Acronym | Country | Mkt Cap at Dec, 30th, 2022 (ebn) | Min | Max | Mean | St. Dev. | Skewness | Kurtosis | Count |
|---|---|---|---|---|---|---|---|---|---|---|---|---|
| 12 | SKANDINAVISKA ENSKILDA BAN-A | SEBA SS EQUITY | SEBA | SWEDEN | 23,4 | -0,24 | 0,25 | 0,00 | 0,02 | -0,04 | 12,02 | 5999 |
| 13 | DEUTSCHE BANK AG-REGISTERED | DBK GY EQUITY | DBK | GERMANY | 21,9 | -0,20 | 0,21 | 0,00 | 0,03 | -0,05 | 7,07 | 5999 |
| 14 | SOCIETE GENERALE SA | GLE FP EQUITY | GLE | FRANCE | 20,0 | -0,23 | 0,21 | 0,00 | 0,03 | -0,23 | 7,84 | 5999 |
| 15 | SWEDBANK AB - A SHARES | SWEDA SS EQUITY | SWEDA | SWEDEN | 18,0 | -0,21 | 0,20 | 0,00 | 0,02 | -0,43 | 10,10 | 5999 |
| 16 | DANSKE BANK A/S | DANSKE DC EQUITY | DANSKE | DENMARK | 15,9 | -0,17 | 0,14 | 0,00 | 0,02 | -0,14 | 5,75 | 5999 |
| 17 | ERSTE GROUP BANK AG | EBS AV EQUITY | EBS | AUSTRIA | 12,9 | -0,20 | 0,17 | 0,00 | 0,02 | -0,28 | 7,83 | 5999 |
| 18 | COMMERZBANK AG | CBK GY EQUITY | CBK | GERMANY | 11,1 | -0,27 | 0,20 | 0,00 | 0,03 | -0,21 | 7,50 | 5999 |
| 19 | BANK OF IRELAND GROUP PLC | BIRG ID EQUITY | BIRG | IRELAND | 9,5 | -0,79 | 0,39 | 0,00 | 0,04 | -1,22 | 43,55 | 5999 |
| 20 | PKO BANK POLSKI SA | PKO PW EQUITY | PKO | POLAND | 8,1 | -0,21 | 0,17 | 0,00 | 0,02 | -0,14 | 5,69 | 4733 |
| 21 | MEDIOBANCA SPA | MB IM EQUITY | MB | ITALY | 7,6 | -0,24 | 0,15 | 0,00 | 0,02 | -0,47 | 8,65 | 5999 |
| 22 | OTP BANK PLC | OTP HB EQUITY | OTP | HUNGARY | 7,1 | -0,26 | 0,23 | 0,00 | 0,03 | -0,45 | 9,25 | 5999 |
| # | Bank | Bloomberg Ticker | Acronym | Country | Mkt Cap at Dec, 30th, 2022 (ebn) | Min | Max | Mean | St. Dev. | Skewness | Kurtosis | Count |
|---|---|---|---|---|---|---|---|---|---|---|---|---|
| 23 | BANCA MEDIOLANUM SPA | BMED IM EQUITY | BMED | ITALY | 5,8 | -0,16 | 0,15 | 0,00 | 0,02 | -0,02 | 3,50 | 5999 |
| 24 | BANKINTER SA | BKT SM EQUITY | BKT | SPAIN | 5,6 | -0,17 | 0,18 | 0,00 | 0,02 | 0,26 | 5,16 | 5999 |
| 25 | BANCO BPM SPA | BAMI IM EQUITY | BAMI | ITALY | 5,1 | -0,27 | 0,17 | 0,00 | 0,03 | -0,17 | 4,33 | 4044 |
| 26 | RAIFFEISEN BANK INTERNATIONA | RBI AV EQUITY | RBI | AUSTRIA | 5,0 | -0,28 | 0,24 | 0,00 | 0,03 | -0,31 | 9,24 | 4615 |
| 27 | BANCO DE SABADELL SA | SAB SM EQUITY | SAB | SPAIN | 5,0 | -0,21 | 0,22 | 0,00 | 0,02 | 0,03 | 10,87 | 5662 |
| 28 | BANK PEKAO SA | PEO PW EQUITY | PEO | POLAND | 4,9 | -0,23 | 0,17 | 0,00 | 0,02 | -0,36 | 6,79 | 5999 |
| 29 | JYSKE BANK-REG | JYSK DC EQUITY | JYSK | DENMARK | 3,9 | -0,13 | 0,16 | 0,00 | 0,02 | 0,04 | 6,15 | 5999 |
| 30 | SPAREBANK 1 SR BANK ASA | SRBNK NO EQUITY | SRBNK | NORWAY | 2,9 | -0,24 | 0,17 | 0,00 | 0,02 | -0,47 | 13,81 | 5999 |
| 31 | BPER BANCA | ??? IM EQUITY | BPE | ITALY | 2,7 | -0,28 | 0,20 | 0,00 | 0,02 | -0,06 | 9,88 | 5999 |
| 32 | BANCO COMERCIAL PORTUGUES-R | BCP PL EQUITY | BCP | PORTUGAL | 2,2 | -0,17 | 0,24 | 0,00 | 0,03 | 0,18 | 6,70 | 5999 |
| 33 | AAREAL BANK AG | ARL GY EQUITY | ARL | GERMANY | 2,0 | -0,55 | 0,31 | 0,00 | 0,03 | -1,45 | 40,80 | 5359 |
| 34 | BANCA POPOLARE DI SONDRIO | BPSO IM EQUITY | BPSO | ITALY | 1,7 | -0,21 | 0,13 | 0,00 | 0,02 | 0,03 | 8,79 | 5999 |
| 35 | SPAREBANK 1 SMN | MING NO EQUITY | MING | NORWAY | 1,6 | -0,17 | 0,12 | 0,00 | 0,02 | -0,47 | 7,81 | 5999 |
Whilst the returns are comparable in terms of volatility, we observe a general high kurtosis with some relevant spikes for Belgian, German and Irish banks.
Since we use a GARCH family’s process to model variance in banks’ stock price returns, data have been previously tested in distribution and stationarity. Jarque-Bera test rejects the hypothesis of normally distributed observed time series at the 5% significance level. All bank stocks’ returns are asymmetrically (left) distributed with kurtosis greater than the ones of normally distributed time series. At the 5% significance level, Ljung-Box Q-statistics reject the null hypothesis of no serial correlation in stock squared returns through 20 lags for all financial institutions’ stocks. We have also tested for the presence of the ARCH effect. The null hypothesis of no ARCH effect is always rejected at 1% significance level. This suggests that GARCH parametrization might be appropriate for the conditional variance process.
One might suppose that daily returns are too noisy and subject to well-known nonsynchronous trading biases even for a sample of large stock capitalization banks. To address this point, we have repetead all the analysis by using weekly data, in order to balance the need to have less noisy estimated returns with a time interval that should better reflect the speed that characterizes the arrival of information in capital markets. Main findings are generally confirmed, since weekly analysis does not lead to sizeable differences in betas’ estimation with respect to daily analysis. However, despite daily stock returns exhibit more prononuced departures from normality and fatter tails than those of weekly data, the ARCH effect is not always confirmed on a weekly basis, reducing partially the capacity of the model to get a reasonable estimation of the dynamic conditional correlation. This point in particular makes us lean toward the use of daily instead of weekly data.
The availability of sample banks accounting data starts from March 2009, and this narrows the CRISK analysis of the 35 European banks from March 2009 to December 2022.8
Finally data relative to loans for quarters ending in September 2021, December 2021, March 2022, June 2022 are freely available on EBA website9. Table 2 shows the total amount of non-financial corporate loans (“NFC loans”) and the NFC loans towards energy sector of each bank for the four quarters aforementioned.
Figure 1 depicts the quarterly exposure of each institution towards energy sector (both absolute and relative value with respect to total NFC loans).
Total NFC loans and NFC loans towards energy sector of each bank for September and December 2021, March and June 2022.
| # | Bank | ESLoan2109 | ESLoan2112 | ESLoan2203 | ESLoan2206 | Loan2109 | Loan2112 | Loan2203 | Loan2206 |
|---|---|---|---|---|---|---|---|---|---|
| 1 | CREDIT AGRICOLE SA | 18,1 | 20,4 | 23,8 | 24,9 | 400,4 | 413,7 | 425,9 | 439,1 |
| 2 | BNP PARIBAS | 26,4 | 21,7 | 27,4 | 23,4 | 427,1 | 417,6 | 423,8 | 440,6 |
| 3 | SOCIETE GENERALE SA | 12,9 | 16,7 | 17,9 | 18,4 | 210,8 | 232,8 | 234,2 | 238,6 |
| 4 | BANCO SANTANDER SA | 14,0 | 14,7 | 14,7 | 15,3 | 315,0 | 318,8 | 329,0 | 337,8 |
| 5 | BANCO BILBAO IZCAYA ARGENTA | 13,1 | 13,7 | 14,8 | 15,3 | 144,8 | 147,2 | 157,3 | 164,6 |
| 6 | ING GROEP NV | 14,9 | 16,7 | 16,5 | 15,3 | 222,5 | 231,8 | 231,1 | 237,8 |
| 7 | UNICREDIT SPA | 9,6 | 11,6 | 12,1 | 13,1 | 245,2 | 238,2 | 242,0 | 252,8 |
| 8 | INTESA SANPAOLO | 10,0 | 11,6 | 12,1 | 12,8 | 220,8 | 225,0 | 223,0 | 224,8 |
| 9 | CAIXABANK SA | 10,6 | 10,8 | 11,0 | 11,9 | 138,2 | 140,8 | 141,8 | 145,4 |
| 10 | COMMERZBANK AG | 8,6 | 9,1 | 8,9 | 8,5 | 92,4 | 95,4 | 97,2 | 98,2 |
| 11 | DEUTSCHE BANK AG-REGISTERED | 5,0 | 5,3 | 5,9 | 5,7 | 89,8 | 92,3 | 98,7 | 98,9 |
| 12 | NORDEA BANK ABP | 4,3 | 4,7 | 4,6 | 5,0 | 186,7 | 197,0 | 206,1 | 208,8 |
| 13 | DNB BANK ASA | 4,1 | 5,6 | 5,0 | 4,8 | 122,5 | 126,8 | 130,3 | 131,2 |
| 14 | BANCO DE SABADELL SA | n.a. | n.a. | n.a. | 4,7 | n.a. | n.a. | n.a. | 78,5 |
| 15 | DANSKE BANK A/S | 4,2 | 4,4 | 4,2 | 4,4 | 57,3 | 57,6 | 57,4 | 58,7 |
| 16 | ERSTE GROUP BANK AG | 4,0 | 7,1 | 6,8 | 4,3 | 101,7 | 107,4 | 109,4 | 108,1 |
| 17 | KBC GROUP NV | 2,5 | 2,7 | 3,2 | 3,4 | 80,4 | 82,6 | 85,2 | 88,9 |
| 18 | SWEDBANK AB - A SHARES | 2,5 | 2,6 | 2,8 | 2,8 | 69,1 | 71,2 | 73,2 | 75,5 |
| 19 | RAIFFEISEN BANK INTERNATIONA | 1,4 | 1,7 | 1,7 | 1,7 | 53,2 | 52,9 | 56,2 | 56,1 |
| 20 | BANCO BPM SPA | 1,5 | 1,6 | 1,7 | 1,7 | 50,8 | 51,6 | 52,6 | 53,8 |
| 21 | BANKINTER SA | 1,2 | 1,3 | 1,4 | 1,6 | 62,9 | 62,3 | 63,5 | 64,2 |
| 22 | OTP BANK PLC | 1,1 | 1,3 | 1,2 | 1,2 | 28,5 | 29,5 | 29,8 | 31,0 |
| 23 | MEDIOBANCA SPA | 0,7 | 1,0 | 1,2 | 1,2 | 18,1 | 19,1 | 19,9 | 21,0 |
| 24 | BPER BANCA | 0,8 | 1,2 | 1,5 | 1,2 | 17,3 | 19,2 | 18,8 | 19,1 |
| 25 | JYSKE BANK-REG | 0,8 | 1,1 | 1,0 | 1,0 | 38,2 | 40,8 | 40,5 | 46,1 |
| 26 | PKO BANK POLSKI SA | 0,7 | 1,0 | 0,9 | 0,9 | 29,5 | 30,3 | 30,8 | 30,8 |
| 27 | BANK PEKAO SA | 0,5 | 0,8 | 0,8 | 0,8 | 15,0 | 15,7 | 16,6 | 16,8 |
| 28 | BANCA POPOLARE DI SONDRIO | 0,3 | 0,6 | 0,5 | 0,7 | 14,5 | 15,3 | 15,7 | 16,2 |
| 29 | BANK OF IRELAND GROUP PLC | 0,5 | 0,6 | 0,5 | 0,5 | 17,0 | 17,3 | 17,0 | 18,5 |
| 30 | BANCO COMERCIAL PORTUGUES-R | 0,4 | 0,3 | 0,3 | 0,3 | 28,2 | 28,4 | 28,7 | 28,9 |
| 31 | BANCA MEDIOLANUM SPA | 0,2 | 0,2 | 0,2 | 0,3 | 20,3 | 19,9 | 20,1 | 20,0 |
| 32 | AAREAL BANK AG | n.a. | n.a. | n.a. | 0,1 | n.a. | n.a. | n.a. | 8,7 |
| 33 | SPAREBANK 1 SR BANK ASA | n.a. | n.a. | n.a. | 0,0 | n.a. | n.a. | n.a. | 5,8 |
| 34 | SPAREBANK 1 SMN | 0,0 | 0,0 | 0,0 | 0,0 | 0,5 | 0,6 | 0,6 | 0,6 |
| 35 | SKANDINAVISKA ENSKILDA BAN-A | 0,0 | 0,0 | 0,0 | 0,0 | 27,8 | 28,3 | 29,0 | 29,4 |
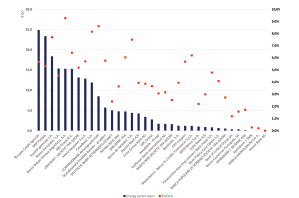
Energy sector loans in bn Euros (LHS) and % of Energy sector loans over carrying amount of total NFC loans (RHS).
Energy sector loans in bn Euros (LHS) and % of Energy sector loans over carrying amount of total NFC loans (RHS).
4 Results for European Banks' CRISK
In this section we report the results obtained applying the methodology described in Section 2.
4.1 Climate Transition Factor Measurement
As the economy has to transition away from fossil fuels, there is a concrete risk that fossil fuel companies get into payment difficulties and that fossil fuel assets become stranded. It is therefore likely that a long position in brown companies, that are penalized by transition regulation, would be characterized by negative extra returns respect to market returns. Following Jung et al. (2021), the selected stranded asset portfolio consists of a long position in the stranded asset index comprised of 30% in Energy Select Sector SPDR ETF (XLE) and 70% in VanEck Vectors Coal ETF (KOL), and a short position in the markey index. Since the focus of the analysis is on European countries we
consider the MSCI Europe index10 (MSCI) as a proxy for European stock market returns. This portfolio acts as a proxy for the World Wildlife Fund stranded asset return swap.11 We directly used it as the climate transition factor (CTFactor):
Since VanEck Vectors Coal ETF started in early 2008 and was liquidated during 2020, from January 3, 2000 to January 11, 2008 and from December 15, 2020 to December 31, 2022, CTFactor is computed as:
Main statistics about the European stock market and the climate transition risk factor are report in Table 3.12
After 2020, increase in cumulative transition risk-tilted portfolio return is consistent with a significant rise in energy (electricity and gas) prices. Anyway, under the 2015 Paris agreement, 196 countries pledged to limit global warming to well below 2.0C, and ideally not more than 1.5C above preindustrial levels. That target, if pursued, would manifest in decarbonization across industries, creating major shifts in commodity demand for the energy and mining industries and likely resulting in declining global revenue pools.
If regulatory interventions will be implemented to shift into less carbonintensive economy (to meet the Paris agreement goal), it is likely that CTFactor cumulative return will project its trajectory well below the MSCI Europe index in a short-medium term. One of the keyways in which the Paris Agreement is expected to impact transition climate risk and CTFactor is by increasing the likelihood of policy action to address climate change. As more countries adopt policies and regulations to reduce emissions and promote clean energy, the demand for fossil fuels and other high-emitting assets may decline, potentially causing these assets to become stranded and lose value.
Main statistics of MSCI Europe, Energy and Coal sector.
| # | Index | Bloomberg Ticker | Acronym | Min | Max | Mean | St. Dev. | Skewness | Kurtosis | Count |
|---|---|---|---|---|---|---|---|---|---|---|
| 1 | MSCI EUROPE | MXEU INDEX | MXEU | -0,12 | 0,10 | 0,00 | 0,01 | -0,37 | 7,45 | 5999 |
| 2 | ENERGY SECTOR | XLE US EQUITY | XLE | -0,22 | 0,15 | 0,00 | 0,02 | -0,65 | 12,68 | 5999 |
| 3 | COAL SECTOR | KOL US EQUITY | KOL | -0,20 | 0,16 | 0,00 | 0,02 | -0,67 | 8,69 | 3370 |
| 4 | CLIMATE TRANSITION RISK FACTOR | n.a. | CTFACTOR | -0,12 | 0,15 | 0,00 | 0,02 | -0,04 | 5,32 | 5999 |
4.2 Climate Betas’ Estimation
The GJR-GARCH DCC model is estimated in two stages. In the first stage, univariate GJRGARCH models are estimated for each residual series, and in the second stage, standardised residuals are used to estimate the parameters of the dynamic correlation.13
Based on the estimation results,14 main findings about climate betas can be summarized as follows. In the European context, we observe a general variability in climate transition betas, with a common spike during year 2020 in all countries analysed, except for Norway. This peak might be explained by the increase in European banks’ exposure towards energy companies in the same period. This evidence is confirmed by the EBA risk assessment results: according to EBA findings, European banks increased their exposures towards energy related companies during energy crisis. The Russian war triggered an energy crisis whose first signs had already been visible in late 2021. The increased volatility in gas and oil prices have created unprecedented liquidity needs for energy related firms - for both producers and suppliers - for different reasons, including the challenge from higher purchase prices and at the same time fixed price client contracts and from the need to meet higher margin calls on their position in the energy derivative markets. EU banks supported these firms by increasing loans and credit lines to this sector by almost EUR 50 bn (+18%) between June 2021 and June 2022. On the other hand, Norwegian banks’ climate betas show a less defined dynamic. In 2020, the Norwegian financial regulator conducted a climate risk stress test of country’s banks, to assess their resilience to climate-related risks and the stress test found that Norwegian banks are generally well prepared for climate risks. Although Norway is generally considered to be resilient to the impacts of climate change, many studies since the early 2000s15 questioned the common notion that climate change may be beneficial for Norway, as it is a major producer of fossil fuels and is heavily dependent on the shipping industry, which is susceptible to the impacts of climate change, such as sea level and more extreme weather events.
Stocks with high climate betas are expected to be negatively affected by stricter climate policies, the transition to a low-carbon economy and innovations in green technologies. On the other hand, stocks with low climate betas are expected to benefit from a shift towards net-zero emissions. One could argue that magnitude of transition betas should be correlated in some way with the amount of loans towards energy sector. As a matter of fact, transition betas and loan exposure towards energy sector16 show a positive correlation for three
out of four quarters taken into account (see Online Appendix for more details). More specifically, over the four quarters, we find a pattern of correlation loosening until a change in sign (from positive to negative) in June 2022. This may be due to a change in banks’ funding policy with respect to energy sector, also in light of an increasing counterparty risk. Due to the limited amount of data, this observation must be confirmed and investigate further in future research, with the support of new data about banks’ assets to analyse.
4.3 CRISK Estimation
We now elevate our analysis to CRISK, which is not only a function of climate betas, but also of the size and and leverage of a bank. As already said, differently from beta, CRISK is a monetary measure (i.e., it is quantified in Euros or in any other currency), and this makes it easily comparable across time and countries, accounting for banks’ size. For this reason, it is not rare to find banks with high exposure to climate risk (i.e., with high climate beta) that have a very limited impact on a systemic basis or, conversely, banks with low sensitivity to climate risk (i.e., with low climate beta) and an overall relevant impact, in terms of capital shortfall, in a stress scenario.
In the Online Appendix CRISKs for the selected Italian, German, French, Spanish and Norwegian institution are depicted. Interestingly, French and German banks result to be the most exposed to climate risk, whereas Norwegian banks appear to be the most resilient to it.
Sizeable differences in CRISK magnitude rise from the granular analysis of individual financial institutions. As a matter of fact, in some countries a few banks are preponderant in terms of CRISK compared to others, due to their size. Considering Italian context, for example, CRISK varies greatly across banks. Of course, this does not prejudice the relevance of CRISK for banks individually, but different considerations can be carried out on a systemic basis at banks level.
We therefore analyse CRISK aggregated at a country/region level, cumulating only positive CRISK (that is, we exlcude the potential benefit of capital surplus). Main findings are shown in Figure 2 hereafter. For the purpose of our analysis, results are shown for France, German, Spanish, Italian and Norwegian banks only. All other countries, that present a more limited impact in terms of systemic risk, have been aggregated in a residual category named “All other European banks”.
Evidence suggests that, during 2020, systemic CRISK has reached its peak since the financial crisis of 2013. More specifically, in the last two years, aggregated CRISK in Europe has reached more than EUR 270 bn during the pandemic Covid 19 crisis and it remains on persistently high level after the Russian invasion of Ukraine.
In such a stress scenario, despite the relevance of climate risk, we remark that capital shortfall must not necessarily be attributed to climate, since it
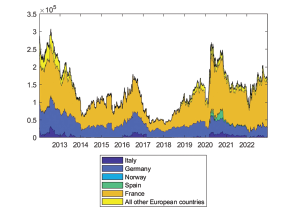
Positive CRISK of each bank i of each country c is summed to come to a proxy of systemic climate risk.
Positive CRISK of each bank i of each country c is summed to come to a proxy of systemic climate risk.
depends also on debt and equity of a bank. For this reason, one might be interested in isolating the single effect of its components and determine what are the most influent on its dynamic. In doing so, we narrow our attention to the period between December 2019 and December 2022, when a sizable rebound in CRISK affects almost all the relevant European financial institutions. To better understand the dynamics of CRISK in this period span, we decompose CRISK of each bank into the components due to debt, equity, and climate risk and then we aggregate them at country level.17
Columns “cDebt, “cEquity” and “cRisk” report the contribution to ΔCRISK of debt, equity, and climate risk, respectively. Net effect of the three components is reported in column “CRISK decom”. A net increase in CRISK means a worsening in capital shortfall in case of crisis. In contrast, a net decrease in CRISK means an improvement in banks’ solvency under stress testing scenario.
Despite the evidence of an increase in climate beta during year 2020, the analysis of CRISK decomposition suggests that climate risk in European banks has an impact relatively small with respect to their fundamentals, i.e debt and equity. Yet, the COVID pandemic has provoke a negative shock to demand for fossil fuel energy and this, in turn, let the brown energy sector become riskier (fall in streams of revenues and consequent decrease in cash flows available for debt repayment). Moreover, the energy crisis, triggered by Russian war and exacerbated by volatility of supply energy prices, has induced financial system to fulfil liquidity need of energy firms by increasing their exposure towards them. The transmission mechanism of risk from energy sector to financial system passes through loans, that are a relevant component of banks’ assets.
On a yearly basis, results suggest that, for most part of financial institutions, the dynamic of capital at risk between December 2019 and December 2022, is positive (a net CRISK increasing), and this effect is mostly driven by the increase in leverage of European banks, followed by a deterioration of their capitalization. For instance, on a yearly basis, the total contribution of leverage to French aggregated CRISK is more than EUR 72 bn. This effect has been partially counterbalanced by an increase in market value of equity, which has positively influenced CRISK for EUR 13.6 bn (see the Online Appendix).
Sticking to the analysis of French banks, the climate risk has a very limited impact on CRISK proportionally to leverage (EUR 2.8 bn). Nevertheless, CRISK has been negatively impacted by climate transition risk in 2019 and 2020, and this appears coherent with the increase in climate beta in the same period. In the last two years, the effect of climate risk on capital has been partially reabsorbed although the net effect during the entire period still had a negative impact. Considering French banks, the worsening in their leverage and climate risk exposure have contributed to an overall increase in CRISK for about EUR 75.3 bn. The combined effect with positive equity performance (EUR 13.6 bn) consisted in a net CRISK increase of EUR 61.7 bn in 2019-2022.
Comparing differences in risk decomposition, we observe that the highest variation in CRISK are registered by France and Spain during 2020 and 2022. In contrast, Norway and Germany seem to be quite resilient in terms of CRISK, revealing relative low or even negative values. Interestingly, over the period 2019-2022 we register a net beneficial impact of climate risk component on Norway and German CRISK, respectively equal to EUR 3.4 bn and EUR 5.2 bn.
5 Catching the Climate Premium
Finally, we make a first attempt in finding an intertemporal relation between banks’ daily stock returns and risk factors. The goal is to find the premium (or discount) from exposure to these factors. Previous studies, such as Alessi et al. (2019), found that, in the European market, the greenium, i.e., the risk premium associated with green factor, is negative and significant. This finding would indicate that investors are willing to earn comparatively less on these assets because they are hedging an environmental long-run risk.
We tackle this challenge by implementing a two step Fama-MacBeth regression, to test how risk factors describe asset returns. In the first step, each bank stock’s returns are regressed against one or more factor time series to determine the factor exposure or loading. In the second step, the cross-section of portfolio returns is regressed against the factor exposure, at each time step, to give a time series of risk premium coefficients for each factor. The insight of Fama-MacBeth is to average these coefficients, once for each factor, to compute the premium expected for a unit exposure to each risk factor over time.
In our analysis, we combine the use of dynamic conditional measures of market and climate risk with time series and cross sectional data. More specifically, from the DCC model we obtain an estimate of the covariance matrix from which we derive time series of conditional loadings for market and climate risk factors.
Then, by sectioning time series of banks’ stocks, market and CTFactor returns, for each day we perform a 126-days-rolling cross sectional linear regression of average European banks’ stock returns against average market and CTFactor returns. Each cross sectional regression, performed at time t, is represented by the following equation:
where:
. is the (35x1) vector of average returns in [t-126,t];
. is the (35x1) vector of average dynamic climate betas in [t- 126,t];
is the (35x1) vector of average dynamic market betas in [t- 126,t];
ξtis the (35x1) vector of error terms;
are the scalar parameters at time t.
Although significativity of regressors is not confirmed over the whole decade, on average we report a t-stat equal to 1.99 (p-value < 0.1) for market risk premium and equal to 1.84 for transition risk premium (p-value < 0.1).
Interestingly, while the daily market premium appears to be close to zero and less volatile than \Climate, we document an average λClimate range between -1.7% and +1.1% with higher volatility which has notably increased during period 2020-2022, presumably as a consequence of the European energy crisis and economic turmoil.
6 Conclusion
In this paper, we provide evidence of an extensive rise in climate transition risk across European banks between 2020 and 2022.
In general, this dynamic may be guided both by restrictive financing policies to high-emission sectors and by the sharp increase in prices registered in the energy sector during recent energy crisis. We also register an increasing climate CRISK and positive differential are still sizable by the end of 2022. On an aggregated basis, at the end of 2022, European CRISK can be quantified in about EUR 165 bn. Most of it comes from France for about EUR 130 bn, followed by Germany (EUR 27 bn). In contrast, different CRISK dynamic is shown by Norwegian banks, which seem to have a more resilient attitude towards climate risk.
As far as the climate premium is concerned, we find evidence of a dynamic climate risk premium negatively correlated to transition risk exposure. In other words, when banks bears high climate risk, investors accept a lower return in exchange for taking on the risk of the investment.
Despite the growing interest in climate transition risk for financial institutions, physical risk and its impact on financial sector remains a still largely unexplored topic. Future research directions may involve the construction of a climate physical risk factor and the quantification of a conjunct impact of physical and transition risk in a stress test scenario. We do rely on increasing effort in disclosure of ESG data. In particular, future research will make a more extensive use of data provided by EBA. Banks are expected to increase their efforts in managing climate-related and ESG risks in the coming months and years. These risks are becoming a growing source of financial risk on banks’ balance sheets. To allow for more accurate valuation of assets and better investment decisions, it is crucial for banks to disclose information about these risks to the markets. The implementing technical standard reported by EBA require banks to disclose climate-related risks associated with their lending and investment activities from 2023, with the reference date as of end-December 2022, and their green asset ratio and banking book taxonomy alignment ratio from 2024.
The upcoming disclosure requirements will provide more comprehensive and comparable information on banks’ alignment with sustainability goals. This will enable investors and other stakeholders to make more informed decisions and promote more sustainable investments.
Online Appendix available from: http://dx.doi.org/10.1561/114.00000063_app
Acknowledgment
This research was funded by PNRR (National Recovery and Resilience Plan) Project, for Mission 4, Component 2 (Notice D. D. 341 dated 15/03/2022)
Title: “GROWING RESILIENT INCLUSIVE AND SUSTAINABLE (GRINS)”
- CUP F83C22001720001 and by Czech Science Foundation (GACR) under the
Project 23-07128S.
References
See for example Task Force on Climate-related Financial Disclosure (“TCFD”) or Network for Greening the Financial System (“NGFS”).
Stranded assets are assets that lose their economic value due to changes in market conditions, such as a decrease in demand for fossil fuels or the introduction of carbon pricing policies.
European Central Bank, 2022 climate risk stress test, July 2022.
European Banking Authority, Risk Assessment of the European Banking System, December 2022.
For more information see https://vlab.stern.nyu.edu/help/risk_summary?model=CMES.
We have excluded banks with correlation to European market lower than 0.40.
Banks’ debt includes both current (including deposits) and non-current liabilities, as of a period end date. Tables relative to accounting data are available on request.
The MSCI Europe Index is designed to measure equity market performance of the developed markets in Europe. It captures large and mid cap representation across developed European countries and covers approximately 85% of the free float-adjusted market capitalization in each country.
See V-Lab: Climate Risk Analysis with GJR Climate Risk Documentation (nyu.edu). The World Wildlife Fund stranded asset return swap is an innovative financial instrument which involves two counterparties, in this case WWF and Deutsche Bank. Every three months, one party pays the other depending on whether stranded assets have outperformed or underperformed the market. The return on stranded assets is measured by an index comprised of a combination of f a market cap weighted index of returns on North America coal and J a market cap weighted index of North American oil sands. The market is measured by the S&P500 stock index.
CTFactor and MSCI 100-scaled cumulative returns are reported in the Online Appendix.
Main statistics of climate and market dynamic betas are reported in the Online Appendix. Results support the significativity of the selected factors in explaining the returns’ dynamic.
The estimates of dynamic climate transition betas are reported in the Online Appendix for each bank, grouped by country.
See for example O’Brien et al. (2004).
More specifically, we have computed the log of loan exposure to the energy sector.
In the Online Appendix the yearly decomposition of CRISK (in EUR bn) for the most representative European countries in the period between 2019 — 2022 is reported.
