This paper aims to present a requirements analysis for the processing of water-based electrode dispersions in inkjet printing.
A detailed examination of the components and the associated properties of the electrode dispersions has been carried out. The requirements of the printing process and the resulting performance characteristics of the electrode dispersions were analyzed in a top–down approach. The product and process side were compared, and the target specifications of the dispersion components were derived.
Target ranges have been identified for the main component properties, balancing the partly conflicting goals between the product and the process requirements.
The findings are expected to assist with the formulation of electrode dispersions as printing inks.
Little knowledge is available regarding the particular requirements arising from the systematic qualification of aqueous electrode dispersions for inkjet printing. This paper addresses these requirements, covering both product and process specifications.
1. Introduction
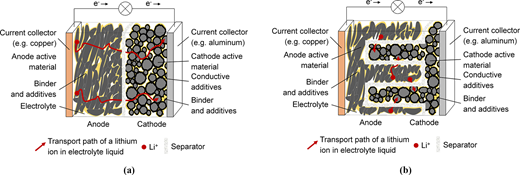
Lithium-ion batteries (LIB) currently represent the most suitable energy storage systems for portable devices owing to their high energy and power density (Scrosati and Garche, 2010; Zubi et al., 2018). They consist of multiple layers of porous anodes, cathodes and separators. The electrodes are composed of an active material, binders and conductive additives coated onto metallic substrates [Figure 1(a)] (Julien et al., 2016). The separators act as electrical insulators between the electrodes. A liquid electrolyte is filled into the pores in the electrodes and the separators to allow for an ionic conductivity. The smallest unit consisting of a single anode, cathode and separator in between is referred to as a cell.
During discharge, the lithium ions deintercalate from the active material particles within the anode into the liquid electrolyte and migrate to the cathode. Simultaneously, electrons externally move from the anode to the cathode for charge equalization while generating an electric current. This process is reversed during charging by applying an external current.
The transport distances of the ions between the electrodes and thus the attainable power density strongly depend on the area loading. A high area loading is required for high energy densities as the volume of passive materials is reduced. Unfortunately, this leads to larger ion distances and an increased effective ionic resistance (Choi et al., 2013; Zheng et al., 2012). This in turn has been reported to primarily contribute to a higher internal cell resistance for common material compositions and operation modes (Gallagher et al., 2015; Nyman et al., 2010), impeding the charging and discharging behavior.
This demonstrates that maximizing the energy and power density represents two conflicting goals in the design of LIB. Achieving high energy and power densities simultaneously is thought crucial for applications in diverse fields and thus at different size scales. This is accompanied by an emerging demand for small-scale batteries with superior electrochemical properties, such as batteries for portable medical devices (Rasouli and Phee, 2010).
The trade-off between the attainable energy and power density can be addressed by maintaining short ion pathways through adjusting the microstructure of the electrodes. Various approaches aim to reduce the ionic pathways by a two-dimensional structuring of the electrodes, e.g. by laser ablation processes (Kriegler et al., 2021; Habedank et al., 2018; Habedank et al., 2019), co-extrusion (Bae et al., 2013) or mechanical milling (Reale and Smith, 2018). An even more promising approach is offered by three-dimensional battery concepts (Chang et al., 2019; Zhu et al., 2017), in which tailored electrodes interlock on a micrometer scale [Figure 1(b)]. In this cell design, it is envisaged that the structured electrodes are separated by an organic or anorganic solid electrolyte layer (Janek and Zeier, 2016), which also assumes the insulating function of the separator (Delannoy et al., 2015). The influence of the interlocking design even increases with a rising area loading.
Novel approaches aiming at interlocked electrodes use additive manufacturing technologies because of the high design flexibility (Zhang et al., 2017; Yang et al., 2020). Particular attention has been paid to inkjet printing (Zhang et al., 2017), a liquid-based process, in which a dispersion is deposited drop by drop onto a substrate, fusing into a continuous layer. Repeating the process steps allows the layer-by-layer manufacturing of the component. Because of the high printing resolution, inkjet printing promises the possibility of the fabrication of interlocked electrode structures by processing paste-like electrode dispersions similar to the ones used in conventional manufacturing (Zhang et al., 2017; Lanceros-Méndez and Costa, 2018). Electrode dispersions, originally designed for conventional electrode coating technologies, need to be modified for the use in inkjet printing due to the print head limitations (Zhang et al., 2017). The dispersion is required to show a high stability over time to avoid agglomeration and sedimentation. Otherwise, the drop formation is affected negatively and the risk of nozzle clogging and bridging is increased (Derby and Reis, 2003; Guo et al., 2017). In addition, the stable drop formation and the deposition, and thus the printability, must be ensured by adapting the dispersion properties to the print head characteristics (Clasen et al., 2012). The trend toward new manufacturing processes is accompanied by increased water-based processing. This is associated with an improved environmental performance in the LIB production, coupled with reduced costs (Zackrisson et al., 2010).
1.1 Approach
The challenge in qualifying aqueous electrode dispersions for inkjet printing is to meet the requirements arising from the printing process while taking into account the electrode design parameters, which affect the battery performance characteristics.
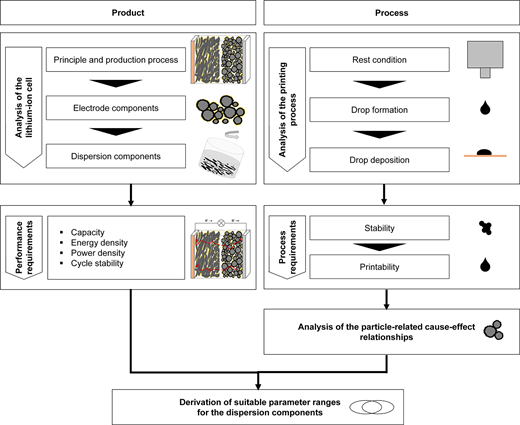
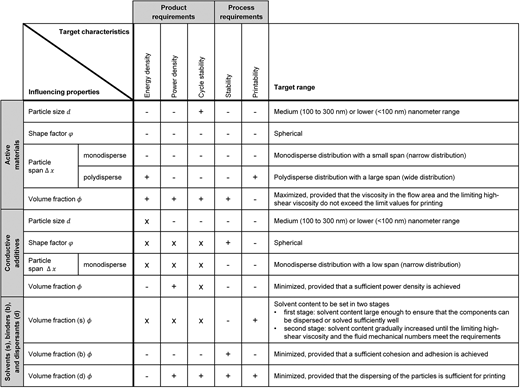
This paper represents a requirements analysis using a top–down approach (Figure 2). Based on an examination of a lithium-ion cell and the printing process, an attempt is made to derive the predominant product and process requirements. Here, the aim is to maintain a balance between the level of detail and the overall objective of the paper. The particle-related cause–effect relationships that occur in the dispersion are analyzed in more detail. Finally, parameter ranges are derived for the product and process sides and consequences for the printing process are drawn. The target properties of the electrode dispersion components are determined and consolidated in a summarizing figure (Figure 7).
2. Analysis of the electrode and its influence on the battery characteristics
2.1 Electrode components
The anode consists of anode active material, binders and additives. The composition of the cathode differs from the anode, in that other active materials are used and conductive additives are usually added (Daniel, 2008). The electrode components are briefly described below.
Active materials predominantly define the performance characteristics, enabling the intercalation and deintercalation of the ions. Natural or synthetic graphite is widely applied as the active material for the anode (Andre et al., 2017), but compounds of graphite and silicon are increasingly used (Chen, 2013; Kamali and Fray, 2010). Cathode active materials consist of mixed oxides, such as lithium transition metal compounds (Andre et al., 2015).
Conductive additives, such as carbon black (CB) (Scrosati and Garche, 2010) or carbon nanofibers (CNF) (Yazdani and Mohanam, 2014), are added to establish an electrical connection between the cathode active particles (Daniel, 2008).
Binder materials ensure a good cohesion between the electrode components and a sufficient adhesion to the current collector (Gulbinska, 2014; Billot et al., 2020). Typical binders for water-based electrode dispersions are carboxymethyl celluloses (CMC) and styrene-butadiene rubber (SBR), which are commonly used in combination (Bresser et al., 2018).
Additives improve the processability, such as the dispersion behavior of both the active materials (Lee et al., 2006) and the conductive additives (Porcher et al., 2010; Gonzalez-Garcia et al., 2000). They can be stable or volatile, the latter being removed during the drying process of the electrodes and not remaining in the electrode.
While polyvinylpyrrolidone (PVP) was reported to be a suitable dispersant for graphite in water (Kolb et al., 2021; Lehmann et al., 2021), Triton X-100 (TX-100) was observed to disperse conductive additives efficiently (Kolb et al., 2021). In addition, there are few studies on the stabilization of cathode active materials. LiFePO4 was successfully dispersed using poly (ethyleneimine) (PEI) (Li et al., 2012) or poly (4-styrene sulfonic acid) (PSSA) (Li et al., 2010), respectively, whereas LiCoO2 was stabilized by ammonium polyacrylic acid (PAA-NH4) and LiNi0.08Co0.15Al0.05O2 (NCA) (Li et al., 2011) by polyacrylic acid (PAA) (Hawley et al., 2021).
Furthermore, additives are used to adjust the rheological properties (Bitsch et al., 2014; Bitsch et al., 2016) or the surface tension (Kraytsberg and Ein-Eli, 2016) of the dispersion.
2.2 Dispersion components
Electrode production begins with the blending of the components in a sequence of dry and wet mixing processes to obtain a homogeneous dispersion (Schreiner et al., 2021). In addition to the electrode components, the dispersion contains volatile additives and solvents. They are used to enhance the processability and are removed during drying. For aqueous dispersions, this is carried out through the evaporation of excess water and additives. Drying can be achieved by various techniques, such as convective drying, hot air and infrared radiation (Li et al., 2017; Kwade et al., 2018). The electrode components are soluble or insoluble in the dispersion media. When insoluble, solid components are contained in the solvent, the total system is referred to as dispersion (Genovese, 2012). The components differ in their functions within the manufacturing routine and the battery operation (Table 1).
2.3 Dispersion and component properties
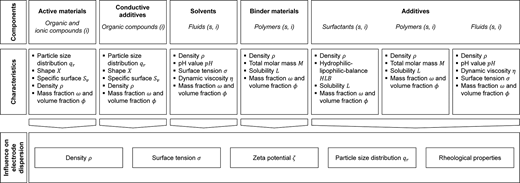
The electrode dispersion and its components have different main characteristics, which are explained in the following (Figure 3).
Electrode dispersions are decisively defined by the content of their various components, which can be specified as a volume fraction ϕ or a mass fraction ω. As the volume fraction can be converted into the mass fraction, only the volume fraction is used in the following.
Characteristic dispersion properties are the density ρ, the surface tension σ, the zeta potential ζ, the particle size distribution qr and the rheological properties, such as the dynamic viscosity η (Mikolajek et al., 2015).
Active materials are organic and ionic compounds, which are commonly in powder form (Kraytsberg and Ein-Eli, 2016). A powder consists of a multitude of particles and is primarily defined by the particle size distribution qr, the particle shape X, the specific surface Sv and the density ρ (Yefimov, 2009).
Conductive additives are organic compounds, which generally have a powdery initial state (Spahr et al., 2011). The main influencing factors are analogous to those of the active materials.
Solvents are fluids and primarily characterized by the density ρ, the pH value pH, the surface tension σ and the dynamic viscosity η (Lee et al., 2006; Hoath, 2016).
Binder materials are polymer-based and are present in solid or liquid form depending on the type of polymer and the synthesis procedure. Characteristic properties are the density ρ, the total molar mass M, which is mainly determined by the chain length ν, the degree of polymerization DP (Halary et al., 2011) and the solubility L.
Additives significantly affect the dispersion properties.
Additives that are predominantly used to improve the dispersion behavior or to modify the surface tension are called surfactants (Ueki et al., 2018). They consist of a hydrophilic and a lipophilic part (Moebius and Miller, 2001). Due to their amphiphilic character, they affect the properties of the dispersion system and lead mainly to three fundamental changes (Moebius and Miller, 2001):
reduction of the interfacial tension between the solvent and the adjacent phase;
improvement of the wetting properties of insoluble, solid components; and
formation of the electrical double layer at the interfaces.
Solvents are primarily characterized by their hydrophilic–lipophilic balance, HLB, which relates the molar mass of the lipohilic groups Ml and the hydrophilic groups Mh to the total molar mass M (Pasquali et al., 2008).
Polymers can also be added as dispersants to stabilize either by charge neutralization or steric repulsion (Fitch, 2012). The properties are analogous to those of the polymers used as binder materials.
Fluids can also act as additives and are predominantly used to adjust the rheological dispersion properties (Jieun et al., 2019). They can form a solution or an emulsion with the solvent, depending on the miscibility.
The most important properties are the density ρ, the pH value pH, the dynamic viscosity η and the surface tension σ (Lee et al., 2006; Hoath, 2016).
2.4 Battery performance characteristics
The behavior of LIB is described by performance characteristics. In the following, the parameters relevant for the interrelations in this paper are explained in more detail.
The energy is calculated from the product of the capacity and the average discharge voltage.
The capacity is the amount of electrical charge delivered by the LIB under specific discharge conditions (Julien et al., 2016). The capacity of a cell is defined primarily by the type and the proportion of the active materials as well as the area mass loading. The higher the content of the respective material is, the higher is the capacity. The capacity depends on the operating conditions, such as the discharge rate, the discharge voltage range and the ambient temperature (Julien et al., 2016).
The energy of a system can be referred either to the volume (energy density) or the mass (specific energy) (Julien et al., 2016). The porosity and the thickness influence the energy density, while the specific energy is not directly affected. With respect to the relationships considered in this paper, an equal tendency of both characteristics is expected; consequently, the term energy density is used solely. On the electrode level, the energy density primarily depends on the type and the proportion of the active materials and the area loading. The higher the content of the respective active material is, the higher is the energy density (Kraytsberg and Ein-Eli, 2016). Consequently, the energy density is negatively influenced when increasing the proportion of passive components, such as conductive additives, binder materials and further additives (Gulbinska, 2014).
The power density indicates the amount of electrical power, which can be charged or discharged per mass unit (Julien et al., 2016).
In LIB, the power density is influenced by the length of the pathways of the ions (Gulbinska, 2014). Shorter ion pathways result in a faster ion exchange between the electrodes and in a higher power density (Julien et al., 2016).
The power density is often expressed in terms of the rate capability, describing to which extent the available capacity is limited by high charging and discharging rates (Julien et al., 2016).
The cycle stability describes the behavior of LIB to lose capacity with an increasing cycle number due to cyclic aging or at rest due to calendar aging (Julien et al., 2016). The irreversible loss of capacity can occur for different reasons. In addition to mechanically induced deterioration leading to a partial loss of cohesion or adhesion (Zhu et al., 2020) and structural evolution of the active materials over the cycles (Sarre et al., 2004), the surface reactions between the active material particles and the electrolyte lead to a considerable loss of capacity. A small portion of the ions reacts with components of the electrolyte, irreversibly forming a film on the anode particle surface (An et al., 2016). The formation of this solid electrolyte interface (SEI) leads to a capacity loss during the initial charging phases. While the SEI is allowing ions to pass through, electrons are blocked. Thus, it impedes further electrolyte decomposition after the SEI formation and ensures cycling without major capacity losses (Julien et al., 2016). Cathode materials are also subject to irreversible parasitic reactions, such as surface layer formation (Birkl et al., 2017).
3. Product requirements
The influence of the predominant properties on the performance characteristics is analyzed. For the particle-based components, this includes the particle size, the specific surface, the particle shape, the particle size distribution and the volume fraction. The relevant parameter of the other dispersion components is the volume fraction. At the dispersion level, the pH value also influences the functionality of binders and additives.
3.1 Active materials
3.1.1 Particle size and specific surface
The particle size of the cathode and anode active material is subject to a conflict of goals. Smaller particles allow higher packing densities, which lead to an increased energy density (Olhero and Ferreira, 2004) and result in shorter solid ion diffusion lengths when deintercalating from the active material into the liquid electrolyte phase (Drezen et al., 2007; Huang et al., 2017). However, it has to be noted that the impact of the solid-state diffusion is in state-of-the-art battery cells commonly considerable lower than the influence of the transport through the electrolyte due to the shorter pathways (Kang et al., 2021). The latter is in turn primarily determined by the electrode design (Ebner et al., 2014) Furthermore, the larger interaction surface between the active material particles and the conductive additive particles (in the case of the cathode) enhances the surface reactions (Drezen et al., 2007; Huang et al., 2017). These mechanisms lead to an improved rate capability and to a higher power density. However, the use of small particles also has disadvantages. On the anode side, the larger specific surface promotes the SEI formation (Gulbinska, 2014; Kraytsberg and Ein-Eli, 2016). The extent of parasitic reactions on the cathode side also increases with a rising specific surface and thus a smaller particle size (Birkl et al., 2017).
3.1.2 Particle shape
The particle shape primarily depends on the synthesis process (Yoshio et al., 2009). Spherical particles allow higher packing densities (Liu et al., 2019), which positively affects the energy density. In terms of the power density and the cycle stability, spherical particles have also proven to be beneficial. However, the addition of non-spherical to spherical particles was observed to lead to a reduced internal cell resistance due to the lower internal resistance of the contact between the particles, resulting in a higher rate capability (Wen et al., 2019).
3.1.3 Particle size distribution
Regarding the particle size distribution, dispersions can be categorized in monodisperse and polydisperse systems.
While in a monodisperse distribution, the particles are in one size category; they are distributed over several size classes in a polydisperse system (Baranau and Tallarek, 2014). In practice, monodisperse dispersions perform worse than polydisperse systems due to the random arrangement (Farr and Groot, 2009). In terms of the energy density, related to spherical particles, a narrow particle size distribution is targeted for monodisperse systems and a wide distribution for polydisperse systems. By contrast, an enhanced ion transport was observed with a narrow particle size distribution (Prosini et al., 2002; Srinivasan and Newman, 2004). This was attributed to the uniform ion diffusion length. As a result, a narrow particle size distribution is favorable in terms of the power density and the cycle stability.
3.1.4 Volume fraction
Active materials represent the predominant electrochemically active component in the electrode (Kraytsberg and Ein-Eli, 2016). A higher volume fraction results in improved performance characteristics (Liu et al., 2008).
An overview of typical particle shapes and particle sizes for commercially available active materials is provided in Table 2.
3.2 Conductive additives
3.2.1 Particle size and specific surface
A thinner and more homogeneous carbon layer on the active material particles is achievable with smaller conductive additive particles. This ensures sufficient electrical conductive pathways within the electrodes with a low volume fraction of conductive additives, resulting in a higher power density and cycling stability (Bauer et al., 2015).
3.2.2 Volume fraction
At operation conditions, where the electrical conductivity through the electrode becomes limiting, a higher volume fraction of conductive additives contributes to the power density (Liu et al., 2008).
A summary of typical particle shapes and particle sizes for industrially relevant conductive additives is provided in Table 2.
3.3 Solvents
3.3.1 Volume fraction
Solvents are removed during drying and do not remain in the electrodes. However, the solvent content has an influence on the complex physical phenomena underlying the drying process and on the final distribution of the particles in the electrode (Lanceros-Méndez and Costa, 2018). This may have an impact on the performance characteristics, although this relationship needs to be further explored.
3.4 Binder materials
3.4.1 Volume fraction
Binder materials enable the adhesion and cohesion within the electrode (Gulbinska, 2014; Billot et al., 2020). Due to their electrochemical inactivity, a higher proportion of binder materials leads to a lower energy and power density.
3.5 Dispersants
3.5.1 Volume fraction
As dispersants are electrochemically inactive, a higher volume fraction leads to a reduced energy density (Liu et al., 2008). However, dispersants positively affect the power density and the cycle stability due to the achieved homogeneity of the materials contained in the electrode (Li et al., 2011; Chang et al., 2011).
3.6 pH value
The pH value of the dispersion primarily impacts the condition of the current collectors. Unsuitable pH values can cause detrimental corrosion effects and can influence the functionality of additives during the processing and of binders during the battery operation. Both affect the battery performance characteristics. In the case of additives, the pH value impacts the dispersion behavior. Regarding the binder materials, the pH value impacts the formation of the network of the polymer strands in the electrode, influencing the cohesion and adhesion.
Empirical studies on the pH value working range of selected binder materials and additives commonly used in aqueous electrode dispersions have already been performed. The state of the art is summarized in Table 3. It should be noted that the pH values given are to be understood only as a tendency. The values depend strongly on the specific material derivatives used and the complex relationships between the different operating mechanisms as well as the measurement methods employed.
To ensure that the binder materials and additives work properly in the specific electrode dispersion, the pH value of the overall system must be adjusted accordingly.
From Table 3, it can be concluded that the operating pH value for most binders and additives tends to be in the alkaline range.
4. Analysis of the printing process
The most widely used drop-on-demand process is the piezo-electric inkjet technology (Sousa et al., 2015), as this offers a high printing resolution ranging from 100 to 5,000 dpi (Lanceros-Méndez and Costa, 2018) with an achievable wet-layer thickness in the range between 50 nm and 10 µm (Lanceros-Méndez and Costa, 2018).
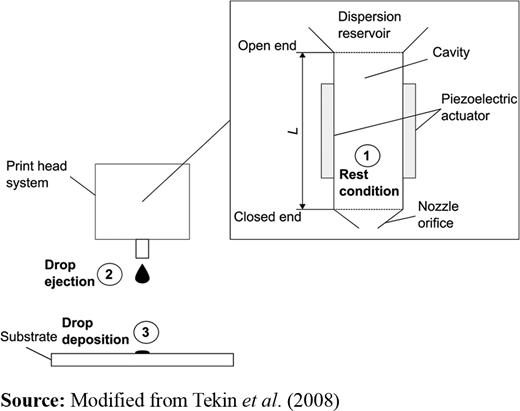
The principle of a piezo-electric print head is systematically depicted in Figure 4. The print head is composed of a dispersion reservoir, a piezo-electric actuator, a cavity and a nozzle orifice (Tekin et al., 2008). A volume contraction of the actuator leads to a shear deformation of the fluid, which is specified by the applied shear rate .
The process can be divided into the rest condition, the drop ejection and the drop deposition. At rest condition, no shear rate () is applied. The reservoir, the cavity and the nozzle orifice are flooded with the dispersion. When a voltage is applied, it generates a pressure wave. This wave propagates inside of the cavity, leading to superimpositions. To compensate the volume increase, drops are ejected at the jetting shear rate () at the closed end through the nozzle orifice. Subsequently, these drops are deposited on the substrate ().
5. Process requirements
At rest condition, the stability of the dispersion is the decisive characteristic. For the drop formation and the deposition, the properties that affect the printability of the dispersion are dominant.
In the following, the stability and the printability as well as their characteristic parameters are discussed in more detail. The target ranges for the relevant parameters and the appropriate measurement methods are summarized in Table 4.
5.1 Stability behavior
The stability describes the state of a dispersion in which agglomeration and sedimentation hardly occur (Tadros, 2011). Binder materials and additives contained in the dispersion predominantly define the stability of active materials and conductive additives. The dispersion characteristics defining the stability behavior are described in the following.
The particle size distribution qr represents an indicator for the dispersion behavior of the active material and the conductive additive particles (Barnes, 2000; Utela et al., 2010).
The particle size distribution can be determined using a laser diffractometer. The maximum particle size contained in the dispersion can be identified using filtering methods (Kolb et al., 2021).
The zero shear viscosity η0 is defined as the constant limit value at an infinitely low shear rate, representing the rest condition of the dispersion (Tadros, 2011). A high zero shear viscosity indicates a distinct stability at rest condition, where agglomeration and sedimentation effects are slowed down (Delannoy et al., 2015).
Zero shear viscosity predominantly depends on the particle volume fractions contained in the dispersion. However, a zero shear viscosity η0 in a range between 100 and 500 Pa s can serve as a standard value. It can be determined by a single-point shear rate measurement using a rotational rheometer. For this purpose, a low shear rate of usually less than 100 1/s is selected (Tadros, 2011).
The storage modulus G’ and the loss modulus G” are characteristic values representing the ratio of stress to strain under vibratory conditions (Chhabbra and Richardson, 2011).
The storage modulus G’ is a measure for the elastic fraction of the deformation energy stored in the material during the shearing process (Chhabbra and Richardson, 2011). The loss modulus G” exhibits the deformation energy consumed during the shear process, representing the viscous behavior (Chhabbra and Richardson, 2011). The loss factor δ represents the ratio between the loss modulus and the storage modulus (Chhabbra and Richardson, 2011):
Dispersions are classified as follows:
G” < G’; 0° < δ < 45°: The dispersion behaves like a non-flowable elastic gel.
G’ < G”; 45° < δ < 90°: The dispersion behaves like a fluid.
In terms of stability, the non-flowable elastic gel condition is preferred because agglomeration and settling effects of the particles are impeded (Porcher et al., 2007).
The storage modulus G’ and loss modulus G” can be determined in an oscillatory test with a rotational rheometer (Tadros, 2011; Barnes, 2000).
The zeta potential ζ is the electric potential at the slipping plane of a moving particle in a dispersion (Hoath, 2016). The magnitude of the zeta potential is determined by the surface charge density (Hoath, 2016) and represents an indicator for the magnitude of the electrostatic forces between colloidal particles (White et al., 2007).
The higher the absolute value of the zeta potential is, the more distinct is the electrostatic stabilization of the dispersion. Zhu et al. (2007), Greenwood (2003) and van Guyen et al. (2011) stated that dispersions with a zeta potential of less than −30 mV and more than +30 mV are stable. However, White et al. (2007) stated that even zeta potentials of less than −15 mV and more than 15 mV can indicate a sufficient stabilization condition.
The zeta potential can be determined by a zetasizer according to the principle of the laser Doppler anemometry (Kaszuba et al., 2010).
The sedimentation behavior describes the sinking of particles (Ramaywamy, 2001) and is an indicator for an unstable dispersion. The stronger the sedimentation behavior is, the lower is the stability.
The Péclet number, based on Stokes’ law and defined as the ratio of advective to diffusive fluxes, indicates the stability. It allows assessing whether Brownian molecular motion or sedimentation due to gravity predominates (Ramaywamy, 2001). It is determined as follows for spherical particles (Genovese, 2012; Mewis, 1996):
Here, dparticle is the diameter of the spherical particle, vparticle the sedimentation velocity of an isolated particle in a dispersion, D the diffusion coefficient, ρparticle and ρsolvent are the densities of the particles and the solvent, respectively, kB is the Boltzmann’s constant and T the temperature.
For Péclet numbers > 102, the Brownian motion is insignificant, and the motion is dominated by hydrodynamic forces (Ramaywamy, 2001). For small Péclet numbers ≪ 1, Brownian motion dominates the particle motion (Ramaywamy, 2001; Mewis, 1996). The particles do not sediment due to gravity, and a reversible equilibrium structure is established (Mewis, 1996).
The sedimentation behavior can be assessed by an optical evaluation, taking into account the formation of sediment and the contrast decrease of the dispersion (Kolb et al., 2021).
5.2 Printability
The dispersion characteristics primarily defining the printability are described in the following.
The viscosity in the flow area represents the viscosity behavior at medium shear rates. The viscosity in this range is a direct function of the shear rate (Hoath, 2016). It describes the progression of the viscosity when a force is applied.
In terms of printability, a shear-thinning behavior of the dispersion is required, representing a decrease of the viscosity at an increasing shear rate. This behavior is favored for the printing process, as the dispersion must show a low viscosity to be capable of flowing through the nozzles (Delannoy et al., 2015).
The viscosity in the flow area can be determined by a rotational test using a rotational rheometer. The course of the viscosity is measured over the shear rate, starting at the zero shear rate zone and ending at the device-specific maximum shear rate . However, is usually lower than the shear rate at which the drop is applied (Hoath, 2016). In a capillary rheometer, the flow behavior can be studied commonly for shear rates up to 106 1/s (Chhabbra and Richardson, 2011). It allows determining single-viscosity values for a shear rate range < < (Tadros, 2011). Alternatively, the course of the viscosity can be extrapolated from the empirically obtained viscosity values in the flow area, as the viscosity values in the region beyond the flow area usually display a low gradient (Chen, 2009).
The limiting high-shear viscosity ηjet is the constant limit value of the viscosity function at sufficiently high shear rates, which is close to an infinitely high shear rate. For drop-based printing techniques, the shear rate at which the drop is applied can be calculated as follows:
Q represents the volume flow, which is defined as follows: .
The fluid dynamic numbers describe the drop formation. The numbers relevant for characterizing a dispersion depend on the nature of the fluids, in particular whether they are Newtonian or non-Newtonian. Due to the required shear-thinning behavior during the formation process and the relaxation behavior on the substrate, electrode dispersions must exhibit a non-Newtonian fluid behavior. The strength of the non-Newtonian behavior is decisively influenced by the binder materials and the particle fractions contained in the dispersion (Barnes, 2000). The Ohnesorge number Oh represents the most important parameter for Newtonian and non-Newtonian fluids (Guo et al., 2017; Martin et al., 2008). While values of Oh above the threshold lead to viscous dissipation and thus no drop formation, low values of Oh result in long filaments, causing satellite drops. Satellite drops are micrometer-sized drops that form when the extended filament between two adjacent drops experiences Plateau–Rayleigh instability (Guo et al., 2017). Both phenomena must be avoided, as they lead to a reduction in the print quality (Clasen et al., 2012; Wijshoff, 2010). For non-Newtonian fluids, more numbers are required to fully characterize the behavior. According to Clasen et al. (2012), these fluids are fully characterized by two fluid dynamic numbers and one material property-based number (Table 5). The remaining key figures can be derived from these characteristic values.
Table 5 shows that, in addition to the process parameters, the density, the surface tension and the viscosity of the dispersion influence the key figures.
The density is defined by the dispersion components and their respective volume fractions. Therefore, the density can only be modified by a substitution of the components, which is usually neither feasible nor desired.
The influence of the surface tension is significantly less than that of the viscosity (Alamán et al., 2016). It can be adjusted by adding a small amount of surfactant without significantly changing the viscosity (Alamán et al., 2016).
Consequently, in addition to the process parameters, the viscosity of the dispersion has a very high influence on the fluid dynamic numbers.
The relaxation behavior, indicated by the relaxation time, describes the duration required for dispersions to return to a more viscous state after shear stress (Tadros, 2011; Barnes, 2000). Hitting the substrate, the drop must return elastically to the previous drop shape (Buchdahl and Thimm, 1945). The relaxation behavior can be determined via a frequency sweep or a relaxation test using a rotational rheometer (Barnes, 2000).
The wetting behavior is defined as the behavior to maintain contact with a solid substrate. The contact angle between a dispersion and a substrate allows an evaluation of the wetting. For a sufficient wetting, the contact angle must be in a range between 0 and 90° (Billot et al., 2021).
The contact angle can be measured using a drop shape analyzer (Andersen and Taboryski, 2017).
The analysis of the process requirements shows that the rheological properties have a major influence on the stability and the printability. Accordingly, their adaption to the process requirements represents the main challenge in the qualification of electrode dispersions for the printing process. The rheological properties are significantly influenced by the particulate materials contained in the dispersion (Tsai et al., 2008).
6. Analysis of particle-related cause–effect relationships
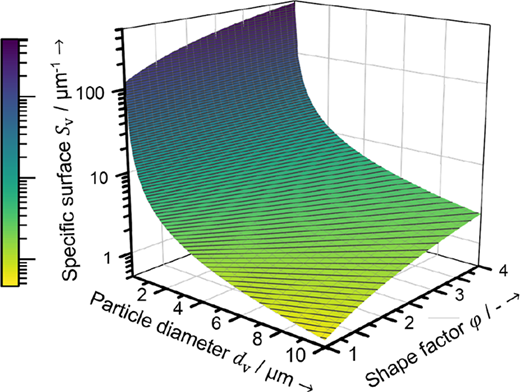
The relationship between the particle size, represented by the particle diameter, the particle shape and the specific surface is examined (Figure 5).
The specific surface Sv as a function of the diameter of the equal volume sphere dv and the shape factor φ is determined according to Barreiros et al. (1996):
The shape factor φ is defined as follows (Wadell, 1932):
φ = 1: This relation is valid for a sphere.
φ > 1: This relation refers to a non-spherical shape. The greater φ is, the more the particle shape deviates from that of a sphere. For rotational ellipsoids, representing elongated particles, with a ratio of 1 < b/a < 100 between the length a and the height b, the shape factor is 1 < φ < 4 (Stiess, 2009).
Figure 5 shows that the particle diameter has a higher influence on the specific surface than the shape. The specific surface Sv as a function of the particle diameter dv is defined by a fractional rational function. By contrast, the specific surface Sv increases linearly with the shape factor φ. This means that particles with a diameter of 50 nm have a surface 400 times as high compared to particles with a diameter of 20 µm, with the same volume distributed on multiple larger particles.
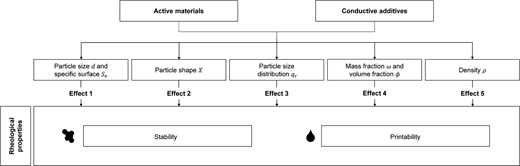
The relationships of the particle characteristics and the rheological dispersion properties were analyzed (Figure 6). The effects are discussed in more detail in the following.
6.1 Effect 1: particle size and specific surface
The particle size and the resulting specific surface predominantly influence the rheological properties (Chu et al., 2014; Hao et al., 2016).
Stability: It follows from equation (2) that the smaller dparticle is, the lower are vparticle and Pe.
However, the total specific surface is higher for smaller particles with the same volume distributed on these smaller particles. The enlarged surface leads to higher surface forces of the particles. This in turn promotes the formation of agglomerates out of several individual particles. As a result, vparticle and Pe increase.
Printability: The individual particles and agglomerates that may occur in the dispersion should be significantly smaller than the diameter of the print head (Derby and Reis, 2003; Utela et al., 2010). Different rules of thumb regarding the ratio of the particle diameter to the print head can be found in the literature (Table 4).
6.2 Effect 2: particle shape
The particle shape of the active materials has a major influence on the viscosity (Brenner, 2019; Pabst et al., 2006).
Stability: The probability of particle–particle interactions is enhanced for elongated particles due to the increased specific surface. In addition, the deflection of flow lines of the solvent around the particles is stronger for elongated particles than for spheres of equal expansion perpendicular to the direction of flow (Barnes, 2000). This leads to a higher resistance of the particles to flow, leading to a higher zero shear viscosity. Barnes (2000) and Utela et al. (2010) state that elongated particles tend to tilt, while spheres slide off each other more easily. This leads to a higher likelihood of nozzle clogging.
Printability: The particle–particle interactions at high shear rates are less pronounced for spheres than for elongated particles (Brenner, 2019; Pabst et al., 2006). Elongated particles are capable of adjusting their orientation to the flow direction with increasing shear rate, resulting in a lower viscosity compared to spheres (Brenner, 2019; Pabst et al., 2006).
6.3 Effect 3: particle size distribution
With constant volume fractions and the same shear rate, polydisperse systems show lower viscosities than monodisperse dispersions.
Stability: The particle size distribution influences the zero shear viscosity and can be increased by narrowing the particle size distribution (Hoath, 2016; Barnes, 2000).
Printability: The particle size distribution impacts the viscosity in the flow area and the limiting high-shear viscosity (Farr and Groot, 2009). Monodisperse systems lead to higher values compared to polydisperse systems (Farr and Groot, 2009), as for polydisperse particle distributions the smaller particles can behave as a lubricant (Ancey, 2001). Furthermore, polydisperse systems allow the processing of a higher volume fraction of active materials ϕmax, as they use the given volume more efficiently. Therefore, a large span is beneficial for polydisperse and a small span for monodisperse distributions.
6.4 Effect 4: volume fraction
The volume fraction significantly influences the rheological properties (Genovese, 2012; Barnes, 2000).
Stability: The zero shear viscosity of a dispersion rises with the increasing mass or volume fraction of the particles, or with a decreasing mass or volume fraction of the solvent (Genovese, 2012; Tadros, 2011; Barnes, 2000). The particles form clusters. At low concentrations, these clusters are not connected. The dispersion remains liquid-like or weakly elastic without a yield point (Genovese, 2012). At high concentrations, above the gel point, the clusters are connected to a network and the system becomes solid-like, leading to an increased stability (Genovese, 2012). The use of dispersants supports the formation of the stabilizing network (Genovese, 2012).
Printability: The mass or volume fraction impacts the viscosity in the flow area and the limiting high-shear viscosity (Tadros, 2011; Barnes, 2000). A larger fraction leads to higher viscosity values for both characteristics and to an increase in Oh.
6.5 Effect 5: density
The density of the particulate materials has a significant impact on the rheological properties (Bentz et al., 2012).
Stability: The stability of the dispersion is decisively influenced by the density difference between the particles and the medium (Tadros, 2011) (Section 6.1). Sedimentation occurs when the density of the disperse phase is greater than that of the medium (Tadros, 2011).
Printability: The density of the particulate materials influences the density of the dispersion and thus the fluid dynamic numbers (Table 5).
7. Derivation of target ranges
Based on the analysis of the relationships between the component properties and the product (Section 3) as well as the process requirements (Sections 5 and 6), the correlations were assessed and are summarized in Figure 7. The shape was represented by the quantity shape factor φ and the particle size distribution by the particle span Δx, representing the distance between the maximum diameter dmax and the minimum diameter dmin . Target ranges for component properties were derived by balancing the product and process requirements, with the latter being the limiting requirements. Provided that the process requirements were met, the product requirements were approached as far as possible. The component characteristics identified as conflicting goals between the product and process requirements are discussed in more detail in the following.
7.1 Active materials
7.1.1 Particle size and specific surface
There is a conflict of objectives between the achievable cycle stability and the process requirements. To achieve a high cycle stability, a larger particle diameter with a smaller total specific surface is targeted. However, the nozzle geometry to be used severely restricts the possible adjustment range for the particle size. To meet the requirements regarding the avoidance of nozzle clogging, the particles should not exceed the target range (Table 4). As the formation of agglomerates cannot always be fully prevented, the maximum particle size of the raw particles must be significantly lower. It is expected that printability is given with primary particles with a maximum diameter in the medium (100 to 300 nm) or, even more suitably, in the lower (< 100 nm) nanometer range for common print heads with nozzle diameters between 30 and 50 µm. The maximum processable particle diameter decisively influences the prevention of agglomeration and sedimentation by the additives used.
With regard to the cycle stability, the maximum feasible mean particle diameter regarding the nozzle geometry should be selected.
7.1.2 Particle size distribution
For monodisperse systems, a small span is preferred in terms of the performance characteristics. In polydisperse systems, a conflict arises. While a large span is favored for a high energy density, a small span is beneficial for the power density and the cycle stability. In terms of the stability, a narrow particle size distribution is targeted for both monodisperse and polydisperse systems. Regarding the printability, conflicting dependencies exist. While a large span is aimed at for polydisperse systems, a small span is suitable for monodisperse distributions.
Polydisperse are preferable to monodisperse distributions. The target range is a small span for monodisperse and a large span for polydisperse distributions.
7.1.3 Volume fraction
A conflict of objectives between the product requirements, the stability and the printability is apparent. Aiming at high performance characteristics, the volume fraction of the active materials must be as high as possible. Regarding stability, an increasing active material particle fraction is pursued. However, this also leads to a higher viscosity in the flow area and a higher limiting high-shear viscosity. Consequently, the volume fraction of the dispersion should be maximized, but at the same time, the viscosity values must not exceed the limit values for printing.
The results confirm that the process requirements can be met by active materials already used in the conventional electrode production.
On the anode side, synthetic graphite, lithium titanate (LTO) and C/Sn as well as C/Si composites in combination with synthetic graphite in spherical shape display a high suitability for the printing process. Natural graphite, currently the most important anode material along with synthetic graphite, is not suitable for printing due to its large particle size. Regarding the importance of natural and synthetic graphite, it is assumed that the demand will increase equally, with the importance of synthetic graphite likely to exceed that of natural graphite in the future (Olivetti et al., 2017; Mundszinger et al., 2017; Zaghib et al., 2003).
Cathode active materials exhibit a high suitability for processing in inkjet printing because of their pristine particle size and shape resulting from the specific synthesis processes.
In this context, it should also be mentioned that the production of materials is increasingly moving in the direction of materials with tailored properties (Sun et al., 2016), which additionally facilitates the use of drop-based printing processes.
7.2 Conductive additives
7.2.1 Volume fraction
The power density is increased with a rising volume fraction of conductive additives. However, with a larger proportion, more dispersant is required, which has a negative effect on the energy density. With regard to the process requirements, the volume fraction of conductive additives should be kept as low as possible, as these particles also have to be stabilized with dispersants and strongly influence the fluid dynamic properties. Considering the advantages and disadvantages, the volume fraction should be minimized to the extent that a sufficient power density can still be achieved.
The analysis confirms that commercially available CB meets the process requirements. CNF appear to be rather unsuitable due to their large expansion in one direction beyond the print head limitations.
7.3 Solvents
7.3.1 Volume fraction
The influence of the volume fraction on the performance characteristics is so far insufficiently explored. To achieve higher dry film thicknesses, the volume fraction is targeted to be as low as possible. Regarding the process requirements, the solvent content allows the adjustment of the shear rate-dependent viscosity over orders of magnitude. A lower volume fraction increases the zero shear viscosity, while a higher volume fraction decreases the limiting high-shear viscosity. As a result, the volume fraction is proposed to be set in two stages. In the first step, the volume fraction should be large enough to ensure that the components contained can be dispersed or dissolved sufficiently well. Second, the volume fraction must be gradually increased, as it is also common in conventional processing, that the limiting high-shear viscosity and the fluid dynamic numbers meet the requirements for printability.
7.4 Binder materials
7.4.1 Volume fraction
On the one hand, the volume fraction of binder materials must be sufficiently high to obtain an adequate adhesion and cohesion. In addition, the polymers contribute to an increased stability. On the other hand, a low volume fraction is pursued with regard to the performance characteristics and the printability. Taking both sides into account, the volume fraction should be kept as low as possible, provided a sufficient adhesion and cohesion are achieved. The volume fraction should be adjusted to the total specific surface of the active material and the conductive additive particles.
7.5 Additives
7.5.1 Volume fraction
Aiming at a high energy density, the volume fraction of the dispersants should be minimized. However, dispersants positively affect the power density and cycle stability due to the homogeneity achieved in the electrode. Also, additives contribute to an increased stability and allow for printability due to the dispersing behavior.
8. Conclusions
Inkjet printing has a high potential for the fabrication of geometrically customized electrodes. However, adapting electrode dispersions used for conventional manufacturing to the process requirements is accompanied by challenges. The dispersions must be printable and meet the LIB performance characteristics.
A requirements analysis for the processing of aqueous electrode dispersions in inkjet printing was conducted. Therefore, this paper represents an approach to link the product and process requirements with the predominant electrode component characteristics. Trends for the target ranges were identified for the key component properties, balancing the partly conflicting goals between the product and process requirements. The presented study indicates that conventional electrode components can be processed through inkjet printing by adapting the overall dispersion properties to the printing requirements.
Further challenges arise from the complex physical interactions between the individual components within dispersions. In particular, the complex interactions between the active materials particles and the conductive CB and their influence on the dispersion properties need to be further investigated. The target ranges assist to quantify the predominant cause–effect relationships between the component properties and the dispersion qualities. In future research, procedures for formulating printable electrode dispersions must be elaborated. The printing of solid electrolyte layers and the associated qualification of process routes for the entire three-dimensional cell setup is another area in which additional effort is required.
The authors express their sincere gratitude to the Federal Ministry of Education and Research (BMBF) for financially supporting the research on the presented topic within the research cluster ExZellTUM III (grant number 03XPO255).