


This research addresses Industry 4.0 (I4.0) adoption challenges among logistics small- and medium-sized enterprises (SMEs), with a focus on improving warehouse goods movement. Considering SMEs' constraints (e.g. limited resources, expertise and readiness), the study develops Logistics Industry 4.0 Readiness and Assessment (LIRA), a strategic dashboard to assess preparedness for digital transformation.
The study employs a conceptual research approach to develop the LIRA dashboard. The methodology involves a literature-driven theoretical model development. The dashboard development includes: assessing organizational readiness through Foundational Building Blocks; defining the technological domain for goods movement in warehouse logistics; evaluating Operational Conditions; and applying an adapted ROI 4.0 model to evaluate the profitability of I4.0 investments.
The research yields a dashboard system to support SMEs' I4.0 journey. The dashboard integrates a readiness assessment model with adapted ROI 4.0, enabling SMEs to evaluate their preparedness for I4.0 adoption and to estimate the return on I4.0 investment.
As a conceptual study, it requires empirical validation. Limitations include its focus on warehouse internal logistics and specific I4.0 technologies [augmented reality (AR), automated guided vehicle, radio-frequency identification]. Future research could explore the broader applicability and potential of additional technologies.
The framework provides SMEs with a practical tool to assess their I4.0 readiness, supporting informed decisions on technology investments and optimizing implementation strategies for economic, operational and environmental benefits.
This research provides a tailored dashboard to address SMEs' I4.0 adoption challenges. It highlights the strategic deployment of I4.0 to drive operational efficiency and sustainability. It further adapts the ROI 4.0 financial assessment model to the logistics domain, integrating readiness assessment with financial and non-financial impact evaluation, thereby enabling a more holistic and context-sensitive assessment of I4.0 investments.
1. Introduction
The rapid advancement of innovative information and communication technologies has been piloted in Industry 4.0 (I4.0), a transformative paradigm that integrates them within the manufacturing and production systems, by generating a digital sphere in which products and processes are digitally interlinked, allowing organizational processes to be more efficient (Barreto et al., 2017).
The influence of I4.0 extends beyond manufacturing into logistics and supply chain management, where terms like “Logistics 4.0” or “Smart Logistics” capture the critical role of digital transformation in improving transparency, adaptability and efficiency throughout the value chain (Kayikci, 2018). For instance, Winkelhaus and Grosse (2020) refer to Logistics 4.0 as “the logistical system that enables the sustainable satisfaction of individualized customer demands without an increase in costs and supports this development in industry and trade using digital technologies”. Such a definition places Logistics 4.0 both in terms of logistical efficiency and sustainability, whether it is economical, environmental or social.
In this perspective, Logistics 4.0 has fundamentally redefined logistics activities, including warehouse management practices, enhancing production efficiency and reshaping supply chain dynamics (Kayikci, 2018). Specifically, the adoption of pivotal I4.0 technologies within warehouse operations, such as Internet of Things (IoT), artificial intelligence, Big Data Analysis, Cloud Computing, Robotics and Automation, enables flexibility and adaptability of inventory handling, order fulfillment and material flows by supporting real-time transparency, autonomous management and decentralized operations (Khan et al., 2022; Perotti et al., 2022a, b; Sun et al., 2022). Furthermore, their adoption can deliver economic, environmental and social sustainability benefits such as enhancing energy efficiency, reducing greenhouse gas emissions and improving working conditions by automating repetitive tasks (Sony, 2020).
Despite its transformative potential, the adoption of I4.0 technologies presents notable challenges, particularly for small- and medium-sized enterprises (SMEs). While large organizations often lead the implementation of advanced manufacturing and logistics systems, logistics SMEs encounter barriers such as constrained financial resources, limited technological expertise and insufficient organizational readiness (Tubis and Grzybowska, 2022; Mittal et al., 2018).
In this context, assessing the readiness of logistics SMEs to implement I4.0 technologies and unlock their potential benefits becomes crucial. Moreover, the adoption of 4.0 technologies – especially for SMEs with limited financial resources and expertise – requires a thorough economic cost-benefit analysis (Caylar et al., 2016; Giannetti et al., 2021). Assessing the economic feasibility and impact of I4.0 solutions is crucial, enabling companies to weigh initial investments against benefits such as cost reduction, efficiency gains, revenue growth, operational flexibility, risk minimization and enhanced environmental and social sustainability.
The “digital paradox” (Gebauer et al., 2020) highlights the challenge companies face in achieving financial gains despite heavy investments in digital technologies. This stems from the diversity of I4.0 technologies, which vary in scope, maturity, costs, interdependence and benefits (Di Nardo et al., 2025; Perotti et al., 2022a, b). Such variability creates uncertainty, as the impact of these technologies depends on how they reshape operations. Some companies experience only minor changes (Pandya and Kumar, 2023), while others undergo significant transformations (Meier, 2020). The lack of reliable data and standardized evaluation methods further complicates cost-benefit analysis (Joppen et al., 2019).
Technological Readiness for I4.0 in logistics SMEs is defined as the degree to which an organization's managerial, cultural and operational capabilities – including leadership, employee acceptance, process standardization, information flows and systems integration – enable the effective adoption and exploitation of I4.0 technologies in logistics processes (Sony and Naik 2020; Mittal et al., 2018).
From this perspective, most readiness models for the adoption and implementation of I4.0 have been developed for large firms, such as the IMPULS model (Lichtblau et al., 2015) and the Manufacturing Readiness Index (Jung et al., 2016). Only a few frameworks address SMEs, and none of them is explicitly designed for logistics SMEs. For example, the framework developed by Qin et al. (2016) identifies enabling technologies for automation and intelligence, but it does not translate these insights into a structured readiness index or clear benchmarking levels. Similarly, the guidelines proposed by Anderl and Fleischer (2019) (VDMA) introduce a five-phase toolbox (preparation, analysis, creativity, evaluation and implementation) to support I4.0 adoption; however, they do not define explicit criteria or metrics for measuring readiness or tracking progress across phases.
Models tailored to SMEs often overlook managerial, financial, cultural and sustainability dimensions or lack concrete mechanisms for assessing readiness and costs, managing the transition towards I4.0.
This creates a methodological and practical gap: logistics SMEs lack an integrated tool that (1) captures their managerial and operational readiness for I4.0 in logistics processes and (2) links this readiness to the expected economic and sustainability impacts of specific technological options.
Based on the considerations above, this paper addresses the following overarching research question:
How can logistics SMEs systematically assess their readiness for I4.0 in warehouse management, and link this readiness to the expected economic and sustainability impacts of I4.0 technology investments?
To answer this question, the study adopts a dual perspective. Firstly, it develops a readiness model that captures the key organizational and operational dimensions enabling logistics SMEs to adopt I4.0. Secondly, it integrates this readiness diagnosis with an impact assessment module that supports ex ante and ex post evaluation of the economic and sustainability implications of alternative technology scenarios.
Specifically, this study introduces the Logistics Industry 4.0 Readiness and Assessment (LIRA) strategic dashboard to assess the managerial and operational readiness of logistics SMEs. The tool combines a logistics readiness model with a profitability and sustainability evaluation approach that is based on an adapted version of the ROI 4.0 framework, tailored to the technological domain of warehouse management. The dashboard is based on six dimensions that shape logistics readiness for I4.0 – Collaboration, Connectivity, Adaptiveness, Integration, Autonomous Control and Cognition – and structurally integrates organizational culture, leadership and employee acceptance alongside process standardization, information flows and systems integration. In doing so, it addresses sector- and size-specific constraints of logistics SMEs in terms of resources and capabilities.
Building on an adapted version of ROI 4.0, LIRA embeds readiness into an integrated decision-support system that translates diagnostic results into economic and non-economic impact indicators, including selected environmental sustainability metrics. The primary contribution of the dashboard is therefore to provide logistics SMEs with a clear, staged roadmap to identify specific bottlenecks, prioritize targeted interventions and evaluate the expected returns and costs of I4.0 investments in warehouse management.
By addressing these critical aspects, this study contributes to the growing body of knowledge on I4.0 adoption, particularly within SMEs in the logistics sector and offers actionable insights for fostering sustainable and innovative logistics practices. The paper is structured as follows: Section 2 provides a theoretical overview of the factors influencing the diffusion of I4.0 technology in logistics SMEs. Section 3 outlines the development and operationalization of the LIRA dashboard. Section 4 discusses LIRA's potential as a strategic tool, while the final section highlights limitations and future research directions.
2. Literature background on I4.0 readiness and impact assessment in logistics SMEs
2.1 Readiness dimensions for I4.0 adoption in logistics SMEs in warehouse management
The literature conceptualizes I4.0 readiness through a set of organizational dimensions that influence the capacity of logistics SMEs to adopt digital technologies (Hofman and Rüsch, 2017; Kayikci, 2018; Sony and Naik, 2020).
The implementation of I4.0 technologies within the logistics SMEs introduces significant organizational change and increased system complexity (Winkelhaus and Grosse, 2020). Specifically, logistics activities must adapt to the dynamic requirements of decentralized production environments by leveraging smart technologies for real-time monitoring, transport management and risk mitigation (Hofmann and Rusch, 2017).
Many logistics SMEs still struggle to adopt I4.0 technologies due to the challenges that need to be addressed. Among these, financial constraints, fragmented strategies, infrastructural and cultural barriers (Perotti et al., 2022b) are notable. This is true for all logistics activities, including warehousing, which have evolved from repositories for inventory into multi-functional logistics hubs (Onstein et al., 2020), through which goods, information and services flow. This evolution has necessitated meeting higher requirements in terms of efficiency and service level fulfilment (Kembro, J.H. et al., 2018). Part of the literature agrees that benefits derived from the adoption of I4.0 technologies [radio-frequency identification (RFID) scanners and tags, IoT sensors, automated guided vehicles (AGVs) and Autonomous Mobile Robots (AMRs)] affect warehouse operations by optimizing processes through flexibility increase, traceability and visibility of the goods handled within warehouses (Khan et al., 2022; Perotti et al., 2022a, b). In view thereof, assessing the readiness of logistics SMEs is therefore crucial to enable them to fully exploit the benefits associated with the implementation of I4.0. To achieve this, firms must be adequately prepared at the organizational, strategic and financial levels (Balasingham, 2016).
To assess an organization's readiness for I4.0 technologies, various readiness models have been developed and used. Precisely, they are used to assess the organization's preparedness, including its resources, conditions and attitudes, to achieve specific goals. However, current ones, while comprehensive in some aspects, often lack SME-specific adaptations, focusing more on technical, production and technological criteria without considering managerial criteria and logistics, which is a key aspect of SMEs' propensity.
In view thereof, we considered Kayikci's (2018) six characteristics used to build an efficient and sustainable logistics system and adapted them to serve as both managerial and operational dimensions to assess the readiness of logistics SMEs' warehouse activities, particularly the movement of goods.
Collaboration is defined as inter-organizational clusters to enhance efficiency and reliability (Kayikci, 2018). This concept is emphasized by Cichosz et al. (2020), who argue that collaboration is a strategic alliance in which companies share physical facilities and technological knowledge.
Adaptiveness refers to the ability to respond dynamically to internal and external changes (Kayikci, 2018). Essentially, an “adaptability-oriented” enterprise promptly adjusts autonomously and addresses new challenges (Kortmann, 2015).
Kayikci's (2018) cognition dimension describes intelligent machines that learn, adapt and make decisions to optimize operations. However, we adapted it by assuming a managerial perspective. From this standpoint, we can analyse employees' resistance to or acceptance of change and top management commitment (Sony and Naik, 2020).
Connectivity refers to a technology's ability to serve as an interface among systems, devices and processes, enabling communication and information transfer (Kayikci, 2018). This level of transparency is vital not only for monitoring operations but also for implementing strategies that optimize production efficiency. The exchange of data is pivotal for establishing processes that are tightly coupled with digital decision-making systems (Charles et al., 2023).
Integration refers to the linkage among systems and processes to facilitate real-time operations, creating a unified system where human factors, departmental relationships and technology operate as a unique, productive flow (Kayikci, 2018; Pérez-Lara et al., 2020).
Finally, Autonomous Control enables decentralized decision-making through which industrial operations can become more self-sufficient and responsive (Cañ;as et al., 2021).
2.2 Capital budgeting and performance measurement systems for investment evaluation: the need to balance reliability and feasibility
Firms typically employ capital-budgeting techniques to support structured, financially grounded investment decisions (Brealey et al., 2020). Among these methods, Net Present Value (NPV) is considered a central investment appraisal tool that measures value creation by discounting future cash flows at a rate that reflects project risk, thereby accounting for the timing of costs and benefits (Gaspars-Wieloch, 2019). A similarly prominent metric is the Internal Rate of Return (IRR), defined as the discount rate that sets the NPV to zero. Its intuitive percentage format facilitates comparisons, but it can produce multiple (or no) solutions for non-conventional cash flows and may mis-rank mutually exclusive projects that differ in scale or timing (Patrick and French, 2016). Simpler indicators include the Payback Period, which estimates the time needed to recover the initial outlay. Yet, its basic version ignores discounting, whereas the discounted payback method applies it but still ignores value created after the payback point (Hajdasiński, 1993). Another simple alternative is the Accounting Rate of Return (ARR), a profitability measure based on accounting earnings and book values rather than discounted cash flows; although often used for internal performance assessment, ARR provides only a partial view of investment value because it does not capture systematic risk and is insufficient for assessing future profitability or valuing investments (Pennman, 1991).
Finally, another important metric that supports investment decisions is residual income (RI) (Bromwich and Walker, 1998), as well as its commercial implementation, Economic Value Added (Stewart, 1991). Unlike discounted cash flow techniques, which require explicit forecasts of future cash flows, these measures can be derived largely from mandatory financial statements – using operating profit and the book value of invested capital – combined with an estimate of the firm's cost of capital (Magni, 2009; Arena and Azzone, 2005). While RI is sensitive to accounting choices because it is based on accounting figures rather than market values, it remains accessible to SMEs, which often lack sophisticated accounting and information systems or reliable forward-looking cash flow projections (Bromwich and Walker, 1998; Bahri et al., 2011). This leads to one of the core reasons why the study adopts ROI 4.0: as a performance measurement system (PMS) that incorporates the RI metric, ROI 4.0 is particularly suitable for SMEs that cannot easily implement more data-intensive valuation techniques such as NPV or IRR (Cinquini et al., 2019; Giannetti et al., 2021).
In any case, capital budgeting techniques, when used in isolation, offer a financial view of the investment (Lilian Chan, 2004). They rely on an analysis conducted from a predominantly monetary standpoint and therefore tend to overlook non-financial impacts (Kraus et al., 2024). Because I4.0 investments reshape organizational processes and often require major redesign, financial metrics should be complemented with indicators of customer satisfaction, output and process quality, operational efficiency, production flexibility, technology adoption, sustainability (e.g. emissions, waste), employee well-being, stakeholder perceptions, internal innovation and long-term strategic capability development (AL-Khatib, 2025; Dai and Vasarhelyi, 2023; Chiarini, 2020).
To capture both financial and non-financial impacts of investment decisions, management accounting literature supports the use of holistic PMS that assesses multiple dimensions of strategic effectiveness (Franco-Santos et al., 2012; Jochem et al., 2010). Though not originally designed specifically for evaluating I4.0 investments, these systems still offer the opportunity to obtain a comprehensive view of their impact on business processes and overall performance (Frederico et al., 2021).
Several alternative PMSs potentially suitable for assessing investments in innovative technologies have been proposed (Franco-Santos et al., 2012; Kumar et al., 2008). The Performance Pyramid (Lynch and Cross, 1991) offers a hierarchical link between strategic vision and operational measures, emphasizing the integration of financial and non-financial performance indicators. The Balanced Scorecard (Kaplan and Norton, 1992, 2004) broadens performance measurement beyond traditional financial metrics by incorporating customer, internal process and learning and growth perspectives. More recent versions also integrate sustainability measures to capture environmental and social performance (Hansen and Schaltegger, 2016). The Performance Prism (Neely et al., 2001, 2002) adopts a stakeholder-centred approach that evaluates stakeholder satisfaction, their contribution to the organization's success and the effectiveness of the organization's strategies, processes and capabilities. An alternative approach is the Intangible Assets Monitor (Sveiby, 1997; Van Criekingen et al., 2022), which focuses on human, structural and relational capital to highlight their contributions to the effectiveness of the strategy and its implementation.
Without the intention of identifying a “best” option – given the well-established view that no PMS is universally appropriate and that each system requires contextual adaptation (Melnyk et al., 2014; Wouters and Wilderom, 2008) – existing PMS frameworks nonetheless exhibit significant limitations when applied to SMEs (Sgrò et al., 2020). In particular, they often require strong analytical capabilities, formal planning processes and advanced information systems that SMEs typically lack. Moreover, their complexity and extensive use of multiple financial and non-financial indicators – originally designed to monitor performance in large organizations – make them difficult to implement in smaller, more informal and resource-constrained contexts (Lueg and Vu, 2015).
Given these challenges, the aim of this research is not to develop new financial techniques for evaluating investments in I4.0 technologies within logistics. Rather, it seeks to enhance the reliability of evaluations supported by existing logics and tools, particularly in SME contexts where managerial competencies are often limited.
This focus on the SME context aligns with a growing body of research in which scholars have proposed adaptations of existing PMSs or developed SME-specific frameworks to better meet the needs of smaller organizations (Garengo and Biazzo, 2012; Cocca and Alberti, 2010; Sousa and Aspinwall, 2010). ROI 4.0 represents a prominent example of the latter, as it is a comprehensive PMS specifically designed to address SMEs' informational needs while remaining fully applicable in environments where data-collection resources are inherently limited (Cinquini et al., 2019; Giannetti et al., 2021). Unlike the other PMSs discussed, this framework was explicitly developed to assess both the economic feasibility of – and the broader impacts associated with – the adoption of I4.0 solutions and related investments in SMEs, as will be discussed in Section 3.5. This specificity constitutes a further key reason for its adoption in the present study.
3. Proposing LIRA: a strategic dashboard for Logistics I4.0 readiness
3.1 Dashboard development
This study employs a conceptual research approach to develop a Dashboard-Based Decision Support System (DSS) that helps logistics SMEs assess their I4.0 readiness and evaluate post-implementation benefits (Power and Sharda, 2007) within warehouse activities. The methodology follows a literature-driven model development process, integrating key decision-support and I4.0 readiness frameworks (Meredith, 1993; Gregor, 2006; Yigitbasioglu and Velcu, 2012). DSSs are interactive tools that enhance decision-making by combining data analysis, modelling and visualization (Power, 2002). They are categorized into Model-Driven, Data-Driven, Knowledge-Driven, Communication-Driven and Document-Driven Systems, with dashboards playing a key role in Data-Driven DSS by providing real-time monitoring, trend analysis and performance tracking (Few, 2006). Dashboards visually summarize complex data, supporting faster decision-making, and are classified into three types: Operational, Analytical and Strategic (Yigitbasioglu and Velcu, 2012). Operational dashboards focus on real-time monitoring, Analytical dashboards enable in-depth data exploration, while strategic dashboards facilitate long-term decision-making and performance assessment (Pauwels et al., 2009). Effective dashboards adhere to key design principles, including simplicity, relevance, interactivity and contextual visualization, to enhance usability and data comprehension while minimizing cognitive overload (Few, 2006; Jiang et al., 2022). As dashboards transform data into actionable insights, they are essential for I4.0 adoption, allowing SMEs to assess technological readiness, financial feasibility and environmental impact before investing in digital transformation (Pranggono and Arabo, 2021). Given the study's objectives – evaluating I4.0 readiness and forecasting long-term impacts – the adoption of a strategic dashboard is the most appropriate approach. Strategic dashboards support high-level decision-making, aligning technological, operational, financial and sustainability goals over time (Pauwels et al., 2009; Yigitbasioglu and Velcu, 2012). Unlike operational dashboards, which focus on real-time monitoring, or analytical dashboards, which emphasize data exploration, strategic dashboards enable longitudinal performance assessment, trend analysis and strategic goal alignment. This makes them particularly valuable for guiding digital transformation in logistics SMEs. Additionally, strategic dashboards provide a structured framework for integrating diverse Key Performance Indicators (KPIs), helping managers prioritize initiatives based on readiness levels and expected return on investment (Few, 2006; Jiang et al., 2022).
Given the conceptual nature of this study, validation is conducted through comparative analysis with existing DSS and I4.0 frameworks, alignment with established dashboard design principles, and the development of a structured roadmap for future empirical testing (Meredith, 1993; Gregor, 2006; Pauwels et al., 2009). This research advances the field of DSS and I4.0 by proposing a structured decision-support framework that integrates readiness assessment and ROI evaluation, offering SMEs a theoretical foundation for digital transformation, while laying the groundwork for future empirical validation (Few, 2006; Yigitbasioglu and Velcu, 2012).
In particular, the assessment of an SME's readiness for I4.0 progresses through a sequence of four stages (Figure 1). The first stage evaluates the Foundational Building Blocks (FBBs), which are essential for measuring the organization's propensity towards I4.0. This stage examines core organizational characteristics – Collaboration, Adaptiveness and Cognition – to determine whether the SME possesses the necessary managerial mindset.
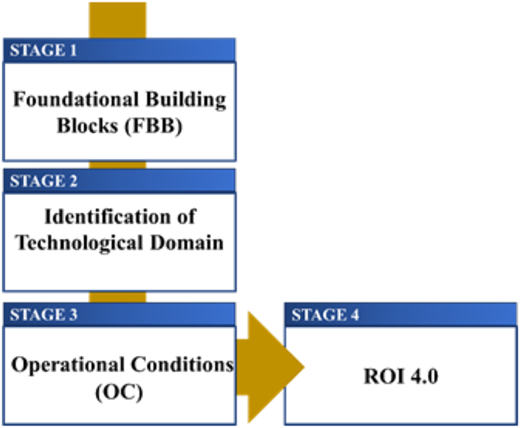
Following this, the second stage involves identifying the Technological Domain. This stage selects a specific area of the SME's operations – i.e. the movement of goods within a warehouse – and identifies pertinent I4.0 technologies.
The third stage, the Operational Conditions (OCs) assessment, evaluates the current state of the SME's operations within the chosen technological domain. This stage provides a baseline measurement of existing practices and identifies gaps that need to be addressed before or alongside technology implementation.
These three stages are prerequisites for constructing the Overall Readiness Index (ORI). ORI provides a quantifiable measure of the SME's preparedness for I4.0, informing strategic decisions regarding technology adoption. Once the readiness level has been assessed, the fourth stage involves applying an adapted ROI 4.0 model to estimate the expected benefits of I4.0 investments, as standard ROI 4.0 assumes an optimal level of readiness, meaning that the SME is already in ideal conditions to implement and fully leverage I4.0 technologies.
Therefore, using a basic list of indicators, we propose a collaborative methodology to ensure a more accurate and context-specific evaluation of SMEs' I4.0 investments, by integrating readiness assessment with ROI 4.0-driven profitability analysis to support informed decision-making.
3.2 FBBs of organizational readiness
The initial stage of the assessment process focuses on evaluating the FBBs. These elements, encompassing Collaboration, Adaptiveness and Cognition, are critical for determining whether the SME possesses the necessary managerial attitudes and organizational features to successfully adopt and leverage I4.0 technologies. This foundational assessment provides a crucial understanding of the organization's underlying readiness for digital transformation (see Appendix 1). To quantify the FBB, each dimension's score is derived by averaging its scores (on a 1–5 scale) and then converting the result to a percentage. The final FBB score is the arithmetic mean of these three-dimensional percentages.
Collaboration evaluates the depth of inter-organizational relationships, focusing on resource sharing (physical and intangible assets) and strategic partnerships (Fawcett et al., 2012; Cao and Zhang, 2011). Resource sharing helps SMEs overcome scale limitations, while strategically partnerships are vital for a “relational view” of competitive advantage. High Collaboration scores signify readiness for interconnected I4.0 ecosystems, enabling access to resources and opportunities; low scores indicate a critical development area (Diamantopoulos and Winklhofer, 2001; Nardo et al., 2005).
Adaptiveness, crucial in the dynamic I4.0 environment, assesses an SME's agility through responsiveness (managing disruptions and aligning with supply chain resilience – Chopra and Sodhi, 2014; Lee, 2004) and the flexibility of processes (ease of modifying operations, reflecting agile principles – Sharifi and Zhang, 1999). High Adaptiveness scores indicate capacity for I4.0 implementation and continuous optimization; low scores suggest hindering rigidity (Diamantopoulos and Winklhofer, 2001; Nardo et al., 2005).
Cognition assesses an organization's understanding and acceptance of I4.0, recognizing the importance of culture and workforce readiness in conjunction with technology (Kane et al., 2015). It considers management commitment (leadership's role in driving adoption – Sony and Naik, 2020) and employee acceptance (I4.0 knowledge and openness), which is crucial given potential disruptions to work practices. Low Cognition scores, particularly in employee acceptance, represent significant barriers, necessitating training, communication and change management (Diamantopoulos and Winklhofer, 2001; Nardo et al., 2005).
The FBB score serves as a crucial indicator of an SME's organizational readiness for I4.0. A high score suggests a strong foundation, significantly increasing the likelihood of successful I4.0 implementation. Conversely, a low FBB score reveals significant internal weaknesses, such as isolation, rigidity or resistance to change, presenting critical barriers that must be addressed before or alongside substantial investments in I4.0 technology to avoid potential failure (Diamantopoulos and Winklhofer, 2001; Nardo et al., 2005).
3.3 Definition of technological domain: warehouse logistics
Each warehouse designs its goods-movement processes according to its specific operational requirements, encompassing the receipt, storage, localization and dispatch of items across inbound, storage and outbound areas. In many cases, these flows are still managed through manual or only partially digitalized procedures, which limit real-time monitoring and increase the risk of misplacements, overstocking and processing delays. The adoption of I4.0 technologies enables continuous tracking and real-time data integration, thereby improving visibility, reducing lead times and enhancing the overall efficiency and resilience of warehouse operations (Khan et al., 2022). Accordingly, the second stage of the assessment focuses on identifying I4.0 technologies that enhance goods movement within warehousing. This step is crucial, as warehouse efficiency directly impacts throughput and constitutes a significant portion of operating costs, including labour and energy consumption (Abdirad and Krishnan, 2021). To optimize these processes, three key technologies were identified: augmented reality (AR), AGVs and RFID.
AR enhances warehouse operations by providing real-time visual guidance and feedback, streamlining picking processes and reducing search times and errors. AR facilitates faster order fulfilment and minimizes operational disruptions (Rejeb et al., 2020).
AGVs play a critical role in automating material transportation within warehouses. These systems optimize goods flow, reduce reliance on traditional manual handling and contribute to a more sustainable operation by minimizing energy consumption (Zhang et al., 2023).
RFID technology enhances inventory management by providing real-time tracking, enabling seamless integration with existing systems and improving overall visibility. By reducing errors and expediting order fulfilment, RFID significantly enhances warehouse efficiency (Sarac et al., 2010).
The combined implementation of these I4.0 technologies in warehouse logistics results in significant reductions in energy consumption, errors and operational costs, enhancing operational efficiency, accuracy and sustainability (Wang et al., 2016). The detailed applications of these technologies are shown in Table 1.
Movement of goods' technological domain
| Movement of goods | |
|---|---|
| AR |
|
| AGVs, autonomous robots |
|
| Real-life RFID |
|
3.4 OCs' assessment in the technological domain
The third stage of assessment focuses on evaluating OCs within a specific technological domain. In this instance, the focus is on warehousing operations, specifically on the movement of goods. This contextualized approach ensures that the assessment is not merely theoretical but directly relevant to the SME's operational reality. The purpose of this stage is to determine the SME's preparedness for adopting I4.0 technologies within the specific context of its warehousing operation, building upon the foundational readiness established in the first stage ( Appendix 2).
Autonomous Control evaluates the preconditions for decentralized decision-making and streamlined processes. This involves assessing the degree of autonomy warehouse staff have in making operational decisions without constant managerial oversight (Leach et al., 2003) and the existence of standardized procedures (SOPs) that provide the necessary structure for automation (Colombo et al., 2017). A low Autonomous Control score suggests a rigid, hierarchical structure with limited employee empowerment and poorly defined processes, hindering I4.0 adoption. A high score indicates a more agile, decentralized environment with well-documented procedures, creating a strong foundation for I4.0 technologies (Diamantopoulos and Winklhofer, 2001; Nardo et al., 2005).
Connectivity assesses the effectiveness of information flow concerning goods movement. This includes evaluating the traceability of goods (Hofmann and Rüsch, 2017), the efficiency of information transfer between departments (Li et al., 2006) and the coordination among different warehousing activities (Stank et al., 2001). A low Connectivity score indicates poor visibility, slow information transfer and a lack of coordination, all of which significantly hinder the real-time data flow necessary for I4.0 technologies. A high score signifies good visibility, relatively fast and accurate information sharing and well-coordinated activities, creating a solid foundation for the seamless data exchange characteristic of I4.0 (Diamantopoulos and Winklhofer, 2001; Nardo et al., 2005).
Finally, Integration assesses how effectively the various systems and processes involved in goods movement function as a unified whole before I4.0 implementation. This is evaluated through the degree of systems integration (Hofmann and Rüsch, 2017; Winkelhaus and Grosse, 2020) and overall order fulfilment performance, a key indicator of operational efficiency (Gunasekaran et al., 2004; Stalk, 2012). A low Integration score reveals fragmented systems and inefficient processes, creating significant barriers to I4.0 adoption as technologies like AR, AGVs/AMRs and RFID rely on integrated data and streamlined workflows. A high score suggests relatively well-integrated systems and processes, providing a solid foundation for a “smart” warehouse (Diamantopoulos and Winklhofer, 2001; Nardo et al., 2005).
The OC score assesses the operational suitability within a specific context, complementing the FBB's measure of general organizational capacity. A high OC score suggests the SME's current warehousing operations provide a strong operational foundation, making them more aligned with the requirements for adopting targeted I4.0 technologies. Conversely, a low OC score signals significant operational deficiencies (like rigidity, poor information flow or fragmentation) that represent critical barriers, indicating operational improvements are needed before I4.0 investment in warehousing (Diamantopoulos and Winklhofer, 2001; Nardo et al., 2005).
The combination of the FBB and OC assessments yields an ORI, calculated by averaging the partial scores of the FBB and OC. It combines the insights from both the FBB and the OC into a comprehensive score, which provides a holistic view of an SME's readiness for I4.0 (Nardo et al., 2005).
Based on the calculated ORI, SMEs are classified into four distinct readiness levels. Table 2 outlines these classes, their corresponding ORI percentage ranges, and a qualitative description of each level's implications for I4.0 adoption.
Industry 4.0 readiness classification
| Readiness class | ORI range | Qualitative description |
|---|---|---|
| Very low | <20% | Both FBB and OC are severely underdeveloped. The company lacks a managerial mindset (FBB) and has significant operational inefficiencies (OC), requiring major structural and process improvements before any I4.0 investments can be effective |
| Low | 20% < x<40% | Basic FBB elements (e.g. minimal collaboration, adaptiveness or cognition) may be emerging, but OC is still largely immature. The organization shows only limited capacity to integrate or control new technologies, suggesting that substantial investments in readiness are needed |
| Moderate | 40% < x<60% | FBB and OC are partially developed. While there is some managerial commitment and a nascent strategic orientation, operational processes remain only moderately aligned with I4.0 requirements. Improvements in system integration and process autonomy are needed to fully benefit from digital investments |
| High | 60% < x<80% | FBB is strong, reflecting a sound managerial mindset, and OC is fairly mature. The company is well-prepared in terms of strategic orientation and operational practices; however, minor gaps (such as in process standardization or real-time data flow) still limit the full leverage of I4.0 benefits |
| Veery high | >80 | Both FBB and OC are robust. The organization demonstrates excellent managerial readiness – with effective collaboration, adaptability and cognition – and its OCs are highly optimized. This profile indicates optimal preparedness for a successful Industry 4.0 transformation |
3.5 ROI 4.0 framework and its adaptation to warehouse management
3.5.1 ROI 4.0
The ROI 4.0 framework is an investment-evaluation-oriented PMS designed for SMEs adopting I4.0 technologies to improve core processes and assess both financial and non-financial returns (Giannetti et al., 2021; Cinquini et al., 2019). It integrates the RI formula with the investment's cost of capital, offering a reliable profitability assessment. The framework delivers results aligned with the NPV method, simplifying value creation evaluation over time in both ex ante and post-implementation analyses (Bromwich and Walker, 1998; Cinquini et al., 2019). Key to this framework is its combination of traditional financial metrics (costs, revenues, capital) and non-financial metrics (volume, quality, activity cost, timeframe), linking process improvements to financial outcomes. This allows ROI 4.0 to account for both financial and non-financial performance drivers, including the impacts of I4.0 investments on intangible assets, often hard to quantify in monetary terms, offering a more comprehensive view of investment value.
The ROI 4.0 model is rooted in the concept of RI, whose formula can be expressed as:
where:
RI = Residual Operating Income.
NOPAT = Net Operating Income after taxes, which is calculated as
where EBIT stands for Earnings Before Interest and Taxes.
WACC = Weighted Average Cost of Capital, which can be calculated as
where
Kd = Cost of Debt (after-tax if not adjusted separately)
Ke = Cost of Equity
α = Proportion of Debt in the capital structure, i.e. Financial Debt/(Financial Debt + Equity)
(1−α) = Proportion of Equity in the capital structure, i.e. Equity/(Financial Debt + Equity).
NOIC = Net Operating Invested Capital, which is given by
(Fixed Assets + Inventories + Receivables) − (Operating Liabilities).
Alternatively, it can be expressed as:
where:
RI = Residual Operating Income
WACC = Weighted Average Cost of Capital
ROIn = Net Return on Investment (Net Operating Income after taxes/Net Operating Invested Capital)
NOIC = Net Operating Invested Capital.
Using either formula to calculate RI enables evaluation of economic value created by the company, by divisions or business units or by specific investments. In this context, “value creation” refers to a company's economic capital, which is essentially its shareholders' equity based on expected future cash flows from dividends or capital gains. Value is realized when strategic, tactical and operational choices improve expected profitability, increasing shareholder potential returns and economic capital. This growth results not only from higher projected cash flows but also from their associated risk. If cash flows increase but risk rises proportionally, economic capital may fall. Thus, value creation typically requires greater expected cash flows with equal or lower risk than before the investment.
The key criterion for driving value creation – i.e. growth in economic capital – is ensuring that investment returns exceed the overall cost of capital, including both equity and debt financing.
The second RI formula assesses whether this condition is met by measuring the difference between ROIn and WACC. It also enables calculation of the absolute economic value generated over a given period based on invested capital (NOIC). If RI remains positive across multiple future periods, the present value of those returns represents the total value created, as it consolidates the discounted economic value over time. In essence, calculating the present value of future RI – regardless of the estimation method – can be summarized as follows:
Total Value Creation (Increase in Economic Capital) = Present Value of Future Residual Income.
This value creation is influenced by a set of value drivers, including all tangible and intangible factors that impact the variables used in the RI formulas.
As shown in Figure 2, ROI 4.0 organizes these value drivers into a three-level hierarchy, as they directly influence the parameters in the two RI calculation formulas.
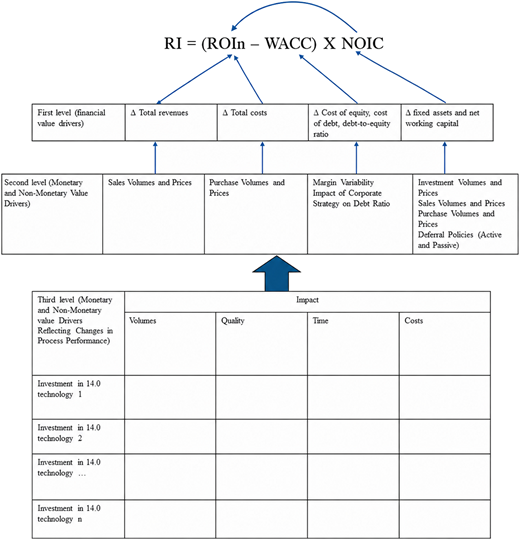
At the third and lowest level, investments in I4.0 technologies serve as the foundation, influencing both the amount of capital invested and key process performance. Effects on process performance, considered and assessed at the third level through the value drivers of volume, quality, time and cost, shape the second-level monetary and non-monetary value drivers. These second-level value drivers, in turn, act as a bridge between process performance and broader business outcomes, which are reflected in the financial value drivers at the first level. Finally, the first and highest level comprises financial value drivers – such as total revenues, costs, cost of equity, cost of debt, debt-to-equity ratio, fixed assets and net working capital – that directly impact the value of RI.
The ROI 4.0 model (Figure 2) links I4.0 technologies' impact on process performance to overall business financial performance, enabling both ex ante and ex post evaluations of their benefits.
ROI 4.0 can be considered both a method for evaluating investments and a tool for managing investment performance. ROI 4.0 integrates financial and non-financial metrics to support strategic management, decision-making and organizational performance evaluation (Franco-Santos et al., 2012). Like similar PMS, ROI 4.0 establishes cause-and-effect relationships among measures. However, PMS causal links often rely on logical assumptions rather than empirical evidence, making even widely used systems (e.g. Balanced Scorecard) vulnerable to logical fallacies and contextual invalidation (Nørreklit et al., 2012; Kasperskaya and Tayles, 2013). For instance, assuming customer loyalty always drives profitability ignores that loyal customers are not always profitable, illustrating the post-hoc fallacy of confusing correlation with causation (Nørreklit, 2003). Nevertheless, assumed causal links remain useful for facilitating strategic discussions and refining performance measures (Tuomela, 2005; Franco-Santos et al., 2012). Empirical studies provide some support for their reliability; for instance, Kober and Northcott (2021) found statistically significant causal links in a public-sector PMS, showing that well-designed systems can improve decision-making and performance management (Franco-Santos et al., 2012). Yet, the effectiveness of causal links in guiding managerial action, decision-making and performance management significantly improves when empirically tested and adjusted to reduce biases and incorrect assumptions (Ittner and Larcker, 2003; Kasperskaya and Tayles, 2013). Therefore, PMS such as ROI 4.0 should be empirically tested for coherence and validity within the specific company (Tuomela, 2005), potentially requiring contextual adaptations through the identification of alternative or additional measures and causal links.
3.5.2 ROI 4.0 adaptation to warehouse management
Applying ROI 4.0 to warehouse management in logistics requires a clear, contextual understanding and classification of relevant costs to accurately assess I4.0 investments, since the model was originally designed for manufacturing.
To achieve this, we adopt an activity-based costing perspective, which allows costs to be allocated to the activities that generate them. We employ Porter's (1985) value chain framework, distinguishing primary activities, directly involved in value creation, from support activities, which provide the infrastructure, coordination and resources needed for effective primary activities and sustained performance. Finally, we integrate this approach with Richards' (2017) classification of warehouse costs and activities to reliably map costs to their respective activities.
In this structure:
Primary activities in warehouse management include storage and handling, which contribute to costs in distinct ways (Richards, 2017). Storage costs encompass space-related expenses (rent, depreciation, utilities, insurance and taxes), labour (wages, safety gear, training and welfare) and facility maintenance (repairs, cleaning, security and waste disposal). Handling costs include direct labour, equipment acquisition, depreciation and leasing, and variable operating costs like fuel and packaging.
Support activities, including administration, IT, finance, human resources and sales/marketing, provide essential indirect services (Richards, 2017). Administrative costs include managerial salaries, office equipment and overheads. IT costs cover warehouse management systems, hardware, software and cybersecurity. Finance and HR costs encompass salaries, insurance, audit fees, legal services and employee programs. Sales and marketing costs, crucial for third-party logistics providers, include advertising, promotions and business development.
Following Juran and Gryna (1988), we propose incorporating quality costs, classified into prevention, appraisal, internal failure and external failure costs (Giannetti, 2013). Prevention costs originate from proactive measures to avoid defects in design, procurement, production or delivery. Appraisal costs cover inspections, testing and monitoring to ensure quality standards. Internal failure costs arise from defects detected before reaching customers and include costs associated with rework, scrap or process inefficiencies. External failure costs occur when defects reach customers, leading to complaints, returns or warranty claims. Sandoval-Chavez and Beruvides (1998) further expand this classification to include opportunity costs, such as losses from poor delivery, inadequate material handling and underutilized capacity. Finally, we propose adding the sustainability dimension as a third-level value driver, which can be monitored through various indicators (e.g. carbon footprint, waste and water consumption) tailored to specific business needs.
Based on this, we adapted the ROI 4.0 structure (Figure 3) to reflect the value drivers, costs and activities inherent to warehouse management. Figure 3 illustrates the adapted ROI 4.0 model, which summarizes how logistics SMEs can evaluate both monetary and non-monetary impacts associated with I4.0 adoption. The structure clarifies the relationships and interconnections between financial value drivers (first level), the underlying operational and strategic factors that generate them (second level), and the process-related performance changes that ultimately produce impact (third level).
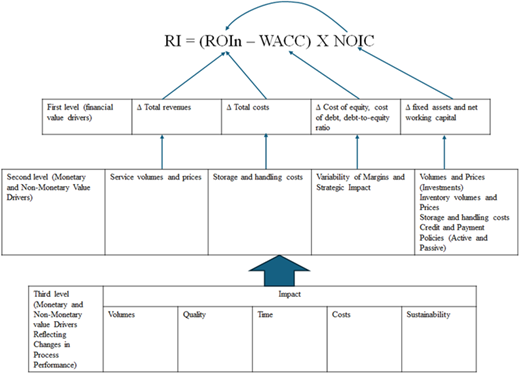
Since our analysis focuses on the primary activities – handling and storage–of warehouse management operations (Richards, 2017), we illustrate possible performance indicators for assessing these activities. These indicators can be used to estimate third-level monetary and non-monetary value drivers, supporting the evaluation of the impact of I4.0 technologies on process and business performance. To differentiate between primary activities, we present separate tables for handling (Table 3) and storage (Table 4), including acronyms for the parameters used, as space constraints did not allow for the use of full terms.
Handling the third-level value drivers' impact on handling
| Third level | Impact on handling | |||||||||||||||||||
|---|---|---|---|---|---|---|---|---|---|---|---|---|---|---|---|---|---|---|---|---|
| Volumes | Quality | Time | Costs | Sustainability | ||||||||||||||||
| Technology | LR | EU | FX | … | MP | MI | HF | … | IT | HT | HS | … | PW | MC | EC | … | CF | WR | WS | … |
| AR | ||||||||||||||||||||
| AGV | ||||||||||||||||||||
| RFID | ||||||||||||||||||||
Note(s): Volumes: • Labour Productivity (LP) • Equiment Utilization (EU) • Flexibility (FX); Quality: • Material Damage Prevention (MP) • Materials Inspection (MI) • Handling Failures (HE); Time: • Idle Time (IT) • Handling Time (Handling time (Receiving, unloading, loading, dispatch …) HT • Health & Security (HS); Costs: • Personnel Wages (PW) • Mainatene Costs (MC) • Energy Costs (EC); Sustainbility: • Carbon Footprint (CF) • Waste Reduction (WR) • Worker Satisfaction (WS)
Handling the third-level value drivers' impact on storage activities
| Third level | Impact on storage activities | |||||||||||||||||||
|---|---|---|---|---|---|---|---|---|---|---|---|---|---|---|---|---|---|---|---|---|
| Volumes | Quality | Time | Costs | Sustainability | ||||||||||||||||
| Technology | SO | IA | FX | … | SP | SI | SF | … | DP | RT | HS | … | AC | MC | EC | … | CF | WR | WY | … |
| AR | ||||||||||||||||||||
| AGV | ||||||||||||||||||||
| RFID | ||||||||||||||||||||
Note(s): Volumes: • Space utilization/layout optimization (SO) • Inventory placement accuracy (IA) • Flexibility (FX); Quality: • Storage damage preventation (SP) • Storage inspection (SI) • Storage failures (SF); Time: • Slotting optimization/reshuffling time (DP) • Inventory retrieval time • Health & Security (HS); Costs: • Acquisition/rent costs (AC) • Mainatene Costs (MCz) • Energy Costs (ECs); Sustainbility: • Carbon Footprint (CF) • Waste Reduction (WR) • Worker Satisfaction (WS)
We emphasize that the indicators listed for each third-level value driver, such as labour productivity (LP) and equipment utilization (EU) under “volumes”, are examples and should be adjusted based on organizational needs and context (Franco-Santos et al., 2012). Furthermore, both for this reason and due to space constraints, we include only a selection of possible indicators rather than a comprehensive list. The rows of Tables 3 and 4 allow for the addition of specific I4.0 technologies, enabling the assessment of their economic feasibility and financial and non-financial impacts. As an example, we include only I4.0 technologies within the defined technological domain.
Various methods exist for selecting and estimating indicators for third-level value drivers, but we recommend using an Activity-Based Management (ABM) approach (Plowman, 2017). ABM facilitates strategic decision-making by identifying how activities and costs contribute to creating value and enhancing performance (Armstrong, 2002). The approach starts with identifying the value propositions most appreciated by logistics customers, such as delivery speed, reliability, flexibility and real-time tracking (Richards, 2017). A backward analysis then traces these attributes to the warehouse activities responsible for delivering them. This structured analysis helps evaluate how warehouse activities impact measurable indicators, such as LP and EU. By linking financial and non-financial aspects to business activities, ABM facilitates an understanding and quantification of the benefits of adopting I4.0 technologies. We recommend distinguishing between measurable financial and non-financial “outputs” and qualitative, hard-to-measure non-financial “outcomes” (Ittner, 2008; Figge et al., 2002). Outputs refer to quantifiable elements, such as CO2 emissions or energy consumption, which are assessed using parametric indicators. Outcomes, in contrast, include intangible factors such as corporate reputation, employee development and strategic growth opportunities (Van Criekingen et al., 2022; Zéghal and Maaloul, 2011). Although social factors are often treated as outcomes, they can sometimes be partially measured through indicators like employee satisfaction or retention rates. For SMEs with limited financial resources, low-cost practices such as brief anonymous surveys, suggestion boxes, informal feedback discussions or simple monitoring of absenteeism and voluntary turnover can support this measurement effort. Nonetheless, certain aspects, including the ability to attract highly qualified personnel, remain inherently difficult to quantify (Theurer et al., 2018). Company reputation, another key outcome, varies across stakeholders and may require separate assessments for suppliers, employees, potential hires and customers (Helm, 2007; Scheffran, 2006). In cases where such aspects cannot be quantified, we recommend at least qualitatively describing them to consider their impact on financial performance.
4. Assessing readiness through the LIRA dashboard: structure and indicators
The LIRA dashboard offers SMEs a structured tool to assess their readiness for digital transformation. Figure 4 presents an integrated visual representation of the four-stage assessment model, illustrating how readiness evaluation, through the FBBs, identification of the technological domain and analysis of OCs, directly connects with the impact analysis conducted via the adapted ROI 4.0 model. By clarifying the sequential logic and the relationships among these components, the figure enhances the explanatory power of the framework and supports a clearer understanding of how readiness levels influence expected outcomes.
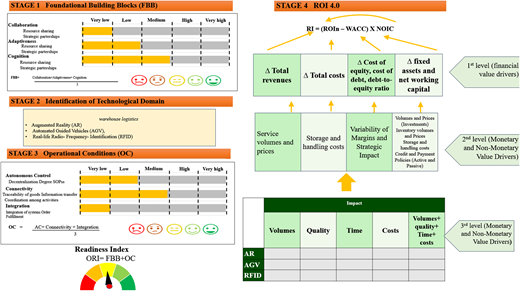
The LIRA dashboard also serves as the methodological roadmap of the study, clearly outlining how each stage of the assessment builds on the previous one and how the final evaluation emerges from the combined analysis of readiness and expected impacts.
The process begins with the FBBs, which evaluate key organizational characteristics such as Collaboration, Adaptiveness and Cognition. These factors determine whether the SME has the necessary managerial mindset to adopt I4.0 technologies.
Next, the assessment focuses on the Technological Domain, selecting a specific operational area for digital innovation. In this case, warehouse logistics is analysed, with AR, AGVs and RFID identified as key technologies for improving efficiency.
The third stage examines OCs by assessing Autonomous Control, Connectivity and Integration, ensuring that existing processes align with I4.0 requirements. The combination of these assessments generates the ORI, which serves as a key metric to guide strategic decision-making and optimize technology investments.
Finally, we offer an original integration of the adapted ROI 4.0 framework with the readiness assessment, thereby allowing the analysis to account for how different readiness levels shape the realization of financial and non-financial benefits from I4.0 adoption, as well as the eventual additional costs associated with achieving an acceptable readiness level.
The original ROI 4.0 approach enables the evaluation of the ex ante and ex post impacts of I4.0 technologies but rests on the assumption that a company is fully prepared to implement these technologies and realize their benefits. In practice, however, this assumption is frequently not met (Ferraz Junior and Gonçalves, 2025; Gebauer et al., 2020).
In some cases, the processes affected by the I4.0 investment may not be linked to readiness dimensions, making the integration of readiness assessment into ROI 4.0 unnecessary, as the standard evaluation remains sufficient. Yet, if readiness levels influence the company's ability to fully exploit the technologies and weaknesses are identified in key areas, the expected benefits may decrease or even disappear (Ali and Waheed, 2025; Alkhatib et al., 2025). Therefore, we propose that, in this scenario, the ROI 4.0 analysis should be adjusted to reflect two possible options: the as-is option, where the company proceeds without addressing readiness gaps and accepts reduced benefits, or the to-be option, where additional investments are made to improve readiness and enable higher benefits or a near-full realization of the I4.0 implementation potential. If readiness levels are critically low in key dimensions, the as-is option may not even be viable, requiring the company to address these deficiencies before proceeding, provided it has the necessary resources to do so (Antony et al., 2023; Sony et al., 2021). ROI 4.0 should therefore account not only for the direct costs of technology investments but also for potential reductions in benefits under the as-is scenario or the additional expenses needed to achieve sufficient readiness under the to-be option. More precisely, the first step in the ex ante evaluation using ROI 4.0 involves assessing whether the I4.0 investment impacts processes influenced by one or more readiness dimensions. If such an intersection exists, the second step is to evaluate how the levels of these dimensions affect the company's ability to implement and benefit from the technologies. This requires analysing critical process elements, such as input utilization, output generation, resource availability (including skills, know-how and technological infrastructure) and potential constraints (such as regulations or uncontrollable events). The third step involves integrating any increased costs and/or reduced benefits into the ROI 4.0 analysis.
To illustrate how the framework operates, consider an illustrative case of a warehouse logistics SME that is evaluating the potential introduction of AGVs. The firm assesses its readiness through a self-diagnostic tool articulated in two stages. In the first stage, managerial readiness is evaluated via the FBBs. A questionnaire administered to owners, managers and key warehouse staff yields scores of 50% for Collaboration, 46% for Adaptiveness and 36% for Cognition, resulting in an overall FBB score of approximately 44%. This profile suggests that, from a managerial and cultural perspective, the SME is only partially prepared for an automation project, with particularly critical gaps in Cognition due to limited employee acceptance of AGV adoption. In the second stage, the SME assesses its operational readiness for AGVs by evaluating OCs in the warehouse. The resulting scores are, for example, 64% for Autonomous Control, 72% for Connectivity and 76% for Integration, leading to an overall OC score of around 71%. Combining the FBB and OC assessments, the ORI reaches roughly 58%, positioning the firm in a lower-intermediate readiness class: the warehouse is technically capable of hosting AGVs, but the assessment reveals a low cognition level due to limited employee acceptance of AGV adoption in certain warehouse processes. In this case, the company would need to consider how such low readiness affects its ability to benefit from the technology. Reduced acceptance may, for instance, lead to AGV underutilization, delays in implementation, incorrect load preparation or inconsistent data input, which in turn diminish throughput improvements and slow the stabilization of automated workflows. Under these conditions, the ROI 4.0 analysis would need to incorporate either reduced benefits under the as-is scenario or additional costs under the to-be scenario.
Using purely illustrative figures, suppose the AGV investment requires around €1,000,000, and the expected annual benefits under ideal conditions – derived from labour cost savings, reduced goods damage and storage errors and increased capacity utilization – amount to approximately €700,000. In the as-is case, the company would have to account for the expected reduction in benefits due to low acceptance in the ROI 4.0 analysis. For example, if the firm proceeds without addressing cognition gaps, it may realize only a portion of the expected benefits – perhaps around 50% – resulting in approximately €350,000 per year.
In the to-be scenario, the firm would instead invest in readiness-enhancing activities, and these additional costs must therefore be incorporated into the ROI 4.0 assessment. A limited readiness-improvement option might involve basic training sessions and short communication activities, with an illustrative cost of €40,000. Such measures could moderately increase acceptance, allowing the firm to capture, for example, around 70% of the expected benefits, or approximately €490,000 annually. In this case, the ROI 4.0 analysis should account for a smaller reduction in realized benefits, alongside the additional readiness-related costs.
Alternatively, the company may adopt a more comprehensive readiness-enhancement programme, including extended training, structured communication initiatives, change-management activities and incentives, with an illustrative cost of €120,000. Incorporating these initiatives would increase the total investment to around €1,120,000 but would make it more likely that the firm captures the full €700,000 annual benefit potential. In this latter case, the ROI 4.0 analysis would primarily reflect the additional readiness-related costs, as significant benefit reductions would no longer be expected.
To provide another brief example, a company with low connectivity caused by limited traceability of goods may struggle to fully realize the benefits of RFID tracking systems, which are essential for real-time inventory management and warehouse automation. In this case, ROI 4.0 assessments should include additional costs beyond the basic RFID investment – such as upgrading IT infrastructure for data processing, integrating warehouse management software, improving network coverage (e.g. IoT connectivity), implementing data security measures and reengineering workflows to effectively incorporate RFID technology – or otherwise account for the reduced benefits resulting from not fully addressing these connectivity gaps.
The integrated approach proposed here supports both ex ante and ex post decision-making by combining readiness assessment with profitability analysis, thereby enabling a more accurate evaluation of I4.0 investments. For ex ante evaluations, integrating the adapted ROI 4.0 framework with the readiness model enhances profitability assessments by allowing firms to incorporate their current readiness level into estimates of expected returns from I4.0 initiatives. In this context, the ORI acts as a signalling indicator that may prompt targeted managerial scrutiny of those business processes affected by the specific I4.0 investment and conditioned by the observed readiness level. This facilitates the identification of potentially overlooked investment-related costs (e.g. training and complementary investments) as well as constraints on the full realization of expected benefits. Within this integrated approach, ROI 4.0 enables both the explicit inclusion of readiness-enhancing costs and the estimation of potential benefit reductions when no or only limited readiness-improving actions are undertaken, thereby supporting a more realistic calibration of expected cash flows (revenues, costs, fixed and working capital investments) and risk. For ex post evaluations, ROI 4.0 allows the estimation of realized financial and non-financial impacts of implemented I4.0 solutions, providing insights into their overall effectiveness.
The integration of the LIRA dashboard with the adapted ROI 4.0 framework also advances the role of DSS in guiding managerial judgment within logistics SMEs. As highlighted in the DSS literature, effective decision support tools must not only provide structured information but must also enhance the cognitive processes through which managers interpret performance indicators and assess alternative courses of action (Power, 2002; Power and Sharda, 2007). The proposed model aligns with this view by combining readiness assessment with impact evaluation, enabling managers to understand how organizational conditions influence the realization of technological benefits. This dual-layer structure reflects the evolution of contemporary DSS, which increasingly integrate visualization, analytical modelling and diagnostic interpretation to support data-driven decisions (Few, 2006; Yigitbasioglu and Velcu, 2012). Furthermore, by connecting operational maturity with profitability analysis, the model reinforces the capacity of DSS to reduce uncertainty and guide investment decisions in environments characterized by limited resources and process variability, as is frequently the case among logistics SMEs (Jiang et al., 2022). In this sense, the framework moves beyond traditional dashboards and contributes to the development of model-driven DSS capable of supporting both strategic planning and technology adoption pathways.
5. Conclusions
This study introduces the LIRA strategic dashboard, an evaluation framework developed to support warehouse management activities in logistics SMEs, facilitating their navigation of the complexities of digital transformation. The dashboard enables firms to assess their preparedness for adopting I4.0 technologies and to evaluate the expected and realized benefits across operational, economic and environmental dimensions. The proposed methodology unfolds through four stages. Firstly, it assesses organizational preparedness by evaluating FBB – Collaboration, Adaptiveness and Cognition – which reflect managerial mindset and strategic orientation. Secondly, it identifies the technological domain – in this study, warehouse goods movement – and the relevant technologies to be implemented. Thirdly, it evaluates OCs, examining the SME's process maturity and integration capabilities to support implementation. These inputs are combined to compute an ORI, which guides the fourth stage: a tailored application of the adapted ROI 4.0 model to estimate the financial and non-financial impact of I4.0 technology adoption. By addressing the multifaceted nature of digital transformation, this study has both theoretical and practical implications for the literature on digital readiness, performance evaluation and I4.0 in logistics.
5.1 Theoretical implications
From a theoretical standpoint, the research advances the literature on SME digital transformation by introducing a structured readiness and impact assessment model that integrates organizational and operational dimensions whose evaluative logic goes beyond traditional maturity scales. In particular, the study provides three main theoretical contributions: (1) the development of an integrated readiness and impact assessment model specifically designed for warehouse logistics SMEs, combining managerial orientation and process-specific conditions; (2) the adaptation and contextualization of the ROI 4.0 framework to the warehouse logistics domain; and (3) the design of a unified decision-support artefact linking readiness, financial feasibility and sustainability-oriented performance evaluation.
While prior readiness frameworks often focused on large firms or purely technical indicators, and typically provided staged assessments of organizational capabilities and technological sophistication oriented towards generic I4.0 adoption, LIRA captures both managerial orientation and process-specific conditions, is explicitly designed for warehouse logistics SMEs and integrates (1) managerial orientation (FBB), (2) process- and domain-specific conditions (OC) and (3) an impact evaluation layer (ROI 4.0) within a single strategic dashboard, responding to calls for more context-sensitive and strategic evaluation tools (Kayikci, 2018; Bordeleau et al., 2020). Rather than stopping at a purely diagnostic classification of maturity, LIRA links readiness scores directly to financial feasibility and risk–return considerations, supporting SMEs in comparing alternative I4.0 scenarios in terms of expected payback, value creation and implementation effort. Secondly, the research contributes to the PMS literature by adapting and extending the ROI 4.0 framework to the warehouse logistics domain and by proposing its integration with a readiness assessment. Whereas ROI 4.0 (Giannetti et al., 2021; Cinquini et al., 2019) introduced a multilayered structure for evaluating value creation from I4.0 investments, this paper contextualizes and operationalizes the model within warehouse logistics. Moreover, the integration of a readiness assessment with the ROI 4.0 analysis enables SMEs to account for both tangible and intangible outcomes, as well as the additional costs required to increase readiness or the reduced benefits that arise when low readiness remains unaddressed or only partially addressed. This integration is particularly relevant given that the original ROI 4.0 framework assumed firms could fully realize the expected benefits.
LIRA thus combines maturity assessment and ROI 4.0 analysis into a single decision-support artefact that simultaneously captures cost savings, productivity and error reduction, together with non-financial and sustainability-related effects. By explicitly embedding sustainability indicators and organizational change aspects into the evaluation logic, the framework contributes to the development of more holistic PMSs that reflect the complexity of value creation in I4.0 contexts.
Given the conceptual nature of this study, validation is conducted through comparative analysis with existing DSS and I4.0 frameworks, alignment with established dashboard design principles, and the development of a structured roadmap for future empirical testing (Meredith, 1993; Gregor, 2006; Pauwels et al., 2009). This research advances the field by proposing a structured decision-support framework that integrates readiness assessment and ROI evaluation, explicitly connecting organizational readiness, financial feasibility and sustainability-oriented performance evaluation (Few, 2006; Yigitbasioglu and Velcu, 2012).
Finally, LIRA offers a theoretically grounded platform for future empirical studies to compare its diagnostic and prescriptive power with existing maturity and readiness models across different logistics settings.
5.2 Managerial implications
Beyond its theoretical contribution, LIRA has clear implications for managerial practice and public policy. To begin with, LIRA provides warehouse logistics SMEs with a transparent and context-sensitive tool for planning, prioritizing and monitoring digital transformation initiatives, while laying the groundwork for further refinement and validation in real-world applications. By jointly displaying readiness levels, expected returns and sustainability outcomes for alternative I4.0 scenarios, the dashboard can support SMEs in prioritizing and sequencing investments across different technologies and warehouse processes.
At the strategic level, decision-makers can use the results to define and revise digital transformation roadmaps, while at the operational level, the dashboard can be incorporated into regular performance review meetings to support day-to-day resource allocation, scheduling and improvement initiatives. Managers can use ORI and the adapted ROI 4.0 outputs to identify capability gaps that need to be addressed before implementation, to balance short-term financial benefits with longer-term strategic and sustainability goals and to design more coherent transformation roadmaps. Moreover, the structured and transparent assessment provided by LIRA can reshape conversations with external stakeholders: it offers technology providers a clearer view of the client's readiness and integration constraints; it supplies financiers with a more credible, risk-aware assessment of value creation; and it provides policymakers with a diagnostic basis for designing targeted support instruments, training programmes and incentive schemes for warehouse logistics SMEs engaged in digital and sustainable transformation.
Potential application contexts include third-party logistics providers, last-mile delivery services and specialized warehousing SMEs, for which the framework can be tailored by selecting the most relevant processes, indicators and data sources while preserving the underlying evaluative logic of LIRA.
5.3 Research limitations and future research
In light of the methodological choices underpinning this research, several limitations and potential directions for future research can be identified. Firstly, it is conceptual in nature and requires empirical testing to assess the validity, reliability and applicability of the dashboard in real-world SME settings. Secondly, the scope is limited to one technological domain – warehouse logistics – while in practice, companies may implement multiple technologies simultaneously across different areas of the value chain. Additionally, the transversal nature of digital technologies may produce overlapping impacts, complicating isolated evaluations. Future research should focus on empirically validating the LIRA dashboard through field studies and pilot applications in SME contexts. Comparative analyses across different technological domains – such as transportation, inventory control or last-mile delivery – could enhance the model's generalizability. Further studies may also examine how external factors (e.g. government incentives, supply chain integration or market volatility) moderate the relationship between I4.0 readiness and technology impact, thereby enriching the framework's strategic relevance.
Appendix 1
FBBs' KPIs
| Dimension | KPIs | 1 – Very low | 2 – Low | 3 – Medium | 4 – High | 5 – Very high | |
|---|---|---|---|---|---|---|---|
| FBBs: 1st ORDER | Collaboration | Resource Sharing | No resources are shared with partners | Occasional, ad-hoc sharing of minor resources with partners | Informal sharing of some resources with known partners | Formal agreements exist to share some resources with specific partners | Extensive and formal resource-sharing agreements with key partners |
| Strategic Partnerships | No strategic partnerships exist | Potential reactive partnerships | Some informal collaboration on specific, short-term projects | A collaborative network exists with some key partners | Deep, strategic partnerships | ||
| Adaptiveness | Responsiveness | Unable to respond to unexpected changes | Slow and costly response to changes | moderate cost and effort to respond to disruptions | Quick and effective response to disruptions | Proactive response to disruptions | |
| Flexibility of Processes | Processes are highly inflexible, undocumented and difficult to change | Processes are documented, but changes are slow and require significant effort | Processes are documented and can be modified with some effort | Processes are well-defined but flexible, allowing for relatively quick adjustments | Processes are highly flexible, modular and easily reconfigurable | ||
| Cognition | Management Commitment | Management is unaware of or actively resistant to I4.0 | Management has heard of I4.0, but has very limited understanding | Management has a basic understanding of I4.0 concepts and sees some potential benefits | Management is actively exploring I4.0 options | Management has a clear, well-articulated vision for I4.0 adoption | |
| Employee Acceptance | Employees have no knowledge and a strong resistance to learning | Employees' basic knowledge. They have a weak resistance to learn | Employees have little knowledge of I4.0 and are willing to learn | Employees have moderate knowledge of I4.0 and are willing to embrace changes | Employees have a wide knowledge of I4.0. They are ready to change |
Appendix 2
OCs' KPIs
| Dimension | KPIs | 1 – Very low | 2 – Low | 3 – Medium | 4 – High | 5 – Very high | |
|---|---|---|---|---|---|---|---|
| OCs: 2nd ORDER | Autonomous Control | Decentralization Degree (movement of goods) | Operational decisions are made by management | Operational decisions are made by staff with management approval | Operational decisions are made without prior approval, within clearly defined procedures and limits | Operational decisions are made by staff within their area of responsibility | Operational decisions are made by Staff with significant autonomy |
| Standardization of Procedures (SOPs) | No SOPs exist for movements of goods activities | Some SOPs exist for the movement of goods activities, but they are incomplete, outdated or not consistently followed | There are SOPs for movements of goods activities but with gaps or inconsistencies. SOPs are generally followed but with some deviations | Detailed SOPs exist for the movement of goods activities. They are regularly reviewed, updated and consistently followed | All movements of goods activities are carried out according to well-documented SOPs | ||
| Connectivity | Traceability of Goods | No formal tracking system | Manual tracking with significant delays and inaccuracies | Tracking of goods using spreadsheets. Frequent discrepancies between records and physical inventory | Basic tracking systems. Minimal discrepancies between records and physical inventory | tracking of all goods at the item level. No discrepancies between the records and physical inventory | |
| Information Transfer (Goods Movement) | Information flow is fragmented and relies primarily on email/paper | Information flow relies heavily on paper-based records with manual data entry | Information flow relies on basic digital spreadsheets. However, they are inconsistent, outdated and incomplete | Information flow relies on database systems for data storage. However, they still rely on manual data entry | The information flow digital platforms and efficient data management practices. and minimal manual data entry | ||
| Coordination among Activities (movement of goods) | Activities related to goods movement are entirely uncoordinated | Coordination of goods movement activities is limited, resulting in frequent delays, inefficiencies and operational bottlenecks | Some coordination exists between activities, but it is primarily reactive and reliant on informal communication | Activities are consistently coordinated through established processes, with efficient resolution of minor issues | Activities related to goods movement are coordinated and optimized, ensuring maximum efficiency | ||
| Integration | Systems Integration (Goods Movement) | Multiple and separate systems are used for different aspects of goods activities | Few integrations among different systems for movement of goods activities | There is integration among a few different systems, but there are still significant gaps and manual processes | Key systems related to goods movement share data, but there may be some limitations or delays | A single, integrated system manages all aspects of goods movement | |
| Order Fulfilment Performance (Picked, packed, labelled and staged for loading) | Order fulfilment processes are highly inefficient and unpredictable | Order fulfilment is slow, inaccurate and unreliable due to predominantly manual processes | Order fulfilment processes are moderately efficient but exhibit inconsistencies and occasional delays | Order fulfilment processes are generally fast, accurate and reliable | Order fulfilment processes are highly efficient, predictable and seamlessly integrated |

