This study aims to develop a predictive model for online content virality by identifying key drivers of virality and exploring their interactions. In doing so, the research addresses the lack of consensus on a universal model for predicting virality within today's interconnected digital landscape.
To achieve this goal, a quantitative methodology was used, featuring a cross-sectional survey of 380 respondents who registered for University of the Philippines Open University's (UPOU) Massive Open Online Courses (MOOCs). Data collection was conducted through an online survey to investigate factors initiating viral spread, utilizing descriptive statistics, correlation analyses and binary logistic regression to evaluate the interplay of external, intrapersonal and interpersonal factors.
The resulting analysis presents a predictive model highlighting the significance of both online and offline sharing. It demonstrates a “social sharing infinity loop,” where word of mouth contributes to a continuous cycle of virality, where relevant or useful content continues to spread, further amplifying its reach. These findings offer specific insights into the complex dynamics of content virality within educational settings like UPOU's MOOCs.
By understanding these factors, practitioners can optimize digital strategies to enhance the visibility and impact of online learning content.
The value of this study lies in its proactive approach; while understanding factors that initiate viral spread typically occurs after content has gained traction, this paper provides a predictive model to anticipate such behavior. It contributes a comprehensive framework for understanding how the “social sharing infinity loop,” driven by word of mouth and relevance, sustains extensive dissemination across social circles.
1. Introduction
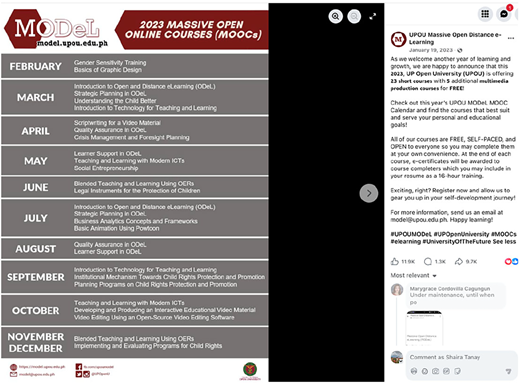
Open distance learning (ODL) institutions increasingly rely on digital ecosystems to fulfill mandates of social inclusion and educational access. In 2023, a promotional calendar for Massive Open Online Courses (MOOCs) of the University of the Philippines Open University (UPOU) went viral (see Figure 1).
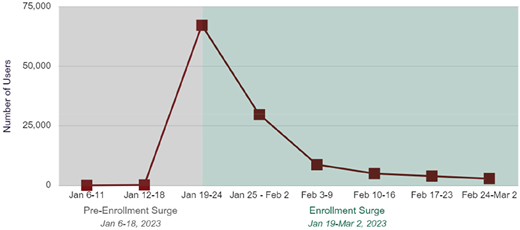
It reached 1.5 million users, resulting in a 78% increase in the user base within one week, as shown in Figure 2. This phenomenon – “virality” – presents a unique opportunity to explore the mechanics of digital engagement.
Understanding what drives educational content to go viral is crucial for ODL sustainability. Without data-driven insights, institutions risk ineffective promotional strategies. This research aims to (1) determine the main drivers of online content virality; (2) analyze the relationships among these drivers and (3) develop a predictive model for sharing behavior.
2. Drivers of content virality and theoretical gaps
While a growing body of literature has attempted to explain how and why online content becomes viral, several gaps remain unaddressed. These gaps limit the development of a comprehensive understanding of virality in digital communication, particularly in the context of educational content. The following key areas highlight the existing limitations in current research. First, while numerous predictors of virality have been introduced, the existing body of research is characterized by inconsistent and often contradictory findings, which complicates the identification of reliable success factors (Guadagno et al., 2013; Nelson-Field et al., 2011). This ambiguity is further compounded by a tendency to examine external, intrapersonal and interpersonal factors in isolation; consequently, there is a lack of integrated analysis exploring how these disparate elements interact to drive sharing behavior (Dobele et al., 2005; Halvey and Keane, 2007; Han et al., 2020). Beyond these structural oversights, the field suffers from a notable scarcity of empirical evidence to validate theoretical claims, leaving the specific motivations, attitudes and behaviors of users who share content largely under-researched (Phelps et al., 2004). Ultimately, these limitations culminate in a lack of robust, macro-level theoretical models as current scholarship favors micro-level studies over the development of holistic frameworks that could connect the multiple dimensions of digital content sharing. This gap is particularly evident in the Asian ODL landscape. While Tung (2013) argued that networked learning through social media can transform ODL by shifting the focus from content to “people-centric” learning communities, there remains a lack of empirical frameworks that predict how these communities trigger viral dissemination. This study addresses this by providing a quantifiable model for the “social currency” that drives such networked interactions.
To respond to these issues, Botha (2014) introduced an integrative model that outlines the spread of content online. While this framework offers a promising macro-level perspective, it has yet to undergo empirical testing. This study adopts Botha (2014) model to analyze the viral success of the Massive Open Distance e-Learning (MODeL) MOOC Calendar and the resulting spike in massive enrollment. A critical distinction must be made between “engagement” (static interactions like likes) and “virality” (the exponential sharing of content). In this study, virality is treated as a quantifiable metric of the “Utility-Value” of content. Unlike entertainment-based virality, educational virality is often driven by “social currency,” where the sharer gains reputation by providing valuable opportunities to their network.
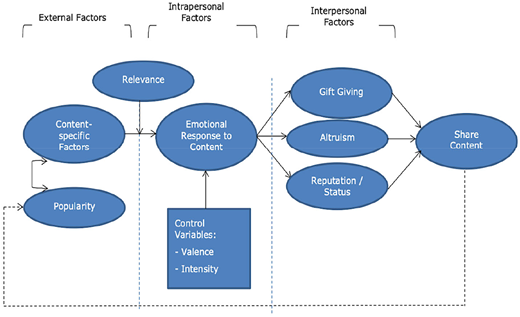
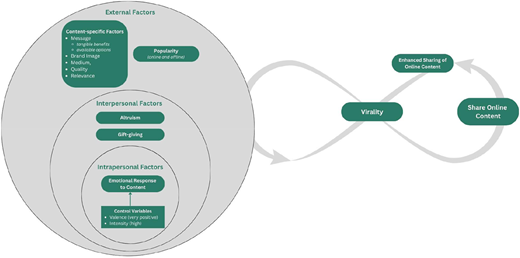
Botha (2014) proposes that content virality starts with content-specific features and popularity, which drive emotional responses and, in turn, sharing behaviors. Social and interpersonal factors – Roy (2011) such as altruism, gift-giving and reputation – mediate whether content is shared. Sharing can occur both online and offline, forming a feedback loop where popularity fuels further sharing (Figure 3).
3. Methodology
This study used a quantitative research design using a cross-sectional survey approach. The target population comprised users of the UPOU MODeL platform who registered during a noted surge period. Most of these respondents were first-time enrollees in MOOCs, with 60% reporting that they discovered UPOU MODeL through Facebook.
To determine the appropriate sample size, Cochran's formula was applied in consultation with statisticians. Based on a population of 30,292 users, a sample size of 380 was calculated, with a 95% confidence level and a 5% margin of error. These parameters balanced the need for statistical precision with practical feasibility. Respondents were selected using simple random sampling.
Data collection was conducted through an online survey composed of six parts: (1) Part A: Demographic and background information; (2) Part B: External factors; (3) Part C: Intrapersonal factors; (4) Part D: Interpersonal factors; (5) Part E: Sharing behavior and (6) Part F: Motivations for enrolling in MOOCs.
The study utilized both descriptive and inferential statistics in analyzing the data. To identify and measure relationships between variables, various correlation techniques were used:
Pearson's product–moment correlation for quantitative variables
Spearman's rank-order correlation for mixed qualitative and quantitative variables
Point-biserial and rank-biserial correlation for variables involving dichotomous or multi-level categorical data paired with continuous variables
To predict the likelihood of users sharing the UPOU MODeL MOOC Calendar, a binary logistic regression analysis was conducted. Initially, all relevant variables were included in the model, followed by iterative removal of nonsignificant predictors to arrive at the most parsimonious model supported by the data.
While binary logistic regression was selected for its interpretability regarding odds ratios (ORs), it is acknowledged that complex, nonlinear relationships in social data may be further elucidated by machine learning (ML) approaches. Future iterations of this model would benefit from random forest or gradient boosting algorithms to account for the high-dimensional nature of user analytics.
The validity of the regression model was assessed using several diagnostic tests:
Durbin–Watson test for autocorrelation
Chi-square test for goodness of fit
Multicollinearity diagnostics to ensure independence among predictors
To evaluate the predictive performance of the final model, the following metrics were used:
Adjusted R-squared
Root mean squared error (RMSE)
Akaike's information criterion (AIC)
This comprehensive methodological framework was designed to ensure clarity, statistical soundness and reliability in identifying the factors that contribute to the virality of online content, particularly within the context of MOOCs offered through UPOU MODeL.
4. Results and discussion
4.1 Drivers for the virality of online content on social media
4.1.1 External factors that influenced respondents to share the MOOC Calendar
This study identified several external factors that influenced respondents to share the UPOU MODeL MOOC Calendar. These include content-specific factors – such as the message, brand image, medium, message quality and relevance – as well as the calendar's overall popularity.
4.1.1.1 Content-specific factors
Message content
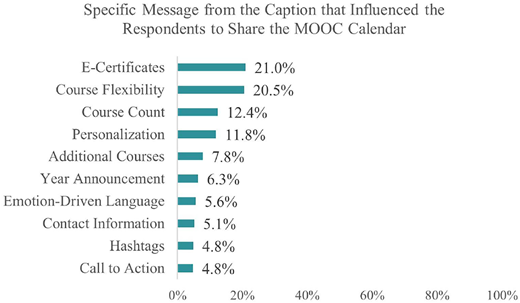
As shown in Figure 4, respondents shared the calendar mainly because of its practical benefits – notably, the availability of e-certificates for résumé enhancement and the flexibility of self-paced learning. In contrast, hashtags and calls to action were less effective, which contrasts with Wold's (2023) findings that emphasized the power of calls to action in viral posts. The study reveals that respondents prefer content emphasizing tangible benefits, such as certification and flexible learning options, over social media engagement tactics.
Brand image
These findings align with those of Jenkins (2011), who suggests that brand image significantly influences virality. Additionally, users are more likely to share online content when it originates from an individual perceived as a source of original content (Han et al., 2020). This inclination may be attributed to UPOU's reputation as a forefront institution.
Medium
Respondents strongly agreed that their frequent use of Facebook and the ease of sharing within their digital network were key reasons for sharing the UPOU MODeL 2023 MOOC Calendar. Hansen et al. (2011) support these findings by highlighting the distinct impact of social media platforms, particularly Facebook, on content spread. This reinforces the argument that the medium, especially Facebook in this context, significantly influences the dynamics of online content sharing.
Message quality
The results indicate that message quality significantly influenced respondents to share the MOOC Calendar, aligning with existing literature. The calendar's message was perceived as credible and high quality – originating from a reputable academic institution and avoiding clickbait. Chatterjee and Panmand (2022) underscore the impact of language formality, readability, sentiment and proper noun usage on virality, while Dobele et al. (2005) stress the value of engaging, imaginative and visible messages. These attributes were reflected in the MOOC Calendar's year-long, well-promoted course offerings.
Relevance
Lastly, relevance – the perceived usefulness of the MOOC Calendar – also influenced the sharing behavior of the respondents. Individuals were more likely to share the calendar if they believed it provided valuable information or benefits pertinent to their interests or needs.
4.1.1.2 Popularity
The calendar's growing popularity encouraged further sharing both online and offline, creating a self-reinforcing cycle of virality. This mirrors Wold's (2023) observation that popularity itself drives further dissemination. In essence, the perceived reputation of the MOOC provider, the effectiveness of the communication medium used to share the calendar, the message quality of the calendar content, its relevance to the recipients and its growing popularity are critical determinants influencing the decision to share. These findings are summarized in Table 1.
4.1.2 Intrapersonal factors that influenced respondents to share the MOOC Calendar
Intrapersonal factors involve an individual's internal responses and perceptions when encountering viral content, including emotional reactions, which significantly influence their interaction with and response to the material.
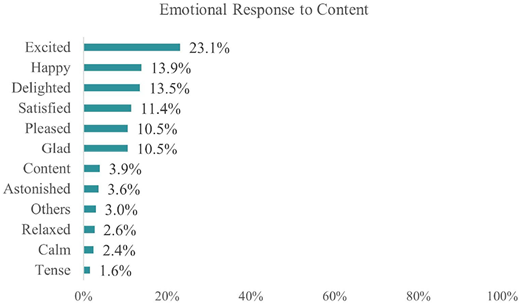
As depicted in Figure 5, respondents commonly experience positive emotions, such as excitement, happiness and delight, when encountering the MOOC Calendar. Negative emotions are rare among participants, signaling an overall positive reception of the calendar. This suggests that emotional stimulation indeed drives sharing behaviors. This finding is supported by several studies indicating that content eliciting emotional responses tends to be shared more widely than content providing mere information (Akpınar and Berger, 2017; Berger, 2014).
Furthermore, respondents consistently report a very positive feeling when encountering the MOOC Calendar, reflecting the heightened intensity of positive emotions they experienced as mentioned earlier. The content of MOOC Calendar social media posts effectively elicits strong emotional responses, with respondents experiencing high levels of excitement, happiness and delight. The median ratings of the UPOU MODeL 2023 MOOC Calendar concerning intrapersonal factors are provided in Table 2.
Given that valence and intensity are key components of emotional response, the combination of very positive feelings and high intensity of positive emotions significantly influenced how individuals responded to and interacted with the material, contributing to its virality.
These findings affirm that users are more inclined to share content that elicits intensely positive emotions within their social networks. Numerous studies (Berger and Milkman, 2012; Camarero and José, 2011; Rodic et al., 2012; Elliott, 2013; Jenkins, 2011; Tellis et al., 2019) collectively emphasize that positive content tends to spread faster and more widely than negative content. Furthermore, high-arousal emotions, particularly joy, increase the likelihood of content spreading across online platforms (Berger and Schwartz, 2011; Nelson-Field et al., 2011; Guadagno et al., 2013). This heightened emotional engagement can significantly enhance the visibility and reach of the MOOC Calendar, thereby increasing its impact and effectiveness in promoting educational initiatives.
In summary, content evoking highly positive and intense emotions is more likely to be shared widely as these emotional responses significantly influence how individuals interact with the material.
4.1.3 Interpersonal factors that influenced respondents to share the MOOC Calendar
Interpersonal factors, particularly altruism and gift-giving, were key motivations behind respondents' decision to share the MOOC Calendar. Many shared it to help others or contribute to the learning of friends or communities, viewing the act as a form of social gifting.
On average, respondents share the MOOC Calendar primarily due to interpersonal factors, with gift-giving and altruism being the most influential (see Table 3). These results align with Lakmali and Peiris (2021), who characterize such social media use as a form of “social participation” and collaborative peer support common in Asian distance learning. This behavior further mirrors the “learning community” concept proposed by Tung (2013). By sharing the calendar, respondents are not merely distributing a link but are practicing “networked learning” where knowledge sharing builds and maintains the community's collective capital.
4.1.4 Socio-economic context of virality
The finding that “gift-giving” (OR = 2.16) is a primary driver suggests a strong link to the employment status of the target audience. In the Philippine context, sharing a MOOC Calendar is an act of “social altruism,” where users provide their unemployed or underemployed peers with pathways to upskilling. This indicates that virality in ODL is not merely a marketing metric but a reflection of the social and employment aspirations of the community.
This indicates that respondents are predominantly altruistic, motivated by the desire to benefit others rather than seeking personal gain. They share the MOOC Calendar content on social media with the genuine intent of providing educational value or support to their friends, family or online community. This aligns with Ho and Dempsey's (2010) findings, which suggest that an altruistic inclination reflects a desire to contribute to groups, express individuality and promote personal development through content sharing.
Furthermore, respondents are driven by a desire to give gifts and spread goodwill, intending to benefit the educational community or specific individuals. This discovery supports Prendergast and Stole's (2001) research, emphasizing the economic significance of gifts, which often extend beyond monetary value to represent the giver's identity, particularly in online social media contexts. These findings also resonate with the works of Lagger et al. (2017), Roy (2011) and Chakrabarti and Berthon (2012), which explore motivations for sharing videos, including showcasing achievements, providing information, expressing emotions such as joy or resentment and fostering social connections akin to the spirit of gift-giving.
These findings imply and prove that content shared for altruistic and gift-giving reasons is more likely to resonate with others and be passed along within social networks. Therefore, by leveraging these motives in content creation and promotion strategies, organizations can enhance the virality of their online content. This can help them reach a wider audience and achieve a greater impact in promoting developmental and educational initiatives.
4.2 Interactions among drivers for the virality of online content on social media
To further understand how different drivers collectively influence the virality of online content, the study explored the interactions and relationships among external, intrapersonal and interpersonal factors. This addressed Objective 2 and moved beyond isolated analysis of variables by examining their combined effect on sharing behavior.
4.2.1 Pearson's product–moment correlation of factors affecting the viral success of the UPOU MOOC Calendar
To examine the relationships among factors influencing the virality of online content, Pearson's product–moment correlation was conducted. This analysis helped identify significant variables for the predictive model and assess the strength of their associations. As shown in Table 4, popularity showed strong positive correlations with intrapersonal (r = 0.635, p < 0.001) and interpersonal factors (r = 0.597, p < 0.001), highlighting the role of individual perception and social influence in driving virality.
4.2.2 Spearman’s rho correlation matrix of factors affecting sharing of MOOC Calendar
To further explore the relationships among drivers of online content virality, Spearman’s rank-order correlation was applied to assess associations between ordinal and continuous variables.
As shown in Table 5, several factors positively correlate with the likelihood of sharing the MOOC Calendar: brand image, medium, message quality, online and offline popularity, relevance, integrity, gift-giving and altruism. Among these, gift-giving shows the strongest correlation, suggesting that perceiving sharing as a generous act strongly motivates users. In contrast, valence and reputation show weaker correlations, indicating that emotional tone and perceived reputation have less impact on sharing decisions.
These findings highlight the importance of strategically enhancing brand image, message quality, popularity and perceptions of altruism to boost content virality. Conversely, while emotional appeal and reputation matter, they are less influential compared to other factors. Overall, the results reflect the complex nature of online sharing behavior and provide actionable insights for maximizing the reach and impact of the MOOC Calendar.
4.3 Predictive model of the factors for the virality of online content on social media
Following the previous analyses and in line with Objective 3, the study proceeded to develop a predictive model that captures the key factors influencing the virality of online content – specifically the sharing behavior surrounding the UPOU MODeL MOOC Calendar.
4.3.1 Binary logistic regression model
A binary logistic regression model was used to predict whether individuals shared the UPOU MODeL MOOC Calendar. To ensure the model's validity, multicollinearity among independent variables was checked using tolerance and variance inflation factor (VIF). This step ensures that variables are not highly correlated, which can compromise the interpretation and reliability of regression coefficients. In plain language, these diagnostics ensure that each driver (like altruism or brand image) is measuring a distinct behavior, preventing the model from overcounting the same influence twice. As shown in Table 6, none of the variables exhibited multicollinearity, supporting the model's stability and interpretability.
While some variables were found to be correlated, correlation alone does not imply multicollinearity. Correlation measures the strength and direction of a linear relationship between two variables, but multicollinearity specifically refers to high correlations among multiple independent variables in a regression model – leading to redundancy and difficulties in interpreting coefficients.
In the context of this study, variables like online popularity and offline popularity may be positively correlated, but unless correlations are extremely high (near ±1), they do not necessarily signal multicollinearity. Thus, it is important to assess multicollinearity separately to ensure the reliability and stability of regression estimates.
4.3.2 Fitted model
Based on Table 7, the odds of an individual sharing the MOOC Calendar decrease by 0.003% for each additional year of age, assuming all other variables are held constant. Meanwhile, under the same conditions, the odds of sharing increase by 44.5% if the individual is female compared to male and by more than 100% if the individual is enrolled in a MOOC compared to not being enrolled. Furthermore, for each unit increase in their ratings for content-specific and popularity questions, the odds of sharing the MOOC Calendar increase by 7.2% and 32.1%, respectively. On the other hand, regarding their ratings on personality-related questions, the model indicates that for every unit increase in ratings related to gift-giving and valence, the odds of sharing the MOOC Calendar increase by more than 100% and 10.6%, respectively, assuming all other variables remain constant. Lastly, for every unit increase in ratings for altruism, reputation and intensity, the odds of an individual sharing the MOOC Calendar decrease by 9%, 16.7% and 12.1%, respectively.
The results reveal several key insights into sharing behavior. Higher ratings in content-specific and popularity factors also raise the odds of sharing. Interestingly, gift-giving and valence positively influence sharing, while altruism, reputation and intensity are associated with lower sharing odds. These nuanced findings can inform more targeted strategies to boost the reach and virality of the MOOC Calendar.
4.3.3 Assessment of the fitted binary logistic regression model
The fitted binary logistic model showed a significantly better fit than the null model (p = 0.002), indicating that the predictors meaningfully contribute to identifying who is likely to share the MOOC Calendar. However, the McFadden R2 value of 0.1510 suggests weak predictive power. While statistically significant, the model may require further refinement to improve its accuracy and usefulness.
4.3.4 Validating model performance using new data through cross-validation of the fitted model
The cross-validation results show that the model can perform well in predicting new data, with a test accuracy of approximately 88%. This is slightly higher than the accuracy rate observed in the classification results from the testing data set. Additionally, Cohen's Kappa value of about 85% shows a strong agreement between the predicted values and the actual values from the data.
This suggests that the model effectively captures the underlying relationships between the predictor variables and the virality of online content. Overall, these results underscore the reliability and predictive power of the developed model in forecasting content virality, thus contributing to the advancement of understanding in this domain.
Higher ratings in content-specific and popularity indicators were associated with a greater likelihood of sharing. Interestingly, stronger scores in gift-giving and valence (emotional positivity) significantly increased sharing behavior. In contrast, higher scores in altruism, reputation and emotional intensity were linked to lower sharing likelihood.
The likelihood ratio test confirmed that the predictors were statistically significant, indicating that external, intrapersonal and interpersonal factors meaningfully influence sharing behavior. However, the McFadden R2 coefficient of 0.1140 suggests a weak overall relationship between predictors and the outcome, implying that individual variables offer limited predictive power on their own. Instead, their combined influence presents a more comprehensive and accurate picture of the mechanisms driving online content virality.
4.3.5 Model validation
To ensure the model's robustness, a cross-validation procedure was conducted using a separate testing data set. The model achieved a classification accuracy of 88%, slightly higher than the 84.2% accuracy observed during testing. In addition, a Cohen's Kappa value of approximately 85% reflected strong agreement between predicted and actual classifications, supporting the model's reliability in forecasting new data.
These results confirm that while no single factor dominates, the interconnected effects of external, emotional and social motivations form a solid foundation for predicting content sharing behavior – particularly in the context of educational materials.
5. Conclusion
This study provides a comprehensive framework for understanding the dynamics of online content virality within the ODL landscape. By examining the 2023 UPOU MOOC Calendar, the research identifies a multifaceted interplay between external, intrapersonal and interpersonal factors. While individual predictors may appear insignificant in isolation, the predictive model (Figure 6) demonstrates that their combined relationship is what ultimately drives the sharing behavior.
The model highlights that content virality is a unified system. External factors such as content-specific attributes (4.93%) and brand reputation encourage consumption, while intrapersonal factors like valence (6.98%) and emotional intensity (8.93%) act as moderators that enhance content spread. However, interpersonal elements emerged as the primary engines of the sharing loop. Among these, gift-giving was the most influential predictor, accounting for 53.39% of the variance in the data. This underscores how content portraying acts of generosity resonates deeply with audiences. For example, media organizations highlighted the UPOU MOOCs as free of charge. Sharing this information online was perceived as a gesture similar to giving a gift within digital networks, actively promoting free access and self-paced learning.
Popularity (19.27%) further underscores the impact of content shared by influential entities, amplifying reach through UPOU's strong brand image. The interplay of these drivers – altruism, popularity, emotional tone and message quality – propels a social sharing loop that encompasses both online interactions and the enduring impact of word of mouth.
Beyond theoretical contributions, this predictive model holds practical value for ODL institutions transitioning toward flexible, technology-mediated delivery of education. By applying these insights, universities can design strategic communication to reach broader audiences, especially underserved and marginalized learners. Ultimately, this research underscores the role of communication strategy and data-informed digital engagement in shaping a future of education that prioritizes openness, accessibility and innovation.