

This article proposes a benchmarking-oriented Total Productive Maintenance 5.0 (TPM5.0) maturity framework that jointly assesses human, digital and green (HDG) performance across all eight TPM pillars in the Industry 5.0 (I5.0) era, enabling peer-referenced maturity assessment across heterogeneous firms and industrial contexts.
Semi-structured interviews with companies, triangulated with a systematic literature review, informed an HDG–TPM questionnaire. The tool is operationalised into a scoring model that treats maturity as a multidimensional, peer-benchmarking problem, computed via a Multi-Attributive Border Approximation Area Comparison-based scheme advanced with sector-size normalisation and a context-aware weighting architecture. Explainable AI and natural language processing of qualitative comments enhance transparency and support periodic updating.
The framework produces HDG- and pillar-level maturity profiles, assigns firms to discrete maturity classes and quantifies deviations from sector–size benchmarks. A Food-Small illustrative case demonstrates how misalignments are detected and translated into prioritised improvement actions on specific TPM pillars and HDG practices.
This pilot study covers a limited set of firms within a single sector-size cluster. Future work will expand the sample to test reliability and validity, enable longitudinal analysis and support framework updates.
The study introduces the first TPM5.0 maturity model that operationalises HDG benchmarking through an adaptive, context-aware weighting logic, extending TPM, Lean and operations benchmarking literature. The framework provides a practically deployable diagnostic tool that connects peer-referenced maturity gaps to coordinated HDG improvement priorities under an I5.0 lens.
1. Introduction
Lean Manufacturing enhances quality and productivity by reducing waste and operating costs through continuous improvement (Ulhe et al., 2024). Within this paradigm, Total Productive Maintenance (TPM) is pivotal for limiting downtime and defects while improving equipment utilisation. As manufacturing transitions towards Industry 5.0 (I5.0), priorities extend beyond Industry 4.0 (I4.0) digitalisation to include sustainable and human-centric trajectories (Ganesan et al., 2025), consistent with the European Commission (2021). For maintenance, this shift requires rethinking TPM as human-oriented, digitally enabled and environmentally responsible.
The evolution from I4.0 to I5.0 is operational in nature. I4.0 is a technological paradigm focused on productivity, efficiency and automation through its enabling technologies (Cannavacciuolo et al., 2023): it acknowledges human involvement, but workers are mainly considered users or beneficiaries of automation (Breque et al., 2021). Sustainability is often treated as a by-product of efficiency, not as a primary goal. In contrast, I5.0 balances three operational pillars: human-centricity (workforce wellbeing, ergonomics, upskilling and inclusive participation), measured through Key Performance Indicators absent from I4.0 frameworks (Maddikunta et al., 2022; Xu et al., 2021); sustainability (resource reuse and emissions management integrated into maintenance and production decisions (Jin et al., 2024)); and resilience through adaptive systems capable of absorbing disruptions without compromising the other two (Breque et al., 2021).
Specifically regarding TPM, I4.0 integration is largely limited to the digital enablement of maintenance (e.g. predictive analytics, IoT-based condition monitoring, computerised maintenance management system (CMMS)). The TPM5.0 vision requires that each pillar be assessed simultaneously along Human (H), Digital (G) and Green (G) dimensions, so that maintenance decisions extend beyond maximising overall equipment effectiveness (OEE) to include ergonomic scheduling, eco-efficient interventions and operator empowerment. Each TPM pillar operationalises HDG dimensions in distinct ways. Autonomous maintenance (AM) combines operator empowerment (H), sensor-assisted inspections and real-time monitoring (D), and eco-autonomous routines (G). Planned maintenance (PM) integrates ergonomic scheduling (H), predictive analytics (H) and energy/waste-optimised maintenance planning (G). Quality maintenance (QM) links quality circles and operator-led anomaly detection (H), AI-based vision systems (D) and defect reduction as a proxy for resource efficiency (G). Training and Education (TandE) supports competency development (H), virtual and augmented reality-learning tools (D) and sustainability awareness (G). Early equipment management (EEM) embodies participatory procurement design (H), digital twins simulation (D) and eco-design criteria for equipment selection (G), consistently with circular economy principles. The safety, health and environment (SHE) pillar is the main vehicle for H, while also addressing D through wearable IoT-based safety monitoring and G through zero-emission and environmental compliance targets. Office TPM (O-TM) operationalises via administrative ergonomics (H), workflow automation (D) and paperless operations (G). Targeted improvement embeds H through bottom-up Kaizen involvement, D via data-driven improvement and G through resource efficiency and waste reduction initiatives. This pillar-level HDG framework makes TPM a suitable operational backbone for I5.0, as it provides a structured architecture for systematically accommodating multidimensional HDG indicators (Bashar et al., 2020).
Although TPM assessment frameworks are widespread (Antomarioni et al., 2023), maturity assessment remains challenging due to the multidimensional nature of TPM pillars and their organisational interdependencies, increasingly requiring multi-criteria approaches (Vikas and Mishra, 2024). Many studies still rely on post-hoc operational or financial indicators (e.g. OEE, mean time between failure and mean time to repair) (Paiva et al., 2024), without jointly assessing HDG dimensions of maintenance practice. Three converging gaps motivate this study.
First, to the best of authors’ knowledge, literature lacks an I5.0-aligned TPM maturity model that jointly assesses HDG performance across all pillars. While recent Lean maturity models integrate digital and environmental aspects (Benmamoun et al., 2025; Gatell and Avella, 2024), the human dimension remains underdeveloped (Antomarioni et al., 2025) and “digital sustainable maturity” is still scarce and methodologically fragmented (Silva et al., 2025a). In TPM-specific research, only two structured maturity frameworks exist (Alidrisi, 2020; Shaaban and Awni, 2014), neither of which incorporates digital or environmental dimensions.
Secondly, existing models rely on static expert-derived weights and internal or sample-limited comparisons, lacking adaptive benchmarking across contexts that vary by sector, size, and technological intensity. These constraints cross-firm learning and reduce practical relevance, especially for SMEs, which cannot meaningfully benchmark against context-agnostic standards (Ferraro et al., 2023; Nascimento et al., 2025).
Third, most models provide static assessments with limited ability to translate results into actionable improvement priorities. Mechanisms for data-driven updating, qualitative feedback integration and explainability are largely absent, increasing obsolescence risk and reducing managerial confidence.
To address these gaps, this article proposes an empirical HDG-TPM5.0 framework that formulates TPM maturity as a multidimensional, context-sensitive benchmarking problem by assessing HDG performance across all eight TPM pillars. Building on a Multi-Attributive Border Approximation Area Comparison (MABAC) computation scheme, it introduces a new contextual weighting architecture that preserves comparability across peer-clusters, while explainable artificial intelligence (XAI) techniques and natural language processing (NLP) based analysis of qualitative comments enhance interpretability and support periodic updating for long-term relevance. The remainder of the article is organised as follows: Section 2 reviews the relevant literature; Section 3 details the methodology; Section 4 presents an illustrative application; Sections 5 and 6 discuss implications and conclusions.
2. Literature review
The literature review was conducted following a structured and replicable procedure to ensure coverage, consistency and transparency in identifying and analysing maturity model contributions within operations management (OM). It follows a progressive logic: first examining general OM maturity models, then Lean-oriented models and finally TPM-specific frameworks. The process includes explicit keyword queries, database selection and screening criteria, as detailed below.
Within OM, maturity models are widely used as diagnostic, benchmarking, and decision-support tools to monitor capabilities, identify improvement areas and guide optimisation (Rendon, 2015; Shukla and Sushil, 2022). However, recurring limitations persist: (1) fragmented and sector-bound constructs with uneven environmental-social-economic coverage; (2) predominantly qualitative assessment and (3) maturity scores rarely anchored to cross-firm benchmarks or translated into actionable guidance (Ferraro et al., 2023; Pavan et al., 2023). Although recent contributions partially mitigate these issues (e.g. sustainability self-assessment (Correia et al., 2023), and I4.0 indicator-based models (Hajoary et al., 2024)), scoring remains subjective and weighting structures largely static. Digital sustainable maturity models remain scarce and heterogeneous (Silva et al., 2025b), and even structured approaches rely on fixed weighting and context-generic benchmarks (Benmamoun et al., 2025; Nascimento et al., 2025). Overall, OM maturity research is evolving towards multidimensional, indicator-based approaches, but adaptive benchmarking architecture remains underdeveloped.
2.1 Lean-oriented maturity models
A Scopus search retrieved maturity contributions in manufacturing using the query: TITLE-ABS-KEY ((“maturity” AND (“model” OR “assessment” OR “framework” OR “readiness” OR “level” OR “dimension”)) AND (“lean”) AND (“manufactur*” OR “production”), reaching 361 records The keyword string was designed to capture the main terminological variations used in maturity model research.
Filtering for English-language documents in Engineering, Business, Management and Accounting, and Decision Sciences (261 records) ensured consistency with the OM domain. Limiting the timeframe to 2019 onwards resulted in 171 records, reflecting the convergence of Lean maturity research with I4.0 and I5.0 perspectives (Kolla et al., 2019), aligning with the research objectives of this study.
After excluding reviews and proceedings, 152 abstracts were screened. Studies were retained only when including an explicit maturity construct (e.g. levels, dimensions, or scoring logic), resulting in 66 contributions. Among these, 14 integrated Lean with at least one HDG dimension and were analysed in detail (Table 1).
Lean maturity models overview
| Ref | Method | H | D | G | Benchmarking | Dynamic /adaptive | Actionable insights | Evidence |
|---|---|---|---|---|---|---|---|---|
| Pulkkinen et al. (2019) | DEXTER digital maturity model | – | Y | – | Internal benchmarking across KPAs / units | Static | P – Generic guidance | Case study |
| Shi et al. (2019) | SMKL Kaizen-based smart manufacturing maturity | – | Y | – | Comparison across levels and sites | Static | P – Generic guidance | Case study |
| Santos et al. (2020) | LI4MTA Lean–I4.0 roadmap (BPM-based) | – | Y | – | Current vs target levels (internal benchmarking) | Partial | Y – Explicit roadmap | Case study |
| Sassanelli et al. (2020) | Digital–Lean maturity in product development | – | Y | – | Benchmarking among 3 ETO case companies | Static | Y – Explicit roadmap | Case studies |
| Zoubek et al. (2021) | SMKL 4.0 maturity model (Lean and I4.0) | P | Y | – | Internal benchmarking across plants/lines | Static | P – Generic guidance | Case study |
| Kandler et al. (2022) | Human-centred digital Shopfloor Management: implementation + maturity assessment | Y | Y | – | Current vs target state (internal) | Static | Y – Implementation process + element selection logic | Case study |
| Martins et al. (2023) | Hybrid MCDM for Lean and I4.0 prioritisation | – | Y | – | Ranking/prioritisation of technologies | Static | Y – Explicit technologies prioritisation | Case study |
| Skalli et al. (2023) | ADIME 4.0 digital maturity limited to Six Sigma | P | Y | – | Internal diagnostic across units | Static | P – Generic guidance | Theoretical |
| e Silva et al. (2024) | Lean–Circular Economy self-assessment (MCDA) | – | – | Y | Descriptive cross-company comparison | Static | Y–Explicit recommendations | Case studies |
| Sajjad et al. (2024) | Lean and I4.0 maturity (IMPULS, SIRI; survey) | P | Y | – | Firm segmentation/clustering | Static | P – Generic suggestions | Survey |
| Gatell and Avella (2024) | Conceptual DGL maturity model (5 levels) | – | Y | Y | Conceptual comparison of DGL profiles | Static | P - High-level guidance | Theoretical |
| Benmamoun et al. (2025) | GL maturity index (BWM) for pharma SMEs | P | – | Y | Intra-sample GL index | Static | P - High-level guidance | Case study |
| Silva, Nakandala et al. (2025) | Lean-centric I4.0 readiness model (6 dimensions, 39 sub-dimensions) | Y | Y | – | Readiness profiling/maturity matrix (internal/self-assessment) | Static | P – Structured readiness profile (no stepwise roadmap) | Theoretical |
| Tadja et al. (2025) | Inclusive lean manufacturing maturity tool (size/location analysis) | P | – | – | Cross-company comparison within sample (size/location lens) | Static | P – Tool-based diagnosis | Survey |
| This study | HDG–TPM 5.0 maturity framework | Y | Y | Y | External benchmarking (contextual, cluster-based) | Dynamic/adaptive | Y – Data-driven, explainable recommendations | Theoretical + pilot study |
Note(s): H/D/G/L = Human/Digital/Green/Lean; Y = explicit, P = partial, – = not addressed
MCDA = Multi-criteria Decision Analysis; MCDM = Multi-criteria Decision Model; BPM = Business Process Management; BWM = Best Worst Method; SMKL = Samart Manufacturing Kaizen Level)
Table 1 shows uneven multidimensionality: the Digital dimension dominates, reflecting data-enabled automation for waste/variability reduction and real-time control (Lucantoni et al., 2022). Green is emerging, and Human remains partial. This imbalance steams from the difficulty of formalising and quantifying human factors (skills, motivation, safety culture, human–machine interaction), which are qualitative and context-dependent, unlike immeasurable indicators such as OEE. This challenge is also evident in I5.0 and human–machine literature (Lucantoni et al., 2026). Consequently, maturity models prioritise technical indicators, while the H dimension remains underdeveloped.
Benchmarking is mainly internal or sample-bound, and adaptive mechanisms are rarely formalised.
A relevant reference is the Green–Lean model by Benmamoun et al. (2025), which highlights Environmental Management Systems, Waste Minimisation, and Just-in-Time with TPM as key drivers. Despite these advances, Lean maturity models still rely on static weights and limited benchmarking approaches. These limitations are particularly critical in maintenance context, where multidimensional trade-offs are more pronounced. TPM therefore represents a natural extension of Lean for further analysis.
2.1.1 TPM maturity models
Compared with Lean and I4.0 maturity research, TPM-specific studies remain scarce. As a core Lean component, TPM links equipment reliability, resource efficiency and workforce involvement, enabling multidimensional performance trade-offs (Lucantoni et al., 2023).
A preliminary Scopus search for (“maturity model” AND “TPM”) returned only three studies, mostly addressing related concepts (e.g. 5S maturity or Total Project Management (Kumar et al. (2021), Žurga (2018)). Although Sanchez et al. (2019) propose a transition towards agile TPM, no structured quantitative framework is provided.
Expanding the query to (“maturity” AND “TPM”) yielded 18 papers. Most adopt a maturity perspective to assess TPM outcomes (e.g. OEE, reliability) (Badiger et al., 2008; Kwon and Lee, 2004) or Kaizen-based improvements (Vilarinho et al., 2018), rather than providing structured frameworks. TPM is also embedded in broader digital maturity models, but without explicit integration of human and environmental dimensions (Terelak-Tymczyna and Niesterowicz, 2024).
Only two studies propose explicit TPM maturity frameworks. Shaaban and Awni (2014) offer a qualitative, context-specific model based on critical success factors and three stages, without digital or environmental dimensions. Alidrisi (2020) applies MABAC to compute quantitative maturity scores using TPM pillars but relies on static weights, firm-specific normalisation and a non-manufacturing context. Overall, existing frameworks provide useful elements (pillar structuring, staged logic, quantitative scoring) but remain insufficient for I5.0 decision-making.
Across both Lean and TPM models, a common limitation is their cross-sectional nature, with limited evidence on longitudinal robustness, raising concerns about stability and relevance over time.
2.2 Research gap and contribution
OM maturity models increasingly support benchmarking, but are still and mostly pre-I5.0. Specifically, three gaps emerge in Lean maturity literature from both theoretical and industrial perspective:
Multidimensional TPM maturity. No model integrates HDG performance across all TPM pillars. This is critical, as improvement requires balancing human (skills and involvement, digital maintenance capabilities and green resource efficiency) dimensions across pillars. As shown in Table 1, among 14 Lean contributions integrating at least one HDG dimension, none provides full H×D×G integration; digital dominates, green is emerging and human remains partial, often limited to manufacturing skills or externalised to broader social effects. TPM-specific frameworks (Alidrisi, 2020; Shaaban and Awni, 2014) do not include environmental or digital dimensions.
Benchmarking architecture for heterogeneous contexts. Adaptive benchmarking accounting for sector, size and technology intensity is absent. Existing models rely on static weights and internal comparisons, limiting cross-firm learning and practical relevance, because firms, especially SMEs, operate under fundamentally different baselines and cannot meaningfully compare themselves against absolute standards. Table 1 confirms the absence of adaptive weighting mechanisms, consistent with recent OM literature (Ferraro et al., 2023; Nascimento et al., 2025).
Practical usability. Most models provide static assessments with limited translation into actionable priorities. Data-driven updating, feedback loops and explainability are rarely embedded, increasing obsolescence and reducing managerial trust. None of the 14 contributions reviewed in Table 1 (see “Dynamic/adaptive” column) includes structured adaptive mechanisms to keeping maturity tools current, despite growing interest in XAI and NLP for model interpretability and longevity documented in recent manufacturing intelligence literature (Lucantoni et al., 2025).
Based on these gaps, this study advances a context-sensitive and multidimensional TPM framework aligned with I5.0, enabling cross-firm benchmarking and translating diagnostic outputs into actionable HDG improvement priorities.
3. Methodology
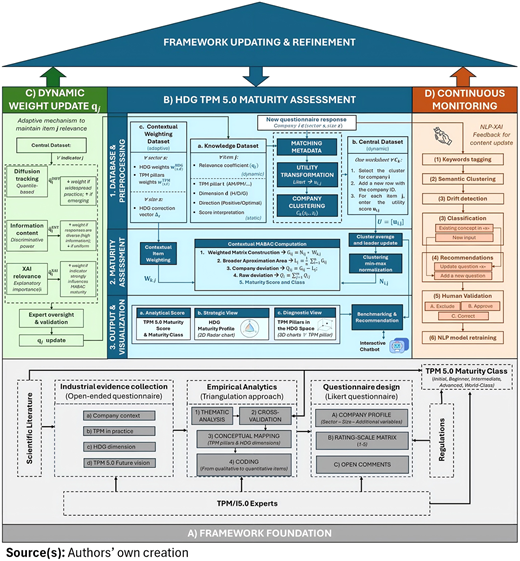
The HDG-TPM5.0 maturity framework (Figure 1) consists of a structured four-phase procedure designed to ensure that the tool is simultaneously grounded in empirical industrial evidence and scientific literature, and applicable to heterogeneous contexts. Phase A represents the foundation layer, where an initial industrial survey is developed, conducted and with evidence translated into measurable items and specific maturity taxonomy. Phase B operationalises the questionnaire into a scoring model through a cluster-based MABAC scheme, while XAI and NLP are used within support layers in Phases C and D. This sequence constitutes the methodological core of the framework and is detailed below.
3.1 Foundation layer (A)
The framework was developed through a multi-phase procedure combining industrial and scientific literature, resulting in a structured questionnaire designed in three steps: (1) evidence collection via a survey of TPM-oriented companies (Section 3.1.1), (2) translation of qualitative evidence into measurable items (Section 3.1.2) and (3) questionnaire design (Section 3.1.3). TPM5.0 maturity classes were also defined at this stage (Section 3.1.4).
3.1.1 Industrial evidence collection
Eight companies, differing in size and sector, were selected for semi-structured interviews to capture TPM implementation and its integration with HDG dimensions (Table 2). Interviews (60–90 minutes) involved personnel responsible for TPM coordination and covered: (1) company context, (2) TPM in practice, (3) human, (4) digital, (5) green and (6) future TPM5.0 perspective. The protocol was informed by TPM implementation models (Ahuja and Khamba, 2008; Ananth and Vinayagam, 2015), human-oriented TPM frameworks (Bashar et al., 2020), digital TPM approaches (Lucantoni et al., 2025; Seedao et al., 2025; Sivakumar et al., 2022) and sustainability-oriented maintenance models (Chen et al., 2019; Crosby and Badurdeen, 2022).
Companies surveyed
| ID | Sector (NACE Rev.2) | Role of respondent | Employees | TPM level self-assessment | Key TPM pillars | Distinctive features |
|---|---|---|---|---|---|---|
| A | C10–C12 Food, Beverage, Tobacco | Maintenance Manager | 341 | Intermediate | Autonomous, Planned, Quality | Digital CMMS, strong operator involvement, energy monitoring |
| B | C19–C21 Pharmaceutical | Maintenance Director | 491 | Advanced | Planned, Quality, Education | Predictive maintenance, IoT integration, GMP-oriented TPM |
| C | C26–C28 Automotive | Maintenance Manager | 184 | Intermediate | Autonomous, Planned | Sensor-based maintenance, OEE-driven planning |
| D | C13–C15 Textile | Production Engineer | 402 | Early–Intermediate | Autonomous, Planned | Training initiatives, moderate digital maturity |
| E | C19–C21 Chemical | Technical Director | 277 | Intermediate | Planned, Quality | Simulation-based planning, environmental KPI tracking |
| F | Transportation and Storage (Logistics) | Maintenance Supervisor | 110 | Early | Autonomous, Planned | CMMS adoption, culture of continuous improvement |
| G | C22–C25 Metalworking | Maintenance Manager | 65 | Early | Autonomous | Manual TPM logs, low digitalisation |
| H | Electricity, Gas, Steam, Renewable Energy | Plant Manager | 366 | Intermediate–Advanced | Planned, Quality, Safety | Predictive analytics, energy efficiency projects |
The cross-sector sample strengthened the identification of recurring practices and variability in HDG integration. The selection of eight companies ensures analytical generalisability, consistent with qualitative research standards: Eisenhardt (1989) recommends 4–10 cases as sufficient for constructing robust conceptual constructs in theory-building research, whilst (Yin, 2018) distinguishes between statistical and analytical generalisability; the latter involves the logical extension of theoretical constructs derived from a targeted set of cases and constitutes the appropriate criterion for studies developing a framework of this type. Maximum variation purposive sampling (Patton, 2002) was used, encompassing five NACE Rev.2 macro-sectors and three company size classes (small, medium and large according to the EU definition of SMEs), to capture differences in sector-specific priorities, digital maturity and resource constraints.
The framework’s validity is supported by content validity (grounded in the literature review) and face validity, confirmed through expert review and feedback from participating companies regarding the clarity and usefulness of the questionnaire and the results.
3.1.2 Empirical analysis
A triangulation approach (Denzin, 2012; Jick, 1979), combined practitioner interviews, the scientific literature and the HDG–TPM conceptual model to translate qualitative evidence into quantitative questionnaire items (Table 3). The procedure followed four steps: (1) thematic analysis of interview transcripts to extract TPM themes (Braun and Clarke, 2006; Fereday and Muir-Cochrane, 2006; Sovacool et al., 2023); (2) cross-validation with literature; (3) mapping of themes to TPM pillars and HDG dimensions and (4) coding into measurable items. For example, “Operators perform daily checks” was operationalised as “Frequency of operator involvement in daily maintenance and cleaning”, mapped to autonomous maintenance within the human dimension (AM–H), with positive scoring direction and ID1. These specifications populate the tool’s Knowledge dataset (Section 3.2.1).
From qualitative evidence to quantitative items
| Thematic analysis | Cross validation | Conceptual mapping | Coding | |||
|---|---|---|---|---|---|---|
| Empirical evidence from interviews | Literature grounding | TPM pillar | HDG dimension | Measurable items | Direction | ID |
| “Operators perform daily checks and minor cleaning” | Ahmed et al. (2023) | Autonomous Maintenance (AM) | Human | Frequency of operator involvement in Daily checks and cleaning | Optimal | 1 |
| “Competence matrix updated every six months” | Oeij et al. (2024) | Training and Education (T&E) | Human | Frequency of operator training in preventive maintenance tasks | Positive | 2 |
| “IoT sensors monitor vibration and temperature” | Mouhib et al. (2025), Zero et al. (2024) | Planned Maintenance (PM) | Digital | IoT sensors for health monitoring equipment (vibration, temperature) | Positive | 3 |
| “CMMS schedules maintenance based on cycles” | Hetmanczyk (2024) | Planned Maintenance (PM) | Digital | CMMS integration for maintenance planning, tracking, and reporting | Positive | 4 |
| “Replacing old compressors reduced energy use by 12%” | Jin et al. (2024) | Preventive Maintenance (PM) | Green | Energy monitoring and retrofitting in maintenance operations | Positive | 5 |
| “We use biodegradable cleaners and track waste” | Farajzadeh et al. (2024) | Preventive Maintenance (PM) | Green | Green maintenance materials and waste tracking | Positive | 6 |
3.1.3 Questionnaire design
The three HDG dimensions are operationalised as latent constructs, each measured through behaviourally anchored items mapped to TPM pillars. This multi-level structure links observable item-level behaviours to pillar-dimension scores to construct-level HDG indices, ensuring that constructs are grounded in assessable practices rather than self-reported perceptions.
The H dimension includes items on operator training (E and T, AM), ergonomics and safety practices (SHE), operator autonomy and involvement (AM, FI), and inclusiveness of training and improvement programmes (E and T).
The D dimension includes use of IoT and real-time monitoring (PM), CMMS and digital planning tools (PM, O-TM), predictive analytics (PM) and cross-functional digital tool use (O-TM).
The G dimension includes energy monitoring in maintenance (PM), eco-efficiency in inspection and quality routines (FI), sustainable materials and waste minimisation (PM) and eco-design in equipment procurement (EEM).
All items are scored on a five-point scale with behaviourally defined levels (presence/absence of practices, tools or procedures), reducing interpretation variability and improving comparability across firms (Hajoary et al., 2024).
The resulting questionnaire includes:
Company profile, capturing contextual variables for clustering and benchmarking (NACE Rev.2 sector, EU SME size classification, TPM duration and involved personnel);.
Rating-scale matrix, using a 5-point Likert scale (1 = Not implemented, 5 = Fully).
Open comments, capturing qualitative feedback for refinement and updating.
Items are designed as granular, diagnostically focused indicators, each capturing a single observable practice with a clear interpretation. Each item is linked to one HDG dimension and TPM pillar, while pillars include multiple dimensions and dimensions span multiple pillars.
This design ensures multidimensional assessment emerges at the aggregate level, without requiring additional weighting across dimensions or pillars, thus reducing subjectivity and improving transparency and comparability.
3.1.4 TPM5.0 maturity classes
The final maturity level is assigned using six classes (Sajjad et al., 2024): Outsider [0, 10]%, Beginner ]10, 20]%, Intermediate ]20, 40]%, Experienced ]40, 60]%, Expert ]60, 80]% and Top performer ]80, 100]%.
3.2 Maturity assessment (B)
The assessment includes three modules: (1) database and preprocessing (Section 3.2.1), (2) maturity assessment (Section 3.2.2) and (3) output visualisation for benchmarking (Section 3.2.3).
Conceptually, the pipeline operates as follows: (1) questionnaire responses are converted into utilities ; (2) utilities are stored in a central dataset organised by sector–size clusters; (3) each item receives a contextual weight combining HDG, TPM and diagnostic components; (4) MABAC computes maturity as a weighted deviation from cluster benchmark and (5) good practices are identified from peers.
3.2.1 Module 1: databases and questionnaire preprocessing
Module 1 standardises questionnaire inputs for contextual benchmarking. Specifically, three datasets support the process: a Knowledge Dataset (versioned), a Central Dataset (dynamic) and a Contextual Dataset (adaptive).
Knowledge Dataset (Table 4) and utility conversion. For each item , the dataset includes: item ID, TPM pillar , HDG dimension , diagnostic leverage coefficient , scoring direction and Likert interpretation.
Knowledge dataset extraction
| Item ID | TPM pillar | HDG dimension | Indicator | Direction | Likert | Interpretation |
|---|---|---|---|---|---|---|
| 1 | AM | H | Optimal | 1 | Low autonomy | |
| 2 | Reactive maintenance remains reactive | |||||
| 3 | Balanced and efficient routine (optimal) | |||||
| 4 | Excessive frequency | |||||
| 5 | Inefficient or stressful | |||||
| 2 | T&E | H | Positive | 1 | Competencies not tracked | |
| … | … | |||||
| 5 | Demonstrable skill transfer | |||||
| 3 | PM | D | Positive | 1 | Manual inspection only | |
| … | … | |||||
| 5 | Continuous condition monitoring |
Item tags derived from the triangulation process (Section 3.1), while and scoring rules are defined by TPM and I5.0 experts. The coefficient captures the discriminative power of item j and is bound to preserve interpretability:
The three tiers (basic/standard/advanced) are ordinal and do not imply equidistant maturity intervals. For instance, within the digital dimension and the PM pillar, Excel-based maintenance tracking represents a basic stage, whereas AI/ML-based predictive tools represent an advanced stage and are therefore assigned with higher leverage. that the coefficient is not the final item weight, but is later combined with contextual parameters (Eqs. 4–8) to obtain effective weights.
To ensure comparability, each Likert response is mapped to a utility . For positive-direction items, higher scores indicate higher maturity; for optimal-direction items, maturity peaks at a target :
Central dataset and clustering. For each company , the utility vector ] is stored in the central dataset. Records are grouped into sector-size clusters to ensure benchmarking against comparable peers:
Within each cluster, data are stored as a company-by-items matrix.
Contextual weighting dataset. This dataset calibrates item weights for heterogeneous contexts. First, sector-based TPM pillar weights define pillar relevance:
Second, sector-based HDG weights define dimension relevance:
Third, size effects are captured by a correction vector:
Size-adjusted HDG weights are:
and normalised:
3.2.2 Module 2: maturity assessment
Module 2 quantifies TPM5.0 maturity via peer benchmarking within clusters k = (s, z). A multiple-criteria decision-making approach is adopted; MABAC is selected for its transparency and ability to express maturity as deviation from a reference level (Torkayesh et al., 2023).
Step 1: Cluster normalisation. Utilities are rescaled within cluster using min–max normalisation:
where and are computed across firms in . Values above (below) 0.5 indicate above- (below-)average performance.
Step 2: Contextual item weighting. Each item is assigned a contextual weight that combines strategic relevance (HDG), operational relevance (TPM) and diagnostic leverage:
Step 3: Weighted performance. Normalised values are weighted to obtain:
Step 4: Cluster benchmark. For each item , the reference level is the cluster mean (with firms in ):
Step 5: Deviation from benchmark. Firm deviation on item j is:
with indicating above-benchmark performance.
Step 6: Raw maturity deviation. Deviations are aggregated across the m questionnaire items:
Step 7: Maturity index and class. To preserve longitudinal comparability, each cluster uses fixed calibration bounds estimated in the pilot phase. The maturity index is computed as:
and then mapped to the six maturity classes defined in Section 3.1.4.
3.2.3 Module 3: benchmarking and recommendations
Module 3 translates results into an interpretable benchmarking narrative, combining maturity index, class and HDG/pillar-level diagnostics. Benchmarking is performed within sector-size clusters using aggregated data, ensuring comparability and confidentiality.
Strategic view (HDG radar). Dimension-level maturity is obtained by aggregating item-level deviations within each HDG dimension d and comparing them to the cluster average:
This view highlights whether maturity constraints originate primarily from Human routines, digital maintenance capabilities or green/resource-efficiency practices.
Pillars near the origin align with peers; negative deviations indicate weaknesses. A colour scale conveys deviation intensity.
Once weak pillars and dimensions are identified, benchmarking against top performers highlights gap drivers and best practices within cluster . Recommendations follow the same decomposition logic, linking HDG signals to pillar-level actions aligning with the TPM5.0 emphasis on explainability and adaptability. To support interactive exploration, a chatbot can provide clarifications on scores, benchmarks and recommended actions.
3.3 Framework updating and refinement
To ensure long-term relevance, the framework includes a structured updating mechanism combining dynamic weight update module (C) and continuous monitoring module (D), allowing indicators to evolve in response to technological and organisational changes. Data-driven process based on quantitative signals (e.g. weight dynamics, dispersion) and qualitative signals (NLP-detected trends) inform annual updates of and periodic (3–5 years) revision of questionnaire and contextual weights. Any expert-approved changes are introduced through controlled roll-out and documented versioning.
3.3.1 Dynamic weight update mechanism (C)
Item leverage is updated to reflect periodic diffusion and relevance through an expert-mediated procedure. The rationale is that should be downgraded when the practice captured by item becomes mainstream and ceases to differentiate firms and upgraded when it captures emerging practices that still provide strong discriminatory power. Importantly, the mechanism supports experts by producing data-driven proposals for tier transitions over time (e.g. standard basic). Each year, three signals are computed from item’s response:
Diffusion tracking (quantile-based): This signal down-weights items that become widely adopted and up-weights emerging differentiators. Let be the share of firms that reach an “advanced adoption” threshold . The diffusion adjustment is:
where is the previous-year leverage weight and controls sensitivity (0.2–0.3). If most firms already implement the practice captured by item (e.g. a CMMS), its relevance tends to decrease because it no longer separates firms; conversely, less-diffused practices (e.g. AI-based predictive maintenance) may gain relevance.
Information content (discriminative power): Diffusion alone may not capture whether an item still separates firms; therefore, a second signal measures response variability. Items with homogeneous responses carry limited information and are down-weighted, whereas items with heterogeneous adoption remain informative:
where quantifies response variability for item , and is typically 0.1–0.3.
XAI relevance: A third signal uses explainability to quantify how much each item contributes to maturity classification in the previous-year models. Items with higher contribution are candidates for higher weights:
where is the normalised SHAP importance and t ≤ 0.2 bounds the impact of XAI signal.
The three signals are combined into a single multiplicative proposal:
Proposed updates are validated by experts and smoothed to prevent abrupt year-to-year changes:
whit enforcing gradual evolution. After approval, the updated value is expressed as an ordinal tier (basic/standard/advanced).
3.3.2 Continuous monitoring (D)
Open-ended responses are analysed to support structured feedback and guide expert-led questionnaire refinement without affecting scores. These questions are intentionally included to capture insights, emerging practices and contextual information not fully represented by structured items.
The NLP layer acts as a support tool for qualitative interpretation and continuous improvement. It does not directly influence maturity scoring; instead, it produces reviewable evidence to enhance understanding, detect emerging needs and support periodic questionnaire updates. The analysis is structured as follows:
Keyword tagging: key terms are extracted and displayed as tags to speed up screening (e.g. “Power BI”, “REST API”, “MES”).
Semantic clustering: responses are grouped into standardised categories to reduce linguistic variability and highlight recurring themes.
Drift detection: changes in terminology and topic prevalence are monitored over time to identify emerging practices (e.g. “5G-enabled edge computing”, “generative-AI”).
Classification: responses are classified as existing or emerging practices to structure the review process.
Recommendations panel: the system suggests targeted updates (e.g. refining item wording or identifying candidate topics for future questionnaire inclusion).
Expert validation and retraining: all NLP outputs are reviewed by domain experts, who approve, refine or reject suggestions; validated annotations are used to periodically retrain the model, improving consistency.
The insights generated provide qualitative evidence complementing the quantitative signals used in layer C. They support expert interpretation of emerging practices and potential item obsolescence without directly modifying model parameters.
4. Illustrative application of the framework
This section provides an end-to-end illustration of the HDG–TPM5.0 maturity framework using Company-C07, a small firm in the Food, Beverage and Tobacco sector (NACE C10–C12). C07 is assigned to the Food-Small peer cluster . The purpose is to demonstrate the workflow from preprocessing to maturity index computation, class assignment and benchmark-driven recommendations.
4.1 Data preprocessing
Company C07 completed the full questionnaire. For each item j: (1) the responses were linked to the Knowledge dataset (pillar , dimension , direction/target, Likert interpretation and leverage weight ); and (2) the Likert score was converted into a utility value using Eq. (2). Most items are positively oriented; for optimal-direction items, the target is . In this pilot case, leverage weights are set as . Table 5 reports an extract of this step. The resulting utility vector for C07 is .
Preprocessing (extract)
| New INPUT | Matching METADATA (from the knowledge dataset) | Utility TRANSFORMATION | ||||||
|---|---|---|---|---|---|---|---|---|
| Item | Likert | Interpretation | Pillar | Dim. | Direction | Utility (0–1) | ||
| ID1 | 4 | Excessive frequency | AM | H | optimal | 3 | 1,0 | |
| ID2 | 5 | Continuous training | T&E | H | positive | – | 1,0 | |
| ID3 | 4 | Analytical capability | PM | D | positive | – | 1,2 | |
| … | … | … | … | … | … | … | … | … |
Utilities are then appended to the cluster-specific matrix , which stores responses from firms in the same sector–size cluster (C07 and six peers). Rows represent companies, columns items and each cell stores :
4.2 Contextual weighting
Contextual parameters are retrieved from the contextual dataset, combining sector priorities (HDG and TPM pillar weights) and size correction factors. For the Food-Small cluster:
Size correction vector (Small): (1,05; 1,00; 0,95)
Sector-based HDG weights (Food):
Sector-based TPM pillar weights (Food):
Following Eq. (7), size-adjusted HDG weights are:
= 0,45*1,05 = 0,4725; = 0,30*1,00 = 0,3000; = 0,25*0,95 = 0,2375
Their sum is ; thus, normalised weights (Eq. 8) are:
Hence,
4.3 Maturity assessment (worked example on item ID3)
To illustrate the intra-cluster MABAC logic, the full computation is shown for item ID3, classified as digital-planned maintenance (D-PM).
Step 1 Cluster normalisation (Eq. 9): In the Food|Small cluster, for ID3: , and .
Step 2 Contextual item weight (Eq. 10): For D–PM: , and
= = 0,0428
Step 3 Weighted value (Eq. 11):
Step 4 Cluster reference level (Eq. 12): With firms in the cluster:
) = 0,0260
Step 5 Deviation (Eq. 13):
= 0,0285 − 0,0260 = + 0,0025
Thus, C07 performs slightly above the Food|Small cluster benchmark on this specific D–PM item (ID3).
4.4 Maturity score and class assignment
Applying the procedure to all items yields the deviation profile . Table 6 reports deviations aggregated by pillar and HDG dimension, supporting both analytical results and the visual diagnostics.
Deviation profile for C07
| TPM pillar | Human | Digital | Green | Total per pillar |
|---|---|---|---|---|
| AM | 0,0009 | 0,0006 | 0,0002 | 0,0017 |
| PM | 0,0003 | 0,0012 | 0,0002 | 0,0017 |
| QM | 0,0004 | 0,0007 | 0 | 0,0011 |
| MP | 0,0002 | 0,0004 | −0,0009 | 0,0006 |
| FI | 0,0003 | 0,0004 | −0,0002 | 0,0007 |
| EEM | 0,0006 | 0,0005 | 0,0001 | 0,0012 |
| T&E | 0,0005 | 0,0001 | 0 | 0,0006 |
| O-TM | 0,0002 | 0 | −0,0001 | 0,0002 |
| TOTAL per dimension | 0,0034 | 0,0039 | 0,0005 | 0.0078 |
This matrix provides the basis for computing the maturity index and benchmarking visualisations. Specifically, it reports: (a) the overall deviation (Eq. 14); (b) HDG-level deviations (Eq.16), e.g. and (c) pillar-dimension deviations (Eq. 17), e.g. = 0,0009.
As this is a pilot application, calibration bounds for the Food-Small cluster will be finalised with a larger sample. For illustrations, provisional bounds are used:
The maturity index is computed via min–max rescaling (Eq. 15):
According to the taxonomy, 72% ∈ , thus C07 is classified as Expert.
4.5 Output visualisation, benchmarking and recommendations
The output layer reports the analytical score (index and class) and two views (Figure 2):
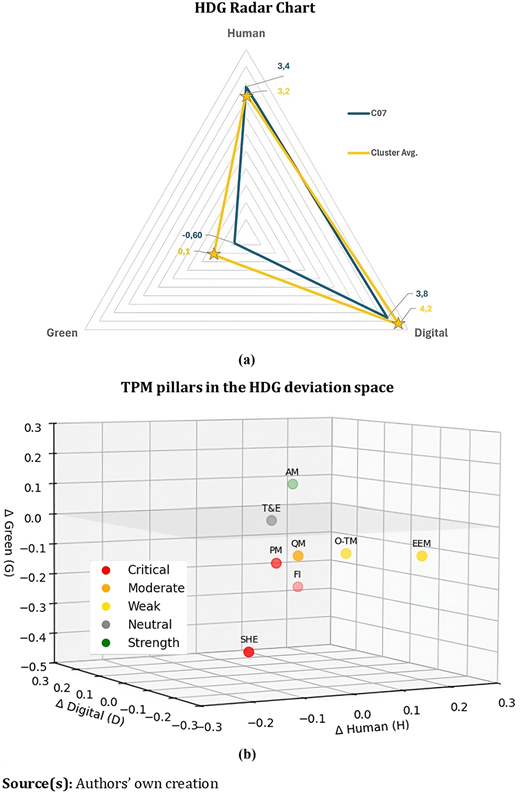
Strategic view (a): the HDG radar shows an asymmetric profile: Human maturity aligns with the Food-Small benchmark, while Digital and Green are below average.
Diagnostic view (b): the 3D-HDG space highlights three critical pillars (SHE, PM, FI) in red. SHE and FI are mainly displaced along the negative G axis, while PM lies mainly in the negative D region. EEM and O-TM are moderately weak (yellow), with negative D and G partially offset by positive H. Similar in D and G dimensions, QM is moderate (orange), with an H near the cluster mean (coordinate close to zero). T&E is near the centroid, indicating a balanced performance, while AM emerges as a relative strength across all dimensions.
Benchmarking against cluster frontrunners clarifies gap drivers. In Food-Small, digital leaders combine CMMS integration, sensor-based condition monitoring and predictive analytics, while Green leaders, rely on energy dashboards, eco-efficiency routines and environmental Key Performance Indicators (KPIs). Consistent with C07’s profiles, two priorities emerge: strengthening the instrumentation layer (sensing, monitoring, data collection) and the analytical layer (predictive tools and sustainability metrics).
Accordingly, recommendations are expressed as follows: Given the current position in the digital dimension, particularly within the PM pillar, priority actions include deploying a connected CMMS, implementing IoT sensing on critical assets and adopting basic predictive analytics, which cluster frontrunners use as primary drivers. In addition, given the negative green deviations in SHE and FI, energy and waste mapping tools, eco-efficiency projects and dashboards tracking key environmental KPIs represent the practices that distinguish environmental leaders in the Food|Small cluster.
4.6 Inputs for updating and refinement
Applying the framework to C07 feeds both the quantitative adaptation loop and qualitative learning loop (Sections 3.3.1-3.3.2).
At the quantitative level, adding C07 updates cluster statistics and influences the annual review (Table 7). In this case, digital–PM (ID3) and green–FI (ID18) remain differentiating practices, while widely adopted items (e.g. human–T&E, ID22 or common digital O-TM tools) lose discriminative power and are down-weighted candidates.
Impact of C07 on weights
| Item ID | Dimension–Pillar and item focus | Effect on cluster percentiles (α) | Effect on entropy (β) | Effect on SHAP relevance (γ) | Implication for |
|---|---|---|---|---|---|
| ID3 | D-PM: use of IoT devices and real-time sensors for equipment health monitoring | Widens the gap between upper and lower quantiles due to C07’s low adoption | High dispersion preserved | High SHAP, as it strongly contributes to the Digital deficit | Potential weight increase (emerging differentiator) |
| ID5 | G-MP: energy monitoring and improvement actions in maintenance operations | Reinforces a low lower-quartile, confirming systematic underperformance | Moderate entropy (stable weakness across firms) | Moderate SHAP as a persistent negative driver | Slight weight increase (still discriminative) |
| ID12 | D-OTM: cross-functional use of digital tools in operations and teamwork | Convergence of scores around the upper quantiles | Entropy decreases (practice becoming standard) | Low SHAP, as it no longer explains maturity differences | Likely weight decrease (no longer informative) |
| ID18 | G-FI: integration of eco-efficiency criteria in inspection and quality routines | Increases heterogeneity in the central and upper quantiles | Entropy increases (diverging adoption patterns) | High SHAP for explaining the Green deficit | Potential weight increase (key indicator of G maturity) |
| ID22 | H-T&E: frequency and coverage of operator training and education in maintenance-related tasks | Upper quantiles further consolidated at high values | Low entropy (uniform good practice across the cluster) | Low SHAP, as it rarely drives maturity differences | Likely weight decrease (mature, non-discriminative item) |
At the qualitative level, open-ended responses enter the NLP monitoring cycle. Signals such as “energy dashboard prototypes” and “sensor calibration issues” are clustered across Food-Small firms, revealing: (1) diffusion of early-stage environmental dashboards (supporting future refinement of G-related items) and increasing reliance on sensing infrastructures (reinforcing drift detection in digital terminology). After expert validation, these signals inform next questionnaire updates and the refinement of contextual weights.
4.7 Results
The pilot illustrates how the framework translates questionnaire responses into benchmarked and actionable maturity insights. C07 shows an asymmetric HDG profile: Human practices align with peer-cluster reference, while digital and green maturity lag. The HDG radar highlights these imbalances, and the 3D pillar representation further localises them across TPM pillars: PM drives the digital deficit, while SHE and FI account for most of the digital and green shortfall, indicating relatively strong people-related routines despite gaps in digitalisation and eco-efficiency.
Consistent with benchmarking, actions target gap-driving pillars, prioritising digital enablement in PM and eco-efficiency routines in SHE/FI. Priority actions include: (1) in digital (PM), deploying connected CMMS, IoT sensing and predictive analytics and (2) in green (SHE, FI), energy and waste mapping tools, eco-efficiency projects and environmental KPI dashboards.
From a managerial perspective, these results indicate that firms should prioritise strengthening the digital infrastructure of maintenance systems while integrating environmental practices into routine operations. The framework supports this process by linking HDG gaps to specific pillars, enabling managers to allocate resources more effectively and align improvement initiatives with peer-based benchmarks.
A sensitivity analysis was conducted on the contextual weighting structure. For HDG weights, one-at-a-time perturbations of ±20% show limited variation in the raw maturity deviation (within approximately ±4.3%), with the largest impact associated with the digital dimension. A similar analysis on TPM pillar weights yields even lower variation (within approximately ±2%), confirming that results are not driven by moderate changes in operational weight allocation. At the item level, weight dynamics are governed by the adaptive update mechanism (Module C), which adjusts leverage based on diffusion, information content and XAI relevance. This further reduces sensitivity to static weight assumptions over time. Overall, these results confirm that moderate variations in the weighting structure do not alter the interpretation of the maturity profile or the identification of priority areas, supporting the robustness of the framework.
The case also illustrates the adaptive layer: differentiating items (e.g. ID3 and ID18) retain relevance, while widely adopted practices progressively lose weight.
5. Discussions
This section discusses the study's contributions in relation to the three research gaps identified in the introduction. Gap (1), namely the absence of a multidimensional TPM maturity model integrating HDG performance across all pillars, is addressed by the framework's core architecture, operationalising TPM maturity as a three-dimensional H×D×G construct mapped onto all pillars and demonstrated in the illustrative application. Gap (2), i.e. the lack of adaptive benchmarking for heterogeneous industrial contexts, is addressed by contextual weighting architecture and cluster-based peer normalisation, enabling cross-firm comparison across sector, size and technological intensities without requiring a common absolute reference. Gap (3), i.e. the limited usability of existing models due to static logic and absence of updating mechanisms, is addressed by the XAI-based explainability layer, the NLP-based monitoring and recalibration cycle, thereby reducing obsolescence risk and improving managerial relevance. The remainder of this section elaborates on these contributions in terms of theoretical significance and practical implications.
5.1 Theoretical contributions
As highlighted in the literature review, TPM maturity research remains limited, with few structured frameworks and none fully integrating digital and environmental dimensions. This gap is not only theoretical but reflects a concrete managerial need, as confirmed by interview evidence, showing demand for integrated tools capturing HDG dimensions simultaneously.
The review of Lean assessment tools highlights substantial heterogeneity in scope and resource requirements, with assessments often relying on context-specific selection or ad hoc integration rather than robust benchmarking (Närvä and Bicheno, 2026). In this context, the proposed HDG–TPM5.0 framework advances TPM maturity research and the broader maturity-model literature by combining peer-cluster benchmarking with mechanisms for controlled model evolution, improving cross-firm comparability and addressing the obsolescence in static tools (Table 8).
Key differences among TPM maturity models
| Features | Shaaban and Awni (2014) | Alidrisi (2020) | Proposed HDG TPM 5.0 model |
|---|---|---|---|
| Maturity levels | 3 stages (Pilot, Deployment, Continuous Improvement) | 5 levels (Basic to World Class) | 5 levels extended to HDG multidimensional structure |
| Focus areas | TPM pillars | TPM pillars | TPM pillars + HDG dimensions |
| Digital dimension | Not addressed | Not addressed | Explicitly modelled across all pillars |
| Human dimension | Limited | Limited (AM only) | Explicitly modelled across all pillars |
| Green dimension | Not considered | Not considered | Explicitly modelled across all pillars |
| Scoring logic | Qualitative categorisation | Quantitative per pillar | Three-layer scoring: Overall→ HDG (2D)→ TPM pillars on HDG space (3D) |
| Normalisation | Implicit; based on qualitative expert judgement | Firm-specific bounds (non-comparable) | Cluster-referenced, comparable across firms |
| Weighting mechanism | Static | Static fuzzy linguistic weights | Contextual weighting (sector*size*item relevance) + dynamic updates |
| Benchmarking logic | Not defined (case-based insights only) | Global ranking | Cluster-specific, context sensitive |
| Explainability | None | None | Integrated |
| Qualitative input | Not systematically included | None | NLP-driven analysis, drift detection |
| Operator interface | N/A | N/A | Interactive dashboard and chatbot |
| Improvement recommendations | General advice | Implicit logic | Data-driven (based on cluster frontrunners' practices), dimension- and pillar-specific |
The framework contributes to three main ways. First, it conceptualises TPM maturity as a multidimensional construct articulated along human-digital-green axes and mapped onto the TPM pillars, enabling a diagnostic interpretation of whether underperformance relates to people, technologies or environmental practices. Second, it replaces context-independent importance schemes with contextual weighting architecture , incorporating sector priorities, pillar relevance and size constraints. Methodologically, it adapts MABAC into a benchmarking-oriented maturity assessment by combining peer-cluster normalisation with contextual weights and item-level leverage, enabling comparison within homogeneous references rather than firm-specific rescaling. Third, it introduces an adaptive layer extending assessment beyond static measurement: diffusion dynamics, entropy-based signals and SHAP relevance support controlled weight updates, while NLP monitoring of open-ended inputs captures emerging practices and terminology shifts, strengthening continuous learning and refinement.
5.2 Practical implications
The HDG–TPM5.0 framework provides a decision-support tool applicable across heterogeneous firms by interpreting maturity relative to sector–size peers, rather than absolute scores. This enables fair benchmarking under different technological and organisational baselines and supports balanced HDG improvement pathways, while aggregated cluster benchmarking preserves data confidentiality, as firms are not required to disclose sensitive information while still benefiting from peer comparison.
A key innovation is the pillar-level HDG visualisation, which translates results into an actionable diagnostic by positioning each TPM pillar in the HDG space and highlighting dimension-specific gaps. This supports coordinated interventions (e.g. combining training, digital tools and sustainability practices) and facilitate prioritisation and resource allocation.
Adoption is strengthened by explainability and learning layers. Explainability clarifies item-level drivers, improving interpretability and trust, while the monitoring layer processes open-ended inputs to detect emerging practices and support repeated use over time, reducing managerial effort and obsolescence. Weights recalibration is implemented as a centralised periodic process managed by the benchmark administrator and does not impose additional burden on firms that interact exclusively with the questionnaire. The framework remains therefore scalable for SMEs and large enterprises. AI, NLP and XAI operate only as supporting infrastructure at the monitoring and explainability levels (sections C and D of Figure 1) and do not influence HDG scores. The HDG balance is ensured through three independent weighting flows and maturity scores, and the contextual weighting architecture can amplify the H and G where digital maturity is already high, counteracting any tendency for the digital dimension to dominate. The 3D pillar-level visualisation makes dimension-specific gaps directly actionable, ensuring that high digital performance does not mask human or environmental weakness, allowing improvement priorities for H and G, not for digital. This puts into practice the fundamental principle of I5.0, according to which the digital and green transitions must reinforce rather than overshadow the human dimension (Xu et al., 2021).
Beyond managerial use, the framework supports executive education and policy design by enabling evidence-based benchmarking and targeted incentives for digitalisation, sustainability and safety improvements. The three dimensions are consistent with EU regulatory and reporting instruments, extending the framework beyond operational benchmarking to corporate compliance. The Human dimension aligns with the EU Strategic Framework for Safety and Health at Work 2021–2027 and the European Sustainability Reporting Standards (ESRS) S1 “Own workforce” under the Corporate Sustainability Reporting Directive (CSRD, Directive, 2022/2464/EU): its indicators, covering training equity, ergonomic safety and workforce empowerment, are structurally consistent with the ESRS-S1 disclosure requirements. The digital dimension aligns with the EU AI Act requirements on transparency and human oversight in industrial AI systems; the XAI component directly addresses these explainability-by-design obligations. The green dimension aligns with the EU Taxonomy Regulation (Regulation, 2020/852), particularly its technical screening criteria for climate change mitigation and the circular economy, and with ESRS E1 (Climate Change) and E5 (Resource Use and Circular Economy) under the CSRD: indicators related to energy monitoring in maintenance operations and eco-efficiency in EEM are directly consistent with these reporting areas. The HDG-TPM5.0 framework can therefore support manufacturing companies in assessing operational readiness for CSRD social, digital and environmental disclosure requirements.
6. Conclusions, limitations and future research directions
Effective TPM remains central to equipment reliability, safety and resource efficiency, and must evolve towards human-centric, digital and sustainable practices under I5.0. This article introduced an HDG-oriented TPM5.0 maturity framework enabling heterogenous firms to assess maintenance maturity across Human, Digital, and Green dimensions and link results to TPM pillars.
The framework delivers: (1) a multidimensional benchmarking-oriented maturity index and (2) a contextual weighting architecture combining item-level leverage with sector–size and pillar-specific priorities, enabling peer-referenced assessment rather than absolute scoring. Benchmarking plays a dual role: it provides the maturity criterion while identifying best practices characterising higher performance across HDG dimensions and TPM pillars. Results are communicated through a 3D-HDG representation positioning each TPM pillar in the H–D–G space and comparing the firm profile with peer-clusters, reference making both the magnitude and direction of maturity gaps immediately interpretable for managers. XAI and NLP enhance transparency and support continuous learning and refinement.
Key limitations expandable in future researches include: (1) the pilot nature of the empirical application, limited to a single sector–size cluster; results should therefore illustrative and analytically generalisable rather than statistically; (2) reliance on expert elicitation in questionnaire design and weighting, although grounded in literature, may introduce potential subjectivity; (3) the exploratory nature of the dynamic update mechanism and NLP/XAI monitoring layer.
In terms of data intensity, the questionnaire minimises the administrative burden through a structured Likert-scale format with open-ended comments, administered to TPM-related personnel. NLP automates signal extraction from qualitative responses, reducing analytical workload; data intensity depends on benchmark size rather than firm resources. Expert judgement follows standard MCDM practices when large datasets are unavailable (Alidrisi, 2020; Benmamoun et al., 2025; Hajoary et al., 2024; Vikas and Mishra, 2024), with bias mitigated through: (a) triangulation with literature and interviews, (b) dynamic updating progressively replacing expert-defined weights with data-driven estimates and (c) structured consistency review of the panel’s calibration decisions.
Future research will expand the empirical base across sectors and firm sizes to build robust benchmark frontiers and enable formal validation (reliability, construct and criterion validity). Larger samples will also support longitudinal analyses linking HDG–TPM5.0 maturity to operational and sustainability outcomes and enable versioned updates. Planned validation includes: (1) at least three multi-cluster deployments for reliability testing, (2) confirmatory analysis of the HDG construct via structural equation modelling and (3) criterion validity testing against independent operational and sustainability indicators.
Declaration of Generative AI and AI-assisted technologies in the writing process
During the preparation of this work, the authors used generative AI to improve readability and language. After using this service, the authors reviewed and edited the content as needed and take full responsibility for the content of the publication.
