


The study aims to explore the influence of selected precursors to self-service technology customer experience (when using chatbots) and the role of trustworthiness, control and self-service technology customer experience on self-service technology satisfaction.
The study applied an explanatory research design and data collection was secured through self-administered questionnaires from millennials who engaged with a chatbot over six months. A total of 359 responses were used for data analysis. The measurement and structural models were assessed using structural equation modelling.
Perceived usefulness, perceived playfulness and perceived ease of use significantly and positively influence chatbot self-service technology experience. Moreover, trustworthiness, chatbot self-service technology experience and control significantly and positively influence self-service technology satisfaction.
The tested model validates the hypothesised relationships between perceived usefulness, perceived playfulness, perceived ease of use, self-service technology experience, trustworthiness, control and chatbot self-service technology satisfaction. As such, chatbot users’ self-service technology experiences are directly linked to their three precursors and postcedent, self-service technology satisfaction. Conclusively, self-service technology satisfaction is directly guided by users’ trustworthiness and control when engaging with chatbots.
The study’s results can assist businesses to better understand the drivers of millennials’ self-service technology experiences with chatbots. Furthermore, it can guide these businesses on the critical importance of trustworthiness, self-service technology experience and control as drivers of self-service technology satisfaction.
Limited studies have examined how millennials’ self-service technology experiences relate to selected precursors and postcedents in emerging African markets.
1. Introduction
Chatbots have become a fundamental tool in the customer service sector, propelled by technological advancements and a growing demand for self-service solutions that offer 24/7 assistance (Joshi, 2021). These tools resonate strongly with millennials globally, a generation aged 28–44 as of 2025 that not only prefers technology-driven interactions, but also values efficient, personalised service. Chatbots meet these needs by providing immediate responses and simplifying transactions, thereby enhancing the customer experience and aligning seamlessly with the digital lifestyle of millennials worldwide (Hecht, 2024; Lissitsa and Kol, 2016; Murtarelli et al., 2023).
Utilising sophisticated algorithms, chatbots simulate human conversations, allowing users to engage with digital platforms as though they are interacting with a real person (Oracle, 2020). The growing reliance on messaging as the primary communication channel, coupled with advancements in natural language processing (NLP), has significantly boosted chatbots’ utility in customer service (Gnewuch et al., 2018). For millennials across the world who have grown up with technology since the smartphone era, chatbots are not just a convenience; they are a necessity. These tools facilitate routine tasks, reduce costs, and provide personalised, accessible customer experiences at any time, positioning millennials as the prime beneficiaries of chatbot services (De Cicco et al., 2020).
In South Africa, as an emerging market making up nearly half of the adult population, millennials exhibit unique consumer behaviours that differentiate them from their global counterparts (Bizcommunity, 2023). As a demographic where the median age is 27 and over 70% are under 40, these digital natives are particularly receptive to new technologies (Bizcommunity, 2023; Hecht, 2024). Their deep familiarity with technology and demand for rapid, personalised interactions position them as ideal chatbot users. These tools provide real-time, informal customer support and significantly enhance service efficiency, aligning perfectly with South African millennials’ preferences (Hyken, 2017; Mero, 2018). This makes chatbots a significant opportunity in a market characterised by tech-savvy consumers eager for innovative solutions and enhanced experience. For example, the swift expansion of the global chatbot market – projected to rise from USD5.39bn in 2023 to USD42.83bn by 2033 at a compound annual growth rate of 23.03% – highlights the increasing integration of chatbots across various sectors (Spherical Insights LLP, 2024). This growth is driven largely by advancements in artificial intelligence (AI) and the extensive use of messaging apps, which facilitate the deployment of chatbots across diverse platforms (Haleem et al., 2022). Despite millennials generally trusting chatbot competence, the chatbot industry still faces significant challenges that could impede its growth. A widespread lack of awareness about the effective applications of chatbots and the challenge of standing out among numerous competitors pose substantial hurdles (Alexander and Kent, 2022). In a competitive landscape like South Africa, delivering a differentiated experience could be key to driving engagement and achieving customer satisfaction (Cvitanović, 2018; Djelassi et al., 2018).
Furthermore, scholars like Gefen et al. (2003) and Morozova (2018) argue that trust and control are fundamental factors that shape customers’ online shopping experiences and boost customer satisfaction with chatbots. Trust ensures that customers feel secure, which is crucial for expanding market reach (Gefen et al., 2003; Morozova, 2018). Control, particularly over how interactions are managed, is key to millennials’ acceptance and continued use of chatbots, emphasising the need for delivering high-quality, personalised messages to enhance engagement (Song and Zinkhan, 2008; Whang et al., 2022). As such, chatbots significantly influence millennials’ satisfaction and loyalty by providing quick access to information and simplifying the online shopping process (Lissitsa and Kol, 2016; Murtarelli et al., 2023; Pizzi et al., 2021). This improved customer service dynamic leads to a more interactive customer experience and increased purchase intentions (Song and Zinkhan, 2008; Whang et al., 2022). In addition, ensuring the security of data access and maintaining trustworthiness are imperative for leveraging chatbots effectively to boost customer engagement with consumer groups, such as millennials (Hasal et al., 2021; Tan and Liew, 2022).
This study emphasises well-established variables like perceived usefulness, playfulness, and ease of use, based on their relevance and prevalence in studies on technology acceptance and self-service technology (SST) experiences (specifically chatbot experiences) among millennials (Ashfaq et al., 2020; Djelassi et al., 2018). Additionally, trustworthiness and control are integral constructs, as they significantly influence SST satisfaction (specifically chatbot satisfaction). Trustworthiness fosters a sense of reliability in interactions, encouraging users to engage more fully, while a sense of control enhances user autonomy, leading to greater satisfaction with the technology (Johnson et al., 2008; Wang et al., 2013). Moreover, perceived usefulness directly influences users’ intentions to adopt new technologies, while playfulness enhances user experience, making the interaction more enjoyable. Furthermore, ease of use facilitates adoption by reducing resistance among millennials, who value efficiency and user-friendly interfaces (Arghashi and Yuksel, 2022; Chan et al., 2016; Liu et al., 2021; Paravastu et al., 2014. Ramayah and Ignatius, 2005). As such, the study’s constructs were selected due to their significant impact on user experience and/or satisfaction, particularly in digital environments.
Furthermore, previous research has examined how different media (e.g., telephone, email, online chat) interact to affect customer satisfaction, other studies (Calvo-Porral et al., 2017; Froehle, 2006) have found that user satisfaction positively impacts digital engagement (Masrek et al., 2018). Nevertheless, most research has concentrated on factors influencing the initial acceptance of technology, with less emphasis on post-usage behaviour (Djelassi et al., 2018). Moreover, Bhattacherjee (2001) and Bhattacherjee and Lin (2015) highlighted usage satisfaction as a determinant for continued information technology (IT) use. Nevertheless, the complete role of satisfaction, especially considering experiences and potential spillover effects relating to chatbots, is not fully understood.
To address this research gap, this study examines the SST experience and satisfaction of millennials using chatbots in South African markets, guided by customer experience theory and relationship marketing theory. In addition, the technology acceptance model (TAM) principles of ease of use, usefulness, and enjoyment (Davis, 1989) are crucial in influencing chatbot interactions and directly impact millennials’ satisfaction. Furthermore, the study explores how the strategic deployment of chatbots can meet the specific demands of millennials in these markets, particularly their expectations of trustworthiness and effective information dissemination. These elements are essential for enhancing millennials’ intentions to engage with and purchase through digital platforms (Gefen and Straub, 2004; Tan and Liew, 2022). By examining these interactions, the study offers insights into optimising customer satisfaction through digital innovations. It highlights the critical need to understand and implement effective virtual customer service solutions as the landscape of customer interactions shifts from traditional face-to-face encounters to digital communications (Froehle, 2006; Meuter et al., 2000; Parasuraman et al., 2005).
This study advances existing theory by demonstrating how established constructs like perceived usefulness, playfulness, ease of use, and control interact within the unique context of millennial chatbot users in an emerging market. Unlike prior chatbot research (Mogaji et al., 2021) that often focuses on developed markets or a developer-centric view (Silva and Canedo, 2022), this study provides empirical evidence on how these factors shape user satisfaction in culturally and economically distinct settings. By incorporating user feedback and behavioural patterns unique to millennials, the research reveals nuanced preferences that influence chatbot interactions. Furthermore, by affirming the roles of flexibility and accessibility in enhancing engagement (Haugeland et al., 2022; Lee, 2020) and highlighting the impact of playfulness on user experience (Lubbe and Ngoma, 2021; Silva et al., 2023b), this research adds depth to customer experience theory. Additionally, the study builds on the frameworks of Agariya and Singh (2011) and Berry (1995), who highlighted the importance of trust in relationship marketing. It emphasises that millennials perceive trust as essential for fostering faithfulness and enhancing their overall experiences with digital platforms (Emamdin et al., 2020).
By adapting these principles to digital interactions, the study reveals that millennials’ chatbot experiences are deeply influenced by their sense of control and security, thus enriching relationship marketing theory with new insights into digital interactions. The significant links between control, trustworthiness, and satisfaction, as supported by Benke et al. (2022), Eren (2021), and Kvale et al. (2021), illustrate that millennials value autonomy and reliability in digital interactions. While some research (Bedué, 2020; Tan and Lim, 2023) questions the universal applicability of these constructs, this study suggests that tailoring chatbot features to specific demographic needs can enhance satisfaction. As such, this research not only addresses gaps in literature by adapting established concepts to an emerging market context, but also provides insights into how chatbot design can be tailored to align with millennials’ preferences, potentially guiding future research across diverse market settings. This adaptability may lead to innovative chatbot solutions that cater to evolving user expectations.
2. Theories grounding the study
2.1 Relationship marketing theory
The shift towards technology in marketing has transformed traditional relationship marketing into a landscape dominated by digital interactions (Sleiman et al., 2021). This technological shift has redefined how companies interact with customers, moving from conventional methods to technology-driven relationships to foster long-term customer relationships (Collier and Sherrell, 2010). Relationship marketing not only includes trust and commitment, but also the emotional and perceptual aspects of customer relationships, such as control. Effective technology interaction designs, such as those of chatbots, enhance consumers’ sense of control during the purchasing process and promote their autonomy in decision-making (Shen et al., 2023). This broader perspective is increasingly significant for a more comprehensive understanding of customer interactions, especially in consumer markets (Bagozzi et al., 1999; Berry, 1995; Bügel et al., 2011; Frey and Stutzer, 2002; Sheth and Parvatiyar, 1995; Verhoef and Lemon, 2015; Yim et al., 2008).
As relationship marketing evolves with new digital tools, chatbots are essential for creating and maintaining customer relationships (Cheng and Jiang, 2022). Chatbots help companies connect with customers in a more personalised and engaging way, which supports long-term loyalty and satisfaction (Vijaykumar et al., 2024). Personalised engagement is essential for fostering trust and satisfaction – key constructs in relationship marketing theory. Trust underpins customer commitment and loyalty, while satisfaction drives repeat interactions and long-term relationship quality (Agariya and Singh, 2011; Geyskens et al., 1998; Hollebeek and Macky, 2019).
This study is grounded in relationship marketing theory, which suggests that chatbots can enhance customer satisfaction by delivering trustworthy and personalised digital experiences, thereby emphasising the role of trust and satisfaction in digital customer relationships (Huang et al., 2024). By fostering long-term engagement through value-added experiences (Li et al., 2024), chatbots align with the constructs of perceived usefulness, playfulness and ease of use – key elements that contribute to positive customer experiences by meeting functional and emotional needs (Davis, 1989; Venkatesh and Davis, 2000). In this way, relationship marketing and customer experience theory highlight how chatbots facilitate more profound and meaningful connections between brands and consumers.
2.2 Customer experience theory
Refined over decades, customer experience theory is essential for understanding how millennials engage with SSTs like chatbots. The theory is structured around three main areas:
process-driven approach: this maps the customer journey across various touchpoints, highlighting the challenges of managing interactions (Edelman and Singer, 2015; Rawson et al., 2013; Spence et al., 2014; Verhoef et al., 2009);
outcome focus: customer experience theory also examines outcomes, such as satisfaction and service quality, which are crucial for determining behavioural metrics like loyalty and profitability (Bolton, 1998; Bolton et al., 2004; Verhoef, 2003); and
customer centricity: this involves exploring how organisations manage customer experiences internally and externally (Homburg et al., 2017).
For example, when using a banking chatbot, millennials benefit from a seamless process that guides them through multiple touchpoints, a focus on outcome-driven satisfaction through responsive service, and a customer-centric design that tailors responses to individual needs. This holistic experience builds trust and empowers customers to feel in control, which enhances satisfaction and encourages repeat interactions. This aligns with the theoretical constructs of customer experience theory to explain how factors like control and trust drive chatbot satisfaction.
These elements provide a comprehensive framework for analysing how millennials interact with technology in their service experiences. Within this framework, emotional, cognitive, and sensory factors shape customers’ interactions with a service or technology (Jiang et al., 2022). In particular, perceived usefulness, playfulness, and ease of use are foundational to creating a positive customer experience (Huang et al., 2021; Lubbe and Ngoma, 2021; Sinha and Singh, 2023), addressing both functional and emotional engagement with chatbots. These factors are proposed to enhance the appeal and usability of the experience.
When customers feel in control during a service interaction, they take greater responsibility for the outcome, which enhances their satisfaction and increases the likelihood of repeat purchases (Van Raaij and Pruyn, 1998). Achieving this requires more than just new technology; it starts with understanding customer goals and using insights to create empowering experiences that foster a unique sense of control and confidence (Leachman and Scheibenreif, 2023).
Finally, customer experience theory suggests that trustworthiness, experience, and control significantly impact overall satisfaction (Huang et al., 2021; Kim et al., 2022; Klaus and Maklan, 2012; Meuter et al., 2000). This study posits that these three constructs influence chatbot satisfaction, based on the theory’s assertion that a positive, trustworthy, and controlled experience leads to greater customer satisfaction. By linking these theoretical elements to the study’s constructs, this approach clarifies how customer experience theory informs the hypotheses.
3. Theoretical overview
3.1 Chatbots
SSTs allow customers to perform services independently, without direct employee involvement (Meuter et al., 2000). A form of AI-driven SST, chatbots enable users to access information, complete transactions, and receive support through automated, conversational interactions (Um et al., 2020). Also known as virtual assistants, chatbots engage users through spoken or written language and may incorporate image, audio, and video processing tools (Iancu and Iancu, 2023). Recent advancements in AI, such as ChatGPT and other large language models, have enhanced chatbots’ abilities to deliver more natural, context-aware and adaptive conversations. These developments allow chatbots to understand and generate human-like responses, handle complex queries, and provide personalised, engaging experiences, making them powerful tools for customer service and task automation across various sectors (Tayan et al., 2024; Um et al., 2020).
Since Joseph Weizenbaum introduced the first chatbot in 1966, chatbots have revolutionised communication, particularly in e-commerce, and their influence is reflected in the rapidly growing market, which is projected to reach USD1.25bn by 2025 (Kasilingam, 2020; Statista, 2022). From a business standpoint, chatbots offer exceptional operational efficiency, supporting large-scale customer interactions – from order processing to complex tasks like healthcare and financial advice (Li and Shin, 2023). Research on chatbots has been extensive in sectors, such as banking (Aslam et al., 2023; Eren, 2021; Ugwuanyi et al., 2021), luxury brands (Li and Shin, 2023), and customer service (Benke et al., 2022; Huang et al., 2024; Iancu and Iancu, 2023; Joshi, 2021; Whang et al., 2022), particularly in developed countries like the USA and the UK. However, research is limited in emerging markets like South Africa. Lubbe and Ngoma (2021) explored chatbots’ perceived playfulness, usefulness, and ease of use among South African millennials, but did not fully address the customer experience with chatbots or a comprehensive model, which this study aims to address. This gap, identified by Huang et al. (2024), calls for further exploration in distinct settings, making this study one of the first to investigate SST experiences, specifically chatbots, in an emerging market context.
3.2 Technology acceptance antecedents
Originally introduced by Davis (1989), the TAM is a highly influential framework for understanding IT adoption. It is widely applied across diverse IT-related contexts. At its core, the model suggests that technology users make reasoned decisions about their use of a particular technology (Kasilingam, 2020).
Perceived usefulness, playfulness, and ease of use are key in millennials’ adoption of technologies like chatbots. Believing that technology enhances performance, scholars have highlighted perceived usefulness as being vital for technology uptake (Davis, 1989; Lee, 2006; Lu and Su, 2009; Palos-Sanchez et al., 2021; Phan and Daim, 2011; Venkatesh and Davis, 2000). Perceived playfulness, defined as finding joy in technology use (Hsieh, 2023), and ease of use, the simplicity of engaging with technology (Dhake et al., 2024; Goli et al., 2023; Joshi et al., 2021; Kasilingam, 2020), significantly influence millennials’ satisfaction and continued use. Research further supports that ease of use positively affects technological intentions (Alt and Agárdi, 2023; Sugumar and Chandra, 2021), underlining the importance of user-friendly interfaces.
3.3 Self-service technology (chatbot) experience
According to Meyer and Schwager (2007), customers’ experiences with SSTs stem from interactions, where “experience drivers” shape memorable moments (Åkesson et al., 2014). SSTs offer both utilitarian (efficiency, speed) and non-utilitarian (emotional) value, with experiences ranging from positive (autonomy, enjoyment) to negative (stress, frustration) (Djelassi et al., 2018). Exceptional chatbot experiences – crucial for loyalty among experience-driven customers like millennials – involve active engagement and processing of interactions (Khan et al., 2021; Kwon, 2020).
3.4 Trustworthiness
In initial human-chatbot interactions, millennials lack substantial cues, such as physical touch, to evaluate chatbots’ trustworthiness (De Cicco et al., 2020). Trustworthiness can be described as the overall integrity and believability of a source, and its ability to communicate truthful and valid information (Saldanha et al., 2024).
3.5 Control
A sense of control is key for millennials adopting technologies like chatbots (Iancu and Iancu, 2023). Control refers to users’ perceptions of their ability to use an online tool to achieve a goal (Huang et al., 2021). Early SST research indicates that customers’ control over transactions significantly influences their perceived value of the experience (Lee and Allaway, 2002).
3.6 Self-service technology (chatbot) satisfaction
While experience with SSTs encompasses utilitarian and emotional responses – ranging from positive feelings of autonomy and enjoyment to negative feelings of stress and frustration (Åkesson et al., 2014; Djelassi et al., 2018; Meyer and Schwager, 2007) – satisfaction measures whether products or services meet customers’ needs and provide a pleasurable sense of fulfilment (Oliver, 1997; Xu et al., 2015). Ashfaq et al. (2020), Eren (2021), and Huang et al. (2024) found that satisfaction with chatbots often stems from improved customer experiences, particularly with technologies like chatbots. Nonetheless, there is limited research defining SST satisfaction. This study addresses SST satisfaction as a post-purchase attitude reflecting customers’ fulfilment after interactions with SSTs (Eren, 2021).
3.7 Theoretical model development
For clarity, since this study focused on chatbots as an SST tool, SST experiences and SST satisfaction are referred to as “chatbot” experiences and “chatbot” satisfaction.
3.7.1 The interrelationship between trustworthiness and chatbot satisfaction.
According to Osakwe et al. (2022), trustworthiness focuses on service providers’ character or traits. Conversely, chatbot satisfaction is a result of a better customer experience after using technology, such as chatbots (Huang et al., 2024; Staab et al., 2023). Furthermore, Huang et al. (2024) argued that customer trustworthiness is gained over time and businesses should aim to stimulate trust in chatbot services, which leads to improved satisfaction. That is, if banks provide trust-instilling strategies, such as communicating data privacy measures, customised interactions based on one’s financial needs, and user-friendly chatbots, the higher the probability to increase millennials’ satisfaction with chatbot use (Mntande et al., 2023; Svotwa et al., 2023). Studies by Huang et al. (2021) and Kim et al. (2022) support this notion that trustworthiness plays a significant positive role, especially amongst millennials in driving chatbot satisfaction. As such, it is hypothesised that:
Trustworthiness has a positive and significant influence on the chatbot satisfaction of millennials using chatbots.
3.7.2 The interrelationship between chatbot technology experience and chatbot satisfaction.
Chatbot experience pertains to the interactive result, as customers think, engage, and process information while using chatbots (Kwon, 2020). Consequently, interaction with chatbots delivers a unique customer experience distinct from face-to-face meetings, with customer anxiety and satisfaction hinging on the online service’s flawlessness (Bilgihan et al., 2014; Djelassi et al., 2018). Evaluations of SSTs, such as chatbots, may focus on utilitarian features like speed and efficiency, or emotional impacts, leading to satisfaction when expectations are met (Ruan and Mezei, 2022). Improved chatbot interfaces can further enhance this experience (Shahid Iqbal et al., 2018) and engaging chatbots contribute significantly to customer satisfaction (Diaz, 2019; Jain et al., 2018). However, if customers are unfamiliar with the technology, their experiences might be perceived as difficult, time-consuming, or stressful, resulting in negative evaluations (Djelassi et al., 2018). Consequently, businesses must strive to provide seamless chatbot experiences to surpass customer expectations and secure satisfaction (Lubbe and Ngoma, 2021; Ugwuanyi et al., 2021). Accordingly, it is hypothesised that:
Self-service technology experience has a positive and significant influence on the chatbot satisfaction of millennials using chatbots.
3.7.3 The interrelationship between control and chatbot satisfaction.
Control refers to individuals’ perceptions of their ability to utilise an online tool or carry out an action online to accomplish a specific goal (Huang et al., 2021). As such, individuals’ ability to exert power and command the outcome of a specific situation greatly influences the satisfaction derived from a given experience (Rohden and Espartel, 2024). Benke et al. (2022) added that nothing holds greater importance than individuals’ confidence in their ability to manage and influence functional and environmental circumstances. In interacting with chatbots, Whang et al. (2022) argued that customers’ perceptions of control in using chatbots are imperative in evaluating their satisfaction levels. Prior research on chatbots in the banking sector has validated that control could highly influence satisfaction (Pizzi et al., 2021; Rohden and Espartel, 2024). In other words, when consumers have a greater sense of control over intelligent technology, such as chatbots, it has a larger impact on their overall satisfaction (Yan et al., 2022). Considering the discussion above, it is hypothesised that:
Control has a positive and significant influence on the chatbot satisfaction of millennials using chatbots.
3.7.4 The interrelationship between control and chatbot experience.
In services marketing, control is extensively argued to be a precursor to experience (Huang et al., 2021; Iancu and Iancu, 2023). Research has revealed that control has a significant and positive impact on customers’ experiences when using chatbots (Myin and Watchravesringkan, 2024; Salo-Lahti, 2022; Spais, 2023). Therefore, firms must give more control to existing and potential customers when it comes to SSTs, such as chatbots, to positively transform their experiences (Hoyer et al., 2020). Consequently, it is hypothesised that:
Control has a positive and significant influence on the chatbot experience of millennials using chatbots.
3.7.5 The interrelationship between perceived playfulness and chatbot experience.
Perceived playfulness is one of the key factors that enhances millennials’ chatbot user experiences (Ling et al., 2021). Perceived playfulness refers to the extent to which the utilisation of a specific technology can be regarded as enjoyable (Hsieh, 2023). Therefore, businesses must integrate tools that encourage playfulness and strengthen this generational cohort’s experience when interacting with chatbots (Li and Shin, 2023). Cheung et al. (2021) echoed a similar sentiment, stating that engaged customers are likely to build a sense of playfulness, which is essential in positively influencing their experiences. In the technology space, customers are always seeking unique improvements to their experiences, and playfulness should be at the forefront of innovation (Wirtz et al., 2021). Lubbe and Ngoma (2021) also found that perceived playfulness positively influences millennials using chatbots. Hence, it is hypothesised that:
Perceived playfulness has a positive and significant influence on the chatbot experience of millennials using chatbots.
3.7.6 The interrelationship between perceived usefulness and chatbot experience.
Defined as the belief that technology improves task performance (Lee, 2006), perceived usefulness significantly impacts the adoption of technologies like mobile shopping, enhancing the likelihood of its use (Lu and Su, 2009). Customers are likely to adopt new technology and have a satisfactory experience if it is perceived to improve their work efficiency and complete tasks promptly (Moussawi et al., 2023). Research indicates that a high perception of usefulness in technology tools like virtual reality and mobile payment services positively impacts customers’ experiences with technology (Huang et al., 2021; Sinha and Singh, 2023). According to Baek and Kim (2023), customers are more likely to have memorable experiences if businesses develop chatbots that are task-orientated and prioritise task efficiency. In the same light, Aslam et al. (2023) suggested that if customers’ perceived usefulness of chatbots is positive, they are likely to build favourable perceptions in the future as well. Therefore, it is hypothesised that:
Perceived usefulness has a positive and significant influence on the chatbot experience of millennials using chatbots.
3.7.7 The interrelationship between perceived ease of use and chatbot experience.
Customers’ intention to utilise chatbots is highly reinforced by perceived ease of use (Goli et al., 2023). The simpler and more user-friendly a new or existing technology is, the greater the levels of positive experience (Kasilingam, 2020; Ling et al., 2021; Sinha and Singh, 2023). Favourable interactions with chatbots could lead customers to encourage this service to others, boosting the usage rate and frequency of chatbots (Eren, 2021). Existing literature has further confirmed that perceived ease of use is one of the major driving factors of technology experience (Blut et al., 2016; Joshi, 2021; Lubbe and Ngoma, 2021). Considering the discussion above, it is hypothesised that:
Perceived ease of use has a positive and significant influence on the chatbot experience of millennials using chatbots.
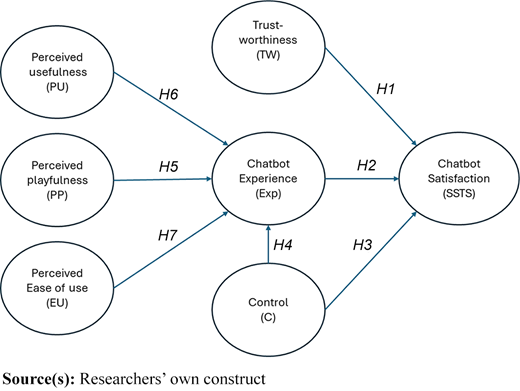
Considering the discussion above, the model in Figure 1 is proposed.
4. Research methodology
The study is explanatory and descriptive (Saunders et al., 2016) and data was collected from respondents who interacted with a chatbot in the six-month period preceding the study and who lived in the Gauteng province of South Africa. These customers signified the sampling units and elements of the study. Furthermore, screening questions and quotas were applied to ensure the sample adhered to the stipulated requirements to participate in the study. Consequently, respondents across Gauteng who had access to a smart device or the internet and directly engaged with a chatbot over six months participated in the study. The screening questions in the questionnaire ensured that only respondents who adhered to the sample frame could partake in the study. As such, respondents who did not adhere to the age or chatbot interaction criteria were not included in the final data analysis.
Before the data collection was secured, the questionnaire was pilot-tested among 30 respondents representing the millennial target audience. In this study, millennials refer to anyone born between 1981 and 1997, and who were aged 28–44 years old at the time of the study (Hecht, 2024). The pilot study revealed clarity of understanding among respondents, with no changes required to the questionnaire. Subsequently, the data collection was secured through a two-phase process. Phase one encompassed data collection by distributing the questionnaire via social media platforms, such as Instagram and Facebook. Phase two encompassed the use of a data collection company to ensure the collection of a large number of responses for data analysis. Thirty-five fieldworkers based in Gauteng secured the data collection from respondents. Fieldworkers had to fill age and gender quotas purposefully to ensure the target population was adequately presented. Therefore, the selection of the sample was secured utilising non-probability sampling, where predetermined quotas were purposefully filled. Moreover, respondents had to secure the completion of online questionnaires (phase one of data collection) and self-administered paper-based questionnaires (phase two of data collection), and then provide the fieldworkers with the completed questionnaires. Over 90 days, 390 questionnaires were collected. However, after cleaning the data by removing half-completed questionnaires, the final sample size was 359.
The questionnaire embodied sections probing respondents’ demographic profile and technology background. The measurement of the study’s constructs encompassed the application of five-point and seven-point unlabelled Likert-type scales. These scales were applied to assess the level of agreement in terms of the perceived ease of use, perceived playfulness, perceived usefulness, trustworthiness skill, control, chatbot experience, and satisfaction. The scales measuring perceived ease of use and perceived usefulness were adapted from Davis (1989), perceived playfulness’s scale was adapted from Moon and Kim (2001), and the scale measuring trustworthiness was adapted from Fogel and Nehmad (2009) and Teltzrow et al. (2007). Additionally, the scale measuring control was adapted from Collier and Barnes (2015), while the scale measuring chatbot experience was adapted from Djelassi et al. (2018). Finally, the scale items for the satisfaction construct were adapted from Hsieh and Essex (2006).
After the data was edited and cleaned, it was entered into Statistical Package for the Social Sciences (SPSS) 29.0. Using SPSS 29.0, descriptive statistics were calculated to obtain knowledge on the demographic profile of respondents, their chatbot engagement perceptions, and the 47 items measuring the study’s seven constructs. A confirmatory factor analysis (CFA) was done to determine the causal relations between the proposed variables in the study, as reflected in Figure 1. The assessment of the measurement and structural models was secured via AMOS 29.0. Before measuring the structural model, assumptions (underlying covariance-based structural equation modelling applying AMOS 29) related to normality, reliability (composite), and validity (convergent and discriminant) were addressed (Ogbeibu et al., 2018).
5. Results
5.1 Profile of respondents
Majority of the study’s respondents were black (80.2%) and had a university degree (42.6%). In total, 75.5% of respondents were under the age of 30. The sample was almost equally split between men (47.1%) and women, with a slight bias towards women (52.9%). The most prevalent home languages were very evenly split between English (14.8%), Tswana (15%), and Zulu (15.3%). Moreover, 93% of respondents had access to Wi-Fi, while 7% did not. Cell phones were indicated as the most used device (87.2%), followed by tablets (7.5%) and laptops (5.3%). Most respondents paid for their cell phone through a contract (58.25), while others used pay as you go (41.8%).
5.2 Data normalisation
Data normalisation was tested via the kurtosis and skewness indexes. Skewness is the degree of symmetry; if the data seems identical from both the left and the right of the middle point, the data is seen as symmetrical. Kurtosis can be described as the measurement in which data might be heavy-tailed or light-tailed with respect to the normal distribution. Higher kurtosis values imply heavy tails or the presence of outliers. Similarly, lower kurtosis values imply light tails or no outliers. If the skewness value is equal to zero and kurtosis is 3, then the data dispersion is normal. Skewness values are acceptable if they range between −1.96 and +1.96, while kurtosis values are acceptable if they range from −3 to +3 (George and Mallery, 2019). The skewness and kurtosis values for all the items were in an acceptable range. Skewness values varied from −1.159 to −0.679, and kurtosis values were −0.499–0.993. Literature supports this finding by stating that if the number of samples exceeds 200 (Westland, 2010), the data has a normal distribution due to the central limit theorem.
5.3 Exploratory factor analysis
The Kaiser-Meyer-Olkin measure of sampling adequacy of 0.96 exceeded the cut-off point of 0.7, with a significance level of p < 0.001 for the Bartlett’s test of sphericity signifying the factorability of the correlation matrix (Pallant, 2020). The communalities for all items, ranging between 0.569 and 0.899, were above the 0.3 cut-off. Six factors with an eigenvalue greater than or equal to 1 were extracted, explaining 78.272% of the variance. This was above the recommended minimum of 60%. The reproduced correlation matrix indicated only 16% of non-redundant residuals, which was below the rule of thumb maximum of 50% non-redundant residuals. The pattern matrix indicated that all items loaded above 0.5 on a single factor, with loadings of 0.5–0.9. Therefore, the convergent validity of the scale measuring the study’s constructs was confirmed. The discriminant validity of these scales could also be confirmed, since none of the items cross-loaded at the 0.6 threshold.
5.4 Measurement model assessment
Table 1 provides an overview of the factor loadings, variance explained, and the means and standard deviations of the items used to measure the study’s constructs. The factor loading for each item was above 0.5, varying from 0.758 to 0.925. Considering the descriptive statistics for the items, the means varied between 3.33 and 5.80, with standard deviations of 0.904–1.420. This was indicative of regularity between the items measuring the study’s constructs.
Factor loadings
| Construct | Item | Factor loading | M | SD |
|---|---|---|---|---|
| Perceived ease of use | C1.1 | 0.777 | 4.21 | 0.904 |
| C1.2 | 0.758 | 4.06 | 1.037 | |
| C1.3 | 0.782 | 4.14 | 1.001 | |
| C1.4 | 0.831 | 4.26 | 0.948 | |
| C1.5 | 0.82 | 4.18 | 0.974 | |
| Perceived playfulness | C2.1 | 0.824 | 3.87 | 1.072 |
| C2.2 | 0.884 | 3.86 | 1.151 | |
| C2.3 | 0.859 | 3.66 | 1.205 | |
| C2.4 | 0.897 | 3.73 | 1.201 | |
| Perceived usefulness | C3.1 | 0.826 | 4.07 | 1.119 |
| C3.2 | 0.859 | 4.10 | 1.044 | |
| C3.3 | 0.868 | 4.06 | 1.076 | |
| C3.4 | 0.862 | 4.09 | 1.060 | |
| C3.5 | 0.849 | 4.16 | 1.001 | |
| C3.6 | 0.817 | 4.21 | 0.949 | |
| Trustworthiness | C4.1 | 0.818 | 4.10 | 1.016 |
| C4.2 | 0.881 | 4.10 | 1.023 | |
| C4.3 | 0.768 | 4.00 | 1.104 | |
| C4.4 | 0.820 | 4.10 | 1.008 | |
| Control | C6.1 | 0.852 | 4.12 | 0.956 |
| C6.2 | 0.831 | 3.99 | 1.003 | |
| C6.3 | 0.846 | 4.10 | 0.985 | |
| C6.4 | 0.842 | 4.12 | 0.916 | |
| Experience | D1.1 | 0.878 | 5.62 | 1.336 |
| D1.2 | 0.916 | 5.67 | 1.420 | |
| D1.4 | 0.831 | 3.33 | 1.391 | |
| SST (chatbot) satisfaction | F2.1 | 0.925 | 5.80 | 1.313 |
| F2.2 | 0.845 | 5.67 | 1.378 | |
| F2.3 | 0.918 | 5.75 | 1.391 |
M = mean; SD = standard deviation
5.5 Convergent validity, discriminant validity and composite trait reliability
After item reduction and determining the number of factors needed for a parsimonious conceptual understanding of the indicators, we computed Cronbach’s alpha (α test) to estimate the internal consistency reliability of each sub-scale. The α test was applied to check the internal reliability and stability of the questionnaire. The α test assesses the reliability of a construct by comparing the amount of shared variance, or covariance, among the items making up an instrument to the amount of overall variance. The idea is that if the instrument is reliable, there should be a great deal of covariance among the items relative to the variance (Collins, 2007).
The α value of each construct was tested separately to check for reliability. A construct is reliable if the α value is greater than 0.70 (Hair et al., 2009). Table 2 shows the results of the α test for each construct. All α values in this study were above this threshold. Moreover, all constructs were above 0.8, which shows a high reliability of the construct (Kock and Lynn, 2012). A value greater than 0.90 is not considered outstanding, as there is a possibility of duplication (Kock and Lynn, 2012).
Alpha, composite reliability and average variance extracted
| Construct | No. of items | Α | Composite reliability | AVE |
|---|---|---|---|---|
| Perceived ease of use | 5 | 0.899 | 0.895 | 0.630 |
| Perceived playfulness | 4 | 0.922 | 0.923 | 0.751 |
| Perceived usefulness | 6 | 0.930 | 0.937 | 0.714 |
| Trustworthiness | 4 | 0.902 | 0.893 | 0.676 |
| Control | 4 | 0.907 | 0.907 | 0.705 |
| Experience | 3 | 0.906 | 0.777 | 0.587 |
| STT (chatbot) satisfaction | 3 | 0.923 | 0.925 | 0.805 |
Reliability is the measure of the internal consistency of the study’s constructs. Construct reliability was assessed using the composite reliability test. Composite reliabilities ranged from 0.777–0.937, all above the 0.7 benchmark (Hair et al., 2009). See Table 2 for the composite reliability for each construct in the model. The convergent validity of the model items was estimated using average variance extracted (AVE) (Fornell and Larcker, 1981). All values were above the 0.5 threshold, and had the required convergent validity.
Discriminant validity in the study was assessed using the heterotrait-monotrait (HTMT) ratio (Henseler et al., 2015). According to this criterion, discriminant validity is established when the square root of AVE for a construct is greater than its correlation with the other constructs in the study. All HTMT ratios were less than the required limit of 0.85. Hence, discriminant validity was established (Table 3).
Discriminant validity
| Constructs | Trust | Control | Experience | Playfulness | Usefulness | Ease of use |
|---|---|---|---|---|---|---|
| Trust | ||||||
| Control | 0.772 | |||||
| Experience | 0.673 | 0.662 | ||||
| Playfulness | 0.690 | 0.592 | 0.699 | |||
| Usefulness | 0.795 | 0.626 | 0.694 | 0.766 | ||
| Ease of use | 0.73 | 0.687 | 0.704 | 0.765 | 0.723 | |
| STT (chatbot) satisfaction | 0.629 | 0.633 | 0.690 | 0.550 | 0.573 | 0.661 |
5.6 Structural model assessment
Similar to the measurement model, the structural model parameters as provided by the goodness-of-fit measure, proved adequate and fitted the data sufficiently. CFA was computed using AMOS 29.0 to test the fitness of the model. The values of the model-fit measures (CMIN/df, goodness-of-fit index [GFI], comparative fix index [CFI], Tucker-Lewis index [TLI], standardised root mean square residual [SRMR], and root mean square error of approximation [RMSEA]), except GFI, were all in their common acceptance levels. Table 4 shows the measurement model fit.
Model fit
| Fit index | Recommended value | Source | Obtained value |
|---|---|---|---|
| P (chi-square test) | Insignificant | Bagozzi and Yi (1988) | < 0.01(insignificant) |
| CMIN (chi-square/df) | 3–5 | Less than 2 (Ullman and Peter‐Hagene, 2014), to 5 (Schumacker and Lomax, 2016) | 1.761 |
| GFI | > 0.9 | Hair et al. (2009) | 0.898 |
| CFI | > 0.95 | Bentler (1990) | 0.970 |
| TLI | > 0.95 | Bentler (1990) | 0.966 |
| SRMR | < 0.08 (good fit) | Bentler (1990) | 0.036 |
| RMSEA | < 0.08 (reasonable) | Bentler (1990) | 0.046 |
| < 0.05 (good fit) |
Only one of the indicators, GFI, was less than the recommended value. Following the Hu and Bentler (1999) indicator cut-off strategy – that is, a TLI of 0.96 or higher and a SRMR of 0.9 or lower; or an RMSEA of 0.06 or lower and a SRMR of 0.09 or lower; or a CFI of 0.96 of higher and an SRMR of 0.09 or lower – we concluded that the model was a good fit. Table 5 reflects the outcomes of the different hypotheses formulated for the study. Trust, experience, control, perceived playfulness, perceived usefulness, and perceived ease of use significantly and positively influenced customer satisfaction.
As shown in Table 5, all the hypotheses are supported, and based on these findings, nomological validity is evident.
Structural model estimates
| Hypothesis | Hypothesised relationship | Standardised estimates (β) | t-value | p-value | Decision |
|---|---|---|---|---|---|
| H1 | Trustworthiness → SST (chatbot) satisfaction | 0.182 | 2.381 | 0.017 | Yes |
| H2 | Experience → SST (chatbot) satisfaction | 0.425 | 6.526 | 0.000 | Yes |
| H3 | Control → STT (chatbot) satisfaction | 0.210 | 2.627 | 0.009 | Yes |
| H4 | Control → chatbot experience | 0.256 | 4.144 | 0.000 | Yes |
| H5 | Perceived playfulness → chatbot experience | 0.230 | 2.972 | 0.003 | Yes |
| H6 | Perceived usefulness → chatbot experience | 0.211 | 2.913 | 0.003 | Yes |
| H7 | Perceived ease of use → chatbot experience | 0.199 | 2.062 | 0.017 | Yes |
| R square | |||||
| Experience: 61.9% | |||||
| SST (chatbot) satisfaction: 54.3% | |||||
6. Discussion of results
The study’s results illuminate the significant influence of three key constructs – perceived usefulness, perceived playfulness, and perceived ease of use – on the chatbot (SST) experiences of millennial chatbot users in South Africa. The findings indicate that perceived usefulness (β = 0.211, p = 0.003), perceived playfulness (β = 0.230, p = 0.003), and perceived ease of use (β = 0.199, p = 0.017) have a positive and statistically significant relationship with chatbot experience. These outcomes align with research by Haugeland et al. (2022) and Lee (2020), who asserted that effective engagement with STT tools like chatbots hinges on their flexibility and accessibility. This study builds on these authors’ work by providing empirical evidence that these constructs impact the experiences of millennials in an emerging market, thereby expanding the applicability of their findings.
The importance of playfulness, as evidenced by a strong correlation with chatbot experience, is reinforced by Lubbe and Ngoma (2021) and Silva et al. (2023a), who highlighted how playfulness can shape user engagement and future behaviour. While prior studies have often overlooked playfulness, our findings underline its critical role in enhancing user experience, suggesting that chatbot designs should incorporate playful elements to attract millennial users. Additionally, technology service tools’ ability to help users accomplish tasks efficiently aligns with Mishra et al. (2020), who posited that productivity enhancements are pivotal for positive user experiences. This study further validates that enhancing perceived ease of use can significantly improve user engagement with chatbots. In exploring the construct of control, the results demonstrate a strong positive relationship with self-service experience (β = 0.256, p = 0.000), confirming the findings of Benke et al. (2022), which emphasise the need for users to feel in control of their interactions with chatbots. This study elaborates on the notion that for millennial consumers, the ability to dictate their engagement with chatbots is paramount. Control over information shared and the flow of interaction is crucial for fostering trust and satisfaction, further aligning with insights from previous studies that stress the importance of user agency in technology interactions (Al-Shafei, 2024; Iancu and Iancu, 2023).
However, not all studies agree with these findings. For instance, Tan and Lim (2023) suggested that perceived ease of use may not significantly impact user satisfaction when the technology is perceived as inherently complex. Additionally, Bedué (2020) argued that excessive focus on playfulness could detract from the perceived seriousness and reliability of chatbot interactions, which could hinder satisfaction among more conservative user demographics. These differing viewpoints highlight the need for a balanced approach to chatbot design, where both playfulness and seriousness are considered based on the target audience.
Finally, the research confirms that trustworthiness (β = 0.182, p = 0.017) significantly influences overall chatbot satisfaction (β = 0.425, p < 0.000). This outcome is consistent with the findings of Eren (2021) and Kvale et al. (2021), who argued that the perceived reliability and security of chatbots enhance user satisfaction. By establishing trust, businesses can significantly increase user engagement, as underscored by the results. Furthermore, as per Lee and Chan (2024), the study indicates that when consumers feel in control and perceive the chatbot as reliable, their overall satisfaction markedly improves.
Given these findings, it is imperative for businesses, particularly in sectors like banking, to develop chatbots that are interactive and friendly, and also facilitate user control and build trust. Designing chatbots that guide users through personalised and engaging communication can create more satisfying user experiences. This approach not only meets service engagement expectations, but also cultivates long-term relationships with users, driving customer loyalty and satisfaction in the competitive landscape of SSTs.
7. Theoretical and managerial implications
The study’s findings illustrate that the STT experience of chatbot users is directly impacted by customers’ perceptions of usefulness, playfulness, ease of use, and individual control when using a chatbot. Furthermore, the individual control that customers have when engaging with a chatbot, the overall level of experience when using a chatbot as part of the service delivery process, and the extent to which the chatbot can be trusted significantly impact the overall level of satisfaction when engaging with a chatbot. As such, customers’ overall level of satisfaction experience when engaging with a chatbot is guided by multiple factors, whose impact can be both direct and indirect. Although extant research on chatbots has been conducted in developed and emerging markets (Ashfaq et al., 2020; Gümüş and Çark, 2021), to the understanding of the authors, no previous study has explored the proposed relationships in this study (refer to Figure 1) from an emerging market perspective. Considering that scholars (Følstad and Brandtzaeg, 2020; Kvale et al., 2021) have explored how to enhance user service experiences through chatbots, these studies were not conducted within the context of chatbot satisfaction. Conclusively, to the authors’ knowledge, little research has been conducted on the customer experience and overall satisfaction perception of chatbot users in emerging markets in Africa, such as South Africa. Moreover, most of these studies have emphasised strategies that could benefit developers, not necessarily consumers as interactive users of chatbot services (Polzehl et al., 2022; Siqueira et al., 2024). Against this background, the following theoretical and practical contributions are provided.
7.1 Theoretical implications
7.1.1 Greater understanding of the antecedents of chatbot experience when engaging through chatbots.
The study’s results confirm the interrelationships between perceived usefulness, perceived playfulness, and the chatbot experience of millennial consumers using chatbots. Understanding these direct relationships is imperative to the marketing discipline. It is evident that the overall experience when using a chatbot is guided by multiple factors that directly impact customers’ service experience perceptions. If customers find chatbots to be uncomplicated to engage with, flexible in their accessibility, and easy to use, their overall experiences engaging with the chatbots are also positively stimulated (Silva et al., 2023a). Furthermore, customers want to interact with chatbots in a professional and delightful manner that secures clarity of responses and prevents the provision of any irrelevant information (Zhang et al., 2022). Additionally, when chatbots are perceived as useful, enable customers to accomplish tasks more quickly, and ensure that customers can enhance the effectiveness to complete tasks, then customers’ overall self-service experiences are positively impacted (Silva et al., 2023a). Multiple studies have explored and validated the importance of securing a positive chatbot service experience in a business-to-consumer (B2C) setting (Følstad and Brandtzaeg, 2020; Haugeland et al., 2022; Sidaoui et al., 2020). Nevertheless, the current results expand on customer chatbot usage experience by emphasising the role of perceived ease of use, perceived playfulness, and perceived usefulness as critical drivers of customers’ chatbot experiences (e.g., chatbots).
7.1.2 Improved understanding of the role of chatbot experience as a stimulant to chatbot usage satisfaction.
The research results endorse chatbot experience as a critical driver of chatbot satisfaction. In alignment with research by Al-Shafei (2024), Chen et al. (2021), and Djelassi et al. (2018), experience in the use of chatbots is perceived as essential to customers’ chatbot satisfaction (e.g., when using chatbots). As such, the overall outcome of customers’ engagement with a chatbot as a service delivery tool directly impacts their feelings of satisfaction with the engagement. Therefore, the more accessible, engaging and pleasant the interaction with a chatbot is, the greater the possibility that such an experience will stimulate a user’s overall satisfaction in a positive manner. Accordingly, user experiences need to be characterised by feelings of personalisation when interacting with chatbots, securing private and personal interactions when using chatbots, and ensuring customers are individually recognised when chatbots are used. Through such an approach, user experience of a chatbot will be a positive driver of the future satisfaction of a customer when engaging with a chatbot. Future studies could expand on the results of this study by exploring how user experience functions as a stimulant of satisfaction in a B2C context.
7.1.3. A perspective on perceived trustworthiness and control as key drivers of chatbot satisfaction.
The study’s findings validate the importance of trustworthiness and control as key drivers of chatbot satisfaction (refer to Table 5). As such, millennial consumers’ satisfaction with the use of technology interfaces, such as chatbots, is guided by the reliability, dependability, and interactive nature of the chatbots (Berge, 2018; Kraus et al., 2021; Meyer-Waarden et al., 2020). Both trustworthiness and control have been validated in this study as key factors in securing the future satisfaction of millennial consumers when using chatbots. Scholars like Hsiao and Chen (2022) and Whang et al. (2022) have confirmed, through studies conducted in Taiwan and South Korea respectively, the critical importance of trustworthiness and control as drivers of consumers’ satisfaction when using chatbots in different settings. These studies have validated that the satisfaction experiences of consumers when engaging with chatbots are strengthened twofold. First, when individual consumers perceive chatbots to be reliable, trusting, and interactive during the service engagement process. Second, when the interactive nature with chatbots is characterised by consumers’ ability to be in control of information usage when engaging with the chatbot, and when the level of information provided by the chatbots assists consumers to feel in control of a purchase made or use of the chatbot service. As such, the fundamental criteria for millennial customers to become more satisfied may be different from what is promulgated by marketing literature, as it may be setting-specific and requires more investigation.
7.2 Managerial implications
In terms of the recommendations proposed, it is clear that businesses in emerging markets should have an in-depth understanding of customers’ usage and engagement needs when using an interactive chatbot in the service delivery process. For example, to enhance the effectiveness of interactive chatbots in emerging markets, businesses must first prioritise a comprehensive understanding of their customers’ usage and engagement needs. This understanding can be achieved by implementing a multifaceted research approach, including customer surveys, focus groups and data analytics to capture insights into users’ behaviour and preferences. Companies can utilise tools like customer journey mapping to visualise how different segments interact with chatbots. For instance, they can analyse which features are most frequently used, identify pain points, and gauge customer sentiment towards chatbot interactions. In addition, A/B testing various conversational styles and multimedia elements, such as emojis, GIFs, and images, can help businesses determine what formats yield higher engagement rates. By systematically experimenting with these elements, companies can refine their chatbots to foster more enjoyable and interactive conversations that resonate with users.
Once businesses in emerging markets understand their customers’ needs, the next step is to develop chatbots that facilitate personalised and contextually aware interactions. To achieve this, companies should invest in sophisticated machine learning algorithms that analyse historical customer data, allowing chatbots to tailor responses based on individual preferences and past interactions. For instance, if users frequently enquire about particular products, chatbots can prioritise related information in future interactions, making the conversation feel more customised. Moreover, incorporating emotional intelligence into chatbot design is essential. Businesses can train their chatbots to recognise specific phrases or sentiment indicators, adjusting their tone and language accordingly. This could involve using sentiment analysis tools that categorise customer emotions (e.g., happy, frustrated, confused) and modifying responses to suit the detected emotional state. For example, if a customer expresses frustration, the chatbot could respond with a more empathetic tone, acknowledging the issue and offering immediate assistance. By focusing on these personalised strategies, businesses can significantly enhance customer experience and satisfaction with their chatbot services.
Finally, to ensure that chatbots deliver a seamless customer journey, businesses in emerging markets must integrate these tools across all relevant touchpoints and channels. This requires a strategic plan for deploying chatbots on websites, social media platforms, and mobile applications, ensuring that users can engage with the chatbots, regardless of where they are. A unified customer experience is crucial. Thus, companies should prioritise a single sign-on feature that allows users to transition between platforms without losing context in their interactions. Furthermore, businesses should implement a system where chatbots can function as metabots, seamlessly linking users to specialised transactional bots or human representatives when needed. This capability not only ensures that customer enquiries are handled efficiently, but also enriches the user experience by providing multiple avenues for support. Additionally, leveraging advanced NLP technology will enable chatbots to engage in more natural, human-like dialogues, thereby making interactions feel more personal.
This is relevant, considering that consumers prefer to engage with support services that reflect a human touch and understanding. As such, regularly updating the NLP algorithms based on emerging language trends and customer feedback will help keep the chatbot relevant and effective. By employing these in-depth actionable strategies, businesses can provide a robust 24/7 service experience that is practical, accessible, and tailored, ultimately driving user satisfaction and encouraging long-term customer loyalty.
8. Conclusion, limitations, and areas of future research
The research established that in emerging markets, chatbot users’ experiences are significantly influenced by their perceptions of the chatbots’ usefulness, playfulness, ease of use, and the degree of individual control they have during interactions. Additionally, the level of control customers experience while engaging with chatbots as well as their experiences in the service delivery process and the trustworthiness of the chatbots play a crucial role in determining their satisfaction. Users in these markets expect chatbots to be reliable and trustworthy, while also wanting to maintain control over the information they receive when utilising services or making online purchases. Therefore, businesses in emerging markets must focus on innovating their chatbot development to enhance service delivery and improve users’ overall self-service experiences.
In terms of the study’s limitations, the investigation into chatbot satisfaction was approached through three main paths: trustworthiness, user experience, and control. This analysis was conducted within a single-country framework using cross-sectional research in an emerging African market. However, the findings confirmed that chatbot satisfaction can be enhanced through multiple paths in the South African context. This insight should inform businesses in South Africa, an emerging market, on strategies to improve future satisfaction for chatbot users. Moreover, the study concentrated on just one emerging market, capturing the perspectives of respondents from a single province. It also utilised a cross-sectional methodology, which limits the ability to observe changes in participants’ opinions over time. A more demographically diverse representation of the study population could have been achieved.
Finally, future research could focus on a comparative study of the proposed model across developed and emerging markets worldwide, or specifically among emerging markets within Africa. Moreover, applying the model in specific service sectors, such as banking, telecommunications or insurance, could yield valuable insights. The model might also be examined in a business-to-business context, which differs from traditional B2C research, where the end user is an individual, rather than a company. Furthermore, new variables (e.g., user engagement, personalisation, emotional connection, accessibility, perceived security, adaptability, social influence, and cognitive load) could be integrated as independent variables, moderators, or mediators to investigate chatbot user satisfaction. In addition, the study could capture varying perspectives of respondents from different regions within an emerging market to identify distinctions and commonalities. Finally, employing a qualitative research approach in the future could provide deeper understanding of how respondents perceive their technology satisfaction.
Funding: The Department of Marketing Management at the University of Johannesburg funded all cost associated with data collection, but no additional funding was required or obtained. No other acknowledgements are further required.
Ethical considerations: The Institutional Review Board at a large public university approved the research. The Ethical clearance code obtained: 2019SCiiS32.

