


Global competition is putting a lot of pressure on small and medium enterprises (SMEs) to adopt Lean 4.0 (L4.0) into their manufacturing supply chain (SC) to reduce waste, improve production efficiency and enhance product quality to achieve reduced product costs. Because I4.0 technologies are Wi-Fi enabled, they require L4.0 tools and procedures to be digitalized for better integration, such as data from the Industrial Internet of Things (IIoT) to Jidoka, which presents several difficulties for SMEs. The L4.0 barriers make it difficult for SMEs to easily adopt L4.0 into their production systems. The current study identifies and ranks the L4.0 barriers that SMEs face when implementing L4.0.
This research adopts the “Combined Compromise Solution (CoCoSo)” and “Fuzzy Decision-Making Trial and Evaluation Laboratory (FDEMATEL)” methodologies to identify the potential barriers to L4.0 implementation. Data were gathered from practicing managers, supervisors, section engineers, group leaders and stakeholders from manufacturing SMEs using qualitative and quantitative approaches to ensure comprehensive insights into the L4.0 barriers to its implementation in SMEs.
The present research uses CoCoSo for evaluating and prioritizing the L4.0 barriers. The analysis reveals three potential barriers: “High Costs of Implementation, Integration with Existing Systems, and Lack of a Skilled Workforce in I4.0 Technology”, as the most significant barriers to L4.0 implementations in SMEs. The FDEMATEL analysis classifies the L4.0 barriers into “cause” and “effect” groups to understand their causal influence. The cause group of L4.0 barriers consists of High Costs of Implementation, Integration with Existing Systems and Regulatory and Compliance Challenges. The effect group includes Lack of Skilled Workforce in I4.0 Technology, Resistance to Change and Limited Knowledge of I4.0 Technology. Controlling these L4.0 barriers will help SMEs optimize L4.0 implementation strategies.
The present research contributes to the growing knowledge of L4.0 by highlighting potential L4.0 barriers to accomplishing the manufacturing supply chain (SC) of SMEs. The manufacturing sector is most prominent in boosting economic development. The results provide SMEs with a realistic roadmap for successfully implementing L4.0 to attain operational excellence and competitiveness.
1. Introduction
Generally, organizations may be grouped under the broad class of micro, small and medium enterprises (MSMEs), small and medium-sized enterprises (SMEs) and large enterprises (LEs). They basically differ in their size, with micro-enterprises being the smallest, followed by SMEs and LEs. Organizations may also differ when they are compared under the criteria of organizational structure, organizational culture, human resources and their skills, resources, assets, age, etc. SMEs are classified differently in different territories based on several factors: for instance, the scale of the industry, number of employees, industry turnover, assets available, resource availability and so on. SMEs are considered the most important economic units, helping in economic growth, industrial output and job generation. Their manufacturing supply chain (MSC) must be robust and sustainable to compete in the global market (Qureshi, 2022). The MSC is under tremendous pressure from global competition, aiming to reduce waste, enhance production efficiency and improve product quality to achieve lower product costs.
Entrepreneurs adopt several manufacturing strategies, including Lean manufacturing (LM), to provide a cutting edge to stay competitive and sustainable in their manufacturing supply chain. Lean or lean management (LM) is a well-known management philosophy in manufacturing and service supply chain management (SCM) (Ferreira et al., 2024). It aims to eliminate costs and increase production and service efficiency. It also enhances industry performance by concentrating on value-added activities and eliminating waste. Apart from the number of approaches that have been embraced by SMEs, lean with I4.0 integration is more promising and is capable of responding to changing customer requirements, enhancing quality and productivity with lower costs (Pagliosa et al., 2021).
The integration of Lean along with Industry 4.0 (I4.0) technologies provides a paradigm shift towards a real-time manufacturing system coining a term known as Lean 4.0 (L4.0) (Mayr et al., 2018). To accomplish manufacturing sustainability, SMEs must adopt L4.0 into their production activities along with cyber-physical systems (CPS). The lean techniques and tools have the highest synergistic connection with I4.0 technologies (Macias-Aguayo et al., 2022). Since the I4.0 technologies are Wi-Fi enabled, L4.0 tools and practices undergo digitalization, posing many challenges for SME entrepreneurs. Digitalization plays a crucial role in the success of L4.0 implementation (Chavez et al., 2024). Hence, the roadmap to L4.0 implementation needs lean-based digitalization (Frecassetti et al., 2024). Thus, lean manufacturing can be successfully implemented with the use of digitalization as a tool for real-time data collection and processing (Iyer et al., 2023). Techniques like value stream mapping, visual management, Heijunka, single-minute exchange of die, total productive maintenance, poka-yoke, Jidoka, kanban and cellular manufacturing, as well as just-in-time, may be digitalized to take full advantage of I4.0 technologies. Lean 4.0 tools must be able to acquire digitized data, for example, from the Industrial Internet of Things (IIoT), as soon as the machine operation ceases, to take corrective action and reduce long hold-ups.
Manufacturing companies have started implementing I4.0 and lean concepts to stay competitive, but the actual implementation appears difficult and has a high failure rate (Yilmaz et al., 2022). L4.0 implementation depends on the combined availability of physical resources backed by the digital resources of I4.0; these could be actively connected to the production activities or indirectly connected to their passive support (Ionel and Opran, 2021). The critical success factors (CSFs) and barriers play a significant role in organizations implementing new strategies or philosophies in the existing setup. Hence, it is important to understand the CSFs and barriers. The CSFs have been defined by John Rockart, an MIT professor, as “Those things that must be done if a company is to be successful.” The CSFs must be important in achieving the overall goals and objectives of the industry. Further, they must be measurable and controllable by the organization. Similarly, barriers may be referred to as those that hinder implementation and the capacity to expand, develop and manufacture processes. The L4.0 barriers put hurdles in the easy L4.0 implementation in SMEs (Omowole et al., 2024). They hinder organizational goals and objectives; hence, they must be overcome to achieve successful L4.0 implementations. The barriers should also be measurable and controllable to overcome their effects on goals and objectives.
A readiness analysis that identifies potential barriers to L4.0 implementation may be carried out before L4.0 deployment in SMEs (Qureshi et al., 2023a). For successful implementation, SMEs must identify and analyse L4.0 barriers. L4.0 barriers are crucial to consider during implementation in SMEs for the manufacturing supply chain, as they directly impact the success of digital lean transformation (Maware and Parsley, 2022). SMEs often struggle with the high costs of integrating advanced technologies like IoT, AI and digital twins into lean processes. Limited technical expertise and resistance to change among employees create further challenges in adopting L4.0 principles. Organizational inertia, lack of leadership commitment and unclear digital strategies hinder effective implementation. Interoperability issues between traditional lean methods and I4.0 technologies slow down process optimization.
Data security concerns and compliance with evolving regulations add complexity, making SMEs hesitant to embrace full digitalization (Maware and Parsley, 2022). Financial constraints prevent SMEs from investing in scalable, smart lean solutions, limiting their competitiveness. Poor collaboration with supply chain partners due to varying digital maturity levels reduces the benefits of L4.0. Without addressing these barriers, SMEs risk inefficiencies, increased waste and reduced agility in their supply chains (Qureshi et al., 2022). Tackling these challenges strategically can unlock L4.0’s full potential. Enhancing productivity and competitiveness must therefore involve identifying and analyzing the L4.0 barriers before L4.0 implementations within the I4.0 domain.
The present study provides the roadmap that helps SME stakeholders identify the L4.0 barriers while implementing L4.0. The following are the present study’s research questions (RQs):
How to identify and prioritise the L4.0 barriers that challenge the L4.0 implementation in manufacturing SMEs?
How do the identified L4.0 barriers influence each other to challenge the L4.0 adoption process that helps attain manufacturing sustainability in SMEs?
The paper has been structured as follows: The next section provides the literature review. The research methodologies employed are detailed in Section 3. Section 4 provides details on the data analysis and results. Section 5 provides a detailed discussion. Section 6 provides the managerial applications, whereas Section 7 provides the conclusion. The limitations and future scope are documented in Section 8.
2. Literature review
CSFs and Barriers of L4.0 are the key focus areas for management, researchers and academicians as they influence the L4.0 implementations to SMEs and LEs significantly. Several studies (Pereira and Tortorella, 2018; Barclay et al., 2022; Qureshi et al., 2023a, b) have been undertaken using different research methodologies to identify the CSFs and Barriers for a variety of industries belonging to SMEs and LEs.
The previous study attempted to find the potential barriers using qualitative and quantitative approaches involving experts. The study used “Interpretive Structure Modelling (ISM)” to find contextual relationships among barriers, while the “Analytic Network Process (ANP)” was used in the ranking of the potential barriers considering their significance (Sharma et al., 2024). A study based on lean six sigma and I4.0 identified 18 barriers that are hindering their implementation (Vinodh and Shimray, 2023).
The lean approach is based on reducing wastage while utilizing minimum input without compromising the quality of the product and productivity, thus making SMEs sustainable in their manufacturing SC. One of the studies leading to the analysis of barriers to Lean–green manufacturing system (LGMS) revealed “Lack of initial investment” and “lack of resource availability” as the significant barriers (Sindhwani et al., 2020a, b). Lean and Six Sigma are the two common paradigms to concentrate on different facets of production to achieve the objectives of minimizing defects and streamlining the process. The critical failure factors play a significant role in manufacturing sustainability. Hence, the critical failure factors have been modelled using the Best Worst method (BWM) of sustainable lean six sigma for Indian SMEs. The study revealed the three most significant factors of “Failure of leadership to inspire and motivate”, “Lack of well-defined framework for executing initiatives” and “High implementation cost and poor estimation of cost”.
A study by Rajak et al. (2025) identified the 15 barriers hindering the manufacturing companies that imbibed the integration of LSS with I4.0. The study used the expert opinion of the decision makers (DMs). Authors further analyzed the feedback using the grey decision-making trial and evaluation laboratory (GDEMATEL) methods. A systematic review was undertaken to integrate LSS along with I4.0 integration to reveal the enablers and barriers (Macias-Aguayo et al., 2022).
A study based on 42 case studies that use Lean techniques along with I4.0 attempted to map the Lean barriers, considering their significant role in the social, environmental and operational domains (Yilmaz et al., 2022). The study was undertaken using expert opinions in the interpretive ranking process methodology to reveal that lean practices have a specific relationship with the elimination of waste and continuous improvement (Frecassetti et al., 2024).
The CoCoSo methodology has been used for ranking the CSFs and barriers while implementing various I4.0 technologies in manufacturing industries. The challenges of blockchain adoption for the manufacturing supply chain to achieve sustainability were examined, considering the case of the rubber industry (Yadav et al., 2024). Albayrak and Erkayman (2023) used CoCoSo to carry out a multi-criteria analysis for CSFs through I4.0. Matey et al. (2025) used CoCoSo to provide a hybrid framework to prioritize the performance metrics for blockchain technology adoption in manufacturing industries.
FDEMATEL has been used to model the contextual relationship of CSFs into cause and effect to help understand their mutual influence while implementing L4.0 in manufacturing SMEs (Qureshi and Mewada, 2025). A life cycle assessment was carried out employing a comprehensive framework deduced through a combinatorial approach of BWM-Fuzzy DEMATEL (Yadav et al., 2024). It has been used to classify sustainability functions considering their prominence and influence, to form cause-and-effect groups (Santos et al., 2024).
Considering the comprehensive review of literature, it has been found that the assessment of Lean barriers for L4.0 implementation using a combinatorial approach of CoCoSo and FDEMATEL has not been attempted. The present combinatorial approach provides more simplicity, robustness and accuracy in qualitative and quantitative assessment of L4.0 barriers. Further, twelve L4.0 barriers for L4.0 implementation in SMEs from a literature review were identified and later reduced to 10 following experts’ opinions. Table 1 depicts the list of L4.0 barriers along with their descriptions and references.
List of L4.0 barriers along with their description and references
| Sr. no. | Barriers | Description | References |
|---|---|---|---|
| 1 | High costs of Implementation | The initial investment needed for I4.0 technologies like data infrastructure, automation systems and IoT devices can be costly to implement, the Lean | Salonitis and Tsinopoulos (2016) |
| 2 | Integration with existing systems | Complex challenges with Lean integration may arise from incompatibilities among I4.0, L4.0 and existing systems | Abu et al. (2019) |
| 3 | Regulatory and compliance challenges | The adoption of I4.0 technologies may be hampered by the need to comply with numerous laws regarding data privacy, safety and environmental norms during L4.0 digitalization | Abu et al. (2019) |
| 4 | Lack of infrastructure | The implementation of L4.0, along with I4.0, may be hindered by inadequate technological or physical infrastructure, such as sensors, Internet access and computing | Moktadir et al. (2018) |
| 5 | Lack of skilled workforce in I4.0 technology | A lack of personnel with the technical skills to manage and operate I4.0 technologies may delay or prevent effective L4.0 implementation | Frecassetti et al. (2024), Moktadir et al. (2018) |
| 6 | Lack of understanding about L4.0 and I4.0 | The lack of understanding of L4.0 with I4.0 technologies reveals how their integration can complement one another to increase productivity and operational efficiency | Belhadi et al. (2017), Kumar et al. (2021), Salonitis and Tsinopoulos (2016), Zhang et al. (2017) |
| 7 | Failure to prioritize L.4 tools and practices | Inefficiencies and lost chances for development may arise from a failure to prioritize the application of L4.0 approaches along with I4.0 technologies | Lodgaard et al. (2016) |
| 8 | Cybersecurity concerns | L4.0 and I4.0 integration may lead to an increased risk of cyberattacks, data breaches and other security flaws with the adoption of connected devices and data sharing | Moktadir et al. (2018) |
| 9 | Resistance to change | Management or staff may be reluctant to embrace L4.0 and I4.0-led new procedures or technology out of concern for disruption, loss of employment or inexperience with the new systems | Vigneshvaran and Vinodh (2021) |
| 10 | Limited knowledge of I4.0 technology | Organizations or executives might not be completely aware of the potential of L4.0 and I4.0 technology integration, which leaves them without a clear plan or vision for how to use it | Moktadir et al. (2018) |
Source(s): Table by authors
3. Research methodology
A comprehensive review of the literature was carried out to identify and document L4.0 barriers that hinder the effective application of L4.0 in manufacturing settings. The adopted empirical approach identifies the L4.0 barriers that provide hurdles to L4.0 implementation in SMEs. The study establishes the causal connections between the L4.0 barriers. Data reliability and validity were tested using Cronbach’s alpha (α). Cronbach’s alpha is the most widely used to estimate internal consistency of items in a scale, it further shows the extent to which responses correlate. The exploratory factor analysis (EFA) was conducted to categorize the L4.0 barriers, providing insight into the underlying challenges and barriers that need to be addressed to ensure successful L4.0 implementation and its sustainment in the manufacturing sector.
The identified L4.0 barriers were further subjected to critical analysis to assess the reliability of the responses received through the survey. Importance Index analysis and the Corrected Item Minus Total Correlation (CIMTC) method were employed to analyze the grouped factors. Furthermore, bias tests were carried out to ensure the data’s integrity. After ensuring the consistency of the L4.0 barrier, the prioritization of the selected barriers was subjected to multi-criteria decision-making (MCDM) techniques.
The current study has adopted an integrative research methodology by combining two methods, that is “Combined Compromise Solution (CoCoSo)” and “Fuzzy Decision-Making Trial and Evaluation Laboratory (FDEMATEL)”. The framework depicting the role of each research methodology is shown in Figure 1. Various qualitative and quantitative empirical data and feedback from decision makers (DMs) panels support this framework. CoCoSo helps in evaluating and ranking the L4.0 barriers, while FDEMATEL classifies them into “cause” and “effect” categories.
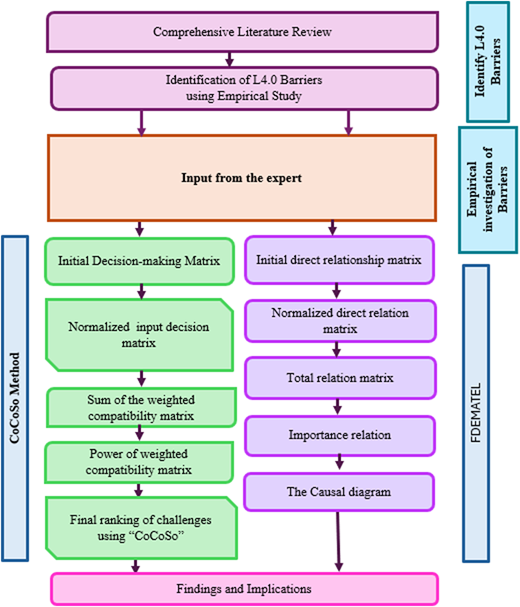
Research methodology. Source(s): Figure by authors
Research methodology. Source(s): Figure by authors
3.1 Combined compromise solution
The CoCoSo has a root to simple additive weighting and its exponentially weighted products. The method may be applied in evaluating and prioritizing L4.0 barriers. It allows detailed analysis of each L4.0 barrier to reveal its influence on L4.0 implementation in SMEs. The procedural steps of the CoCoSo methodology are as further described.
Step 1: The initial decision matrix may be developed based on the preferences provided by the DMs panel in terms of linguistics scale by transforming into the crip matrix.
The matrix provides an initial decision-making matrix, including the m-number of barriers and n-evaluations of barriers. The matrix “” provides the evaluation of barrier related barrier evaluation. Thus, “cij” shows the importance of the ith barriers per the jth expert evaluation.
Step 2: The normalization process is carried out on the matrix “” using Equations (2) and (3) by considering their nature either beneficial or non-beneficial.
Step 3: Si and Pi are the weighted comparability sequence of each alternative and the power weight of the comparability sequences of each alternative. They are calculated using Equations (4) and (5) respectively.
Step 4: Three aggregation approaches have been used to find the relative weights of each alternative. Equations (6)–(8) are used for calculating
The DM panel may decide the λ (usually 0.5) for the calculation
Step 5: The value of Ki affects the weight of the alternatives, Equation (9) may be used for calculating Ki
3.2 Fuzzy DEMATEL method
An FDEMATEL MCDM technique is one of the many developed techniques. It is a comprehensive technique dealing with causal relationships between various complex barriers that leads to identifying and evaluating them. It also reveals how the barriers directly interact with one another. It can also determine the influence of each barrier in the causal relationship. It has also been established that FDEMATEL helps in realizing the overall influence of the interacting barriers, either through direct or indirect causal relationships (Qureshi and Mewada, 2025). Thus, the management of interdependencies between the various barriers may be managed using this technique.
3.2.1 Fuzzy DEMATEL steps
FDEMATEL may comprise the following steps:
Step 1: Collection of the relevant information on L4.0 barriers:
The relevant information may be collected from the DMs panel, involving industry experts and academicians with reasonable experience in dealing with the barriers of the L4.0 implementations.
Step 2: Identification of L4.0 implementation barriers through a survey.
Identifying the L4.0 implementation barriers faced by SMEs is crucial and may be revealed through empirical analysis. The DMs panel may revise the identified barriers, considering the influence of L4.0 implementation on SMEs.
Step 3: Collection of responses from the DM panel.
In this step, the responses were collected from the DMs panel and later transformed into Triangular fuzzy number (TFN).
Step 4: Converting TFNs to crisp values.
Based on the responses input from the DM, it is essential to transform the linguistic scale into a TFN initially. These fuzzy numbers must then be converted back to a crisp value using the fuzzy assessments. The detailed procedure is explained in Equations (10) to (13). After that, the initial direct relationship matrix “T” can be generated from this crisp value aggregation.
Step 5: Analysis of Lean 4.0 barriers into a causal effect diagram.
The initial direct relationship matrix may be transformed into a crisp matrix. An initial direct relation matrix T is an “n * n” matrix created by pair-wise comparisons, where Tij expresses the extent to which criterion i influences criterion j.
Considering the k experts in the DM panel, the fuzzy weight will be kWij = (kW1ij, kW2ij, kW3ij) for the L4.0 barriers considered for the L4.0 implementation in SMEs. The subsequent normalization considering using Equations (10–11):
The crisp value and normalized crisp value may also be evaluated using Equations (12)–(13). The average value from the different opinions of k decision-makers may also be derived using Equation (14).
4. Data analysis and results
4.1 Data collection
Using Google Forms, WhatsApp and a personal approach, a total of 420 questionnaires were administered from June 2024 to January 2025. An empirical study was conducted to identify the L4.0 barriers for L4.0 implementation in SMEs. To accomplish a good response rate, in-person interviews were also conducted. A 66.67% response rate was obtained from the 280 responses that were returned. After filtering the collected responses, 220 responses were found to be useable and were used for further EFA analysis. The respondents’ demographic profile is shown in Table 2. The respondents belong to the group of practicing managers, supervisors, section engineers, group leaders and stakeholders from manufacturing SMEs.
Demographic profile (Qureshi et al., 2023b)
| Variable | Item | Frequency | Percentage (%) |
|---|---|---|---|
| Gender | Male | 128 | 0.582 |
| Female | 92 | 0.418 | |
| Firm size based on employee strength | Micro (1–4) | 53 | 0.241 |
| Small (5–99) | 72 | 0.327 | |
| Medium (100–499) | 95 | 0.432 | |
| Establishment years | <5 | 41 | 0.186 |
| >5<10 | 86 | 0.391 | |
| >10 years | 93 | 0.423 | |
| Industry type | Casting machining | 46 | 0.209 |
| Gear manufacturing | 30 | 0.136 | |
| Machines manufacturers | 31 | 0.141 | |
| Surgical parts manufacturers | 63 | 0.286 | |
| Automotive parts manufacturers | 19 | 0.086 | |
| Electrical parts manufacturers | 14 | 0.064 | |
| Other | 17 | 0.077 |
Source(s): Table by authors
4.2 Data analysis and checking for reliability and validity
The responses gathered were subjected to further analysis using SPSS 28.0. The values of the mean and standard deviation (SD) were calculated, and the minimum mean value was found to be 3.43. EFA was used to find the component matrix since it is generally used to identify the structure of factors. With little information loss, EFA can decrease the number of variables included in a smaller structure. To determine whether the data were suitable for further EFA, the Kaiser-Meyer-Olkin (KMO) and Bartlett’s test of sphericity were also employed. Field (2013) states that the suggested value for “Bartlett’s test of sphericity” is p < 0.01 and that the minimum acceptable KMO value is 0.60. The KMO value of 0.647 was obtained. This data was gathered from the industries that were appropriate for the EFA study. Varimax factor rotation is a tool that EFA can utilize to ascertain the factor structure of variables (Field, 2013). In this study, the L4.0 barriers were classified into four major groups, with a total variance of 73.421%. Each barrier has a factor loading range of 0.6–0.9, which falls under the acceptable limits.
The first group was classified as “Economic and Technical Barrier”. Namely, two barriers, High Costs of Implementation (B1) and Cybersecurity Concerns (B8) were present in this group. The second classification was named as “Organisational Barrier”. This group has three barriers: Lack of Infrastructure (B4), Limited Knowledge of I4.0 Technology (B10) and Failure to Prioritize Lean Tools and Practices (B7). The third group was obtained and named “Organisational and Human Barriers”. Three barriers were classified: Regulatory and Compliance Challenges (B3), Resistance to Change (B9) and Lack of Skilled Workforce in I4.0 Technology (B5). The fourth category classified was the “Knowledge Barrier”. Lack of Understanding about L4.0 and I4.0 (B6) and Integration with Existing Systems (B2) are the two barriers that fall under this category.
Assessing a measure’s accuracy and “goodness” requires reliability verification. The factor-loading concept is used to assess convergent validity, with a value of 0.5 or higher being deemed appropriate. Cronbach’s alpha (α), a commonly used dependability metric, shows how consistent a scale is internally. Cronbach’s alpha for this study was found to be acceptable at 0.743.
Correlation of Item and Total Correlation (CIMTC) reveals the connections between each item and the overall score derived from the questionnaire, thus providing an in-depth understanding of the item-score relationships. Hence, to identify the most significant L4.0 barriers, a CIMTC test was employed. According to the statistical analysis, all 10 of the L4.0 barriers had CIMTC values between 0.500 and 0.727, confirming their significance for the present study. Harman’s single factor test was confirmed by conducting EFA loading of all items included in the present study (Podsakoff et al., 2003). In an EFA loading, if the total variance extracted by one factor exceeds 50%, then common method bias (CMB) is present. In the present study, it was found that less than 50%, which confirms there is no evidence of CMB. Furthermore, the L4.0 barriers show a maximum standard deviation of 1.144.
The FDEMATEL procedure, as stated earlier, was applied systematically. The DM panel comprised six male assistant managers with MTech qualifications in mechanical engineering and 5–7 years of experience. Four male manufacturing heads with BTech degrees in mechanical engineering and 14–17 years of experience were selected. Three male section executives with BTech degrees in mechanical engineering had 13–17 years of experience. The DM panel also included two female professors with PhDs in industrial engineering and 5–8 years of experience. Thus, the DM panel had experience ranging from 7 to 17 years. Thirteen members of the DM panel were from SMEs dealing in manufacturing supply chains (SC) and had prior knowledge and exposure to L4.0 and I4.0.
The first brainstorming session was conducted to make them aware of the contextual relationship rating for L4.0 barriers. The second brainstorming session was held to examine all the L4.0 barriers for their influence and practical implications before their selection. A questionnaire comprising rating points was developed, and evaluations were obtained from the DM panel. A statistical test was conducted to reveal the mean and standard deviation. All the L4.0 barriers for L4.0 implementation in SMEs for a manufacturing supply chain (SC) had a mean value above 3.43, as shown in Figure 2, indicating that all the barriers are significant for SMEs.
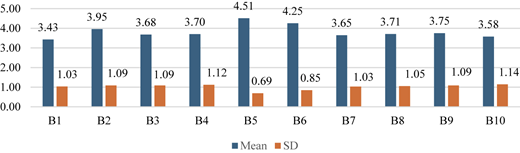
Mean and SD of L4.0 barriers. Source(s): Figure by authors
Mean and SD of L4.0 barriers. Source(s): Figure by authors
The CoCoSo technique was applied, which involved feedback from the DM panel. DM panel members provided feedback using the linguistic terms as shown in Table 3.
4.3 Combined compromise solution
The CoCoSo is based on the combination of simple additive weighting and an exponentially weighted product model. It deals with the ranking or selection of alternatives. Furthermore, they are assessed against specific criteria. The matrix for the “CoCoSo” is derived and shown in Table 4. The Likert scale may be used to create the initial matrix.
Initial decision-making matrix
| Barriers | DM 1 | DM 2 | DM 3 | DM 4 | DM 5 | DM 6 | DM 7 | DM 8 | DM 9 | DM 10 | DM 11 | DM 12 | DM 13 | DM 14 | DM 15 |
|---|---|---|---|---|---|---|---|---|---|---|---|---|---|---|---|
| B1 | 3 | 2 | 1 | 1 | 1 | 1 | 1 | 1 | 1 | 1 | 1 | 1 | 1 | 1 | 1 |
| B2 | 5 | 5 | 3 | 3 | 1 | 3 | 3 | 3 | 4 | 2 | 2 | 2 | 2 | 1 | 4 |
| B3 | 2 | 3 | 3 | 5 | 3 | 2 | 3 | 5 | 5 | 4 | 5 | 4 | 3 | 5 | 3 |
| B4 | 4 | 2 | 5 | 2 | 5 | 2 | 4 | 2 | 3 | 2 | 4 | 2 | 3 | 5 | 4 |
| B5 | 4 | 2 | 4 | 2 | 5 | 2 | 4 | 4 | 3 | 2 | 4 | 4 | 3 | 5 | 4 |
| B6 | 4 | 3 | 4 | 3 | 4 | 3 | 4 | 4 | 4 | 3 | 4 | 3 | 4 | 4 | 3 |
| B7 | 5 | 5 | 3 | 4 | 5 | 4 | 3 | 5 | 4 | 4 | 2 | 3 | 5 | 4 | 2 |
| B8 | 3 | 1 | 2 | 5 | 5 | 2 | 2 | 3 | 5 | 3 | 4 | 3 | 3 | 5 | 3 |
| B9 | 2 | 3 | 3 | 2 | 4 | 3 | 3 | 2 | 3 | 3 | 4 | 3 | 4 | 3 | 3 |
| B10 | 3 | 4 | 4 | 4 | 5 | 4 | 5 | 3 | 5 | 4 | 5 | 5 | 4 | 4 | 4 |
Source(s): Table by authors
Additionally, Equations (2) and (3) are used to normalize the initial . In this study, we consider each expert’s opinion to be of equal weight (i.e. 0.06) since all experts are equally important. Also, we consider barriers to be non-beneficial criteria; hence, Equation (3) may be used to normalize the initial . The result is shown in Table 5 (Annexure I), which represents the normalized .
Furthermore, each barrier’s weighted comparability order and its sum (Sj) are calculated using Equation (4). Table 6 (Annexure I) represents the order of weighted comparability findings as well as the computed Sj values.
Likewise, each barrier’s power-weighted comparability sequence and its summation (Pi) are determined using Equation (5). Table 7 (Annexure I) shows the computed summation (Pi) value and the power-weighted comparability sequence.
By using Equations (6) to (8), the three aggregating methods are applied to determine the relative weights (Kia, Kib and Kic) of each barrier. Later on, Equation (9) is used to calculate the final weights based on these relative weights. Every barrier receives a ranking based on these relative and final weights; Figure 3 represents the relative weights and final weights of barriers.
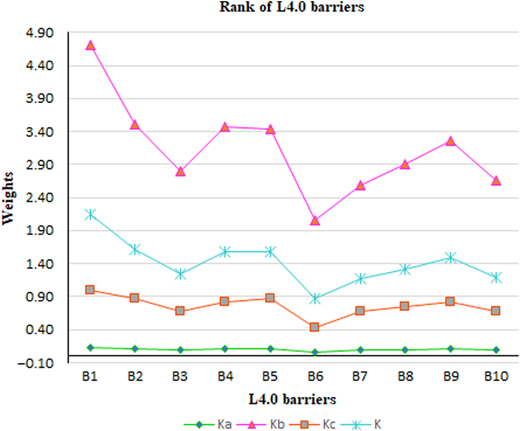
Relative and final weights of barriers. Source(s): Figure by authors
Relative and final weights of barriers. Source(s): Figure by authors
The L4.0 barriers may be arranged in descending order of Ki. The higher the “Ki” value the greater is the importance of barriers in terms of their significance. Table 8 shows the final ranking of the L4.0 barriers using CoCoSo.
Final ranking of barriers using “CoCoSo” and aggregation
| Barriers | Pi + Si | Ka | Rank | Kb | Rank | Kc | Rank | K | Final rank |
|---|---|---|---|---|---|---|---|---|---|
| B1 | 14.85 | 0.13 | 1 | 4.71 | 1 | 1.00 | 1 | 2.15 | 1 |
| B2 | 13.06 | 0.12 | 2 | 3.50 | 2 | 0.88 | 2 | 1.62 | 2 |
| B3 | 10.14 | 0.09 | 7 | 2.79 | 7 | 0.68 | 7 | 1.25 | 7 |
| B4 | 12.24 | 0.11 | 4 | 3.47 | 3 | 0.82 | 4 | 1.57 | 4 |
| B5 | 12.96 | 0.11 | 3 | 3.43 | 4 | 0.87 | 3 | 1.59 | 3 |
| B6 | 6.40 | 0.06 | 10 | 2.06 | 10 | 0.43 | 10 | 0.87 | 10 |
| B7 | 9.94 | 0.09 | 9 | 2.59 | 9 | 0.67 | 9 | 1.17 | 9 |
| B8 | 11.02 | 0.10 | 6 | 2.91 | 6 | 0.74 | 6 | 1.32 | 6 |
| B9 | 12.09 | 0.11 | 5 | 3.26 | 5 | 0.81 | 5 | 1.49 | 5 |
| B10 | 10.04 | 0.09 | 8 | 2.67 | 8 | 0.68 | 8 | 1.20 | 8 |
Source(s): Table by authors
4.4 Sensitivity analysis
A sensitivity analysis is performed to assess the results’ robustness (Yadav et al., 2024). Sensitivity analysis can provide valuable information on how various weight configurations and scores impact the order in which L4.0 barriers are prioritized. The feedback from the DM panel has the possibility of biases arising from their involvement in lean activities and industry exposure. The weight of each DM was altered in an individual run to carry out the sensitivity analysis. The change in the barrier weight altered the priority order analysis. A total of 15 distinct runs were conducted for each barrier by varying the weights of each DM. It has been revealed that the rank of each L4.0 barrier was unchanged except for two barriers. Table 9 shows the results of the sensitivity analysis. In 15 runs, the High Costs of Implementation (B1) barrier received the highest ranking in all runs, whereas the Lack of Understanding about L4.0 and I4.0 (B6) received the lowest ranking. The sensitivity analysis also shows that the results are sufficiently stable and reliable. Figure 4 represents the rank of each L4.0 barrier.
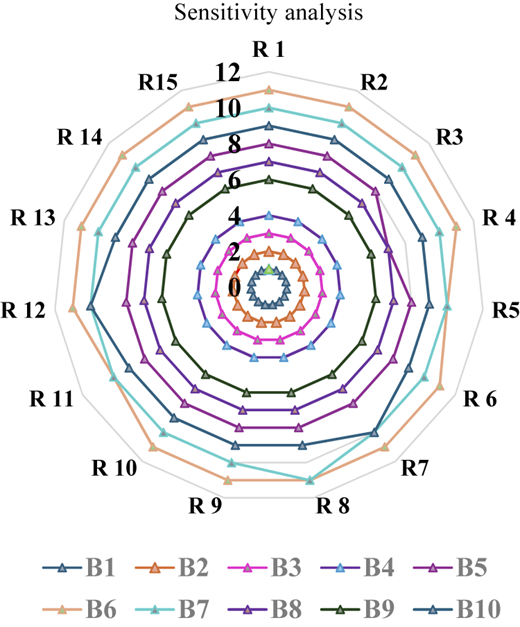
Barriers’ rank and sensitivity analysis. Source(s): Figure by authors
Barriers’ rank and sensitivity analysis. Source(s): Figure by authors
Sensitivity analysis
| Barriers | R 1 | R2 | R3 | R 4 | R5 | R 6 | R7 | R 8 | R 9 | R 10 | R 11 | R 12 | R 13 | R 14 | R15 |
|---|---|---|---|---|---|---|---|---|---|---|---|---|---|---|---|
| B1 | 1 | 1 | 1 | 1 | 1 | 1 | 1 | 1 | 1 | 1 | 1 | 1 | 1 | 1 | 1 |
| B2 | 2 | 2 | 2 | 2 | 2 | 2 | 2 | 2 | 2 | 2 | 2 | 2 | 2 | 2 | 2 |
| B3 | 3 | 3 | 3 | 3 | 3 | 3 | 3 | 3 | 3 | 3 | 3 | 3 | 3 | 3 | 3 |
| B4 | 4 | 4 | 4 | 4 | 4 | 4 | 4 | 4 | 4 | 4 | 4 | 4 | 4 | 4 | 4 |
| B5 | 8 | 8 | 8 | 7 | 8 | 8 | 8 | 8 | 8 | 8 | 8 | 8 | 8 | 8 | 8 |
| B6 | 11 | 11 | 11 | 11 | 10 | 11 | 11 | 11 | 11 | 11 | 10 | 11 | 11 | 11 | 11 |
| B7 | 10 | 10 | 10 | 10 | 10 | 10 | 10 | 11 | 10 | 10 | 10 | 10 | 10 | 10 | 10 |
| B8 | 7 | 7 | 7 | 7 | 7 | 7 | 7 | 7 | 7 | 7 | 7 | 7 | 7 | 7 | 7 |
| B9 | 6 | 6 | 6 | 6 | 6 | 6 | 6 | 6 | 6 | 6 | 6 | 6 | 6 | 6 | 6 |
| B10 | 9 | 9 | 9 | 9 | 9 | 9 | 10 | 9 | 9 | 9 | 9 | 10 | 9 | 9 | 9 |
Source(s): Table by authors
4.5 Fuzzy DEMATEL method
The initial direct relationship matrix is generated by transforming the crisp value provided by experts using the linguistic scale as depicted in Table 10. The aggregation of the initial direct relationship matrix is carried out and is represented in Table 11. The initial direct relation matrix may be normalized, and matrix “D” may be obtained. Table 12 shows such a matrix; the matrix may be derived using Equations (15) and (16). Based on the obtained normalized direct relation matrix “D” the total relation matrix M can be obtained, represented in Table 13, by using the formula explained in Equation (17). Table 14 shows the “cause” and “effect” classification for a clear understanding of the L4.0 barriers.
Linguistic scale used for transformation
| Response | Linguistic terms | Triangular fuzzy number (TFN) |
|---|---|---|
| 1 | No influence | (0.0, 0.1, 0.3) |
| 2 | Low influence | (0.1, 0.3, 0.5) |
| 3 | Medium influence | (0.3, 0.5, 0.7) |
| 4 | High influence | (0.5, 0.7, 0.9) |
| 5 | Max influence | (0.7, 0.9, 1.0) |
Source(s): Table by authors
Initial direct relationship matrix
| Barriers | B1 | B2 | B3 | B4 | B5 | B6 | B7 | B8 | B9 | B10 | SUM |
|---|---|---|---|---|---|---|---|---|---|---|---|
| B1 | 1.00 | 0.72 | 0.57 | 0.47 | 0.50 | 0.63 | 0.66 | 0.69 | 0.72 | 0.69 | 6.65 |
| B2 | 0.63 | 1.00 | 0.47 | 0.50 | 0.66 | 0.50 | 0.57 | 0.56 | 0.69 | 0.75 | 6.34 |
| B3 | 0.66 | 0.66 | 1.00 | 0.59 | 0.53 | 0.66 | 0.57 | 0.63 | 0.87 | 0.72 | 6.90 |
| B4 | 0.47 | 0.44 | 0.81 | 1.00 | 0.69 | 0.57 | 0.41 | 0.54 | 0.78 | 0.66 | 6.37 |
| B5 | 0.50 | 0.47 | 0.57 | 0.44 | 1.00 | 0.50 | 0.69 | 0.57 | 0.56 | 0.72 | 6.03 |
| B6 | 0.69 | 0.66 | 0.66 | 0.63 | 0.56 | 1.00 | 0.41 | 0.56 | 0.76 | 0.63 | 6.55 |
| B7 | 0.69 | 0.59 | 0.44 | 0.56 | 0.69 | 0.54 | 1.00 | 0.50 | 0.66 | 0.69 | 6.37 |
| B8 | 0.60 | 0.57 | 0.66 | 0.56 | 0.66 | 0.81 | 0.50 | 1.00 | 0.63 | 0.63 | 6.63 |
| B9 | 0.63 | 0.53 | 0.63 | 0.75 | 0.75 | 0.60 | 0.72 | 0.47 | 1.00 | 0.72 | 6.81 |
| B10 | 0.63 | 0.66 | 0.66 | 0.57 | 0.66 | 0.60 | 0.60 | 0.47 | 0.81 | 1.00 | 6.64 |
Source(s): Table by authors
Normalized direct relation matrix (D)
| Barriers | B1 | B2 | B3 | B4 | B5 | B6 | B7 | B8 | B9 | B10 |
|---|---|---|---|---|---|---|---|---|---|---|
| B1 | 0.14 | 0.10 | 0.08 | 0.07 | 0.07 | 0.09 | 0.10 | 0.10 | 0.11 | 0.10 |
| B2 | 0.09 | 0.14 | 0.07 | 0.07 | 0.10 | 0.07 | 0.08 | 0.08 | 0.10 | 0.11 |
| B3 | 0.10 | 0.10 | 0.14 | 0.09 | 0.08 | 0.10 | 0.08 | 0.09 | 0.13 | 0.10 |
| B4 | 0.07 | 0.06 | 0.12 | 0.14 | 0.10 | 0.08 | 0.06 | 0.08 | 0.11 | 0.10 |
| B5 | 0.07 | 0.07 | 0.08 | 0.06 | 0.14 | 0.07 | 0.10 | 0.08 | 0.08 | 0.10 |
| B6 | 0.10 | 0.10 | 0.10 | 0.09 | 0.08 | 0.14 | 0.06 | 0.08 | 0.11 | 0.09 |
| B7 | 0.10 | 0.09 | 0.06 | 0.08 | 0.10 | 0.08 | 0.14 | 0.07 | 0.10 | 0.10 |
| B8 | 0.09 | 0.08 | 0.10 | 0.08 | 0.10 | 0.12 | 0.07 | 0.14 | 0.09 | 0.09 |
| B9 | 0.09 | 0.08 | 0.09 | 0.11 | 0.11 | 0.09 | 0.10 | 0.07 | 0.14 | 0.10 |
| B10 | 0.09 | 0.10 | 0.10 | 0.08 | 0.10 | 0.09 | 0.09 | 0.07 | 0.12 | 0.14 |
Source(s): Table by authors
Total relation matrix
| Barriers | B1 | B2 | B3 | B4 | B5 | B6 | B7 | B8 | B9 | B10 | Ri |
|---|---|---|---|---|---|---|---|---|---|---|---|
| B1 | 1.87 | 1.77 | 1.79 | 1.68 | 1.85 | 1.78 | 1.72 | 1.67 | 2.10 | 2.02 | 18.26 |
| B2 | 1.72 | 1.73 | 1.69 | 1.60 | 1.79 | 1.67 | 1.63 | 1.57 | 1.99 | 1.94 | 17.32 |
| B3 | 1.89 | 1.83 | 1.93 | 1.76 | 1.93 | 1.85 | 1.78 | 1.73 | 2.21 | 2.11 | 19.02 |
| B4 | 1.71 | 1.65 | 1.76 | 1.69 | 1.81 | 1.70 | 1.61 | 1.58 | 2.03 | 1.94 | 17.48 |
| B5 | 1.62 | 1.57 | 1.62 | 1.51 | 1.75 | 1.59 | 1.57 | 1.50 | 1.88 | 1.84 | 16.43 |
| B6 | 1.79 | 1.74 | 1.78 | 1.68 | 1.84 | 1.81 | 1.66 | 1.63 | 2.08 | 1.99 | 18.00 |
| B7 | 1.74 | 1.67 | 1.69 | 1.61 | 1.80 | 1.68 | 1.70 | 1.57 | 2.00 | 1.93 | 17.40 |
| B8 | 1.80 | 1.74 | 1.80 | 1.68 | 1.87 | 1.80 | 1.69 | 1.71 | 2.08 | 2.01 | 18.19 |
| B9 | 1.85 | 1.78 | 1.84 | 1.76 | 1.93 | 1.81 | 1.77 | 1.67 | 2.19 | 2.07 | 18.66 |
| B10 | 1.81 | 1.76 | 1.80 | 1.69 | 1.88 | 1.77 | 1.71 | 1.63 | 2.11 | 2.07 | 18.23 |
| Ci | 17.79 | 17.24 | 17.70 | 16.66 | 18.46 | 17.46 | 16.85 | 16.26 | 20.67 | 19.91 | |
| Threshold value () = | 1.79 | ||||||||||
Source(s): Table by authors
The “Prominence” and “Relation” axes for the causal diagram (importance relation)
| Barriers | Ri | Ci | Ri + Ci | Ri-Ci | Cause/effect |
|---|---|---|---|---|---|
| B1 | 18.26 | 17.79 | 36.05 | 0.48 | Cause |
| B2 | 17.32 | 17.24 | 34.56 | 0.09 | Cause |
| B3 | 19.02 | 17.70 | 36.72 | 1.32 | Cause |
| B4 | 17.48 | 16.66 | 34.14 | 0.83 | Cause |
| B5 | 16.43 | 18.46 | 34.89 | −2.03 | Effect |
| B6 | 18.00 | 17.46 | 35.46 | 0.54 | Cause |
| B7 | 17.40 | 16.85 | 34.24 | 0.55 | Cause |
| B8 | 18.19 | 16.26 | 34.45 | 1.93 | Cause |
| B9 | 18.66 | 20.67 | 39.33 | −2.02 | Effect |
| B10 | 18.23 | 19.91 | 38.15 | −1.68 | Effect |
Source(s): Table by authors
Based on the prominence and relation, a causal diagram may be drawn, which is shown in Figure 5. Different color codes have been used to demonstrate the various L4.0 barriers to provide more clarity and give an overview of the cause-and-effect. The blue color represents the weak link between the barriers, the green color represents the medium link between the barriers and the red color represents the strong link between the barriers.
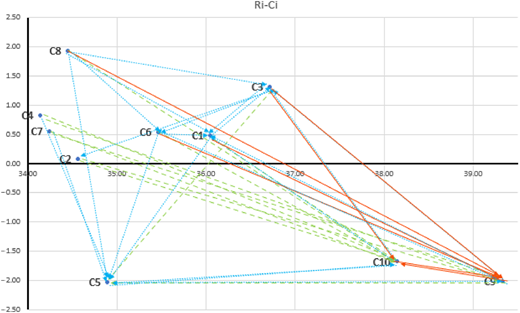
The causal diagram of L4.0 barriers. Source(s): Figure by authors
The causal diagram of L4.0 barriers. Source(s): Figure by authors
5. Discussion
SMEs can employ L4.0 while incorporating contemporary technology to enhance quality, reduce expenses, boost productivity and adapt to changing market situations. The business environment is becoming more digital and fast-paced; using L4.0 principles with I4.0 technology enables SMEs to participate and compete. However, L4.0 implementation faces several challenges and a high failure rate.
In the present study, ten barriers were identified using empirical studies and experts’ feedback. The identified barriers have been subjected to analysis. The CoCoSo approach was used to assess the barriers in terms of decision-making. The approach involves breaking down the barriers into cost and benefit criteria. The beneficial effect is conveyed by the benefit criteria, while the adverse effect is conveyed by the cost criteria. The expenses and benefits, which commonly conflict, can be balanced with the use of the CoCoSo technique. It enables decision-makers to optimize their choices by making well-informed decisions. All the barriers considered in this study fall under the category of cost criteria. The implementation of I4.0 technology entails significant financial costs for SMEs. The latest software, professional and trained labor and equipment end up costing a lot of money. Using I4.0 technologies requires either skilled workers or existing workers to be trained, which raises the cost. SMEs face difficulties if employees are unable to understand L4.0 or implement I4.0. Hence, SMEs must provide training to enhance skills and knowledge, which is supported by another study on lean implementation (Barclay et al., 2022). SMEs must bear another cost of integrating the old system with the new systems to apply I4.0 technologies. To prevent a security breach, SMEs must take various measures to protect their data. The cost of setting a new setting altogether or customizing the existing one increases the cost.
The selected barriers were evaluated and prioritiszed using CoCoSo. The results reveal that High Costs of Implementation (B1) > Integration with Existing Systems (B2) > Lack of Skilled Workforce in I4.0 Technology (B5) > Lack of Infrastructure (B4) > Resistance to Change (B9) > Cybersecurity Concerns (B8) > Regulatory and Compliance Challenges (B3) > Limited Knowledge of I4.0 Technology (B10) > Failure to Prioritize Lean Tools and Practices (B7) > Lack of Understanding about Lean and I4.0 (B6) where the “>” indicates higher rank than others. The identified barriers are as per the previous studies (Kumar and Kumar, 2014; Elkhairi et al., 2019). The study by Kumar and Kumar (2014) found the lean manufacturing implementation barriers to experience, resources, employees, finances, conflicts, knowledge and management.
The priority will help SMEs with their strategic planning of resource allocation, workforce and infrastructure readiness, change management and cybersecurity, compliance and knowledge management, lean tools and cultural shifts. Based on this strategic planning, SMEs may realize efficient investment, operational readiness, risk mitigation and sustainable L4.0 adoption. The barriers priority may help SMEs manage and focus on the most impactful barriers first, strengthening workforce capabilities, ensuring infrastructure readiness, addressing organizational and security risks, ensuring compliance and technical readiness and strengthening knowledge and lean practices to gain managerial advantages in efficient resource allocation, reduced implementation risks, smoother transitions and sustainable growth.
Further, the FDEMATEL method was employed to classify them into four major categories, that is “Economic and Technical Barrier”, “Organisational Barrier”, “Organisational and Human Barrier” and “Knowledge Barrier”. The study also revealed that barriers played a crucial role in the cause-and-effect diagram. The first four barriers that have a significant impact on SMEs are High Costs of Implementation (B1), Integration with Existing Systems (B2) and Regulatory and Compliance Challenges (B3), and Lack of Infrastructure (B4) and may be classified as Financial and Infrastructure Barriers. The management of SMEs must take great care of these barriers. The other L4.0 barriers, that is Lack of Understanding about L4.0 and I4.0 (B6), Failure to Prioritize Lean Tools and Practices (B7), may be grouped under Knowledge and Organisational Barriers. SMEs must strive for workers training to upgrade their knowledge and skills. The last L4.0 groups under the “cause” group, that is Cybersecurity Concerns (B8) may be classified under the group of Security and Risk Barriers. Data security is the most critical barrier to L4.0 implementation, hence SMEs should invest in security and risk management. The L4.0 barriers under the “Effect” cover the Lack of Skilled Workforce in I4.0 Technology (B5), Resistance to Change (B9) and Limited Knowledge of I4.0 Technology (B10) may be classified as Human Capital and Change Management Barriers. The groups will help the SME management to focus on one group at a time to cover barriers for successful L4.0 implementations. The barriers in the cause group have an impact on the other barriers classified as “Effect” that influenced the L4.0 implementation, hence suitable managerial strategy or actions may be derived to get rid of these barriers. The accomplishment of Financial and Infrastructure Barriers may help in providing state-of-the-art training to employees to enhance their I4.0-related knowledge and overcome the weaknesses in the skills required to handle L4.0 and I4.0 integration. Fulfilling Lack of Understanding about L4.0 and I4.0, will help in reducing the Resistance to Change which will aid in adopting new strategy in their day-to-day operations. Thus, management may plan to control the barrier in the cause group. A study based on 42 case studies also found that investment cost and technological readiness are the major barriers (Yilmaz et al., 2022).
L4.0 combined with I4.0 technologies can be very helpful, productive and efficient for SMEs. However, implementing I4.0 technologies like cybersecurity, advanced robotics and IoT (Internet of Things) can be very expensive for SME owners, as they lack the financial resources to invest in these modern technologies. Thus, it acts as a barrier to the implementation of L4.0. Implementing L4.0 along with the manufacturing system also requires new software and skilled employee training, which adds to an increase in cost. Many SMEs are operating in the old traditional manner, which does not go well with advanced I4.0 technologies. Because of this, they are not able to implement L4.0. This integration of old and modern technologies poses a barrier to SMEs. New software and technology are needed for modern I4.0 technologies like robotics, Cloud computing, AI and IoT.
SMEs need to seamlessly integrate both old and new systems without disturbing operations. As I4.0 technology has become widespread, the probability of cyberattacks has risen as technological systems and gadgets have become more interconnected. Cybersecurity breaches can lead to serious financial and reputational harm, data theft and intellectual property loss; thus, SMEs should also take steps to protect their data. Along with opting for new I4.0 technologies, they must also follow the new rules and regulations, which SMEs find difficult to comprehend and fulfill. The safety, quality and data protection standards are linked to I4.0 technology since regulatory and compliance requirements might be challenging. Many SMEs may lack the infrastructure needed to successfully adopt L4.0 technologies, such as stable Internet access, advanced technology or sufficient physical space. Implementing I4.0 technologies for L4.0 has the biggest challenge of the lack of workers with the necessary skills to handle and maintain I4.0 technologies, including AI, data analytics and robotics, which is one of the biggest obstacles. The links between Lean concepts and I4.0 technologies are not well understood by many SMEs. SMEs might not realize the full potential of the integration if they have no idea how L4.0 might increase operational efficiency. Along with understanding the combination of L4.0 and I4.0, lean practices must be given top priority by SMEs. Inaction on their part could have negative effects, such as low productivity, excessive operational costs and an inability to accomplish continuous improvement.
6. Managerial implication
For SMEs to implement L4.0 combined with I4.0 technologies turns out to be very expensive because of the infrastructure, new machinery and employee training. To overcome these barriers, managers could start by conducting simple, inexpensive projects that show the results of utilizing L4.0. Managers can also search for government loans and financing to upgrade their technology. To remove the barrier of integrating the new and the old systems, the managers can adopt flexible adaptive technologies that are simple to integrate with the older systems and should be given top priority (Kumar and Kumar, 2014). Due to the rise of modern I4.0 technologies, the threat of breach of cybersecurity also increases, therefore the manager needs to look for good firewalls, and secure controls to ensure that there is robust security. The lack of infrastructure is a barrier that the managers can remove by concentrating on small improvements and getting good connectivity. Another approach to lessen infrastructure issues is to rent machinery or choose shared facilities. To implement the I4.0 technologies, managers can hire workers who are skilled and trained (Barclay et al., 2022). Managers can also set up training programs for the existing employees. Through this training, the employee will gain knowledge of L4.0, and I.40, and it will enable them to understand how the two are related. The information gained from the training and workshops will help the managers and the employees execute the various lean tools and practices.
7. Conclusion
The purpose of the current research is to establish and explore the L4.0 implementation barriers faced by manufacturing SMEs. Using empirical studies and expert opinions, ten L4.0 barriers were identified. The identified ten L4.0 barriers were subjected to the CoCoSo and FDEMATEL methodologies. A linguistic rating scale based on five points was employed, and later results were validated by undergoing sensitivity analysis. The triangulated approaches of empirical analysis, CoCoSo and FDEMATEL show better results. The present study reveals the L4.0 barriers to L4.0 implementation in manufacturing SMEs. The SME stakeholders could benefit from identifying the L4.0 barriers to avoid any L4.0 implementation failures.
8. Limitations and future scope
The L4.0 barriers hinder the L4.0 integration with I4.0; hence, they need a comprehensive understanding of the roadmap to lean implementation so that SME entrepreneurs know their objectives and how to achieve them by being fully aware. The presented study is based on empirical analysis and expert opinion in identifying and prioritizing L4.0 barriers in SMEs. The exploration of this study is the outcome of manufacturing in Indian SMEs. The L4.0 barriers may vary from developing countries to developed countries. The study identifies ten L4.0 barriers that may seem limited when considering the other SMEs in different countries during L4.0 implementation.
Future research could include more L4.0 barriers, considering SMEs across countries. The present results may be generalized by considering other developing countries to conduct a comparative analysis. This study can also be performed by adopting different methodological approaches. The empirical study could also be supported through structural equation modelling.
References
The supplementary material for this article can be found online.

