


This study intend to investigate a theoretical model looking at how particular tourist emotions, such as “joy,” “love,” and “positive surprise,” might predict their behavior by looking at how satisfied they are with their whole experience when visiting spas, and to examine the relationship of emotional experience, destination image, satisfaction and intention to revisit for spa tourism.
A sample of 345 individuals who traveled to Alleppey as domestic tourists participated in the research study. A non-probability (purposive) sampling method in this study. The structural model was analyzed using Structural Equation modeling (SEM), and the path coefficients were examined to test the hypotheses.
The results supported the hypotheses, indicating that specific emotions, image of the destination, and satisfaction significantly impacted tourists' intentions to revisit Alleppey as a spa tourism destination. This study demonstrated that “emotions of joy, love, and positive surprise” have a considerable influence on the image of the destination and satisfaction. The findings reveal a substantial correlation between satisfaction and behavioral intention (“Intention to revisit”). The research suggests that a higher degree of satisfaction would encourage visitors to revisit the location.
The research suggests that a higher degree of satisfaction would encourage visitors to revisit the location. This research offers vital information for developing, planning, and putting into practice tourism policies in the spa tourism sector. This article focuses on domestic travelers who travel to Alleppey, so the conclusions may not be relevant to research utilizing foreign tourists.
According to the literature study, and to the authors` knowledge, only limited number of studies that look at spa tourism from a wellness perspective. Additionally, Alleppey is used in the study as the study’s setting, providing insight into the visitor experiences of this expanding spa tourism business. This study gives understanding about how emotional experience predicts behavioral intentions.
1. Introduction
Wellness involves being in harmony with one’s body, mind, soul, and surroundings (Dunn, 1959). It incorporates lifestyle choices, mental, physical, and spiritual health, as well as how individuals interact with one another, and the environment (Smith & Puczkó, 2008). Wellness is becoming more widely acknowledged as an important aspect of tourism (DiPietro, Moreo, & Cain, 2020; Stara & Peterson, 2017). The worldwide tourism industry has benefited from people traveling abroad to improve their health and well-being because of the growing desire for well-being (Bushell & Sheldon, 2009; Chen, Chang, & Tung, 2014). It is a growing sector of the tourist industry where people go alone or in groups to high-end hotels and other destinations to maintain their physical and emotional well-being (Kazakov & Oyner, 2021; Perelygina, Kucukusta, & Law, 2022), and has been a widespread and recurrent research area for the last 75 years. The Institute of Global Wellness forecasts that the wellness industry will resume its rapid growth as we get out of the pandemic. The wellness sector is anticipated to grow at an average annual rate of 9.9% and reach about $7.0 trillion in 2025 (“Glob. Wellness Inst.”, 2022). This industry has recently become more popular in most Asian countries (Feng et al., 2021; Pang, Ko, Kim, & Ko, 2022) A recent study has recognized wellness travel is a fast-growing industry at a global level in addition to the current unfavorable economic climate for the tourism industry (Smith & Dryglas, 2020). Arguably, wellness tourism is playing a significant part in achieving some new stress-reduction, personal growth, introspection, connection, and purpose functions that are often difficult to achieve in daily life (Kelly, 2010). It offers a wide range of activities for the maintenance, growth, and improvement of the physical, mental, and spiritual people (Smith & Kelly, 2006).
It is recognized as a comprehensive mode of transportation that combines the need for bodily well-being, and connections based on aesthetics, spirituality, and religion (Steiner & Reisinger, 2006). It is intended for healthy individuals who are dedicated to maintaining and enhancing their health (So, King, & Sparks, 2014), and based on places, the therapy forms (Meera & Vinodan, 2019). International travel agencies have benefited from wellness travel by encouraging people to go to different nations to enhance their health and wellness by experiencing the regions (Sheldon & Bushell, 2009; Strack & Raffay-Danyi, 2020). A larger variety of services and experiences that make up value propositions that can positively influence people’s well-being have emerged as a result of the tourist industry’s all-encompassing strategy (Suban, 2022a, b; Suban, Madhan, & Shagirbasha, 2021).
The spa industry, one of the important wellness categories, directly provides customers with individualized services and experiences (Sangpikul, 2021). Spas are places dedicated to advancing general wellness (“Int. Spa Assoc.”, 2022). These are destinations for rejuvenation and relaxation where natural products and relaxing techniques are combined with beauty treatments (Buxton & Michopoulou, 2021). Thus, the modern spa industry is a fragmented, diverse segment of the economy that is just starting to mature (Tabacchi, 2010). Many studies on tourism have focused on the “spa,” and the majority of high-end hotels have adjusted their services to meet the expectations of travelers (Anaya-Aguilar, Gemar, & Anaya-Aguilar, 2021a; Buxton & Michopoulou, 2021; Dryglas & Salamaga, 2017; Kucukusta & Denizci Guillet, 2014). According to the Global Wellness institute (2021), “wellness tourism, spas and mineral thermal springs: The Global Wellness Economy Looking Beyond COVID-19,” the spa industry experienced significant growth from 2017 to 2019, with an annual growth rate of 8.7% and revenues reaching $111 billion over 165,717 spas, with a notable rise in resort spas. Between 2017 and 2019, the hot springs market experienced remarkable growth within the wellness industry. Revenues in this sector surged from $56 billion to $64 billion, representing an impressive annual growth rate of 6.8%. However, the industry was hit hard by the COVID-19 pandemic in 2020, with revenues falling by −39% with the closure of approximately 4,000-day spas. The report also suggests that the spa industry is expected to recover rapidly, with a projected annual growth rate of 17% through 2025, and forecasted revenue of $150.5 billion. The spa industry in the Asia-Pacific region has witnessed significant expansion and development (Kucukusta & Denizci Guillet, 2014). Seven main categories of spa services are listed by the International Spa Association (ISPA) (2022), including cruise ship spas, club spas, destination spa, say spas, medical spas, resort spa and mineral springs spas (Gustavo, 2010).
This tourism industry has expanded in both volume and value due to the demand for health and wellness products (Chen, Huang, & Ye, 2023). Studies on spa tourism are scarce when compared to medical and health tourism, although wellness travel has gained increasing popularity (Suparna, Yasa, Giantari, Sukaatmadja, & Setini, 2021). The tourist industry has seen notable growth in spa tourism; however, further research is required to establish its scientific basis (Budiawan, AryWidiastini, & Irwansyah, 2020; Tuzunkan, 2018). However, there is still much to learn about the variables and innovations that contribute to successful spa destinations (Hartwell et al., 2016). Given these data, more investigation into the novel idea of spa tourism is necessary. Locations with a focus on yoga, spas, therapies, health, Ayurveda and spiritual contact are in great demand (Karn & Swain, 2017). The development of spa tourism is still in its nascent stages, and the investigation into spa vacations is crucial (Budiawan et al., 2020). Although research on wellness has recognized the value of examining visitor emotions, destination perception, satisfaction and behavioral goals (Chen, Lin, & Petrick, 2013; González & Brea, 2005; Loureiro, Almeida, & Rita, 2013; Rašovská, Kubickova, & Ryglová, 2021). Over the past 30 years, the scholarly literature has given attention to the examination of destination images (Hallmann, Zehrer, & Müller, 2015; Pinos Navarrete & Shaw, 2021) Despite the rising interest in destination image, several researchers acknowledge that most investigations are not adequately grounded in theory. The relationships between the conceptualized pieces were haphazardly attempted to be summarized in an earlier study (Hallmann et al., 2015; Prayag & Ryan, 2012). Studies hypothesized a model of the links between “visitors' emotions, satisfaction, intention to revisit, and recommendation”, but left out the destination image (Lee, Lee, & Lee, 2014; Prayag, Hosany, & Odeh, 2013). Studies have conceptualized the relationships between an image of a destination, satisfaction, intention to return and recommendation, but they do not take visitors' emotions into account (Huang, Weiler, & Assaker, 2015; Prayag, 2009). The intention of visiting again was not included in studies that hypothesized links between visitors' emotions, perceived destination image, recommendation and satisfaction (Prayag, Hosany, Muskat, & Chiappa, 2015). In spa tourism, the intricate linkages between the conceptualized categories have not yet been completely defined. It is expected to investigate a framework examining the role of specific emotions experienced by tourists in predicting their intent to recommend via perceived destination image and tourists' satisfaction with spa tourism. The interrelationships between these components in a single model of spa tourism have not yet been concurrently addressed in tourism literature. This research is intended to address the gap in the tourism marketing literature. The objectives of this article are to: (1) investigate a theoretical model looking at how particular tourist emotions, such as “joy,” “love,” and “positive surprise,” might predict their behavior by looking at how satisfied they are with their whole experience when visiting spas; (2) to determine if the “intention to revisit” is the necessary indicator of behavioral intentions in a model of spa tourism.
The article intends to add to the body of knowledge on spa tourism by exploring the relationships between emotional experiences, destination image, visitor satisfaction and revisit intention. The integrated approach put forth in this study can provide a thorough framework for better comprehending and enhancing the general visitor experience in spa locations. Additionally, it is anticipated that the research’s conclusions would help spa operators, managers and policy makers make wise choices and develop practical plans to raise the competitiveness and attractiveness of spa tourist locations.
2. Theoretical background and hypothesis development
2.1 Spa tourism
India, Singapore, Hong Kong and Malaysia have seen a tremendous increase in tourism to wellness spas (Han, Kiatkawsin, Jung, & Kim, 2018). Body massages and cosmetic procedures are the primary services that spas offer (Smith & Puczkó, 2008). Quality, perceptions of destination prices, brand loyalty and the physical environment for returning to a wellness spa in Thailand (Han, Kiatkawsin, Koo, & Kim, 2020). Bhumiwat and Ashton (2020) have determined that location, sources of information and service costs are all important for encouraging travelers to repurchase spa travel. Polish spa resorts are visiting for treatment, recreation and preventative healthcare, which has highlighted the direction of growth for Poland`s spa resorts (Dryglas, 2020). Wellness spa tourism helps to promote Thailand as a tourist destination by attracting new foreign visitors as well as by encouraging their good post-purchase behaviors (Han, Kiatkawsin, Kim, & Lee, 2017).
In terms of both pain relief and a doctor’s overall assessment, spa therapy has always outperformed medication therapy (Karagülle, Karagülle, Karagülle, Dönmez, & Turan, 2007). The fundamental emotion in the spa context is relaxation, which is more crucial to achieving contentment than pleasure and has little to no direct or meaningful influence on word-of-mouth (Loureiro et al., 2013). Customers prefer branded spa products, full-range spa facilities, high levels of privacy, mid-range pricing and high levels of therapist qualifications, which are proven to be the most crucial factors when making spa reservations (Kucukusta & Denizci Guillet, 2014). Comparing spa customers' preferences for spa services, it was found that there were significant differences between the genders (González, Comesaña, & Brea, 2007). According to Mak, Wong, and Chang (2009), four motivational variables were found after an analysis of spa-goers' motivations in Hong Kong: self-indulgence, escape, relief and relaxation and health. Koh, Yoo, and Boger (2010) examined the social, relaxation, health and rejuvenation as driving forces behind Americans visiting spas. Relevance of the psychological as opposed to the physical parts of wellness spa tourism, as spas and massages typically improve tourists' moods, help them relax and reward with care is part of this tourism (Monteson & Singer, 2016). According to Strack, successful spa operations involve thorough management of finance, successful marketing, original concepts, efficient labor and high-quality services. A study reveals the genuine nature of Andalusian spa customers, their high degree of satisfaction with the business and their strong commitment (Anaya-Aguilar, Gemar, & Anaya-Aguilar, 2021b). The level of enjoyment from interesting and varied spa activities as well as the staff’s capacity to incite pleasant emotions in visitors can all contribute to increased well-being, and this is in addition to the practical advantages of the necessary spa products (Choi, Kim, Lee, & Hickerson, 2015). Male participants at spas in Hong Kong primarily used hotel spas for relaxation, with body massages being the most popular treatment (Tsai, Suh, & Fong, 2012).
Spa visitors are interested to utilize the internet facility to make travel plans and extensively rely on hotel, airline and travel planning and booking services (Joppe, 2010). The pressure on prices has led to some spas being compelled to provide customized services (Pforr & Locher, 2012). Transportation, lodging and cuisine help compensate for the supporting infrastructure that enhances the whole spa experience (Lee & King, 2008). Values and traditions and emotional well-being had a significant impact on spa customers' loyalty (Pan, Beckman et al., 2021). An article by Szromek and Naramski (2019) indicated that location loyalty and spa experience were both significantly correlated with emotional experiences, satisfaction and product performance.
Visitors perceptions of the facility’s value and degree of satisfaction are influenced by the services offered, the setting and environment, the service experience and their own emotions (Sotiriadis, Zyl, & Poole, 2016). Activities connected to wellness spa tourism include baths, acupuncture, body massages, cosmetic procedures and thermal swimming pools (Kazakov & Oyner, 2021). The emotional experience, Product quality and satisfaction were all shown to be strongly correlated with visitors' loyalty to tourism in spas (Chen et al., 2023; Faullant, Matzler, & Mooradian, 2011; Yoon, Sauri, & Rico, 2022). Papadimitriou, Apostolopoulou, and Kaplanidou (2015) recognized that the destination’s personality and emotional image have a significant influence in forming the destination’s overall image.
2.2 The construct on emotional responses of the tourist
As a psychological concept, emotion is measured using recognized scales developed by Watson, Clark, and Tellegen (1988), and titled as “positive affect and negative affect”. Studies in tourism use an emotional measurement scale based on psychology. Despite their widespread applicability, the validity and reliability of such scales recently come under examination by experts (Schoefer & Diamantopoulos, 2008). These are unable to adequately convey the diversity of location features and their behaviors (Lee & Kyle, 2013). Psychology-based scales that are currently in existence produce erroneous results when they are used to gauge emotions in the tourist industry (Cain, Busser, & Baloglu, 2016; Haynes, Richard, & Kubany, 1995). Modern researchers of tourism and marketing have recognized the demand for accurate assessment of the emotional experience of tourists (Voigt, Howat, & Brown, 2010) and conceived and created the “sestination emotion scale”. Empirically and conceptually, the rationalization of emotion in travel is on par with the destination emotion scale (Lee & Kyle, 2013) and determined that “joy, love and positive surprise” are significant attributes of emotions in festive occasions. “Joy, love and positive surprise” are three aspects of emotion that are represented by the fifteen indications found in the destination emotional scale (DES) (Lazarus, 1991) noticed that people experience joy when they believe they are making reasonable progress towards their goals. “Delight, pleasure, enthusiasm, joy and cheerfulness” are among its components.
A person’s emotional relationship to a location is measured by their level of love (Hosany, 2015) affection, tenderness, love and warmth of heart are among its components. Izard (1977) noted the emotion of surprise that results from an unpredicted development. It is combined with other emotions to provoke either a pleasant or unpleasant surprise. “Amazement, astonishment, inspired, surprise and fascinated” are among its adjectives. Interestingly, only positive emotions are represented in the DES’s three emotional aspects (Hosany & Gilbert, 2010). This scale is appropriate for use in wellness tourism, which is differentiated as a collection of hedonic processes that generate pleasant emotions (Aggarwal, Verma, Faridi, & Dayachand, 2008). The majority of wellness travelers are engaged in hedonistic well-being pursuits like yoga and other associated activities (Nolan & Nolan, 1992). This study incorporates the scale developed by Hosany for evaluating visitors' emotional reactions toward spa travel.
2.3 Impact of the emotional response of the travelers on destinations’ image
Destination image is described as “an attitudinal or mental construct representing a sum of ideas, beliefs, or impressions that a tourist holds about a destination” (Crompton, 1979; Parrey et al., 2018; Rather, 2021). The impression of a destination that travelers create throughout their journey is dynamic (Lee, 2014). A meta-analysis identifies the destination image as a powerful proxy for the overall picture (Zhang, Fu, Cai, & Lu, 2014). Chen, Yeh, and Huan (2014) discovered an image of the restaurant as a result of sentimental feelings in a hotel environment. Prayag et al. (2015) confirmed that tourists' feelings have been scientifically proven to be a good indicator of how they would feel about the island as a whole. Positive emotions are known to positively influence one’s overall appearance, both theoretically and experimentally. Therefore, in this investigation, it seems sensible to hypothesize that;
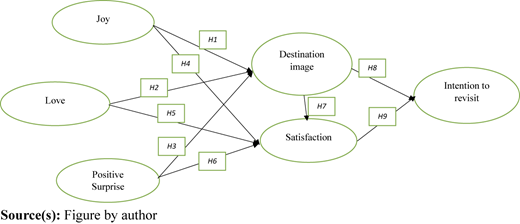
The destination image is impacted by Joy.
The image of the destination is affected by the emotions of love.
Positive surprise influences the image of a location.
2.4 The impact of visitors' emotions on satisfaction
In tourism studies, satisfaction is not clearly defined (Kozak, 2001). According to Huang et al. (2015) emotional reaction derived from customer encounters is satisfaction. As per Vieira (2006) satisfaction is an evaluation of expectations following consumption (Rather, 2018a, 2020). Tourism research (Prayag et al., 2013) and marketing (Ladhari, 2007) have exhibited a strong connection between emotions and satisfaction. Satisfaction is positively impacted and is independent of positive specific emotions, which has been scientifically demonstrated (Machleit & Eroglu, 2000). Prayag et al. (2013) further showed how distinct emotions affect satisfaction in a historical tourist scenario.
Tourists’ satisfaction is influenced by the emotion of Joy.
Love significantly impacts the satisfaction of the tourist.
Tourists’ satisfaction was positively impacted by the positive surprise of emotion.
2.5 The impact of the destinations` image on tourism satisfaction
Studies in tourism have showcased a strong impact of destination image on satisfaction (Chi & Qu, 2008). Previous research indicates that a key element in determining satisfaction is the overall destination image (O’Leary & Deegan, 2005; Wang & Hsu, 2010). Studies by Wang have identified a strong connection between satisfaction and image (Rather, 2018b). A significant indirect correlation exists between the image of the location and satisfaction (Assaker & Hallak, 2013). In light of the foregoing explanation, the following assumption may be drawn:
Satisfaction is influenced by the overall destination image.
2.6 The impact of the image of the destination on behavioral intention
Tourism studies have gained significant recognition to examine the influential level of destination image on tourists' behavior (Castro, Martı, & Martı, 2007). In the tourist industry, a intent to visit again and the intention to suggest are the two most common behavioral intents or loyalty indicators (Qu, Hyunjung, & Hyunjung, 2011). Yang, Yuan, and Hu (2009) revealed that behavior intentions are directly impacted by destination image. But, Lee (2009) discovered inverse connections between behavioral intentions and destination image. The intent to revisit is positively impacted by the overall image of the place (Prayag et al., 2015). Destination images influence behavioral intentions both directly and indirectly (Ã & Tsai, 2007). As a result, it seems sensible to make hypotheses on the linkages that:
The revisit intention is influenced by destination`s image.
2.7 Satisfaction’s impact on behavioral intentions
Satisfied visitors are more inclined to recommend that place to others (Ã & Tsai, 2007). Prayag and Ryan (2012) discovered that travelers' positive behavioral intentions are influenced by satisfying emotional experiences. The single notion of intention to revisit cannot fully capture the multidimensional nature of behavioral intention (Cain et al., 2016; Chi & Qu, 2008). Previous research has empirically proved this relationship (the “intention to revisit”) (Qu et al., 2011; Rather, 2021; Rather & Hollebeek, 2019) A direct correlation was discovered between satisfaction and the intention to revisit (Prayag et al., 2015). Therefore, it seems sensible to propose the idea that:
Satisfaction of the tourists’ significantly impacts revisit intention. (See Figure 1)
3. Methods
3.1 Study area and setting
Alleppey, also known as Alappuzha, is a coastal town in the Indian state of Kerala. Located on the Arabian Sea, it is known for its beautiful backwaters, palm-lined canals and serene beaches. It is often referred to as the “Venice of the East” due to its extensive network of waterways that meander through the town. One of the main attractions of Alleppey is the backwaters. The backwaters are a network of interconnected canals, lagoons and lakes that stretch over 900 kilometers in Kerala. Alleppey is also known for its spa tourism, which offers visitors a chance to rejuvenate and relax amidst the serene surroundings of the town. Many resorts and hotels in Alleppey offer spa treatments that incorporate traditional Ayurvedic therapies, including massages, steam baths and herbal treatments. The natural beauty of the town, combined with the healing properties of Ayurvedic therapies, make Alleppey an ideal destination for those seeking to unwind and recharge. Some of the popular spa treatments in Alleppey include Abhyangam, a full-body massage using warm herbal oils, Shirodhara, a therapy that involves pouring warm oil on the forehead and Pizhichil, a massage that involves pouring warm medicated oil over the body. These therapies are believed to promote relaxation, reduce stress and improve overall health and well-being.
The data was collected from the domestic tourist who visits Alleppey. According to Kerala Tourism Department, in 2022, Alleppey recorded a total of 2,62,165 domestic tourists and 11,547 foreign tourists. The researcher targeted to have a sample size of 385 domestic tourists. Following (Krejcie & Morgan, 1996), the sample size was determined. Assuming a 10% rate of unusable data and a 50% response rate, a population of 963 tourists was approached, calculated by dividing 385 by 0.4 (Chi & Qu, 2008). The researcher has used the “structural equation modeling” technique to analyze the primary data and to develop a model. To utilize this method, this approach needs a minimum sample size of 300. Thus, even though 385 responders and 963 tourists were reached for this study’s minimum sample size of 300. As a result, structured instruments (questionnaires) were circulated to visitors in the same way that (Chen et al., 2013) adopted in their research. The utilization of a nonprobability (purposive) sampling method in this study effectively ensured a well-balanced representation of respondents, but the conclusions may only apply to similar locations, limiting their applicability to a broader audience. To distribute the questionnaire, three helpers were hired. The author meticulously watched and oversaw the whole data-collecting procedure.
3.2 Measurement scale and development of questionnaire
Six parts of a single questionnaire were created. The questionnaire made an effort to use a multiple-item scale to assess the conceptualized elements of a theoretical model. Table 1 shows the literature source and measurement scales of the study. The first part of the study was to assess tourists' emotional reactions while they were in Alleppey. The scale developed by Hosany was used to assess the emotions in this study. The scale consists of fifteen measurements that represent emotion`s components (“joy, love, and positive surprise”). The construct (“delight, enthusiasm, joy, pleasure and cheerful”) were used to quantify the emotion of joy. The indications of love (such as “warm-hearted, affection, caring, love and tenderness”) were used to evaluate it. The five characteristics “fascinated, surprised, inspired, astonishment and amazement” were used to determine positive surprise. Using a four-item Likert scale, Alleppey’s destination image was evaluated (Stylidis, Shani, & Belhassen, 2017). Using a five-item questionnaire, travelers' satisfaction with the travel is also assessed. This is in line with the findings of Lee, Lee, Lee, and Babin (2008). The 4 item scale developed by Pike and Ryan (2004) adapted for intention to revisit. Attributes (including “age, occupation, gender, marital status, income and education”) are used to capture the sociodemographic profile of the sample.
Literature source and measurement scales
| Joy (5 items) | Enthusiasm | Hosany (2015), Hosany and Gilbert (2010), Prayag et al. (2013, 2015) |
| Delight | ||
| Cheerful | ||
| Pleasure | ||
| Joy | ||
| Love (5 Items) | Caring | Hosany (2015), Hosany and Gilbert (2010), Prayag et al. (2013, 2015) |
| Warm-hearted | ||
| Tenderness | ||
| Love | ||
| Affection | ||
| Positive surprise (5 Items) | Amazement | Hosany (2015), Hosany and Gilbert (2010), Prayag et al. (2013, 2015) |
| Astonishment | ||
| Surprise | ||
| Inspiration | ||
| Fascinated | ||
| Perceived destination image (4 Items) | Scenery and natural attractions of the Place | Prayag and Ryan (2012), Yang et al. (2009), Prayag et al. (2013), Wang and Hsu (2010) |
| Climate and weather of the Place | ||
| Unpolluted and unspoiled environment | ||
| Exciting and interesting place to visit | ||
| Tourist satisfaction (5 Items) | I truly enjoyed visiting this place | Prayag and Ryan (2012), Yang et al. (2009), Prayag et al. (2013), Wang and Hsu (2010) |
| Visiting this beach has met my needs | ||
| This tour has exceeded my expectations | ||
| I am satisfied considering the money and time I spent here | ||
| Overall, I am fully satisfied with this tour | ||
| Intention to revisit (4 Items) | I have an intention to revisit the place | Prayag et al. (2015), Prayag and Ryan (2012), Prayag (2009) |
| I am willing to spend time and money to revisit the place | ||
| I am willing to revisit this place | ||
| I will make an effort to revisit the place |
Source(s): Table by author
The initial development of the survey instrument involved creating it in English, followed by a translation into Tamil, Malayalam, Kannada and Telugu with the assistance of a language editor and a professional translator. Except for a few minor grammatical issues, the participants did not recommend any significant changes to the questionnaire. The questionnaire was modified by considering the comments on clarity, significant missing elements and appropriateness suggested by the experts. The questionnaire underwent a pilot test among 45 visitors of Alleppey to examine the clarity and relevance. To accomplish this, Cronbach’s alpha coefficient values were computed (Liébana-Cabanillas, Marinkovic, Ramos de Luna, & Kalinic, 2018). It is considered that the statements used to measure a specific variable exhibit internal consistency If the value surpasses the threshold of 0.7 (Pham & Ho, 2015). After making a slight change and considering the outcomes of the aforementioned tests, the questionnaire’s final form was developed.
3.3 Data analysis
The initial data preparation was carried out to assess the sample data for analysis and descriptive statistics were performed after screening the data. Confirmatory factor analysis was conducted to evaluate the model`s validity and reliability (Vieira, 2006). According to Bollen (1989), the criteria for evaluating the fit indices were as follows: χ2/df between 1 and 3, Goodness-of-Fit statistic (GFI) and Comparative fit index (CFI) above 0.90 and Root Mean Square Error of Approximation (RMSEA) below 0.08. Subsequently, by using Confirmatory factor analysis (CFA) and SEM, the properties of the conceptual model were examined. Finally, path coefficients were analyzed. The author has used statistical package for social science (SPSS) version 21 and Analysis of Moment Structures (AMOS) to perform this entire process.
4. Results and discussion
4.1 Respondent`s profile
A sample of 345 individuals who traveled to Alleppey as domestic tourists participated in the research study is illustrated in Table 2. Among the total sample, 53.33% were males and 46.67% were females. The largest portion of the tourists (65.22%) was married, while the remaining 34.78% were single. Regarding age, the sample included tourists from various age categories, with the largest percentage in the 45–54 age range (24.06%), followed by the 35–44 age range (19.71%) and those aged 65 years and above (19.42%). Regarding education, most of the tourists (56.13%) had finished their education up to the 12th class, while 45.22% had completed graduation or higher. Regarding their employment status, more than half of the tourists (53.63%) in the sample were either employed full-time or were self-employed. Additionally, 60% of the tourists were repeated visitors to Alleppey specifically for spa tourism.
Sample profile of the tourist visiting Alleppey for spa tourism
| Demographic | Classification | Proportion (sample, n = 345) | |
|---|---|---|---|
| Number | Percentage | ||
| Gender | Male | 184 | 53.33 |
| Female | 161 | 46.67 | |
| Marital status | Single | 120 | 34.78 |
| Married | 225 | 65.22 | |
| others | 0 | 0.00 | |
| Age | 18–24 | 31 | 8.99 |
| 25–34 | 42 | 12.17 | |
| 35–44 | 68 | 19.71 | |
| 45–54 | 83 | 24.06 | |
| 55–64 | 54 | 15.65 | |
| 65 and Above | 67 | 19.42 | |
| Level of education | Up to 10th Class | 68 | 19.71 |
| 12th Class | 121 | 35.07 | |
| Graduate | 83 | 24.06 | |
| Post Graduate & Above | 73 | 21.16 | |
| Occupation | Full-time employee | 98 | 28.41 |
| Part-time employee | 59 | 17.10 | |
| Self employed | 87 | 25.22 | |
| Retired | 38 | 11.01 | |
| Students | 51 | 14.78 | |
| Unemployed | 12 | 3.48 | |
| Others | 0 | 0.00 | |
| Income (Indian rupees) | Less than 1Lakh | 58 | 16.81 |
| 1–2.99999 Lakh | 119 | 34.49 | |
| 3–4.99999 Lakh | 78 | 22.61 | |
| 5–9.99999 Lakh | 51 | 14.78 | |
| 10 Lakh and above | 39 | 11.30 | |
| Visit | First time | 138 | 40.00 |
| Repeat | 207 | 60.00 | |
Note(s): n = sample size, % = percentage of sample
Source(s): Table by author
4.2 Descriptive statistics
The descriptive statistics Table 3 provide insight into the responses of tourists visiting Alleppey for spa tourism. The mean score for joy is 4.1, indicating that tourists have experienced a high level of joy during their visit. Similarly, the mean score for love is 3.89, indicating that tourists have felt a moderate level of love during their visit. The mean score for positive surprise is 3.96, indicating that tourists have experienced a moderate level of positive surprise during their visit. The mean score for perceived destination image is 4.27, demonstrating that travelers have a favorable opinion of the image of the destination. The mean score for visitor satisfaction is 4.05, expressing that they are satisfied with Alleppey`s spa tourism. The mean score for intention to revisit is 4.1, this suggests that tourists have a moderate level of willingness to visit the place again. From this table, it is inferred that travelers visiting Alleppey for spa tourism have had a positive experience overall, with high levels of joy and a positive image of the destination. However, there is a possibility for improvement in terms of providing a more consistent positive surprise experience for tourists.
Descriptive statistics of the responses of tourists visiting Alleppey for Spa tourism
| Items | Mean (n = 345) | Standard deviation | Cronbach ‘α | |
|---|---|---|---|---|
| Joy | 4.1 | 1.23 | 0.91 | |
| Enthusiasm | 3.98 | 1.27 | ||
| Delight | 4.1 | 1.45 | ||
| Cheerful | 4.23 | 1.12 | ||
| Pleasure | 4.34 | 0.89 | ||
| Joy | 3.85 | 1.42 | ||
| Love | 3.89 | 1.41 | 0.87 | |
| Caring | 4.41 | 1.34 | ||
| warm-hearted | 3.65 | 1.67 | ||
| Tenderness | 3.43 | 1.42 | ||
| Love | 3.86 | 0.85 | ||
| Affection | 4.12 | 1.78 | ||
| Positive surprise | 3.96 | 1.51 | 0.79 | |
| Amazement | 3.21 | 1.43 | ||
| Astonishment | 3.81 | 1.87 | ||
| Surprise | 4.34 | 1.38 | ||
| Inspiration | 4.12 | 1.52 | ||
| Fascinated | 4.32 | 1.39 | ||
| Overall destination image | 4.27 | 1.3 | 0.87 | |
| Scenery and natural attractions of the Place | 4.32 | 1.45 | ||
| Climate and weather of the Place | 3.92 | 0.87 | ||
| Unpolluted and unspoiled environment | 4.31 | 1.29 | ||
| Exciting and interesting place to visit | 4.56 | 1.61 | ||
| Tourist satisfaction | 4.05 | 1.53 | 0.89 | |
| I truly enjoyed visiting this place | 3.87 | 1.61 | ||
| Visiting this place has met my needs | 4.23 | 1.57 | ||
| This tour has exceeded my expectations | 3.73 | 1.31 | ||
| I am satisfied considering the money and time I spent here | 4.34 | 1.16 | ||
| Overall, I am fully satisfied with this tour | 4.12 | 1.51 | ||
| Intention to revisit | 4.1 | 1.48 | 0.85 | |
| I have an intention to revisit the place | 4.46 | 1.45 | ||
| I am willing to revisit this place | 4.42 | 1.38 | ||
| I will make an effort to revisit the place | 3.65 | 1.43 | ||
| I am willing to spend time and money to revisit the place | 3.87 | 1.67 | ||
Note(s): n = sample size; α = alpha
Source(s): Table by author
4.3 Measurement model
The model (as shown in Table 4) displayed a satisfactory fit, as evidenced by the indices (χ2 = 385.33, df = 189), indicating an overall fit between the observed data and the theoretical model. The model fit indices were higher than the required minimum of 0.90, with CFI = 0.99 and GFI = 0.96, indicating an appropriate fit (Fidell, Tabachnick, Mestre, & Fidell, 2013). Furthermore, the indices 2/df = 2.039 and RMSEA = 0.067, which further demonstrate the applicability of the measurement model, fulfilled the range of 1 to 3 for χ2/df and corresponding cut-off conditions of 0.08 for RMSEA. It is important to highlight that all the indices achieved statistical significance with a p-value of less than (p < 0.001).
Measurement model
| Constructs | Standard loadings | t-value | Composite reliability | AVE | |
|---|---|---|---|---|---|
| Joy | 0.82 | 0.61 | |||
| Enthusiasm | 0.7 | 13.26* | |||
| Delight | 0.78 | 14.23* | |||
| Cheerful | 0.71 | 13.98 | |||
| Pleasure | 0.69 | 14.898 | |||
| Joy | 0.84 | 13.11* | |||
| Love | 0.88 | 0.67 | |||
| Caring | 0.72 | 17.89* | |||
| Warm-hearted | 0.63 | 15.23* | |||
| Tenderness | 0.83 | 16.41* | |||
| Love | 0.78 | 14.41* | |||
| Affection | 0.84 | 13.61* | |||
| Positive surprise | 0.91 | 0.72 | |||
| Amazement | 0.76 | 17.98* | |||
| Astonishment | 0.8 | 16.81* | |||
| Surprise | 0.71 | 18.81* | |||
| Inspiration | 0.69 | 15.71* | |||
| Fascinated | 0.76 | 14.12* | |||
| Overall destination image | 0.86 | 0.71 | |||
| Scenery and natural attractions of the Place | 0.79 | 13.87* | |||
| Climate and weather of the Place | 0.81 | 16.73* | |||
| Unpolluted and unspoiled environment | 0.75 | 14.89* | |||
| Exciting and interesting place to visit | 0.81 | 16.74* | |||
| Tourist satisfaction | 0.81 | 0.74 | |||
| I truly enjoyed visiting this place | 0.83 | 15.78* | |||
| Visiting this place has met my needs | 0.82 | 16.83* | |||
| This tour has exceeded my expectations | 0.79 | 14.45* | |||
| I am satisfied considering the money and time I spent here | 0.81 | 16.87* | |||
| Overall, I am fully satisfied with this tour | 0.82 | 17.56* | |||
| Intention to revisit | 0.79 | 0.72 | |||
| I have an intention to revisit the place | 0.83 | 15.74* | |||
| I am willing to revisit this place | 0.84 | 14.67* | |||
| I will make an effort to revisit the place | 0.79 | 13.56* | |||
| I am willing to spend time and money to revisit the place | 0.82 | 14.89* | |||
Note(s): AVE = average variance extracted; *p < 0.001; **p < 0.01
Source(s): Table by author
Pearson’s correlation technique was employed to examine the correlations between different constructs in this study. The inter-construct correlation matrix in Table 5 displays the correlation coefficients between the constructs assessed in the research. Each construct is denoted by a number ranging from 1 to 7. The diagonal of the matrix exhibits the correlations between each construct and itself, which is always 1. The cells outside the main diagonal depict the correlations between the construct`s pairs. As an illustration, love and positive surprise correlate by 0.42, whereas Love and Joy have an association of 0.41. The significance level of the correlation coefficients is indicated by asterisks. Correlations with *p < 0.001 are considered highly significant, while those with **p < 0.01 are moderately significant. Destination image and tourist satisfaction show a substantial positive correlation of 0.69, indicating a strong positive association between both categories. Similarly, the correlation of 0.72 suggests that tourists are more intent to visit the destination again.
Inter-constructs correlation matrix
| Construct | M | SD | 1 | 2 | 3 | 4 | 5 | 6 | |
|---|---|---|---|---|---|---|---|---|---|
| 1 | Joy | 4.1 | 1.23 | 0.61 | |||||
| 2 | Love | 3.89 | 1.41 | 0.41* | 0.67 | ||||
| 3 | Positive surprise | 3.96 | 1.51 | 0.35* | 0.42* | 0.72 | |||
| 4 | Overall destination image | 4.27 | 1.3 | 0.31* | 0.27* | 0.39* | 0.71 | ||
| 5 | Tourist satisfaction | 4.05 | 1.53 | 0.23* | 0.35* | 0.46* | 0.69* | 0.74 | |
| 6 | Intention to revisit | 4.1 | 1.48 | 0.42* | 0.36* | 0.51* | 0.39* | 0.33* | 0.54* |
Note(s): *p < 0.001; **p < 0.01; M = mean; SD = standard deviation; a = average variance extracted; b = inter-constructs correlation
Source(s): Table by author
4.4 Structural model
Maximum likelihood and SEM were applied to evaluate the structural characteristics of the model. The connections between the constructions were created using models and theories from earlier studies. The proposed conceptual model was evaluated utilizing several indices, including “2/df, CFI, GFI and RMSEA.” Test indices showed an acceptable fit (2 = 437.85, df = 149). The fit indices were greater than the cutoff of 0.90 (CFI = 0.90 and GFI = 0.93) (Byrne, 2001). Additionally, these (2/df = 2.97 and RMSEA = 0.071) further demonstrate the structural model’s suitability with the cut-off limits (RMSEA: 0.081 and 1/3 for 2/df, respectively) (Turner & Reisinger, 2001). The statistical significance level for each of the indices was determined to be (p < 0.001).
4.5 Path coefficients analysis
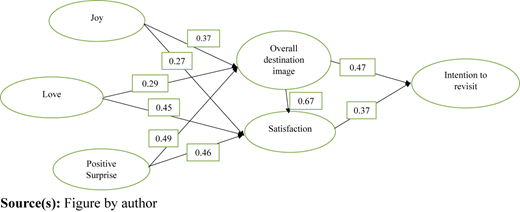
The graphical representation of the path diagram confirms the relationships outlined in hypotheses 1, 2, and 3. The corresponding beta (β) coefficients were found to be 0.37, 0.27, and 0.49, respectively. Concerning the overall destination image, these pathways account for 32.21% of the variability (R2 = 0.3212). The paths corresponding to hypotheses 4, 5, and 6 were similarly supported, showing beta (β) coefficients of 0.27, 0.45 and 0.46, respectively. Additionally, the path connected to hypothesis 7 was confirmed, showing a beta (β) value of 0.67, which explained 46.81% of the variation in satisfaction (R2 = 0.4771). Figure 2 also demonstrates that hypothesis 8 was accurate, with beta values of 0.47. Additionally, values 0.37 for the paths corresponding to hypothesis 9 were also supported. For the intention to revisit (R2 = 0.306), these paths account for 26.11% of the variability. Significantly, all nine paths exhibited statistical significance in the anticipated directions.
4.6 Hypothesis testing
The hypothesized model suggests that there are significant relationships between the constructs being studied is depicted in Table 6. All the hypotheses are supported, as denoted by the significant coefficients (β) and t-values. This study supported H1, H2, and H3 by demonstrating that “emotions of joy, love, and positive surprise” have a considerable influence on the image of the destination. The findings of this study conflict with those of the publication by Prayag et al. (2015) whereby pleasant surprise and overall image did not appear to be significantly correlated. The findings that the pleasant “emotions of Joy, love, and positive surprise” have a substantial effect on satisfaction support hypotheses H4, H5, and H6. These findings provide additional support for investigations by Faullant et al. (2011) but contrast with the research by Prayag et al. (2015). H7 is supported by the finding that there is a substantial correlation between satisfaction and overall image. Wang similarly discovered a comparable outcome in their different study settings. The association between satisfaction and the overall image was determined to be the one with the greatest correlation among all of the factors under investigation. This study supports H8 by showing a strong association between the destination`s image and the intention to revisit. It corroborates the findings of Bigné, Andreu, and Gnoth (2005). Finally, while validating hypothesis H9, the findings reveal a substantial correlation between satisfaction and behavioral intention (“Intention to revisit”). These connections were also supported by earlier investigations (Chi & Qu, 2008). The research suggests that a higher degree of satisfaction would encourage visitors to revisit the destination once again.
Result of hypothesized model
| Hypothesis | Beta (β) | t-value | Hypothesis remarks | |
|---|---|---|---|---|
| H1: Joy | Overall destination image | 0.37* | 6.96 | Supported |
| H2: Love | overall destination image | 0.29* | 6.41 | Supported |
| H3: Positive surprise | Overall destination image | 0.49* | 5.37 | Supported |
| H4: Joy | Satisfaction | 0.27* | 7.21 | Supported |
| H5: Love | Satisfaction | 0.45* | 9.97 | Supported |
| H6: Positive surprise | Satisfaction | 0.46* | 11.15 | Supported |
| H7: Overall destination image | Satisfaction | 0.67* | 10.37 | Supported |
| H8: Overall Destination image | Intention to revisit | 0.47* | 8.63 | Supported |
| H9: Satisfaction | Intention to revisit | 0.37* | 5.22 | Supported |
Note(s): = path, *p < 0.001; **p < 0.01
Source(s): Table by author
5. Conclusion and implications
5.1 Academic implications
This study will aid scholars in comprehending how specific emotions (such as “joy,” “love,” and “positive surprise”), coupled with the destination`s image and satisfaction, affect visitors' behavior toward wellness spa tourism. Understanding the emotional responses visiting wellness (spa) tourism is important because of the unique kind of emotional responses elicited by tourists visiting such a destination. The study clarified the notion of how emotions are formed in tourism studies and showed that the emotions of visitors have several dimensions. Numerous research publications recognize the multidimensional character of emotion, but only a few studies have developed a theoretical model with specific emotions. This study filled this gap in the tourism literature by adding “specific emotions” to comprehend visitors' behavior in wellness spa tourism. “Joy, love and positive surprises” are the aspects of travelers' emotions. Among all the dimensions, joy scored the highest mean score. The second factor was a positive surprise, and love got the lowest average rating. According to the data, travelers who chose Alleppey as a spa vacation location rated the city to be more cheerful, delightful and pleasurable than amazing, caring and fascinating. This research demonstrates the distinctiveness of wellness tourism within the travel and tourism sector. This study makes a methodological addition by addressing the problems with measuring visitors' emotions and outlining the advantages of evaluating certain emotions in wellness tourism. According to the study’s findings, satisfaction and overall image are affected differently by love, joy and positive surprise. Researchers studying tourism should use caution when reducing emotions to categorical contrasts (positive vs negative). Only spa tourism has a high incidence of happy emotional experiences, which is a significant finding that can be drawn from the findings. This research demonstrates the distinctiveness of wellness tourism within the travel and tourism sector.
5.2 Managerial implications
This research offers vital information for developing, planning and putting into practice tourism policies in the spa tourism sector. It is advised that marketers and organizations with specialized knowledge (such as “tour operators, travel agencies, hotel chains and local governments”) foster particular positive emotions (i.e. “joy, love and positive surprise”) as they directly contribute to the enhancement and creation of a consistent and thorough image about the place (Qu et al., 2011). Strong evidence is shown in this study to support the idea that behavioral intentions are directly influenced by satisfaction. Managers of tourist destinations should be aware of how essential satisfaction is in motivating visitors' behavioral intentions. Advertisements in tourist destinations should place a strong emphasis on evoking and provoking emotions that aim to stimulate and encourage positive emotions. To evoke the emotional appeal of visitors, destinations all over the world have been employing music, visual effects and photography in their advertising campaigns. Particularly, tourist providers have to make an effort to provoke and advance joyful and loving emotions through advertising appeals. The objective of marketers and neighborhood businesses should be to provide on-site experiences that please visitors and beyond their expectations. On a larger scale, emotions connected to the destination experience at a spa location encourage satisfaction, positive word of mouth and intentions to revisit. Marketing strategies should place equal emphasis on generated emotions and distinctive qualities of a destination. The emotional aspects of their products are being emphasized by tourism locations all around the world. Campaigns like “simply inspiring” from Germany, “surprising cities” from the Netherlands and “fascinating” from Malaysia are excellent examples. Many tourist locations have used photography, visual effects and music with effectiveness in their marketing efforts to evoke an emotional response.
Multiple strategies may be employed by destination marketers to foster a satisfying emotional experience while visiting the location. Marketers may set up a romantic location where visitors can take in the scenery and indulge in spa services. Visitors may be given the chance to take part in some of the games planned for them in the location. Similar to this, they could be set up in a tranquil area of the main attraction where visitors enjoy pausing for brief relaxation following their regular spa treatments. Marketers could create “surprising,” “unexpected” and “spurring” activities for tourists. Additionally, this ought to surprise visitors to the area. However, destination marketers must consistently innovate if they want to surprise visitors. For example, (1) In Alleppey, a destination for wellness tourism, visitors may get the chance to learn about how locals support their way of life; (2) Tourists may be allowed to speak with spa trainers to comprehend spas and their wellness advantages; (3) For the entertainment of visitors, a spa camp may be set up at any time. Spa and resort managers may easily surpass visitors' expectations if they have a thorough understanding of what they anticipate from wellness tourism and what they need from their accommodations. However, failing to accurately analyze guests' needs might negatively impact their whole experience.
5.3 Limitations and directions for future research
The findings should be viewed carefully for their limitations while also suggesting a potential course for future tourism marketing study. To begin with, the conceptualized model was only considered in light of a single wellness spa tourism location. This restricts how far the findings may be applied. Research in the future may study the correlations in different locations with various tourism contexts. This study was conducted under a specific time frame and environmental conditions. To determine how time affects the model, future studies may investigate the suggested model using a longitudinal method. This article focuses on domestic travelers who travel to Alleppey, so the conclusions may not be relevant to research utilizing foreign tourists. The presented model may be investigated further utilizing information from foreign tourists. Additionally, utilizing the suggested approach, a comparison between domestic and foreign visitors may be done. Future research should use an attribute-level measurement scale to assess visitor satisfaction (Vieira, 2006). Only domestic visitors are taken into account in this study’s sample. This is because there are far fewer foreign tourists visiting Alleppey than there are domestic tourists. Future research would be worthwhile if it could duplicate the results on overseas tourists, so that more information on the subject may be incorporated into theory and practice, adding to the scholarly discussion on spa tourism and offering practical advice to destination marketers, decision-makers, and tourists organizations working to enhance spa tourism in Alleppey. Finally, Future studies should investigate the potential emotional antecedents of tourism, since these factors may improve comprehension of these notions when tested to the aforementioned conceptualized ideas. Future studies should be done on how technology is used to promote the destination spa resorts in Alleppey. Additionally, organized spa and resort professionals are needed to focus on wellness tourism as a niche industry to change how the majority of international tourists view India – who just see it as a passable spa destination – and turn it into a preferred wellness tourism destination.

