Skip to article sections
Purpose

This paper aims to present the development and validation of a set of five psychometric scales designed to measure how mentors navigate the emotional dimensions of their role in relation to the Mentoring as Emotional Labour (MEL) framework (Relihan and O'Donovan, 2024). It situates this work within the Australian initial teacher education (ITE) mentoring landscape, highlighting limitations in current approaches and addressing a significant gap in the field: the lack of tools that systematically capture the emotional complexity of mentoring.

Design/methodology/approach

The paper details the empirical development of the MEL scales, including item construction and data collection and analysis using Rasch modelling on a sample of mentors (N = 240). Five scales were developed to measure each aspect of the MEL framework and validated using Rasch analysis: an overarching MEL-15 scale, providing an integrated snapshot of mentors’ capacity to navigate EL, and one scale for each of the MEL framework quadrants (self, context, tasks and others), each providing targeted assessment of distinct areas of mentoring practice and developed as independent, Rasch-fit, unidimensional measures.

Findings

All five scales satisfied Rasch measurement requirements, demonstrating strong validity, reliability and targeting (person separation index >0.80; non-significant chi-square). This confirms that all retained items define a single coherent construct within each scale, enabling meaningful interpretation of mentor capacity across the MEL framework. The overarching MEL-15 scale comprises 15 items that provide a concise snapshot of how mentors navigate the EL of mentoring, while 4 12-item aspect scales capture distinct areas of mentoring practice. All scales and scoring tables are provided for those wishing to utilise them in their practice or research.

Originality/value

This study introduces the first Rasch-validated set of scales designed to measure mentors’ capacity to navigate the EL involved in mentoring within ITE. It contributes a theoretically grounded and empirically validated tool to support mentor development in ITE.

Initial teacher education (ITE) operates within an increasingly scrutinised and competitive landscape (Simpson et al., 2022; Stacey et al., 2020), shaped by growing pressures of standardisation and accountability (Hobson and Maxwell, 2020; Menter, 2018). Mentors in ITE encounter heightened pressure to perform, with a greater emphasis on assessing preservice teachers' (PST) effectiveness and the anticipated positive impact this could have on student outcomes (Hobson and Maxwell, 2020; Orland-Barak and Wang, 2021). In Australia, federal policy in the ITE sector has typically highlighted the importance of assessments, outcomes, and quality teaching, often at the expense of overlooking the human aspects of supporting PSTs in schools (Stacey et al., 2020; Simpson et al., 2022). This has shaped how ITE providers and schools interact, prioritising placement logistics and compliance rather than the complex human process of mentoring (Gillett-Swan and Grant-Smith, 2020). As a result, simplistic checklist approaches are frequently adopted in place of recognising the relational and emotional demands mentors need to navigate (Ambrosetti et al., 2014; Menter, 2018). Instead, the emotional dimension of mentoring remains implied, assumed, or overlooked, becoming lost amid bureaucratic exchanges and shifting policy landscapes (Goodwin et al., 2021; Hobson and Maxwell, 2020).

This paper aims to explore the emotional elements of mentoring in greater detail by drawing on constructs such as emotional labour (EL) in an attempt to better define this space. EL, the management and regulation of feelings to meet occupational expectations (Hochschild, 1983), has been widely examined in education, nursing, and service professions (Delgado et al., 2017; Kariou et al., 2021; Philipp and Schüpbach, 2010). However, its application to the mentoring of PSTs remains under-theorised and under-measured. While existing research highlights how mentors frequently navigate tensions and frustrations in their support roles (Schatz Oppenheimer and Goldenberg, 2024; Relihan and O'Donovan, 2024), few tools capture this emotional dimension of mentoring. Existing tools often focus on mentee outcomes, instructional guidance, or technical competencies, but rarely on the emotional demands placed on mentors themselves (Aspfors and Fransson, 2015). Even when EL is acknowledged in mentoring, it is frequently treated as a secondary concern, a “soft” skill, or a by-product of effective relational work. This marginalisation mirrors broader critiques of how EL is undervalued in feminised professions like teaching (O'Connor, 2008; Zembylas, 2005).

In response to these gaps, this study draws on the Mentoring as Emotional Labour (MEL) framework (Relihan and O'Donovan, 2024) to examine whether mentoring EL can be measured empirically. Using the MEL framework, five scales were designed and tested: an overarching MEL-15 scale and four aspect scales representing Self, Context, Tasks, and Others to capture how mentors navigate the emotional demands of their role.

Accordingly, this study aims to.

  1. Conceptualise mentoring as a form of EL and operationalise it through the MEL framework;

  2. Develop and validate five independent MEL scales using Rasch analysis;

  3. Evaluate the psychometric properties of these scales, including reliability, validity, and the internal coherence of each unidimensional scale.

  4. Explore their implications for research and mentor development, identifying limitations and directions for future work.

Despite, or perhaps because of, the complex and often conflicting pressures of policy and performativity in ITE, there has been a welcome shift in recent years towards more holistic approaches to mentoring (Goodwin et al., 2021; Le Cornu, 2013). Numerous conceptual models have emerged that aim to capture the multifaceted nature of mentoring (e.g. Ambrosetti et al., 2014; Garza et al., 2019; Goodwin et al., 2021; Loosveld et al., 2021; Orland-Barak and Wang, 2021). While these frameworks offer valuable insights, many remain abstract or are drawn from small-scale, context-specific studies, limiting broader applicability and transferability (Chen et al., 2016; Hobson et al., 2009).

In an Australian context, Ambrosetti et al.'s (2014) Holistic Mentoring framework places the mentor–PST relationship at its centre, with an emphasis on trust, support, and mutual engagement. However, while the model effectively highlights conditions for PST growth, it offers limited consideration of mentor development or the emotional implications of sustaining such relationships. Similarly, recent frameworks such as Garza's (2019) Mentoring Framework for Mentoring and Orland-Barak and Wang's (2021) Integrated Mentoring Approach advocate for mentors to adopt critical and reflective practices but offer little guidance on how mentors are supported emotionally in practice.

As the formalisation of mentoring grows, several studies have attempted to empirically measure mentoring constructs (e.g. Fleming et al., 2013; Crawford et al., 2014; Hairon et al., 2020; Koc, 2011; Nuis et al., 2024). The Online Graduate Mentoring Scale (Crawford et al., 2014) and the Mentoring Competency Assessment (Fleming et al., 2013) both include emotional aspects of mentoring and have demonstrated sound psychometric properties. However, these tools are grounded in postgraduate or research mentoring contexts and are not directly transferable to the school-based ITE space. While they offer useful insights, these frameworks reflect mentoring environments with different institutional and emotional conditions than those experienced by school-based mentors working with pre-service teachers in classroom settings.

School-based mentoring tools such as Hudson et al.’s (2005) Five Factor Model and Koc's (2011) Mentor Teacher Inventory foreground important dimensions of mentor behaviour and effectiveness. Yet, both rely on PST perceptions, which may unintentionally sideline the mentor's own experience and EL. Clarke et al.’s (2012), Clarke and Mena (2020) Mentoring Profile Inventory offers a more mentor-oriented perspective, supporting real-time reflection and professional growth. However, it is not explicitly designed to examine the emotional aspects of mentoring or theorise EL. Likewise, Tickell and Klassen's (2024) Teacher Mentoring Self-Efficacy Scale is notable for its attention to interpersonal and intrapersonal dimensions of mentoring, with a particular focus on early career teachers. While valuable, this tool is grounded in classical test theory (CTT), which, although useful for scale development, contrasts with the Rasch model used in this study. Rasch analysis offers more robust diagnostic capabilities, particularly in detecting item fit, unidimensionality, and ensuring linear measurement invariance (Wright and Masters, 1982).

In summary, while existing models and tools have advanced understanding of mentoring, most focus on mentee development or system efficiencies, giving limited attention to the EL mentors enact. Few frameworks explore or measure the emotionality of mentoring pre-service teachers, particularly during placement. Where measurement tools exist, they are often conceptual, based on small qualitative samples, or rely on CTT approaches, which, while widely used, have recognised limitations in scale precision and diagnostic depth. Rasch modelling offers a complementary alternative, enabling more rigorous validation and supporting the development of psychometrically sound tools for capturing complex constructs like EL. This points to the need for purpose-built measures that position EL as central to sustaining meaningful ITE mentoring.

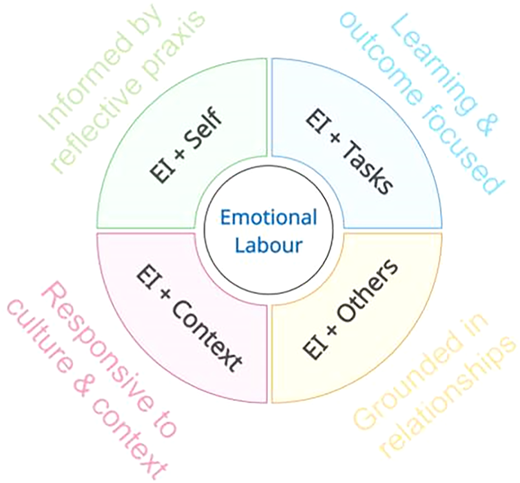
Although some frameworks have started to acknowledge the emotional aspects of mentoring, few have fully captured the emotionality at its core. The MEL framework (Relihan and O'Donovan, 2024) was developed to fill this gap, positioning EL as integral to the mentor's role. Drawing on Hochschild's (1983) foundational work, EL is defined as the process of managing and regulating one’s emotions to align with organisational or professional expectations. In parallel, the framework incorporates emotional intelligence (EI), which refers to the capacity to perceive, understand, and manage one's own emotions and those of others to guide thinking and behaviour (Mayer and Salovey, 1997; Goleman, 1996). Together, EL and EI help theorise and operationalise the emotional complexity of the mentoring dynamic and help define the relational practice at play. This is summarised in Figure 1, where EL is placed at the centre to represent the significant emotional effort required of mentors.

In the intermediate layer, EI functions as both an intra-individual regulatory capacity and a relational competency, mediating how mentors engage in EL across these four key mentoring aspects. Following Mayer and Salovey's (1997) definition, we interpreted EI in this framework as both an intra-individual capacity to regulate one's own emotional states (Gross, 1998) and a relational competency that enables empathetic, emotionally attuned engagement with others (Boyatzis and McKee, 2005). Thus, EI is positioned as a dynamic capacity that mediates how mentors enact EL across varying contexts and relationships. This interplay clarifies that mentoring involves not only instructional expertise but also a sustained emotional engagement that warrants explicit recognition in mentoring frameworks.

The outer layer comprises four core mentoring domains: grounded in relationships, reflective practice, learning-focused, and responsive to context. These were identified through an extensive review of mentoring literature and policy in the Australian ITE context to capture the complex and often invisible workload of mentors. To operationalise the role of EI, each of these domains is reframed through an EI lens, resulting in four hybrid constructs: EI and Relationships, EI and Self, EI and Tasks, and EI and Context. These constructs represent the emotionally intelligent engagement required to navigate each mentoring domain and give shape to the EL at play. For example, “EI and Self” may involve a mentor managing self-doubt after a difficult observation conversation, while “EI and Tasks” reflects the emotional effort of sustaining encouragement when a mentee's progress stalls. These ideas are explored in greater depth in Relihan and O'Donovan (2024), which presents narrative cases illustrating how mentors navigate emotional and relational challenges.

To our knowledge, there are no other valid and reliable instruments that directly measure the EL of mentoring PSTs. The remainder of this paper outlines the development and validation of a set of Rasch-calibrated scales that independently assess the four aspects of the MEL framework, as well as an overarching measure of EL in mentoring.

This study employed a pragmatic research design to translate the MEL framework into robust, psychometrically sound tools capable of capturing the nuanced emotional demands of mentoring in ITE. Unlike traditional scale development approaches that derive frameworks inductively from factor analysis or thematic coding, the MEL framework was developed deductively from established theory and literature. To reflect its holistic and multifaceted structure, the project developed an overarching MEL scale alongside four independent scales offering granular insights into key mentoring behaviours. Each scale was designed to meet the stringent criteria of the Rasch measurement model (Andrich, 1978). To aid interpretation, especially for non-statistical readers, analytic procedures are presented clearly and systematically.

A survey instrument was developed through three phases: (1) development of the conceptual framework, item generation, and layout; (2) expert item review; and (3) assessment using the Rasch model (Pallant, 2017). In phase (1), a comprehensive literature review on mentoring in ITE and existing assessment instruments informed the deductive development of 140 initial items. These items were aligned with the four aspects of MEL through a table of mentor attributes as detailed in Relihan and O'Donovan (2024). Practitioner insights further shaped measurable items across the four domains. Item generation followed established scale development guidelines (DeVellis and Thorpe, 2021; Boateng et al., 2018), ensuring theoretical alignment, systematic construction, and initial content validity.

Phase (2) involved a panel of four mentoring experts with school-based experience who provided written feedback on item alignment, clarity, and readability. This content validation process reduced the pool from 140 to 119 items. While expert review ensured content relevance, the subsequent Rasch analysis evaluated empirical fit and unidimensionality. Unlike CTT, which favours item retention based on correlation or consensus, Rasch flags highly correlated items as locally dependent. This indicates redundancy, as these items add little value and may artificially inflate reliability scores.

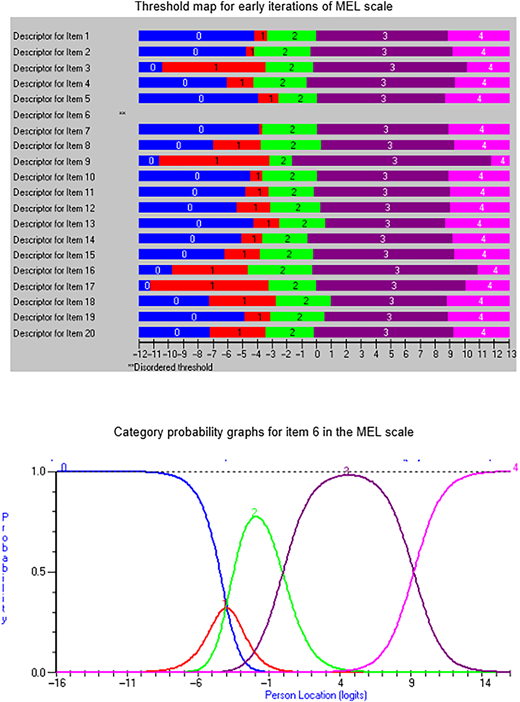
The final survey instrument comprised two sections: demographic information and the 119 MEL items rated on a five-point Likert-type scale (Terrible, Poor, Average, Good, and Excellent). This verbal response format was chosen to enhance relatability and reduce cognitive load, aligning with research on response process validity (Tourangeau et al., 2000) and similar to applied tools like the SF-36 Health Survey (Ware and Sherbourne, 1992). Although unconventional, the scale remained ordinal and was appropriate for Rasch analysis. All final items displayed ordered thresholds, confirming that response categories functioned as intended (see Figure 2). Phase (3) involved testing the refined item set using RUMM2030+ software, as detailed in the following sections.

The instrument was hosted on Qualtrics and distributed through purposive voluntary sampling via ITE networks and mentoring associations. Ethical approval was obtained from the university Human Research Ethics Committee, and participation was voluntary, anonymous, and open to educators with current or prior teaching experience.

In total, 350 educators participated across early childhood, primary, secondary, and tertiary sectors; Table 1 summarises their teaching, mentoring experience, and demographics. Data from 240 respondents were retained for Rasch analysis after excluding incomplete surveys, where participants often completed demographic items but not the MEL scales. The Rasch model accommodates partial responses without biasing estimates, ensuring valid calibration (Medvedev and Krägeloh, 2022; Linacre, 1994). The sample exceeded the recommended minimum of 200 for stable item estimates. While purposive sampling enabled access to a diverse cohort, it may have introduced minor self-selection bias, typical of early-stage scale development, and supports the need for further mixed-methods research (DeVellis and Thorpe, 2021).

Collected data were exported from Qualtrics, recoded (Terrible = 0; Poor = 1; Average = 2; Good = 3; Excellent = 4), and imported into RUMM2030+ for Rasch analysis. The 119 items were divided across four-quadrant MEL scales: MEL-Self (32 items), MEL-Others (28), MEL-Tasks (MEL-T) (38), and MEL-Context (21). This division of items was based on the conceptual aspects defined in the MEL framework during item development. Each scale was analysed independently using Rasch modelling to confirm unidimensionality and construct coherence. Once these scales were validated, the full 119-item pool was then re-analysed collectively to see if it was possible to discern an overarching MEL scale that could provide an integrated snapshot of mentoring EL.

Rasch analysis was used to transform ordinal survey data into a linear, unidimensional measure, mapping both item difficulty and respondent ability onto a shared logit continuum (Bond and Fox, 2015; Wright and Mok, 2004). The model operates on a probabilistic principle that mentors with higher ability on the latent trait (EL capacity) are more likely to endorse more challenging items, while those with lower ability tend to endorse easier ones (Boone and Noltemeyer, 2017; Wright and Masters, 1982). Unlike CTT, which assumes equal item contribution, Rasch modelling identifies how well each item defines the underlying construct, in this case, the EL of mentoring represented in the MEL framework (Tennant and Conaghan, 2007). Because Rasch modelling enforces unidimensionality, scales that meet its fit requirements can be interpreted as measuring a single coherent construct (Bond and Fox, 2015). Accordingly, each of the five MEL scales was validated as an independent unidimensional construct. This approach ensures that each retained item contributes meaningfully to the construct and provides a precise, diagnostic basis for validating theory-driven scales, aligning strongly with the MEL framework's conceptual design (Bond, 1994; Wright, 1996).

Rasch analysis also allows for the systematic identification and removal of items that distort measurement, including those with misfit, disordered thresholds, local dependency, or differential functioning across groups. Outcomes from these diagnostics, including threshold ordering, item fit, and reliability, are summarised in Table 2 and illustrated in Figures 2 – 4. Through this iterative refinement, the model ensures that retained items meet the four essential requirements for genuine measurement: quantification, qualification, unidimensionality, and linearity (Wright and Masters, 1982; Wright and Mok, 2004). Unlike statistical models that seek optimal data fit, Rasch prioritises conceptual coherence, assessing whether the data meet the model's expectations well enough to support valid and meaningful inferences (Boone and Noltemeyer, 2017).

RUMM2030+ software was selected for this study as it offers advanced graphical diagnostics, intuitive visualisations, and strong support for polytomous data. Features such as threshold maps, person–item distribution plots, and differential item functioning (DIF) analysis made it particularly suited to the development of the MEL scales, which aim to capture the complex and emotionally nuanced nature of mentoring. RUMM2030+ has been widely used in education and health research and provided the necessary diagnostic tools to ensure a rigorous psychometric evaluation (Bond and Fox, 2015; Pallant and Tennant, 2007).

Given the distinct philosophical and statistical foundations of Rasch measurement, this study did not apply factor analysis or other CTT-based approaches to triangulate the findings. While factor analysis focuses on identifying clusters of items based on shared variance, Rasch analysis stipulates, a priori, the prerequisite conditions that a set of items needs to satisfy for them to provide an objective, linear measure that spans all difficulty levels, quantifying a single latent trait across the scale (Wright, 1996; Bond, 1994). This makes Rasch analysis particularly well-suited to the MEL framework's aim of testing and refining a theoretically grounded, developmental measure of EL in mentoring. For this initial validation, it provided the strongest methodological alignment with the framework's conceptual design, allowing psychometric precision without compromising the integrity of its underlying theory, and giving confidence that the scales are genuinely unidimensional and broadly applicable and, unlike CTT analysis, not just artefacts of a particular sample (Wright, 1996).

The Rasch analysis followed established procedures from educational measurement research (O’Donovan and Sum, 2024; Waugh, 2002), systematically evaluating eight key aspects of scale performance.

  1. Ordered thresholds

  2. Item characteristic curves (ICCs)

  3. Fit statistics

  4. Internal reliability

  5. Local dependency

  6. Bias (DIF)

  7. Scale dimensionality

  8. Person-Item threshold mapping

  • Ordered thresholds: These were inspected to confirm that response categories functioned as intended, that participants with higher emotional-labour capacity selected higher response options (Bond and Fox, 2015). RUMM2030+ threshold maps and associated probability curves were reviewed across the five-point verbal scale (Terrible = 0; Poor = 1; Average = 2; Good = 3; Excellent = 4) to ensure that categories progressed in the expected order. As shown in Figure 2, Item 6 displayed disordered thresholds. The Poor category was rarely chosen, indicating overlap between adjacent options. Because collapsing categories did not resolve the issue, Item 6 was removed from the final scale, improving category functioning and overall measurement accuracy.

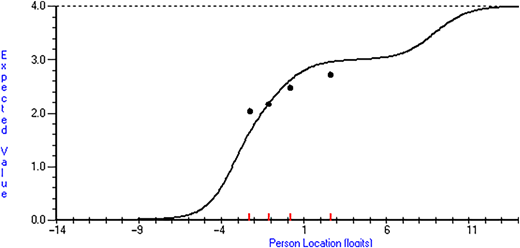
  • ICCs: RUMM2030+ generates ICCs to visually assess item fit. Respondents with similar abilities are plotted against expected model values; a good-fitting item follows the Rasch curve in a consistent ascending pattern (Pallant and Tennant, 2007). As illustrated in Figure 3, Item 83 shows clear misfit, overdiscriminating at lower abilities and underdiscriminating at higher levels. Due to this inconsistent measurement, the item was removed from the final scale.

  • Fit statistics and fit residuals: These statistics provided quantitative evidence of how well each scale conformed to the Rasch model. The overall Chi-Square statistic, expected to be non-significant (p > 0.05) after Bonferroni adjustment, indicated whether differences between observed and expected responses were due to chance rather than misfit (Table 2). In RUMM2030+, these outcomes appear in the scale-statistics table, along with item and person residuals describing deviations from model expectations (Bond and Fox, 2015). Residual means near 0 with a standard deviation (SD) close to 1.0 signified an acceptable model fit, while individual item residuals outside ±2.5 logits were reviewed for removal or revision (see Appendix B for original scale statistics).

  • Internal reliability: Within the Rasch framework, internal consistency is assessed using the Person Separation Index (PSI), which evaluates how effectively a scale distinguishes between respondents with different levels of the latent trait (Bond and Fox, 2015). For the MEL scales, PSI provided a measure of how well each aspect scale could differentiate mentors according to their capacity to navigate EL. Values above 0.70 indicate sufficient reliability for distinguishing meaningful ability levels (Table 2).

  • Local dependency: Rasch analysis identifies and corrects for highly correlated items, which are considered redundant. Unlike CTT approaches such as factor analysis, where correlated items are retained to reinforce reliability, Rasch treats them as inflating the PSI and undermining unidimensionality. In such cases, one item may be removed to reduce duplication and enhance construct clarity. All identified locally dependent pairs and decisions regarding their removal in MEL scales are detailed in Supplementary File 1.

  • Item bias: This is assessed via DIF, which identifies whether groups (e.g. gender, age, experience) respond differently to an item despite having equal underlying ability. Such differences typically reflect varied interpretations of item meaning across groups. For example, male mentors may respond consistently differently from females or non-binary participants (see Appendix B for original DIF patterns). If no DIF is detected, the item is considered fair and functions equivalently across the sample, supporting generalisability and construct validity (Pallant and Tennant, 2007).

  • The dimensionality of a scale: This test assesses whether each MEL scale measures a single underlying construct, as required by the Rasch model. A principal components analysis is conducted to sort items by their loading on the first component. A follow-up t-test compares person estimates based on the highest positive and lowest negative loadings. If observed and theoretical values at <5% and <1% are similar, the scale can be considered unidimensional (see Table 2).

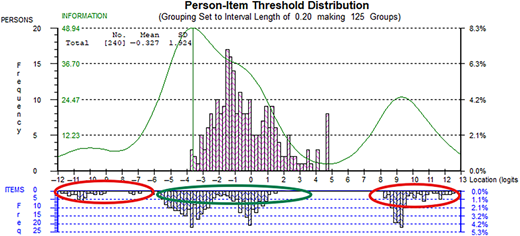
  • Person-item threshold mapping: These maps were used to assess how well item difficulty aligned with mentors' ability levels (Figure 4). The bars above the horizontal axis represent respondent ability (in logits), and those below show item threshold difficulty. The green information curve marks the scale's highest precision, peaking at the point of best measurement. Red ovals highlight item redundancy, with thresholds falling in ranges < −6.0 or >8.0 logits where no participants were located, indicating items that are too easy or too difficult. In contrast, the green oval shows strong alignment, suggesting good targeting of the MEL scales. This mapping helps inform item refinement to efficiently capture variation across the continuum.

The eight Rasch diagnostic criteria were systematically applied to all five MEL scales. This iterative, theory-driven process involved removing poorly performing items and re-running analyses to improve item functioning and assess construct validity (Bond and Fox, 2015; Pallant and Tennant, 2007). Item–person fit statistics were examined to ensure response patterns aligned with model expectations, supporting internal structure validity. Ordered thresholds confirmed consistent interpretation of Likert categories, contributing to response process validity. Tests of unidimensionality verified that each scale measured a single underlying construct, while DIF analyses ensured measurement invariance across gender and mentoring experience, enhancing fairness and generalisability.

Decisions about item retention were guided by a structured decision matrix (Appendix A). However, removal was not automatic. Items with marginal misfit were sometimes retained if they captured conceptually important aspects of the MEL framework or addressed gaps in person–item targeting. This balanced approach maintained construct coherence, unidimensionality, and precision across all MEL scales. A concise summary of item-refinement outcomes is available in the online Supplementary File 1, which lists removed items and diagnostic reasons for exclusion to support transparency and replicability.

This section reports results for the overarching MEL-15 and the four other scales: MEL-Context (MEL-C), MEL-Others (MEL-O), MEL-Self (MEL-S), and MEL-T. Rasch analyses were conducted on data from 240 valid responses to evaluate the psychometric performance of each scale. Participant characteristics are summarised in Table 1, showing broad representation across teaching sectors and mentoring experience levels.

The final instrument comprises a 15-item MEL-15 scale and four distinct 12-item aspect scales (MEL-C, MEL-O, MEL-S, and MEL-T). All five scales are conceptually aligned within the overarching MEL framework but were developed and psychometrically tested separately. The MEL-15 provides a concise, overarching measure of mentoring EL, while the four other scales function as standalone tools that capture distinct quadrants of the MEL framework. Eleven MEL-15 items also appear in the aspect scales, reflecting thematic overlap without statistical dependence. Key Rasch statistics for each scale are summarised in Table 2.

The MEL-15 scale was developed to provide a concise, psychometrically sound instrument for capturing how mentors navigate the EL of mentoring. Derived from the original 119-item pool, the MEL-15 was refined using Rasch analysis by removing over 30 locally dependent item pairs, six items with disordered thresholds, and others with poor fit statistics or theoretical misalignment. The final 15 items (listed in Table 3) demonstrated strong model alignment and measurement properties. Model fit was excellent (Chi-Square p = 0.718), with no extreme misfitting items. Item fit residual SD was 0.853, while person fit residual SD was slightly elevated (1.871), reflecting expected variability in emotionally nuanced constructs. The person–item map (Figure 5) showed item thresholds distributed between - 6 and + 1 logits, aligning well with the lower-to-moderate range of mentoring ability. While fewer items targeted the highest ability levels, this reflects the scale's purpose: to support mentor development, particularly for those building confidence and emotional skills. The MEL-15 is well-suited to support mentor development, self-reflection, and tracking progress over time.

The four MEL quadrant scales (MEL-C, MEL-O, MEL-S, and MEL-T) each capture a distinct but interrelated aspect of EL in mentoring, with scale items listed in Table 4. Each scale was refined independently to a 12-item structure through iterative Rasch analysis involving the removal of items with disordered thresholds, misfit, local dependency, or DIF. Key Rasch statistics for each scale are presented below, and the original scale statistics are provided in Appendix B.

The MEL-C scale captures how mentors respond to the institutional, relational, and environmental factors that shape mentoring. After removing poorly performing items, the final 12-item scale demonstrated excellent fit (Chi-Square p = 0.289) and high internal reliability (PSI = 0.869). The retained items reflect mentors' capacity to work within complex systems, including policy expectations, school culture, and interpersonal dynamics. The MEL-C scale thus provides a reliable lens for understanding how mentors navigate the broader structures that influence EL in ITE.

The MEL-O scale measures how mentors emotionally engage with and respond to the needs of others, including PSTs, colleagues, and school leaders. The original 25-item set was reduced to 12 items through the removal of items with misfit, local dependency, or disordered thresholds. The refined scale met Rasch model expectations (Chi-Square p = 0.066; PSI = 0.800). Although unidimensionality t-tests were slightly above the recommended cut-offs, they remained within acceptable bounds for early-stage scale development (Pallant and Tennant, 2007). The retained items reflect key relational competencies such as empathy, perspective-taking, and interpersonal responsiveness.

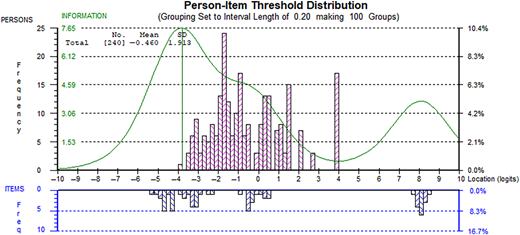
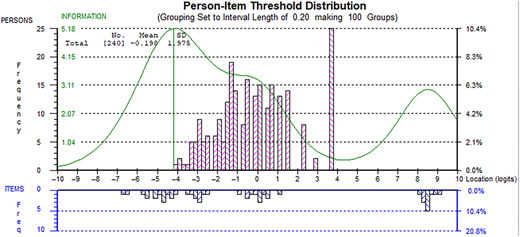
The MEL-Self scale assesses how mentors recognise, regulate, and reflect on their emotional responses when supporting PSTs. Initial analysis identified local dependency among 11 item pairs and disordered thresholds in two items, alongside several items with high Chi-Square values or poor fit. These items were removed, resulting in a 12-item scale that met Rasch model requirements (Chi-Square p = 0.481; PSI = 0.846). This strong PSI indicates reliable differentiation between mentors with varying levels of emotional self-regulation. The scale also satisfied the unidimensionality t-test, confirming it measures a single construct. Figure 6 shows that the person–item distribution is well targeted, with item difficulties spread appropriately across the ability continuum. Several thresholds around 8–9 logits confirm that the high cluster of respondents around ∼4 logits is not a ceiling effect but reflects genuine ability.

The MEL-T scale focuses on how mentors manage emotionally charged pedagogical and interpersonal tasks, such as delivering feedback or scaffolding PST learning. The original 39-item pool was reduced to 12 items through successive rounds of analysis. The final scale showed good model fit (Chi-Square p = 0.544), strong internal consistency (PSI = 0.825), and acceptable unidimensionality. The person–item threshold map revealed a skew towards easier items, suggesting stronger sensitivity at the lower-to-mid range of mentoring ability. This aligns with the MEL-T scale's purpose of supporting mentors who are still building confidence or navigating emotionally challenging situations. Theoretically, the retained items reflect how mentors perform emotionally charged mentoring tasks, such as delivering feedback or scaffolding PST learning. As such, the MEL-T scale offers a targeted, practical tool for identifying growth areas and informing mentor development pathways.

The five MEL scales were refined through Rasch analysis to produce concise, robust instruments. Each scale was independently validated as a unidimensional construct, confirming that they measure distinct yet conceptually aligned aspects of mentoring EL. The final 52-item tool offers statistically sound and practically usable measures, with clear scoring and interpretation guidance (Appendices A–C). The five scales can be administered jointly or separately, depending on whether a broad or focused assessment is required. The next section explores how these validated tools can support professional learning and research, alongside current limitations.

This study examined whether the MEL framework could be operationalised as a set of psychometrically valid Rasch-based scales. Following a systematic, theory-driven refinement process, all five scales demonstrated good fit to the Rasch model, with strong PSIs, acceptable Chi-Square values, and confirmed unidimensional structures. Although MEL-T and MEL-O were marginally outside the strictest thresholds, they remained within acceptable limits for research and practice (Tennant and Conaghan, 2007). These results indicate that EL in mentoring, often considered too nuanced to quantify, can be reliably and validly measured using a structured scale system.

Among the five scales, MEL-S and MEL-C demonstrated the most robust statistical performance, with high PSIs (0.846 and 0.869, respectively) and well-targeted item-person distributions. MEL-T, though slightly skewed towards easier items, performed well overall. This distribution is not a limitation per se but rather reflects the tool's intended purpose: to support developmental growth, particularly among mentors who are still building confidence and skills in emotionally complex mentoring contexts (Ambrosetti et al., 2014). From this perspective, sensitivity at the lower-to-mid range of ability is strength, not a flaw. The MEL scales are designed not to distinguish elite mentors but to provide meaningful developmental insights for mentors at various stages of their professional trajectories.

Patterns across participant data support this design orientation. Respondents newer to mentoring showed greater variability across MEL aspects, suggesting the framework may be especially useful for identifying areas of strength and need during earlier stages of mentor identity formation. This aligns with prior research that foregrounds mentoring as a relational, evolving practice (Ambrosetti et al., 2014; Gillett-Swan and Grant-Smith, 2020; Le Cornu, 2013) and highlights the importance of reflection and emotional regulation in mentor development. These findings suggest the MEL framework may help identify differing support needs across mentor experience levels. However, this possibility requires further investigation.

More broadly, the MEL framework and scales address a significant gap in the field. Despite growing recognition of mentoring as an emotionally charged and contextually complex practice (Hobson and Maxwell, 2020), few existing tools systematically capture these features. The MEL scales offer a rare, empirically grounded method for assessing EL in mentoring, grounded in practitioner realities and validated through rigorous Rasch analysis. While tools such as Hudson et al.’s (2005) five-factor model and Clarke et al.'s (2012), Clarke and Mena (2020) Mentoring Profile Inventory have advanced pedagogical understandings of mentoring, they do not quantify the EL central to mentoring. This limitation has been noted not only in instrument reviews (Chen et al., 2016) but also in broader critiques of mentor education, which call for greater attention to emotional and identity-related aspects of mentoring (Aspfors and Fransson, 2015; Relihan and O'Donovan, 2024). The MEL scales contribute to filling this empirical void and open the door to further research in this space.

In positioning the MEL scales within this literature, the framework conceptualises mentoring EL as a holistic, multifaceted practice in which emotional, relational, task-focused, and contextual elements interact dynamically rather than operate independently (Ambrosetti et al., 2014; Orland-Barak and Wang, 2021; Goodwin et al., 2021). However, empirical evidence on the precise nature of these interrelationships remains limited. Existing tools, such as the Mentoring Competency Assessment (Fleming et al., 2013) or Teacher Mentoring Self-Efficacy Scale (Tickell and Klassen, 2024), acknowledge overlapping emotional and interpersonal dimensions but do not systematically test inter-scale correlations or multidimensional structures in ITE mentoring contexts. In this study, while the quadrants were derived from a unified theoretical framework, no prior literature provides direct empirical support for their degree of independence or relatedness in measuring EL.

Empirically, this study validates each quadrant scale as an independent, unidimensional measure through Rasch analysis, confirming internal coherence and construct validity within each domain (as evidenced by PSI >0.80, non-significant Chi-Square, and unidimensionality t-tests; per Table 2). However, Rasch modelling, by design, focuses on within-scale unidimensionality and does not assess inter-scale dimensionality, such as correlations or confirmatory factor analysis across quadrants. This means that the current validation establishes that each scale measures a coherent, standalone aspect of the MEL framework, but it does not quantify how the quadrants covary or whether they form a higher-order structure. As a result, while the scales are theoretically linked, users should interpret inter-quadrant relationships cautiously, recognising that empirical evidence for their distinctness (beyond conceptual design) or empirical overlap is not yet established in this or prior work.

While this research provides a strong foundation, there remains scope for refinement. Of the original item pool of 119 items, only 52 items (in groups of 12 and 15) met the strict Rasch criteria for measurement. This improves usability, but it is also necessary to find linear unidimensional scales for each aspect. This trade-off was intentional, aiming for concise, practical instruments without sacrificing psychometric integrity. It is conceivable that future studies could develop extended versions of the scales to capture more nuanced expressions of mentoring capacity.

Additionally, the use of a voluntary, convenience sample means the findings may reflect a cohort of particularly committed or reflective mentors. While this limits generalisability, it also demonstrates that even among an engaged sample, there is measurable variation in EL dimensions, which is a promising indicator of the tool's potential sensitivity. Future research could extend validation across more diverse mentor populations, including those in different school systems, cultural contexts, or teacher preparation pathways.

The practical applications of the MEL scales are numerous, and the framework is designed to support flexible use. The overarching MEL-15 provides a holistic snapshot of mentors' emotional-labour capacity, while the quadrant scales offer more targeted insights into specific domains of mentoring practice that may not be fully visible in the overall score. For example, a mentor may score moderately on MEL-15 while demonstrating strengths in emotional self-regulation (MEL-Self) alongside challenges in navigating institutional pressures (MEL-Context), informing more tailored professional development. In ITE contexts, they offer a ready-to-use system for establishing baseline mentor profiles, guiding reflective dialogue, and evaluating the effectiveness of professional learning programs, including mentor-training modules and post-placement debrief sessions. Pre- and post-intervention use of the scales can provide a quantitative means of assessing change over time. They may also offer insight into how mentoring practices influence mentee experiences, opening possibilities for evaluating relational and developmental outcomes alongside mentor growth. The MEL framework also provides a shared language for articulating the emotional aspects of mentoring, thereby strengthening peer-mentoring networks and communities of practice by supporting more open, emotionally literate professional dialogue. However, further research would be required to explore any inter-scale relationships; hence, any subscale analyses should be viewed as complementary rather than definitive indicators of independent constructs.

To minimise burden and maximise their developmental potential, the MEL scales are best utilised within collaborative professional contexts, such as mentoring training programs, structured peer-learning groups, or facilitated workshops, rather than as isolated individual tasks. When used in this spirit, they have the potential to foster mentor agency and professional insight, rather than add to the assessment burden so often lamented in ITE settings.

Finally, the MEL scales invite a shift in how mentoring is conceptualised and supported in ITE. They bring attention back to the human, relational core of mentoring, highlighting what occurs beyond assessment checklists and compliance-driven systems. In doing so, the framework helps legitimise mentoring as a distinct domain of professional practice, one that deserves its own evidence base, its own metrics, and its own forms of recognition.

Mentoring in ITE is a complex and emotionally intensive practice (Hobson et al., 2009). The MEL framework was developed to explicitly centre EL as a defining feature of mentoring, offering both a theoretical lens and validated tools to measure it. This study demonstrates the psychometric credibility of five MEL scales using Rasch measurement to ensure unidimensionality, reliability, and interpretability (Bond and Fox, 2015; Boone and Noltemeyer, 2017).

Several limitations should be acknowledged. The sample, while sufficient for Rasch analysis, was not randomly selected and may not fully represent the wider mentor population. Additionally, the absence of qualitative triangulation (e.g. mentor narratives or PST feedback) limits interpretive depth. Future scale development may consider adding more challenging items to extend targeting and deepen construct coverage.

Looking ahead, larger and more diverse samples are needed to confirm the generalisability of these findings. Cross-contextual studies, including in different educational sectors and international settings, would test the framework's relevance and allow for cultural adaptation. Longitudinal research could examine how mentors' MEL profiles evolve, particularly in response to professional development.

Importantly, these MEL tools could be embedded into mentor training programs as diagnostic self-assessment resources, enabling reflective practice and growth tracking. Companion materials such as reflective prompts or case-based discussion tools could help mentors interpret their results and engage more deeply with EL as a core professional practice. However, implementation must be carefully balanced to avoid overburdening mentors, positioning MEL as a supportive resource rather than an additional compliance measure.

In sum, the MEL project contributes a timely, evidence-informed resource for recognising and supporting the emotional traits of mentoring. By offering a structured way to engage with this often-overlooked work, it moves the field toward a more humane, reflective, and relationally grounded vision of mentoring in ITE.

The supplementary material for this article can be found online.
Ambrosetti
,
A.
,
Knight
,
B.A.
and
Dekkers
,
J.
(
2014
), “
Maximising the potential of mentoring: a framework for pre-service teacher education
”,
Mentoring and Tutoring: Partnership in Learning
, Vol. 
22
No. 
3
, pp. 
224
-
239
, doi: .
Andrich
,
D.
(
1978
), “
A rating formulation for ordered response categories
”,
Psychometrika
, Vol. 
43
No. 
4
, pp. 
561
-
573
, doi: .
Aspfors
,
J.
and
Fransson
,
G.
(
2015
), “
Research on mentor education for mentors of newly qualified teachers: a qualitative meta-synthesis
”,
Teaching and Teacher Education
, Vol. 
48
, pp. 
75
-
86
, doi: .
Boateng
,
G.O.
,
Neilands
,
T.B.
,
Frongillo
,
E.A.
,
Melgar-Quiñonez
,
H.R.
and
Young
,
S.L.
(
2018
), “
Best practices for developing and validating scales for health, social, and behavioral research: a primer
”,
Frontiers in Public Health
, Vol. 
6
, p.
149
, doi: .
Bond
,
T.
(
1994
), “
Too many factors in factor analysis?
”,
Rasch Measurement Transactions
, Vol. 
8
No. 
1
, p.
347
.
Bond
,
T.G.
and
Fox
,
C.M.
(
2015
),
Applying the Rasch Model: Fundamental Measurement in the Human Sciences
, (3rd ed.) ,
Routledge
,
New York, NY
.
Boone
,
W.J.
and
Noltemeyer
,
A.
(
2017
), “
Rasch analysis: a primer for school psychology researchers and practitioners
”,
Cogent Education
, Vol. 
4
No. 
1
, 1416898, doi: .
Boyatzis
,
R.E.
and
McKee
,
A.
(
2005
),
Resonant Leadership: Renewing Yourself and Connecting with Others through Mindfulness, Hope, and Compassion
,
Harvard Business School Press
,
Boston, MA
.
Chen
,
Y.
,
Watson
,
R.
and
Hilton
,
A.
(
2016
), “
A review of mentorship measurement tools
”,
Nurse Education Today
, Vol. 
40
, pp. 
20
-
28
, doi: .
Clarke
,
A.
,
Collins
,
J.
,
Triggs
,
V.
,
Neilsen
,
W.
,
Augustine
,
A.
,
Coulter
,
D.
,
Cunningham
,
J.
,
Grigoriadis
,
T.
,
Hardman
,
S.
,
Hunter
,
L.
,
Kinegal
,
J.
,
Li
,
B.
,
Mah
,
J.
,
Mastin
,
K.
,
Partridge
,
D.
,
Pawer
,
L.
,
Rasoda
,
S.
,
Salbuvik
,
K.
,
Ward
,
M.
,
White
,
J.
and
Weil
,
F.
(
2012
), “
The mentoring profile inventory: an online professional development resource for cooperating teachers
”,
Teaching Education
, Vol. 
23
No. 
2
, pp. 
167
-
194
, doi: .
Clarke
,
A.
and
Mena
,
J.
(
2020
), “
An international comparative study of practicum mentors: learning about ourselves by learning about others
”,
Teaching and Teacher Education
, Vol. 
90
, 103026, doi: .
Crawford
,
L.M.
,
Randolph
,
J.J.
and
Yob
,
I.M.
(
2014
), “
Theoretical development, factorial validity, and reliability of the online graduate mentoring scale
”,
Mentoring & Tutoring: Partnership in Learning
, Vol. 
22
No. 
1
, pp. 
20
-
37
, doi: .
Delgado
,
C.
,
Upton
,
D.
,
Ranse
,
K.
,
Furness
,
T.
and
Foster
,
K.
(
2017
), “
Nurses' resilience and the emotional labour of nursing work: an integrative review of empirical literature
”,
International Journal of Nursing Studies
, Vol. 
70
, pp. 
71
-
88
, doi: .
DeVellis
,
R.F.
and
Thorpe
,
C.T.
(
2021
),
Scale Development: Theory and Applications
, (5th ed.) ,
Sage Publications
,
Thousand Oaks, CA
.
Fleming
,
M.
,
House
,
S.
,
Hanson
,
V.S.
,
Yu
,
L.
,
Garbutt
,
J.
,
McGee
,
R.
,
Kroenke
,
K.
,
Abedin
,
Z.
and
Rubio
,
D.M.
(
2013
), “
The mentoring competency assessment: validation of a new instrument to evaluate skills of research mentors
”,
Academic Medicine
, Vol. 
88
No. 
7
, pp. 
1002
-
1008
, doi: .
Garza
,
R.
,
Reynosa
,
R.J.
,
Werner
,
P.H.
,
Duchaine
,
E.L.
and
Harter
,
R.A.
(
2019
), “
Developing a mentoring framework through the examination of mentoring paradigms in a teacher residency program
”,
Australian Journal of Teacher Education
, Vol. 
44
No. 
3
, pp. 
1
-
22
, doi: .
Gillett-Swan
,
J.
and
Grant-Smith
,
D.
(
2020
), “
Addressing mentor wellbeing in practicum placement mentoring relationships in initial teacher education
”,
International Journal of Mentoring and Coaching in Education
, Vol. 
9
No. 
4
, pp. 
393
-
409
, doi: .
Goleman
,
D.
(
1996
),
Emotional Intelligence
,
Bloomsbury
,
London
.
Goodwin
,
A.L.
,
Chen Lee
,
C.
and
Pratt
,
S.
(
2021
), “
The poetic humanity of teacher education: holistic mentoring for beginning teachers
”,
Professional Development in Education
, Vol. 
49
No. 
4
, pp. 
707
-
724
, doi: .
Gross
,
J.J.
(
1998
), “
The emerging field of emotion regulation: an integrative review
”,
Review of General Psychology
, Vol. 
2
No. 
3
, pp. 
271
-
299
, doi: .
Hairon
,
S.
,
Loh
,
S.H.
,
Lim
,
S.P.
,
Govindani
,
S.N.
,
Tan
,
J.K.T.
and
Tay
,
E.C.J.
(
2020
), “
Structured mentoring: principles for effective mentoring
”,
Educational Research for Policy and Practice
, Vol. 
19
No. 
2
, pp. 
105
-
123
, doi: .
Hobson
,
A.J.
and
Maxwell
,
B.
(
2020
), “
Mentoring substructures and superstructures: an extension and reconceptualisation of the architecture for teacher mentoring
”,
Journal of Education for Teaching
, Vol. 
46
No. 
2
, pp. 
184
-
206
, doi: .
Hobson
,
A.
,
Ashby
,
P.
,
Malderez
,
A.
and
Tomlinson
,
P.
(
2009
), “
Mentoring beginning teachers: what we know and what we don't
”,
Teaching and Teacher Education
, Vol. 
25
No. 
1
, pp. 
207
-
216
, doi: .
Hochschild
,
A.R.
(
1983
),
The Managed Heart: Commercialization of Human Feeling
,
University of California Press
,
Berkeley, CA
.
Hudson
,
P.
,
Skamp
,
K.
and
Brooks
,
L.
(
2005
), “
Development of an instrument: mentoring for effective primary science teaching
”,
Science Education
, Vol. 
89
No. 
4
, pp. 
657
-
674
, doi: .
Kariou
,
A.
,
Koutsimani
,
P.
,
Montgomery
,
A.
and
Lainidi
,
O.
(
2021
), “
Emotional labor and burnout among teachers: a systematic review
”,
International Journal of Environmental Research and Public Health
, Vol. 
18
No. 
23
, 12760, doi: .
Koç
,
E.M.
(
2011
), “
Development of mentor teacher role inventory
”,
European Journal of Teacher Education
, Vol. 
34
No. 
2
, pp. 
193
-
208
, doi: .
Le Cornu
,
R.
(
2013
), “
Building early career teacher resilience: the role of relationships
”,
Australian Journal of Teacher Education
, Vol. 
38
No. 
4
, pp. 
1
-
16
, doi: .
Linacre
,
J.M.
(
1994
), “
Sample size and item calibration stability
”,
Rasch Measurement Transactions
, Vol. 
7
No. 
4
, p.
328
.
Loosveld
,
L.M.
,
Van Gerven
,
P.W.M.
,
Essen
,
E.W.
,
Vanassche
,
E.
and
Artino
,
A.R.
(
2021
), “
MERIT: a mentor reflection instrument for identifying the personal interpretative framework
”,
BMC Medical Education
, Vol. 
21
No. 
1
, p.
144
, doi: .
Mayer
,
J.D.
and
Salovey
,
P.
(
1997
), “What is emotional intelligence?”, in
Salovey
,
P.
and
Sluyter
,
D.
(Eds),
Emotional Development and Emotional Intelligence: Educational Implications
,
Basic Books
,
New York, NY
, pp. 
3
-
31
.
Medvedev
,
O.N.
and
Krägeloh
,
C.U.
(
2022
), “Rasch measurement model”, in
Handbook of Assessment in Mindfulness Research
,
Springer International Publishing
,
Cham
, pp. 
1
-
18
.
Menter
,
I.
(
2018
), “Teacher education in a crucible of change”, in
Innovation and Accountability in Teacher Education: Setting Directions for New Cultures in Teacher Education
,
Springer
,
Cham
, pp. 
313
-
325
.
Nuis
,
W.
,
Segers
,
M.
and
Beausaert
,
S.
(
2024
), “
Measuring mentoring in employability-oriented higher education programs: scale development and validation
”,
Higher Education
, Vol. 
87
No. 
4
, pp. 
899
-
921
, doi: .
O'Connor
,
K.E.
(
2008
), “
‘You choose to care’: teachers, emotions and professional identity
”,
Teaching and Teacher Education
, Vol. 
24
No. 
1
, pp. 
117
-
126
, doi: .
Orland-Barak
,
L.
and
Wang
,
J.
(
2021
), “
Teacher mentoring in service of preservice teachers' learning to teach: conceptual bases, characteristics, and challenges for teacher education reform
”,
Journal of Teacher Education
, Vol. 
72
No. 
1
, pp. 
86
-
99
, doi: .
O'Donovan
,
R.
and
Sum
,
N.
(
2024
), “
Investigating the victorian government schools’ parent opinion survey validity: pursuing a dependable measure of parent sentiment
”,
Australian Educational Researcher
, Vol. 
51
No. 
1
, pp. 
423
-
443
, doi: .
Pallant
,
J.
(
2017
), “
Scale development, Rasch analysis and item response theory
”,
Course notes, Australian Consortium for Social and Political Research Inc, University of Melbourne
.
Pallant
,
J.F.
and
Tennant
,
A.
(
2007
), “
An introduction to the Rasch measurement model: an example using the Hospital Anxiety and Depression Scale (HADS)
”,
British Journal of Clinical Psychology
, Vol. 
46
No. 
1
, pp. 
1
-
18
, doi: .
Philipp
,
A.
and
Schüpbach
,
H.
(
2010
), “
Longitudinal effects of emotional labour on emotional exhaustion and dedication of teachers
”,
Journal of Occupational Health Psychology
, Vol. 
15
No. 
4
, pp.
494
-
504
, doi: .
Relihan
,
M.C.
and
O'Donovan
,
R.
(
2024
), “
Putting the cart behind the horse: conceptualising the ‘emotionality’ of mentoring in initial teacher education
”,
International Journal of Mentoring and Coaching in Education
, Vol. 
13
No. 
4
, pp. 
511
-
526
, doi: .
Schatz Oppenheimer
,
O.
and
Goldenberg
,
J.
(
2024
), “
The impact of professional mentoring on mentors of novice-teachers
”,
International Journal of Mentoring and Coaching in Education
, Vol. 
13
No. 
1
, pp. 
122
-
141
, doi: .
Simpson
,
A.
,
Day
,
C.
,
Goulding
,
J.
and
Asha
,
J.
(
2022
), “
Australian teachers' perceptions of effectiveness in a performative culture
”,
Teaching and Teacher Education
, Vol. 
109
, 103542, doi: .
Stacey
,
M.
,
Talbot
,
D.
,
Buchanan
,
J.
and
Mayer
,
D.
(
2020
), “
The development of an Australian teacher performance assessment: lessons from the international literature
”,
Asia-Pacific Journal of Teacher Education
, Vol. 
48
No. 
5
, pp. 
508
-
519
, doi: .
Tennant
,
A.
and
Conaghan
,
P.G.
(
2007
), “
The Rasch measurement model in rheumatology: what is it and why use it? When should it be applied, and what should one look for in a Rasch paper?
”,
Arthritis & Rheumatism
, Vol. 
57
No. 
8
, pp. 
1358
-
1362
, doi: .
Tickell
,
R.M.
and
Klassen
,
R.M.
(
2024
), “
Developing the teacher mentoring self-efficacy scale (TMSES) using the delphi method and exploratory factor analysis
”,
Teaching and Teacher Education
, Vol. 
139
, 104452, doi: .
Tourangeau
,
R.
,
Rips
,
L.J.
and
Rasinski
,
K.
(
2000
),
The Psychology of Survey Response
,
Cambridge University Press
,
Cambridge
.
Ware
,
J.E.
, Jr.
and
Sherbourne
,
C.D.
(
1992
), “
The MOS 36-item short-form health survey (SF-36). I. Conceptual framework and item selection
”,
Medical Care
, Vol. 
30
No. 
6
, pp.
473
-
483
.
Waugh
,
R.F.
(
2002
), “
Measuring self-reported studying and learning for university students: linking attitudes and behaviours on the same scale
”,
British Journal of Educational Psychology
, Vol. 
72
No. 
4
, pp. 
573
-
604
, doi: .
Wright
,
B.D.
(
1996
), “
Comparing Rasch measurement and factor analysis
”,
Structural Equation Modeling: A Multidisciplinary Journal
, Vol. 
3
No. 
1
, pp. 
3
-
24
, doi: .
Wright
,
B.D.
and
Masters
,
G.N.
(
1982
),
Rating Scale Analysis: Rasch Measurement
,
Mesa Press
,
Chicago, IL
.
Wright
,
B.D.
and
Mok
,
M.M.
(
2004
), “
An overview of the family of Rasch measurement models
”,
Introduction to Rasch Measurement
, Vol. 
1
No. 
1
, pp. 
1
-
24
.
Zembylas
,
M.
(
2005
), “
Discursive practices, genealogies, and emotional rules: a poststructuralist view on emotion and identity in teaching
”,
Teaching and Teacher Education
, Vol. 
21
No. 
8
, pp. 
935
-
948
, doi: .
Andrich
,
D.
,
Lyne
,
A.
,
Sheridan
,
B.
and
Luo
,
G.
(
2010
),
RUMM2030+ [Computer Software]
,
RUMM Laboratory Pty
,
Perth
,
available at:
 https://www.rummlab.com.au (
accessed
 October 2024).
Nesje
,
K.
and
Lejonberg
,
E.
(
2022
), “
Tools for the school-based mentoring of pre-service teachers: a scoping review
”,
Teaching and Teacher Education
, Vol. 
111
, 103609, doi: .
Rasch
,
G.
(
1960
),
Studies in Mathematical Psychology: I. Probabilistic Models for Some Intelligence and Attainment Tests
,
Nielsen and Lydiche
,
Copenhagen
.
Published by Emerald Publishing Limited. This article is published under the Creative Commons Attribution (CC BY 4.0) licence. Anyone may reproduce, distribute, translate and create derivative works of this article (for both commercial and non-commercial purposes), subject to full attribution to the original publication and authors. The full terms of this licence may be seen at Link to the terms of the CC BY 4.0 licence.

Supplementary data

Data & Figures

Figure 1
A circular quadrant diagram shows Emotional Labour with four E I components.The circular quadrant diagram shows a central circle labeled “Emotional Labour”. Surrounding it are four equal curved segments arranged clockwise, starting from the top left. The top-left segment is labeled “E I plus Self” with the outer descriptor “Informed by reflective praxis”. The top-right segment is labeled “E I plus Tasks” with the outer descriptor “Learning and Outcome focused”. The bottom-right segment is labeled “E I plus Others” with the outer descriptor “Grounded in relationships”. The bottom-left segment is labeled “E I plus Context” with the outer descriptor “Responsive to culture and context”.
Figure 1
A circular quadrant diagram shows Emotional Labour with four E I components.The circular quadrant diagram shows a central circle labeled “Emotional Labour”. Surrounding it are four equal curved segments arranged clockwise, starting from the top left. The top-left segment is labeled “E I plus Self” with the outer descriptor “Informed by reflective praxis”. The top-right segment is labeled “E I plus Tasks” with the outer descriptor “Learning and Outcome focused”. The bottom-right segment is labeled “E I plus Others” with the outer descriptor “Grounded in relationships”. The bottom-left segment is labeled “E I plus Context” with the outer descriptor “Responsive to culture and context”.
Close Figure 1
Figure 2
A threshold map and category probability graph for the M E L scale.The figure contains two panels titled “Threshold map for early iterations of M E L scale” and “Category probability graphs for item 6 in the M E L scale”. Top panel: The horizontal axis is labeled “Disordered threshold” and ranges from negative 12 to 13 with increments of 1 unit. The vertical axis lists 20 rows from top to bottom, labeled “Descriptor for Item 1” through “Descriptor for Item 20”. Each row contains a horizontal segmented bar divided into five ordered categories labeled “0”, “1”, “2”, “3”, and “4”. The segments progress from left to right in increasing category order. Most items show ordered thresholds with category “0” on the far left, after that category 1, then category 2, then category 3, and category “4” on the far right. A note “Disordered threshold” appears below the axis. Item 6 is marked with “xx” and does not display a segmented bar. Bottom panel: “Category probability graphs for item 6 in the M E L scale”. The horizontal axis is labeled “Person Location (logits)” and ranges from negative 16 to 14 with labeled ticks at negative 16, negative 11, negative 6, negative 1, 4, 9, and 14. The vertical axis is labeled “Probability” and ranges from 0.0 to 1.0 with increments of 0.5 units. Five smooth curves labeled “0”, “1”, “2”, “3”, and “4” are plotted. Category “0” starts near probability 1.0 at (negative 16, 1.0) and decreases sharply toward 0 near (negative 5, 0). Category “1” forms a small peak around (negative 5, 0.3) and declines toward 0 near (negative 2, 0). Category “2” peaks near (negative 2, 0.7) and declines toward 0 near (2, 0). Category “3” rises near (0, 0.2), peaks close to (4, 1.0), and declines toward 0 near (9, 0). Category “4” rises sharply near (8, 0.5) and approaches probability 1.0 near (14, 1.0). A dashed horizontal reference line appears at probability 1.0. Note: All numerical data values are approximated.

Disordered thresholds from MEL scale. Source: Authors’ own work

Figure 2
A threshold map and category probability graph for the M E L scale.The figure contains two panels titled “Threshold map for early iterations of M E L scale” and “Category probability graphs for item 6 in the M E L scale”. Top panel: The horizontal axis is labeled “Disordered threshold” and ranges from negative 12 to 13 with increments of 1 unit. The vertical axis lists 20 rows from top to bottom, labeled “Descriptor for Item 1” through “Descriptor for Item 20”. Each row contains a horizontal segmented bar divided into five ordered categories labeled “0”, “1”, “2”, “3”, and “4”. The segments progress from left to right in increasing category order. Most items show ordered thresholds with category “0” on the far left, after that category 1, then category 2, then category 3, and category “4” on the far right. A note “Disordered threshold” appears below the axis. Item 6 is marked with “xx” and does not display a segmented bar. Bottom panel: “Category probability graphs for item 6 in the M E L scale”. The horizontal axis is labeled “Person Location (logits)” and ranges from negative 16 to 14 with labeled ticks at negative 16, negative 11, negative 6, negative 1, 4, 9, and 14. The vertical axis is labeled “Probability” and ranges from 0.0 to 1.0 with increments of 0.5 units. Five smooth curves labeled “0”, “1”, “2”, “3”, and “4” are plotted. Category “0” starts near probability 1.0 at (negative 16, 1.0) and decreases sharply toward 0 near (negative 5, 0). Category “1” forms a small peak around (negative 5, 0.3) and declines toward 0 near (negative 2, 0). Category “2” peaks near (negative 2, 0.7) and declines toward 0 near (2, 0). Category “3” rises near (0, 0.2), peaks close to (4, 1.0), and declines toward 0 near (9, 0). Category “4” rises sharply near (8, 0.5) and approaches probability 1.0 near (14, 1.0). A dashed horizontal reference line appears at probability 1.0. Note: All numerical data values are approximated.

Disordered thresholds from MEL scale. Source: Authors’ own work

Close Figure 2
Figure 3
A line graph of expected value versus person location in logits.The line graph shows “Expected Value” plotted against “Person Location (logits)”. The horizontal axis is labeled “Person Location (logits)” and ranges from negative 14 to 11 with labeled ticks at negative 14, negative 9, negative 4, 1, 6, and 11. The vertical axis is labeled “Expected Value” and ranges from 0.0 to 4.0 with increments of 1.0 unit. A smooth S-shaped curve begins near (negative 14, 0.0), remains close to 0.0 until about (negative 6, 0.1), then rises steeply between (negative 5, 0.5) and (negative 2, 2.0). The curve continues upward to around (1, 2.8), gradually approaches (4, 3.0), and then increases slowly toward the upper boundary, reaching near (11, 4.0) and leveling at 4.0. A dashed horizontal reference line appears at y equals 4.0. Three black data points appear near the middle of the curve around (negative 2.5, 2.0), (0, 2.4), and (2.5, 2.7). Small red tick marks are shown along the horizontal axis near values between negative 2 and 3, marking threshold locations. Note: All numerical data values are approximated.

ICC for item 83 in early iterations of the MEL scale. Source: Authors’ own work

Figure 3
A line graph of expected value versus person location in logits.The line graph shows “Expected Value” plotted against “Person Location (logits)”. The horizontal axis is labeled “Person Location (logits)” and ranges from negative 14 to 11 with labeled ticks at negative 14, negative 9, negative 4, 1, 6, and 11. The vertical axis is labeled “Expected Value” and ranges from 0.0 to 4.0 with increments of 1.0 unit. A smooth S-shaped curve begins near (negative 14, 0.0), remains close to 0.0 until about (negative 6, 0.1), then rises steeply between (negative 5, 0.5) and (negative 2, 2.0). The curve continues upward to around (1, 2.8), gradually approaches (4, 3.0), and then increases slowly toward the upper boundary, reaching near (11, 4.0) and leveling at 4.0. A dashed horizontal reference line appears at y equals 4.0. Three black data points appear near the middle of the curve around (negative 2.5, 2.0), (0, 2.4), and (2.5, 2.7). Small red tick marks are shown along the horizontal axis near values between negative 2 and 3, marking threshold locations. Note: All numerical data values are approximated.

ICC for item 83 in early iterations of the MEL scale. Source: Authors’ own work

Close Figure 3
Figure 4
A histogram and item frequency plot of person–item threshold distribution in logits.The histogram titled “Person-Item Threshold Distribution” includes the subtitle “Grouping Set to Interval Length of 0.20, making 125 Groups”. The horizontal axis is labeled “Location (logits)” and ranges from negative 12 to 13 with increments of 1 unit. The upper panel represents “PERSONS”. The left vertical axis is labeled “Frequency” and ranges from 0 to 20 with increments of 5 units. The right vertical axis shows percentages from 0.0 percent to 8.3 percent with increments of about 2.1 percent. A histogram of persons appears concentrated between negative 4 and 4 logits, with the highest bars near negative 2 to negative 1 reaching about 17. A green smoothed curve overlays the histogram, peaking near negative 3 at about 20 and showing another rise near 9 logits around 10. Text under “INFORMATION” shows “48.94” and summary statistics: “Total [240] Mean negative 0.327 SD 1.924”. Dashed horizontal reference lines are marked at 12.23, 24.47, 36.70, and 48.94. The lower panel represents “ITEMS”. The left vertical axis is labeled “Frequency” and ranges from 0 to 25 with increments of 5 units. The right vertical axis shows percentages from 0.0 percent to 5.3 percent with increments of about 1.1 percent. Item thresholds are displayed as downward bars clustered mainly between negative 5 and 5 logits, with denser concentrations near negative 3 to negative 1 and near 0 to 2. Additional smaller clusters appear near negative 10 to negative 8 and near 9 to 11 logits. Three elliptical highlights encircle threshold groupings at the far left, central region, and far right. Blue dashed horizontal reference lines appear at frequency levels 5, 10, 15, 20, and 25. Note: All numerical data values are approximated.

Person-item map for the initial MEL scale. Source: Authors’ own work

Figure 4
A histogram and item frequency plot of person–item threshold distribution in logits.The histogram titled “Person-Item Threshold Distribution” includes the subtitle “Grouping Set to Interval Length of 0.20, making 125 Groups”. The horizontal axis is labeled “Location (logits)” and ranges from negative 12 to 13 with increments of 1 unit. The upper panel represents “PERSONS”. The left vertical axis is labeled “Frequency” and ranges from 0 to 20 with increments of 5 units. The right vertical axis shows percentages from 0.0 percent to 8.3 percent with increments of about 2.1 percent. A histogram of persons appears concentrated between negative 4 and 4 logits, with the highest bars near negative 2 to negative 1 reaching about 17. A green smoothed curve overlays the histogram, peaking near negative 3 at about 20 and showing another rise near 9 logits around 10. Text under “INFORMATION” shows “48.94” and summary statistics: “Total [240] Mean negative 0.327 SD 1.924”. Dashed horizontal reference lines are marked at 12.23, 24.47, 36.70, and 48.94. The lower panel represents “ITEMS”. The left vertical axis is labeled “Frequency” and ranges from 0 to 25 with increments of 5 units. The right vertical axis shows percentages from 0.0 percent to 5.3 percent with increments of about 1.1 percent. Item thresholds are displayed as downward bars clustered mainly between negative 5 and 5 logits, with denser concentrations near negative 3 to negative 1 and near 0 to 2. Additional smaller clusters appear near negative 10 to negative 8 and near 9 to 11 logits. Three elliptical highlights encircle threshold groupings at the far left, central region, and far right. Blue dashed horizontal reference lines appear at frequency levels 5, 10, 15, 20, and 25. Note: All numerical data values are approximated.

Person-item map for the initial MEL scale. Source: Authors’ own work

Close Figure 4
Figure 5
A histogram showing person and item threshold distribution across location logits.The histogram titled “Person-Item Threshold Distribution” includes the subtitle “Grouping Set to Interval Length of 0.20, making 100 Groups”. The horizontal axis is labeled “Location (logits)” and ranges from negative 10 to 10 with increments of 1 unit. The upper panel is labeled “PERSONS”. The left vertical axis is labeled “Frequency” and ranges from 0 to 25 with increments of 5 units. The right vertical axis shows percentages from 0.0 percent to 10.4 percent, with marked values at 2.1 percent, 4.2 percent, 6.3 percent, and 8.3 percent. A histogram of persons appears mainly between negative 4 and 3 logits, with the highest bar near negative 2 reaching about 24. A green smooth curve overlays the histogram, peaking near negative 3 at about 25 and rising again near 8 logits at about 12. Under “INFORMATION”, the value “7.65” appears. Summary statistics read “No. Mean SD” and “Total: [240], negative 0.460, 1.913”. Dashed horizontal reference lines are labeled 1.53, 3.06, 4.59, 6.12, and 7.65. The lower panel is labeled “ITEMS”. The left vertical axis is labeled “Frequency” and ranges from 0 to 10 with increments of 5 units. The right vertical axis shows percentages from 0.0 percent to 16.7 percent, with a marked value at 8.3 percent. Downward bars represent item thresholds, clustered primarily between negative 4 and 2 logits, with denser concentrations near negative 3 to negative 1 and near 0 to 1. A smaller cluster appears between 8 and 9 logits. Blue dashed horizontal reference lines appear at frequency levels 5 and 10. Note: All numerical data values are approximated.

MEL-15 person-item threshold distribution map. Source: Authors’ own work

Figure 5
A histogram showing person and item threshold distribution across location logits.The histogram titled “Person-Item Threshold Distribution” includes the subtitle “Grouping Set to Interval Length of 0.20, making 100 Groups”. The horizontal axis is labeled “Location (logits)” and ranges from negative 10 to 10 with increments of 1 unit. The upper panel is labeled “PERSONS”. The left vertical axis is labeled “Frequency” and ranges from 0 to 25 with increments of 5 units. The right vertical axis shows percentages from 0.0 percent to 10.4 percent, with marked values at 2.1 percent, 4.2 percent, 6.3 percent, and 8.3 percent. A histogram of persons appears mainly between negative 4 and 3 logits, with the highest bar near negative 2 reaching about 24. A green smooth curve overlays the histogram, peaking near negative 3 at about 25 and rising again near 8 logits at about 12. Under “INFORMATION”, the value “7.65” appears. Summary statistics read “No. Mean SD” and “Total: [240], negative 0.460, 1.913”. Dashed horizontal reference lines are labeled 1.53, 3.06, 4.59, 6.12, and 7.65. The lower panel is labeled “ITEMS”. The left vertical axis is labeled “Frequency” and ranges from 0 to 10 with increments of 5 units. The right vertical axis shows percentages from 0.0 percent to 16.7 percent, with a marked value at 8.3 percent. Downward bars represent item thresholds, clustered primarily between negative 4 and 2 logits, with denser concentrations near negative 3 to negative 1 and near 0 to 1. A smaller cluster appears between 8 and 9 logits. Blue dashed horizontal reference lines appear at frequency levels 5 and 10. Note: All numerical data values are approximated.

MEL-15 person-item threshold distribution map. Source: Authors’ own work

Close Figure 5
Figure 6
A histogram showing person and item threshold distribution from negative 10 to 10 logits.The histogram titled “Person-Item Threshold Distribution” includes the subtitle “Grouping Set to Interval Length of 0.20 making 100 Groups”. The horizontal axis is labeled “Location (logits)” and ranges from negative 10 to 10 with increments of 1 unit. The upper panel is labeled “PERSONS”. The left vertical axis is labeled “Frequency” and ranges from 0 to 25 with increments of 5 units. The right vertical axis shows percentages from 0.0 percent to 10.4 percent, with marked values at 2.1 percent, 4.2 percent, 6.3 percent, 8.3 percent, and 10.4 percent. A histogram of persons is concentrated between negative 4 and 2 logits, with the tallest bar near 4 logits reaching about 25. Most bars between negative 3 and 1 range between 5 and 18. A green smooth curve overlays the histogram, peaking near negative 4 at about 25 and rising again near 8 to 9 logits at about 14. Under “INFORMATION”, the value “5.18” appears. Summary statistics read “No. Mean SD” and “Total [240] negative 0.198, 1.975”. Dashed horizontal reference lines are labeled 1.04, 2.07, 3.11, 4.15, and 5.18. The lower panel is labeled “ITEMS”. The left vertical axis is labeled “Frequency” and ranges from 0 to 10 with increments of 5 units. The right vertical axis shows percentages from 0.0 percent to 20.8 percent, with marked values at 10.4 percent and 20.8 percent. Downward bars represent item thresholds clustered mainly between negative 4 and 2 logits, with most bars reaching frequencies between 2 and 7. A separate cluster appears between 8 and 9 logits, with bars reaching about 6. Blue dashed horizontal reference lines appear at frequency levels 5 and 10. Note: All numerical data values are approximated.

MEL-self person-item threshold distribution map. Source: Authors’ own work

Figure 6
A histogram showing person and item threshold distribution from negative 10 to 10 logits.The histogram titled “Person-Item Threshold Distribution” includes the subtitle “Grouping Set to Interval Length of 0.20 making 100 Groups”. The horizontal axis is labeled “Location (logits)” and ranges from negative 10 to 10 with increments of 1 unit. The upper panel is labeled “PERSONS”. The left vertical axis is labeled “Frequency” and ranges from 0 to 25 with increments of 5 units. The right vertical axis shows percentages from 0.0 percent to 10.4 percent, with marked values at 2.1 percent, 4.2 percent, 6.3 percent, 8.3 percent, and 10.4 percent. A histogram of persons is concentrated between negative 4 and 2 logits, with the tallest bar near 4 logits reaching about 25. Most bars between negative 3 and 1 range between 5 and 18. A green smooth curve overlays the histogram, peaking near negative 4 at about 25 and rising again near 8 to 9 logits at about 14. Under “INFORMATION”, the value “5.18” appears. Summary statistics read “No. Mean SD” and “Total [240] negative 0.198, 1.975”. Dashed horizontal reference lines are labeled 1.04, 2.07, 3.11, 4.15, and 5.18. The lower panel is labeled “ITEMS”. The left vertical axis is labeled “Frequency” and ranges from 0 to 10 with increments of 5 units. The right vertical axis shows percentages from 0.0 percent to 20.8 percent, with marked values at 10.4 percent and 20.8 percent. Downward bars represent item thresholds clustered mainly between negative 4 and 2 logits, with most bars reaching frequencies between 2 and 7. A separate cluster appears between 8 and 9 logits, with bars reaching about 6. Blue dashed horizontal reference lines appear at frequency levels 5 and 10. Note: All numerical data values are approximated.

MEL-self person-item threshold distribution map. Source: Authors’ own work

Close Figure 6
Table 1

Participant characteristics of sample (N = 240)

VariableCategoryn%
Teaching sectorEarly Years/Kindergarten145.8
Primary11849.2
Secondary/High School9439.2
Tertiary/Higher Education/Other145.8
GenderFemale17673.3
Male5924.6
Non-binary/Prefer not to say52.1
Years teaching<5 years2510.4
6–10 years6627.5
11–20 years9539.6
>20 years5422.5
Number of PSTs mentored083.3
1–513656.7
6–106527.1
>103112.9
Source(s): Authors’ own work
Table 2

Summary of Rasch analysis for 5 MEL scales

MEL-15MEL-CMEL-OMEL-SMEL-T
Number of items1512121212
Chi-Square ( ≥ 0.05)0.7180.2890.0660.4810.544
Fit residual SD for items ( ≤ 1.4)0.8530.8550.6670.8900.785
Fit residual SD for persons ( ≤ 1.4)1.8711.6021.4861.4421.924
Misfit items with extreme fit residual values ( ≥ 2.5)00000
PSI ( ≥ 0.8)0.8460.8690.8000.8460.825
Disordered thresholds00000
Local dependency items ( ≥ 0.2)00000
Evidence of DIF00000
T-test (<5% and <1%)4.17% 1.25%2.65% 1.59%6.81% 3.66%4.17% 1.25%6.86% 2.94%
Source(s): Authors’ own work
Table 3

MEL-15 items

MEL-15 items
  1. How would you rate your listening skills when working with preservice teachers? Others

  2. How well do you settle disputes with preservice teachers? Others

  3. How good are you at providing time and space for preservice teachers to talk through their learning? Others

  4. How capable are you at recognising your emotions when mentoring? Self

  5. How effective are you at being flexible with preservice teachers? Self

  6. How consistent is the support you offer preservice teachers as they work through day-to-day issues? Tasks

  7. How effective are you at helping preservice teachers set goals during placement? Tasks

  8. How good are you at explaining to preservice teachers the knowledge upon which you base your teaching decisions? Tasks

  9. How capable are you at receiving feedback from preservice teachers? Tasks

  10. How good are you at encouraging preservice teachers to explain their teaching decisions? Tasks

  11. How satisfied are you with the range of resources that you provide to preservice teachers? Tasks

  12. How good are you at recognising when to give greater control and responsibility to preservice teachers? Tasks

  13. How well do you consider preservice teachers' skills when assigning teaching tasks to them? Tasks

  14. How good are you at seeking support from your colleagues when mentoring? Context

  15. How good are you at collaborating with other staff members or university staff to support preservice teachers who may be struggling with placement? Context

Source(s): Authors’ own work
Table 4

The four MEL aspect scales

MEL-context itemsMEL-others items
  1. How is your enthusiasm towards mentoring preservice teachers?

  2. How well do you introduce preservice teachers to other staff?

  3. How satisfied are you with your knowledge of your workplace expectations regarding mentoring preservice teachers?

  4. How effective are you at staying up to date with university expectations around placement?

  5. How well do you clarify issues of professionalism with preservice teachers?

  6. How effective are you at ensuring preservice teachers feel valued as team members?

  7. How good are you at ensuring you have all the necessary information from the university before placement begins?

  8. How satisfied are you with your school's approach to mentoring preservice teachers?

  9. How good are you at seeking support from school leadership when mentoring?

  10. How good are you at developing your mentoring skills through professional development opportunities?

  11. How well do your mentoring beliefs align with universities' approach to mentoring preservice teachers?

  12. How good are you at collaborating with other staff members or university staff to support preservice teachers who may be struggling with placement?

  1. How good are you at providing consistent support to preservice teachers?

  2. How would you rate your ability to “read” other people's feelings when mentoring?

  3. How effective are you at supporting a preservice teacher's emotional needs?

  4. How effectively do you share your opinion when you disagree with preservice teachers?

  5. How capable are you at identifying yourself with preservice teachers?

  6. How good are you at building professional relationships with preservice teachers?

  7. How well do you address problematic issues with preservice teachers promptly?

  8. How well do you go through the roles and responsibilities with preservice teachers at the beginning of placement?

  9. How good are you at providing time and space for preservice teachers to talk through their learning?

  10. How well do you remain calm during uncomfortable conversations with preservice teachers?

  11. How good are you at bringing up difficult conversations with preservice teachers?

  12. How effectively do you help preservice teachers navigate challenges related to work-life balance?

MEL-self itemsMEL-task items
  1. How effective are you at staying calm under pressure with preservice teachers?

  2. How effective are you at mentoring preservice teachers?

  3. How capable are you at recognising your emotions when mentoring?

  4. How good are you at helping preservice teachers develop strategies for coping with stress?

  5. How effective are you at being flexible with preservice teachers?

  6. How would you rate your ability to take responsibility when you make a mistake in front of a preservice teacher?

  7. How well do you deal with constructive feedback from preservice teachers?

  8. How would you rate your ability to recover quickly after getting annoyed or frustrated with a preservice teacher?

  9. How well do you regulate your emotions when mentoring?

  10. How well do you deal with the pressure of mentoring preservice teachers?

  11. How good are you at reflecting on your mentoring approaches?

  12. How would you rate your motivation to mentor preservice teachers?

  1. How consistent is the support you offer preservice teachers as they work through day-to-day issues?

  2. How effective are you at helping preservice teachers set goals during placement?

  3. How capable are you at helping preservice teachers connect theory to practice?

  4. What is your capacity for learning from preservice teachers?

  5. How good are you at discussing with preservice teachers what is expected of them to reach the placement expectations?

  6. How capable are you at receiving feedback from preservice teachers?

  7. How good are you at encouraging preservice teachers to explain their teaching decisions?

  8. How satisfied are you with the range of resources that you provide to preservice teachers?

  9. How good are you at recognising when to give greater control and responsibility to preservice teachers?

  10. How good are you at providing quality feedback to preservice teachers?

  11. How well do you consider preservice teachers' skills when assigning teaching tasks to them?

  12. How well do you differentiate the placement experience for each preservice teacher?

Source(s): Authors’ own work

Supplements

Supplementary data

References

Ambrosetti
,
A.
,
Knight
,
B.A.
and
Dekkers
,
J.
(
2014
), “
Maximising the potential of mentoring: a framework for pre-service teacher education
”,
Mentoring and Tutoring: Partnership in Learning
, Vol. 
22
No. 
3
, pp. 
224
-
239
, doi: .
Andrich
,
D.
(
1978
), “
A rating formulation for ordered response categories
”,
Psychometrika
, Vol. 
43
No. 
4
, pp. 
561
-
573
, doi: .
Aspfors
,
J.
and
Fransson
,
G.
(
2015
), “
Research on mentor education for mentors of newly qualified teachers: a qualitative meta-synthesis
”,
Teaching and Teacher Education
, Vol. 
48
, pp. 
75
-
86
, doi: .
Boateng
,
G.O.
,
Neilands
,
T.B.
,
Frongillo
,
E.A.
,
Melgar-Quiñonez
,
H.R.
and
Young
,
S.L.
(
2018
), “
Best practices for developing and validating scales for health, social, and behavioral research: a primer
”,
Frontiers in Public Health
, Vol. 
6
, p.
149
, doi: .
Bond
,
T.
(
1994
), “
Too many factors in factor analysis?
”,
Rasch Measurement Transactions
, Vol. 
8
No. 
1
, p.
347
.
Bond
,
T.G.
and
Fox
,
C.M.
(
2015
),
Applying the Rasch Model: Fundamental Measurement in the Human Sciences
, (3rd ed.) ,
Routledge
,
New York, NY
.
Boone
,
W.J.
and
Noltemeyer
,
A.
(
2017
), “
Rasch analysis: a primer for school psychology researchers and practitioners
”,
Cogent Education
, Vol. 
4
No. 
1
, 1416898, doi: .
Boyatzis
,
R.E.
and
McKee
,
A.
(
2005
),
Resonant Leadership: Renewing Yourself and Connecting with Others through Mindfulness, Hope, and Compassion
,
Harvard Business School Press
,
Boston, MA
.
Chen
,
Y.
,
Watson
,
R.
and
Hilton
,
A.
(
2016
), “
A review of mentorship measurement tools
”,
Nurse Education Today
, Vol. 
40
, pp. 
20
-
28
, doi: .
Clarke
,
A.
,
Collins
,
J.
,
Triggs
,
V.
,
Neilsen
,
W.
,
Augustine
,
A.
,
Coulter
,
D.
,
Cunningham
,
J.
,
Grigoriadis
,
T.
,
Hardman
,
S.
,
Hunter
,
L.
,
Kinegal
,
J.
,
Li
,
B.
,
Mah
,
J.
,
Mastin
,
K.
,
Partridge
,
D.
,
Pawer
,
L.
,
Rasoda
,
S.
,
Salbuvik
,
K.
,
Ward
,
M.
,
White
,
J.
and
Weil
,
F.
(
2012
), “
The mentoring profile inventory: an online professional development resource for cooperating teachers
”,
Teaching Education
, Vol. 
23
No. 
2
, pp. 
167
-
194
, doi: .
Clarke
,
A.
and
Mena
,
J.
(
2020
), “
An international comparative study of practicum mentors: learning about ourselves by learning about others
”,
Teaching and Teacher Education
, Vol. 
90
, 103026, doi: .
Crawford
,
L.M.
,
Randolph
,
J.J.
and
Yob
,
I.M.
(
2014
), “
Theoretical development, factorial validity, and reliability of the online graduate mentoring scale
”,
Mentoring & Tutoring: Partnership in Learning
, Vol. 
22
No. 
1
, pp. 
20
-
37
, doi: .
Delgado
,
C.
,
Upton
,
D.
,
Ranse
,
K.
,
Furness
,
T.
and
Foster
,
K.
(
2017
), “
Nurses' resilience and the emotional labour of nursing work: an integrative review of empirical literature
”,
International Journal of Nursing Studies
, Vol. 
70
, pp. 
71
-
88
, doi: .
DeVellis
,
R.F.
and
Thorpe
,
C.T.
(
2021
),
Scale Development: Theory and Applications
, (5th ed.) ,
Sage Publications
,
Thousand Oaks, CA
.
Fleming
,
M.
,
House
,
S.
,
Hanson
,
V.S.
,
Yu
,
L.
,
Garbutt
,
J.
,
McGee
,
R.
,
Kroenke
,
K.
,
Abedin
,
Z.
and
Rubio
,
D.M.
(
2013
), “
The mentoring competency assessment: validation of a new instrument to evaluate skills of research mentors
”,
Academic Medicine
, Vol. 
88
No. 
7
, pp. 
1002
-
1008
, doi: .
Garza
,
R.
,
Reynosa
,
R.J.
,
Werner
,
P.H.
,
Duchaine
,
E.L.
and
Harter
,
R.A.
(
2019
), “
Developing a mentoring framework through the examination of mentoring paradigms in a teacher residency program
”,
Australian Journal of Teacher Education
, Vol. 
44
No. 
3
, pp. 
1
-
22
, doi: .
Gillett-Swan
,
J.
and
Grant-Smith
,
D.
(
2020
), “
Addressing mentor wellbeing in practicum placement mentoring relationships in initial teacher education
”,
International Journal of Mentoring and Coaching in Education
, Vol. 
9
No. 
4
, pp. 
393
-
409
, doi: .
Goleman
,
D.
(
1996
),
Emotional Intelligence
,
Bloomsbury
,
London
.
Goodwin
,
A.L.
,
Chen Lee
,
C.
and
Pratt
,
S.
(
2021
), “
The poetic humanity of teacher education: holistic mentoring for beginning teachers
”,
Professional Development in Education
, Vol. 
49
No. 
4
, pp. 
707
-
724
, doi: .
Gross
,
J.J.
(
1998
), “
The emerging field of emotion regulation: an integrative review
”,
Review of General Psychology
, Vol. 
2
No. 
3
, pp. 
271
-
299
, doi: .
Hairon
,
S.
,
Loh
,
S.H.
,
Lim
,
S.P.
,
Govindani
,
S.N.
,
Tan
,
J.K.T.
and
Tay
,
E.C.J.
(
2020
), “
Structured mentoring: principles for effective mentoring
”,
Educational Research for Policy and Practice
, Vol. 
19
No. 
2
, pp. 
105
-
123
, doi: .
Hobson
,
A.J.
and
Maxwell
,
B.
(
2020
), “
Mentoring substructures and superstructures: an extension and reconceptualisation of the architecture for teacher mentoring
”,
Journal of Education for Teaching
, Vol. 
46
No. 
2
, pp. 
184
-
206
, doi: .
Hobson
,
A.
,
Ashby
,
P.
,
Malderez
,
A.
and
Tomlinson
,
P.
(
2009
), “
Mentoring beginning teachers: what we know and what we don't
”,
Teaching and Teacher Education
, Vol. 
25
No. 
1
, pp. 
207
-
216
, doi: .
Hochschild
,
A.R.
(
1983
),
The Managed Heart: Commercialization of Human Feeling
,
University of California Press
,
Berkeley, CA
.
Hudson
,
P.
,
Skamp
,
K.
and
Brooks
,
L.
(
2005
), “
Development of an instrument: mentoring for effective primary science teaching
”,
Science Education
, Vol. 
89
No. 
4
, pp. 
657
-
674
, doi: .
Kariou
,
A.
,
Koutsimani
,
P.
,
Montgomery
,
A.
and
Lainidi
,
O.
(
2021
), “
Emotional labor and burnout among teachers: a systematic review
”,
International Journal of Environmental Research and Public Health
, Vol. 
18
No. 
23
, 12760, doi: .
Koç
,
E.M.
(
2011
), “
Development of mentor teacher role inventory
”,
European Journal of Teacher Education
, Vol. 
34
No. 
2
, pp. 
193
-
208
, doi: .
Le Cornu
,
R.
(
2013
), “
Building early career teacher resilience: the role of relationships
”,
Australian Journal of Teacher Education
, Vol. 
38
No. 
4
, pp. 
1
-
16
, doi: .
Linacre
,
J.M.
(
1994
), “
Sample size and item calibration stability
”,
Rasch Measurement Transactions
, Vol. 
7
No. 
4
, p.
328
.
Loosveld
,
L.M.
,
Van Gerven
,
P.W.M.
,
Essen
,
E.W.
,
Vanassche
,
E.
and
Artino
,
A.R.
(
2021
), “
MERIT: a mentor reflection instrument for identifying the personal interpretative framework
”,
BMC Medical Education
, Vol. 
21
No. 
1
, p.
144
, doi: .
Mayer
,
J.D.
and
Salovey
,
P.
(
1997
), “What is emotional intelligence?”, in
Salovey
,
P.
and
Sluyter
,
D.
(Eds),
Emotional Development and Emotional Intelligence: Educational Implications
,
Basic Books
,
New York, NY
, pp. 
3
-
31
.
Medvedev
,
O.N.
and
Krägeloh
,
C.U.
(
2022
), “Rasch measurement model”, in
Handbook of Assessment in Mindfulness Research
,
Springer International Publishing
,
Cham
, pp. 
1
-
18
.
Menter
,
I.
(
2018
), “Teacher education in a crucible of change”, in
Innovation and Accountability in Teacher Education: Setting Directions for New Cultures in Teacher Education
,
Springer
,
Cham
, pp. 
313
-
325
.
Nuis
,
W.
,
Segers
,
M.
and
Beausaert
,
S.
(
2024
), “
Measuring mentoring in employability-oriented higher education programs: scale development and validation
”,
Higher Education
, Vol. 
87
No. 
4
, pp. 
899
-
921
, doi: .
O'Connor
,
K.E.
(
2008
), “
‘You choose to care’: teachers, emotions and professional identity
”,
Teaching and Teacher Education
, Vol. 
24
No. 
1
, pp. 
117
-
126
, doi: .
Orland-Barak
,
L.
and
Wang
,
J.
(
2021
), “
Teacher mentoring in service of preservice teachers' learning to teach: conceptual bases, characteristics, and challenges for teacher education reform
”,
Journal of Teacher Education
, Vol. 
72
No. 
1
, pp. 
86
-
99
, doi: .
O'Donovan
,
R.
and
Sum
,
N.
(
2024
), “
Investigating the victorian government schools’ parent opinion survey validity: pursuing a dependable measure of parent sentiment
”,
Australian Educational Researcher
, Vol. 
51
No. 
1
, pp. 
423
-
443
, doi: .
Pallant
,
J.
(
2017
), “
Scale development, Rasch analysis and item response theory
”,
Course notes, Australian Consortium for Social and Political Research Inc, University of Melbourne
.
Pallant
,
J.F.
and
Tennant
,
A.
(
2007
), “
An introduction to the Rasch measurement model: an example using the Hospital Anxiety and Depression Scale (HADS)
”,
British Journal of Clinical Psychology
, Vol. 
46
No. 
1
, pp. 
1
-
18
, doi: .
Philipp
,
A.
and
Schüpbach
,
H.
(
2010
), “
Longitudinal effects of emotional labour on emotional exhaustion and dedication of teachers
”,
Journal of Occupational Health Psychology
, Vol. 
15
No. 
4
, pp.
494
-
504
, doi: .
Relihan
,
M.C.
and
O'Donovan
,
R.
(
2024
), “
Putting the cart behind the horse: conceptualising the ‘emotionality’ of mentoring in initial teacher education
”,
International Journal of Mentoring and Coaching in Education
, Vol. 
13
No. 
4
, pp. 
511
-
526
, doi: .
Schatz Oppenheimer
,
O.
and
Goldenberg
,
J.
(
2024
), “
The impact of professional mentoring on mentors of novice-teachers
”,
International Journal of Mentoring and Coaching in Education
, Vol. 
13
No. 
1
, pp. 
122
-
141
, doi: .
Simpson
,
A.
,
Day
,
C.
,
Goulding
,
J.
and
Asha
,
J.
(
2022
), “
Australian teachers' perceptions of effectiveness in a performative culture
”,
Teaching and Teacher Education
, Vol. 
109
, 103542, doi: .
Stacey
,
M.
,
Talbot
,
D.
,
Buchanan
,
J.
and
Mayer
,
D.
(
2020
), “
The development of an Australian teacher performance assessment: lessons from the international literature
”,
Asia-Pacific Journal of Teacher Education
, Vol. 
48
No. 
5
, pp. 
508
-
519
, doi: .
Tennant
,
A.
and
Conaghan
,
P.G.
(
2007
), “
The Rasch measurement model in rheumatology: what is it and why use it? When should it be applied, and what should one look for in a Rasch paper?
”,
Arthritis & Rheumatism
, Vol. 
57
No. 
8
, pp. 
1358
-
1362
, doi: .
Tickell
,
R.M.
and
Klassen
,
R.M.
(
2024
), “
Developing the teacher mentoring self-efficacy scale (TMSES) using the delphi method and exploratory factor analysis
”,
Teaching and Teacher Education
, Vol. 
139
, 104452, doi: .
Tourangeau
,
R.
,
Rips
,
L.J.
and
Rasinski
,
K.
(
2000
),
The Psychology of Survey Response
,
Cambridge University Press
,
Cambridge
.
Ware
,
J.E.
, Jr.
and
Sherbourne
,
C.D.
(
1992
), “
The MOS 36-item short-form health survey (SF-36). I. Conceptual framework and item selection
”,
Medical Care
, Vol. 
30
No. 
6
, pp.
473
-
483
.
Waugh
,
R.F.
(
2002
), “
Measuring self-reported studying and learning for university students: linking attitudes and behaviours on the same scale
”,
British Journal of Educational Psychology
, Vol. 
72
No. 
4
, pp. 
573
-
604
, doi: .
Wright
,
B.D.
(
1996
), “
Comparing Rasch measurement and factor analysis
”,
Structural Equation Modeling: A Multidisciplinary Journal
, Vol. 
3
No. 
1
, pp. 
3
-
24
, doi: .
Wright
,
B.D.
and
Masters
,
G.N.
(
1982
),
Rating Scale Analysis: Rasch Measurement
,
Mesa Press
,
Chicago, IL
.
Wright
,
B.D.
and
Mok
,
M.M.
(
2004
), “
An overview of the family of Rasch measurement models
”,
Introduction to Rasch Measurement
, Vol. 
1
No. 
1
, pp. 
1
-
24
.
Zembylas
,
M.
(
2005
), “
Discursive practices, genealogies, and emotional rules: a poststructuralist view on emotion and identity in teaching
”,
Teaching and Teacher Education
, Vol. 
21
No. 
8
, pp. 
935
-
948
, doi: .
Andrich
,
D.
,
Lyne
,
A.
,
Sheridan
,
B.
and
Luo
,
G.
(
2010
),
RUMM2030+ [Computer Software]
,
RUMM Laboratory Pty
,
Perth
,
available at:
 https://www.rummlab.com.au (
accessed
 October 2024).
Nesje
,
K.
and
Lejonberg
,
E.
(
2022
), “
Tools for the school-based mentoring of pre-service teachers: a scoping review
”,
Teaching and Teacher Education
, Vol. 
111
, 103609, doi: .
Rasch
,
G.
(
1960
),
Studies in Mathematical Psychology: I. Probabilistic Models for Some Intelligence and Attainment Tests
,
Nielsen and Lydiche
,
Copenhagen
.

Languages

or Create an Account

Close subscription notice
Close access options