

This paper aims to replicate a model already proven in previous research in this field. This will make it possible to explain the possible relationships that may occur among the motivations, perceived value, satisfaction and loyalty of the tourist towards the Alhambra and Generalife inscribed as World Heritage Site (WHS) in 1984.
From a dataset containing 1,612 surveys, a model a model based on structural equations has been carried out through SmartPLS software, focus the analysis on the model dependent variables’ predictive power, as well as the size of the effect and the statistical inference of the structural relationships.
The main conclusions include the influence of perceived value on satisfaction as well as the influence of the latter on loyalty. it is remarkable the effect that the perceived value has on satisfaction, and satisfaction on loyalty. This implies that a positive assessment of world heritage destinations leads a subsequent loyalty to them.
The results obtained in this research can be used as a starting point for the establishment of new strategies for the promotion of the destination in terms of tourism and heritage.
The inclusion in the list of WHS is recognition in terms of material and historical quality, as well as a stimulus for tourism because it increases the number of visits to the destination. Several studies carried out in these types of destinations have shown the existence of a relationship between motivations, perceived value, satisfaction and loyalty. However, there are no previous studies carried out in the Alhambra and the Generalife that sustain this relationship. This work makes a contribution that completes the academic literature on the study of the emotional bonds between the historical and monumental heritage and the tourist who visits it and its behaviour.
Introduction
Any inscription in UNESCO as a World Heritage Site (WHS) is associated with an increase in added value, recognition and a duty to raise awareness on the part of local authorities and local conservation population for future generations (UNESCO, 1972). This inclusion is an incentive from the tourist perspective (Adie, 2017), as it supposes a recognition and a new attraction for all types of tourists and more specifically, for tourists notably interested in culture and heritage (Lin et al., 2014). The motivations of tourists influence their satisfaction with the destination visited. Likewise, the perceived value also influences the satisfaction and loyalty of tourists to the destination. So, satisfaction also ends up influencing loyalty (Almeida-Santana and Moreno-Gil, 2018; Prados-Peña et al., 2019; González-Rodríguez et al., 2020). Therefore, it is necessary the analysis of the motivations of tourists when visiting a certain place, additionally to the WHS title because this knowledge will provide information for the construction of a solid heritage tourist offer that satisfies the needs of tourists and visitors, taking into account that motivations are shaped as an eminently dynamic process (Pearce, 1982). The latter is reinforced by the fact that the city of Granada has two WHS places: The Alhambra and Generalife, in 1984; and the Albaicín, in 1994.
This research aims to replicate a model already proven in previous research in this field. This will make it possible to explain the possible relationships that may occur among the motivations, perceived value, satisfaction and loyalty of the tourist towards the Alhambra and the Generalife. Therefore, a section is approached with a review of the literature of the different compounds that make up the model and give theoretical support to the different hypotheses raised; after this, the methodology used in this study is based on the use of a quantitative tool through structural equations. equations. Next, the analysis of data and results, where a preliminary analysis will be addressed, as well as the sociodemographic profile of the sample and the analysis of reliability and validity of both the measurement model and the structural model, to continue with the discussion of the results and conclusions, limitations and future lines of research.
Literature review
Motivations and perceived value
Motivations can be defined as those forces that drive the actions of individuals (Schiffman and Kanuk, 2009), that is, an analysis of the motivations that tourists have when deciding on a trip seems essential to face the planning of the destination. More and more motivations exist in tourists that make them travel to a certain place. Moreover, culture continues to be one of these (Correia et al., 2013). Currently, there is growing competition among destinations where there is an important and extensive heritage of a patrimonial nature, which implies that knowledge of the motivations of tourists (whether national or foreign) is essential for the conformation of products and tourism offers focused on heritage and culture (Remoaldo et al., 2014).
Following Yolal et al. (2012), three referential frameworks are established around motivational analysis: firstly, the escaping seekind dichotomy (Iso-Ahola, 1982); secondly, the Travel Creer Ladder (Pearce and Lee, 2005); and thirdly, the pull–push model (Dann, 1977; Crompton, 1979), being the latter the most widely used and known in the scientific literature (Antón et al., 2014), where the push factors are those that can affect and influence the decision to go on a trip (e.g. relaxation, entertainment and/or escape), whereas the pull factors are those that make up the final decision on the choice of a destination (e.g. landscapes, culture, history and/or climate). Consequently, push factors are considered precedents of pull factors (Sato et al., 2018).
On the other hand, the perceived value can be defined as the general assessment of the service, basing this evaluation on what the client receives (benefits) and what it gives (costs) (Hellier et al., 2003). The attributes of a destination become essential for the attraction of tourists (Heung and Quf, 2000), which means that the identification of these attributes is fundamental for the conformation of the destination as a tourist destination and, therefore, for the attraction of tourists (Qu et al., 2011). The perceived value can be divided into two groups: firstly, a functional value where aspects such as quality, the services received or the value for money of the destination are taken into account and, secondly, a symbolic value where they have a place aesthetic, emotional and social elements (Chen and Hu, 2010). From a long-term perspective, the perceived value is formed as an angular element to understand the satisfaction of the tourists (Lai et al., 2009) and contribute to their final loyalty (Chi and Qu, 2008; Özdemir et al., 2012). That is, the perceived value of the destination by tourists influences their satisfaction, so it may contribute to the tourist’s loyalty to the destination. Prados-Peña et al. (2019) determine as two antecedents of loyalty the attachment to the place and the perceived value. González-Rodríguez et al. (2020) highlight the importance of the quality of the experience and emotions in visitor satisfaction because heritage tourism has the potential to elicit emotional and experimental responses from visitors.
Satisfaction
Satisfaction is established as an important reference variable for the management of a destination (Prayag et al., 2017). Satisfaction refers to an emotional state of mind after a certain experience (Williams and Soutar, 2009). Satisfaction is closely related to perceived quality or value, so this value could be considered as an antecedent of satisfaction (Del Bosque and Martín, 2008). Similarly, satisfaction can be considered as an antecedent of future behaviours or loyalty towards a certain destination or service (Chi and Qu, 2008; Yuksel et al., 2010; López-Guzmán et al., 2018; Kencana et al., 2019). Authors such as Lee et al. (2007) establish that this satisfaction is conformed as a psychological result derived from a certain experience, consequently appearing the phenomenon of dissatisfaction when the expectations created do not match with those lived. From a tourist perspective, satisfaction is formed as a construct, a relevant variable for the survival of a company, because of subsequent patterns of repetition of consumption (Oviedo-García et al., 2016), because a satisfied customer will be more likely to consume said service (Chi and Qu, 2008).
In a context focused on heritage and culture, numerous studies have concluded a positive influence of the motivation in satisfaction both directly (Schofield and Thompson; 2007; Correia et al., 2008; Battour et al., 2012; Lee and Hsu, 2013) and indirectly through variables such as visitor experience, the commitment of the visitor or the image of the destination (Su et al., 2020).
In the results obtained in their study, Prayag et al. (2017) point out the emotions experienced by tourists as antecedents of the general image perceived, as well as the assessment of satisfaction and how the general image perceived by them may have a positive effect on tourist satisfaction. On the other hand, other studies (López-Guzmán et al., 2019; González-Rodríguez et al., 2020; Menor-Campos et al., 2020; Pérez-Gálvez et al., 2021; Mahadevan and Zhang, 2021) highlight that both emotional experience and cultural motivation are factors that influence and condition tourist satisfaction at WHS. In addition, they conclude that this is accentuated among those foreign tourists who have greater emotional perception and cultural motivation before visiting the historical heritage. Thus, the positive influence between perceived value and satisfaction has been validated (Oh, 1999; Petrick and Backman, 2002a; Gallarza and Gil-Saura, 2006; Lee et al., 2007; Bajs, 2015; Rasoolimanesh et al., 2016).
Following the previous literature, hypotheses are proposed as follows:
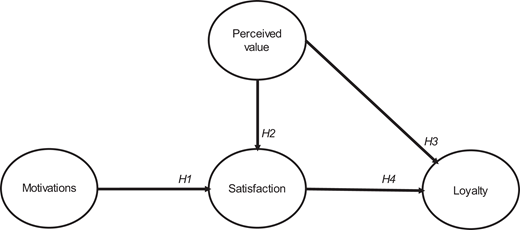
Motivations positively influence tourist satisfaction in a WHS.
Perceived value positively influences tourist satisfaction in a WHS.
Loyalty
The concept of loyalty can be defined from a double perspective: an attitudinal through the maintenance of the relationship in the future and a behavioural one, through repetition patterns (Bowen and Chen, 2001; Chen and Chen, 2010; Sato et al., 2018). Various studies have addressed the different predecessor variables of loyalty, identifying satisfaction (Luarn and Lin, 2003; Antón et al., 2014) and perceived value (Ravald and Grönroos, 1996; Lee et al., 2010) as predecessor variables. Even Kencana et al. (2019) take into consideration external and internal motivations as antecedents to loyalty and satisfaction as a mediating construct. Using a partial least squares (PLS) model, they point out that both internal and external motivations affect tourist satisfaction, with external motivations significantly affecting visitor loyalty.
The intensity of loyalty concerning a certain place is identified around behavioural intentions, defined as the intentions to visit that place again or through the willingness to recommend the place or word of mouth (Chen and Tsai, 2007). In this sense, Bergel and Brock (2019) focus their study on the analysis of this behaviour, confirming its positive influence on generating greater future loyalty.
Various studies establish a direct relationship between satisfaction and loyalty in the field of tourism (Chen and Tsai, 2007; Yuksel and Yuksel, 2007; Grappi and Montanari, 2011; Prayag et al., 2013; Wan and Chan, 2013; Akhoondnejad, 2016; Rasoolimanesh et al., 2019) or with perceived value (Gallarza and Gil-Saura, 2006; Chen and Chen, 2010; Bajs, 2015). More focused on studies related to WHS, the positive influence of satisfaction on the loyalty of tourists towards these destinations has also been proved (Prayag, et al., 2013; Rasoolimanesh et al., 2019 Xu et al.,2021).
On the other hand, perceived value has a direct effect on satisfaction, consequently influences loyalty, so an indirect influence of perceived value on loyalty could be assumed (Lee et al., 2007; Mai et al., 2019). Satisfaction, along with other variables, such as quality of service and perceived value, have become the three most important antecedents that affect the behavioural intentions of tourists (Baker and Crompton, 2000; Petrick and Backman, 2002b; Petrick, 2004).
Following the previous literature, hypotheses are proposed as follows:
Perceived value positively influences tourist loyalty in a WHS.
Tourist satisfaction influences tourist loyalty in a WHS.
The theoretical structural model is presented in Figure 1.
Methodology
Sample and sample design
A quantitative methodology was applied through a structured questionnaire based on previous research. That is, all the questions and items raised in the questionnaire were taken from previous studies, adapting them to the needs of the fieldwork carried out, to guarantee the validity of the survey (McKercher, 2002; Poria et al., 2003; Correia et al., 2013; Remoaldo et al., 2014; López-Guzmán et al., 2018). This research has used convenience sampling of data collection and sample selection with a very low rejection rate. The questionnaire was addressed to a representative sample of visitors to the Alhambra and Generalife, both tourists and excursionists. In this sense, the Alhambra and the Generalife complex in Granada have been increasing the number of visitors every year (except for 2020 and 2021 because of the COVID-19 pandemic that still affects the entire world population). The evolution of visitors to the Alhambra and the Generalife complex is presented in Table 1. The period presented ranges from 2010 to 2021, being the last year a provisional figure. It is observed that the number of visitors rose year by year, with a total increase of 33.65% from 2010 to 2019.
Visitors to the Alhambra and Generalife complex in Granada (2010–2021)
| Year | Visitors | Variation (%) |
|---|---|---|
| 2021* | 1,178,226 | 51.85 |
| 2020 | 775,885 | −71.95 |
| 2019 | 2,766,887 | 0.12 |
| 2018 | 2,763,500 | 2.11 |
| 2017 | 2,706,289 | 4.47 |
| 2016 | 2,590,260 | 4.68 |
| 2015 | 2,474,231 | 2.98 |
| 2014 | 2,402,473 | 3.77 |
| 2013 | 2,315,017 | 0.18 |
| 2012 | 2,310,764 | 6.46 |
| 2011 | 2,170,437 | 4.84 |
| 2010 | 2,070,098 | – |
During the data collection period, which ranged from April to August 2019, a total of 1,683 questionnaires were obtained from which after a debugging process, only a total of 1,612 were found valid. These 71 questionnaires left were eliminated because they had a high number of unanswered questions and items, which prevented their incorporation into the database and statistical analysis. The total number of surveys collected was much higher than the initial estimates calculated for a solid sample size. Therefore, considering the 1,612 valid surveys were obtained and based on the 2,766,887 visitors to the Alhambra and the Generalife registered in 2019, as a guideline (being a convenience sampling), the sampling error for a confidence level of 95% would be about ±2.44%, in the case of having used a simple random sampling. Before starting the survey process, a pre-test of 50 surveys was carried out to verify that the questionnaire had no misinterpretations and that it was properly translated. The questionnaire was offered both in English and in Spanish, to try to cover as many answers as possible. Additionally, the questionnaire was distributed in different places of the Alhambra and Generalife, times and days, to cover the greatest possible diversity of visitors.
The questionnaire was structured in three differentiated parts: firstly, polytomous questions were addressed concerning issues related to frequency, type of accommodation and the estimated budget per person during the stay. Secondly, a section where questions formulated on a five-point Likert scale were addressed (where 1 referred to “little/very little/strongly disagree” and 5 referred to “a lot/very high/strongly agree”) on aspects related to motivations, perceived value, satisfaction and loyalty towards the WHS; finally, the third section refers to polytomous questions related to the sociodemographic profile, where questions related to gender, age, educational level, professional activity or income were addressed.
Statistical analysis
For a preliminary data analysis, the reliability analysis of the scale and the tabulation of the questionnaires obtained, SPSS 24.0 software was used, whereas for the development of the model software for the development of structural equations based on variance was used, as SmartPLS version 3.3.3. This method is thoroughly used in the field of social sciences (Martín-Ruiz et al., 2010; do Valle and Assaker, 2015; Ali et al., 2018). Because of the explanatory nature of the model (Henseler, 2018), the focus of the analysis of the structural model is on the predictive power of the dependent variables, as well as the size of the effect and the statistical inference of the structural relationships.
Data analysis and results
Preliminary data analysis
The different indicators that make up the model variables are presented in Table 2 together with the mean, standard deviation and associated Kolmogorov–Smirnov test (K–S test) of normality.
Preliminary data analysis
| Variable/indicators | Mean | SD | Normality (K–S test) |
|---|---|---|---|
| Motivations | |||
| MO1 – Know its historical and monumental wealth | 4.33 | 0.963 | 0.000 C |
| MO2 – Deepen knowledge about Heritage | 3.36 | 1.249 | 0.000 C |
| MO3 – Attend cultural events: exhibition, festival and/or concerts | 2.27 | 1.315 | 0.000 C |
| MO4 – Taste its gastronomy | 3.61 | 1.280 | 0.000 C |
| MO5 – Visiting family or friends | 1.80 | 1.468 | 0.000 C |
| MO6 – Disconnect from the everyday life | 3.90 | 1.305 | 0.000 C |
| MO7 – The desire to know new places | 4.26 | 1.147 | 0.000 C |
| MO8 – The proximity to my place of residence | 2.08 | 1.404 | 0.000 C |
| MO9 – The fame and tourist reputation of the city | 3.76 | 1.287 | 0.000 C |
| MO10 – Work or business visit (meeting and/or congresses) | 1.27 | 0.855 | 0.000 C |
| MO11 – Another visit of my tourist itinerary | 2.91 | 1.498 | 0.000 C |
| MO12 – Being an affordable tourist destination | 3.29 | 1.376 | 0.000 C |
| MO13 – Learning Spanish | 1.64 | 1.191 | 0.000 C |
| Perceived value | |||
| VP1 – The conservation of the monumental and artistic heritage | 4.33 | 0.856 | 0.000 C |
| VP2 – The beauty of the city | 4.54 | 0.693 | 0.000 C |
| VP3 – Accessibility to emblematic buildings and monuments | 3.79 | 1.082 | 0.000 C |
| VP4 – Tourist information | 3.47 | 1.141 | 0.000 C |
| VP5 – Service and quality of tourist accommodation | 3.65 | 1.136 | 0.000 C |
| VP6 – Service and quality of restaurants and taverns | 3.83 | 1.047 | 0.000 C |
| VP7 – Service and quality of the tour guides | 3.09 | 1.409 | 0.000 C |
| VP8 – Diversity and quality of local gastronomy | 3.87 | 1.085 | 0.000 C |
| VP9 – Opportunity to buy handicrafts | 3.58 | 1.242 | 0.000 C |
| VP10 – Complementary leisure offer | 3.08 | 1.279 | 0.000 C |
| VP11 – Citizen security | 3.79 | 1.094 | 0.000 C |
| VP12 – Cleaning of the city | 3.91 | 1.024 | 0.000 C |
| VP13 – Residents’ hospitality | 3.87 | 1.086 | 0.000 C |
| VP14 – Public transport services | 3.48 | 1.272 | 0.000 C |
| VP15 – Value for money of this tourist destination | 3.90 | 0.998 | 0.000 C |
| Satisfaction | |||
| SA1 – I made the right decision visiting Granada | 4.63 | 0.698 | 0.000 C |
| SA2 – I have a great level of satisfaction with Granada | 4.43 | 0.771 | 0.000 C |
| Loyalty | |||
| LD1 – I recommend its visit if someone asked me for advice | 4.59 | 0.710 | 0.000 C |
| LD2 – I will encourage my family and/or friends to visit the city | 4.50 | 0.819 | 0.000 C |
| LD3 – After my experience, I think I will come back again | 4.23 | 1.066 | 0.000 C |
Note:
CLilliefors’ significance correction
As has been displayed in Table 2, the averages of the indicators related to the variables’ satisfaction and loyalty present values above 4.2 points out of 5, which indicates a high degree of satisfaction and loyalty of the tourist who visits this heritage place. On the other hand, concerning the motivations and perceived value, indicators such as “know its historical and monumental wealth” and “the desire to know new places” stand out as the most valued motivations (with 4.33 and 4.26 points out of 5, respectively). Regarding the perceived value, “the beauty of the city” and “the conservation of the monumental and artistic heritage” have been the best-valued indicators or items, with average scores of 4.54 and 4.33 points out of 5, respectively. Finally, the K–S normality test has shown that the distribution of the indicators does not follow a normal distribution. The research presented has an explanatory character (Henseler, 2018), where the focus of attention is placed on the contrast of hypotheses previously validated in the literature and on the predictive power based on the coefficient of determination, supported by the effect size on the endogenous variables that comprise the model.
As stated in the literature review, the motivations of tourists influence their satisfaction with the destination visited. Likewise, the perceived value also influences the satisfaction of tourists to the destination. In this sense, tourists are attracted to destinations by the attributes of their goods or services, so that when their perceived value exceeds their expectations, they will be satisfied and otherwise dissatisfied. To achieve the general satisfaction of tourists with the destination, an appropriate combination of the attributes of the destination will be necessary. Thus, a tourist may have high general satisfaction towards the destination, but at the same time, he/she may have registered a low satisfaction regarding some of the attributes of the goods or services of the same. In no case, that fact will be a decisive condition for this tourist to be dissatisfied because the general satisfaction will depend on the combination of several attributes (Chi and Qu, 2008; Özdemir et al., 2012; Bajs, 2015; Rasoolimanesh et al., 2016).
Sociodemographic profile of the sample
The sociodemographic profile of the sample is presented in Table 3. It is worth highlighting the predominance of women (59.5% of the total). The most representative age group is the one under 30 years of age, which, added to the age range between 30 and 39 years, represents more than 70% of the total sample. Regarding the educational level, a majority (around three-quarters of the total sample) declares that have university or higher education, with the most represented profession being full-time wage employee (38.5%), student (23.4%) and public employee (9.7%). Concerning the level of income, most of the sample corresponds to a type of tourist with a medium–high income level because 22.4% of the total respondents have declared a monthly income of more than €1,501, whereas 27.6% declare income over €3,500. Finally, of the total respondents, 47.8% were Spanish, followed by the US citizens (6.7%), Germans (6.0%) and French (5.2%), among other nationalities.
Sociodemographic profile of the sample
| Variable | (%) | Variable | (%) |
|---|---|---|---|
| Gender | Age | ||
| Men | 40.5 | Less than 30 years old | 48.5 |
| Women | 59.5 | 30–39 years old | 24.1 |
| 41–49 years old | 12.7 | ||
| 50–59 years old | 10.1 | ||
| More than 60 years old | 4.6 | ||
| Monthly income | Educational level | ||
| Less than €700 | 5.4 | Primary education | 4.9 |
| €700–1,000 | 8.7 | Secondary education | 19.0 |
| €1,001–1,500 | 18.8 | University graduate | 36.3 |
| €1,501–2,500 | 22.4 | Masters/PhD | 39.8 |
| €2,501–3,500 | 17.1 | ||
| More than €3,500 | 27.6 | ||
| Country | Professional activity | ||
| Spain | 47.8 | Full-time wage employee | 38.5 |
| the USA | 6.7 | Student | 23.4 |
| Germany | 6.0 | Public employee | 9.7 |
| France | 5.2 | Liberal professional/managerial | 7.3 |
| Italy | 4.6 | Part-time wage employee | 5.3 |
| the UK | 4.1 | Company owner | 4.7 |
| Other | 25.6 | Self-employed | 4.6 |
| Unemployed | 3.3 | ||
| Retired | 2.6 | ||
| Housework | 0.8 |
Reliability and validity analysis of the measurement model
This analysis is supported both by the individual analysis of the composites, whether Mode A or Mode B, as well as at the composite level. In the first case, the indicators of Mode A composites must present loads greater than 0.707 (Ali et al., 2018), although in the initial stages of research, lower loads may be accepted, never less than 0.4 (Hair et al., 2011). In the present study, several indicators were discarded because of their loads being lower than 0.707 and their elimination improved reliability at the construct or composite level. Regarding the indicators of the Mode B composites, they are evaluated through their weights (Chin, 2010) without discarding any because as indicated by Roberts and Thatcher (2009, p. 30), “even if an item contributes little to the explained variance in a formative construct, it should be included in the measurement model.” At the level of Mode B composites, their indicators are not assumed to be correlated (as is the case with Mode A composites), so the variance inflation factor test (VIF) is applied (Diamantopoulos and Siguaw, 2006), where values higher than 3.3 suppose the existence of multicollinearity (Roberts and Thatcher, 2009). The results of the reliability and validity of the individual measurement model both at the level of Mode A composites and Mode B composites are presented in Table 4.
Reliability and validity of the measurement model
| Variable/indicators | Loads (Sig.) | Weights (Sig.) | VIF |
|---|---|---|---|
| Motivations | |||
| MO1 – Know its historical and monumental wealth | 0.412 (0.000) | 1.37 | |
| MO2 – Deepen knowledge about Heritage | 0.263 (0.000) | 1.348 | |
| MO3 – Attend cultural events: exhibition, festival and/or concerts | 0.033 (0.319) | 1.180 | |
| MO4 – Taste its gastronomy | 0.216 (0.000) | 1.139 | |
| MO5 – Visiting family or friends | 0.233 (0.000) | 1.194 | |
| MO6 – Disconnect from the everyday life | 0.218 (0.001) | 1.201 | |
| MO7 – The desire to know new places | 0.328 (0.000) | 1.210 | |
| MO8 – The proximity to my place of residence | −0.040 (0.285) | 1.181 | |
| MO9 – The fame and tourist reputation of the city | 0.213 (0.000) | 1.258 | |
| MO10 – Work or business visit (meeting and/or congresses) | −0.202 (0.002) | 1.125 | |
| MO11 – Another visit of my tourist itinerary | −0.070 (0.167) | 1.242 | |
| MO12 – Being an affordable tourist destination | 0.145 (0.020) | 1.351 | |
| MO13 – Learning Spanish | −0.081 (0.124) | 1.068 | |
| Perceived value | |||
| VP5 – Service and quality of tourist accommodation | 0.661 (0.000) | ||
| VP6 – Service and quality of restaurants and taverns | 0.793 (0.000) | ||
| VP8 – Diversity and quality of local gastronomy | 0.705 (0.000) | ||
| VP13 – Residents’ hospitality | 0.665 (0.000) | ||
| VP15 – Value for money of this tourist destination | 0.706 (0.000) | ||
| Satisfaction | |||
| SA1 – I made the right decision visiting Granada | 0.909 (0.000) | ||
| SA2 – I have a great level of satisfaction with Granada | 0.916 (0.000) | ||
| Loyalty | |||
| LD1 – I recommend its visit if someone asked me for advice | 0.903 (0.000) | ||
| LD2 – I will encourage my family and/or friends to visit the city | 0.900 (0.000) | ||
| LD3 – After my experience, I think I will come back again | 0.754 (0.000) |
At the construct level, Mode A composites are evaluated through the Dijkstra–Henseler composite reliability (rho_A) and the Dillon–Goldstein composite reliability (rho_C), where values greater than 0.7 (Henseler et al., 2016) point that the accepted lower limit for the existence of such reliability at the construct level. Authors such as Dijkstra and Henseler (2015) state that rho_A is the only consistently reliable measure. On the other hand, convergent validity is tested through the average variance extracted (AVE), with validity at values greater than or equal to 0.5 (Fornell and Larcker, 1981).
To check the difference of a composite from the rest of that make up the model, discriminant validity is used. In this sense, the heterotrait–monotrait (HT–MT) ratio is the measure that best detects the lack of discriminant validity (Henseler et al., 2016). For values higher than 0.90 of this ratio, there would be no discriminant validity (Gold et al., 2001). Through bootstrapping, it has also been verified that the HT–MT ratio values are significantly different from 1, therefore existing discriminant validity in the model presented. The reliability and validity analysis at the construct level are presented in Tables 5 and 6.
Reliability and validity of the measurement model at the construct level
| Composites | rho_C | rho_A | AVE |
|---|---|---|---|
| Loyalty | 0.890 | 0.848 | 0.731 |
| Motivations | – | 1.000 | – |
| Satisfaction | 0.909 | 0.801 | 0.833 |
| Perceived value | 0.833 | 0.757 | 0.501 |
Discriminant validity: Heterotrait–Monotrait ratio
| Loyalty | Satisfaction | Perceived value | |
|---|---|---|---|
| Loyalty | – | – | – |
| Satisfaction | 0.862 (0.824; 0.898) | – | – |
| Perceived value | 0.516 (0.461; 0.568) | 0.558 (0.503; 0.310) | – |
Notes:
Bootstrapping for the HT–MT ratio (via confidence intervals) is presented in parentheses
After the analysis of reliability and validity both at the individual level and at the composite level, it has been observed that the results obtained have been optimal, not finding multicollinearity problems associated with the indicators that made up the Mode B composite.
Reliability and validity analysis of the structural model
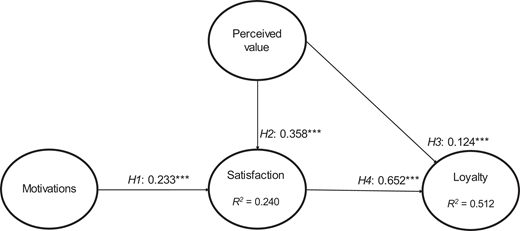
The predictive power of the model based on the coefficient of determination of endogenous variables is significant. Thus, the predictive power associated with the endogenous variable satisfaction has been R2SATISFACTION = 0.240 (Table 7) and that of the endogenous variable loyalty R2LOYALTY = 0.512 (Table 7), which implies a moderate predictive power of the satisfaction variable and substantial the loyalty variable (Chin, 1998). To confirm and support what has already been stated by the coefficient of determination, the predictive relevance of the model has been verified through PLS_Predict, where Q2 values above 0 have been obtained, which implies a high predictive relevance (Shmueli et al., 2019) at the construct level (Q2LOYALTY = 0.368; Q2SATISFACTION = 0.194).
Explained variance (R2) and effect size (f2)
| Endogenous variable | R2 | Path coefficient | Correlation | Explained variance (%) | Effect size (f2)* |
|---|---|---|---|---|---|
| Loyalty | 0.512 | ||||
| H4: Satisfaction | 0.652 | 0.707 | 46.096 | 0.706 (0.000); L. and Sig. | |
| H3: Perceived value | 0.124 | 0.410 | 5.084 | 0.026 (0.005); S. and Sig. | |
| Satisfaction | 0.240 | ||||
| H1: Motivations | 0.223 | 0.355 | 7.916 | 0.063 (0.000); S. and Sig. | |
| H2: Perceived value | 0.358 | 0.438 | 15.68 | 0.152 (0.000); M. and Sig. |
S. = Small; M. = Medium; L. = Large; Sig. = Significant; Nsig. = Non-significant
Thus, it is worth highlighting how the variable perceived value contributes to explain 15.68% of the variability of satisfaction or how the latter contributes to explain 46.096% of the variance of the endogenous variable loyalty (Table 7). The effect size (f2; Table 7) is closely related to the predictive power, assessing the degree to which a certain exogenous variable contributes to explaining an endogenous variable in terms of R2 (Cohen, 1988).
The statistical significance of the structural relationships has been tested through the bootstrapping technique, being carried out through 10,000 samples (Streukens and Leroi-Werelds, 2016), obtaining the t statistics and the associated significance, as well as the intervals of each one of the hypotheses raised. The results of the hypothesis testing are shown in Table 8. The final structural model is presented in Figure 2.
Statistical significance of structural relationships
| Hypothesis | β | t (Sig.) | Confidence interval (95%) | |
|---|---|---|---|---|
| 5% | 95% | |||
| H1: Motivations → Satisfaction | 0.233*** | 7.812 (0.000) | 0.176 | 0.272 |
| H2: Perceived value → Satisfaction | 0.358*** | 13.486 (0.000) | 0.317 | 0.404 |
| H3: Perceived value → Loyalty | 0.124*** | 5.064 (0.000) | 0.086 | 0.166 |
| H4: Satisfaction → Loyalty | 0.652*** | 22.994 (0.000) | 0.604 | 0.697 |
Discussion
The results obtained show a substantial predictive power of the model, where satisfaction and perceived value are formed as strategic variables for tourist loyalty towards WHS. The hypothesis testing carried out has revealed the positive influence among variables. Thus, in the first of the proposed hypotheses, the one that hypothesised about the positive influence of motivations on tourist satisfaction in WHS has been supported according to previous studies (Schofield and Thompson, 2007; Correia et al., 2008; Battour et al., 2012; Lee and Hsu, 2013). The motivations are shown as the main element for the subsequent satisfaction of the tourist, where the attributes of the destination play a fundamental role in generating a high perceived value in the tourist (Rasoolimanesh et al., 2016).
In the same line, the second of the hypotheses has been supported, as the model indicating a positive influence of the perceived value on tourist satisfaction in WHS, reinforcing the approaches of previous studies (Oh, 1999; Petrick and Backman, 2002; Gallarza and Gil-Saura, 2006; Lee et al., 2007; Bajs, 2015; Rasoolimanesh et al., 2016).
The H3 and H4 has also been supported (β3 = 0.124***; 0.000), implying that the perceived value and satisfaction positively influence tourist loyalty towards a WHS. In line with the previous one, variables such as the perceived value, the quality of the service or satisfaction are formed according to the existing literature as antecedents of loyalty (Petrick and Backman, 2002a; Petrick, 2004). Satisfaction plays a key role as a unifying element of perceived value and attributes and loyalty, whether viewed from an attitudinal perspective, through revisit intentions or from a recommendation-based point of view either through family or friends (Xu et al., 2021; Rasoolimanesh, 2019).
Conclusions, limitations and future lines of research
The certification of a city or place as a WHS gives it a worldwide recognition that is difficult to match. This registration generates a huge credit of the destination that implies an increase in tourist arrivals. That is why this appointment is not exempt from responsibilities such as the proper management and conservation of the property and the environment in which it is inserted. The different motivations of tourists must be taken into account and recognised, as these are dynamic, and constantly changing, searching for new experiences, emotions and perceptions.
The correct identification of these motivations and a correct planning and management strategy of the destination and property, are key to a satisfactory experience for tourists, reporting an increase in the value perceived by them concerning the place and resulting in an increase in the satisfaction of tourists in the heritage site. This has been corroborated through the H1 and H2 of the model. The increases in tourist satisfaction in the heritage site are in turn associated with an increase in final loyalty to the place because both perceived value and satisfaction are formed as predecessor variables of loyalty to a place (in this case, patrimonial), either this loyalty from the perspective of return to this place, as through recommendations to family and/or friends. This has also been demonstrated and endorsed through the H3 and H4 that were raised in the structural model.
The conclusions obtained in this study allow to identify some of the characteristics of the tourist demand of the analysed place. This information will be crucial, both for public and private entities, when addressing the design of tourist and cultural products that can more efficiently meet the needs of tourists. In the analysis carried out, the indicators “know its historical and monumental wealth” and “the desire to know new places” stand out as the most valued motivations. Regarding the perceived value, “the beauty of the city” followed by “the conservation of the monumental and artistic heritage” have been the best-valued attributes. On the other hand, “service and quality of the tour guides” and “complementary leisure offer” are the attributes that receive the worst evaluation (lower than 3.10 out of 5).
Therefore, once confirmed, the positive influence of motivations and perceived value on tourist satisfaction, some of the practical implications and recommendations that this study raises for the tourist managers of the city of Granada are the following. On the one hand, given the importance of the cultural motivation of tourists to visit the city, it is recommended to focus their efforts on the continuous improvement of the promotion, communication and dissemination of the heritage of the city, increasing their understanding and connection to the visitor. In addition, given the low evaluations collected, it is recommended to improve the offer and the quality of the tourist guide services, as well as the expansion of the complementary leisure offer in the city. This will have a positive impact on economic development, which will lead to an increase in employment and urban development in the city of Granada.
Finally, this research presents limitations such as the period of the survey collection, carried out during April to August 2019, and only from the point of view of demand. It would be interesting as a future line of research to extend the range of survey months to a non-summer season, checking whether or not significant differences are observed or the extension to other interest groups or stakeholders such as the supply of local public/private entities. This would generate immediate feedback that would allow these local entities, whether public or private, to agree on the preparation and adaptation of strategies in terms of tourism promotion in the city, without forgetting the difficult situation that exists today with the COVID-19 pandemic that will undoubtedly represent a before and after, a new paradigm in terms of tourism and heritage.

