

There is a large stock of solid-wall homes in the UK with poor thermal insulation and low energy performance. Although the UK government has supported efforts to improve these buildings, the identification of appropriate technical solutions that effectively improve the existing stock remains challenging. This research investigates how four dimensional building information modelling (4D BIM) could improve the retrofit of social housing, specifically that of ‘no-fines’ solid-wall homes, through the development of what-if scenarios that enable the analysis of alternative solutions considering costs, energy performance and disruption to users. This paper focuses on the use of 4D building information models to evaluate disruption to end users. The results indicate that the development of such models supports a better understanding of the retrofit process on site. It also supports the definition of production plans with as minimal disruption as possible to users while delivering energy-oriented and cost-effective solutions.
1 Introduction
The UK has one of the oldest housing stocks in Europe, which has a strong identity and cultural significance. This housing stock includes approximately 13 million homes built before 1960 (Riba, 2013). These houses were built when the issues of greenhouse gases and climate change were not such a global concern. As a result, a high energy input is required to achieve acceptable thermal comfort levels, which may lead to fuel poverty in social housing.
Sustainable retrofits refer to the refurbishment of buildings with the purpose of improving energy performance (Swan and Brown, 2013). This type of refurbishment has been gaining importance within the construction sector, as it plays a vital role in the achievement of sustainable targets (Climate Change Act, 2008; Kelly, 2009; Motawa and Oladokun, 2015).
Retrofit projects present many challenges for managers and decision makers, particularly when the users remain in the building over the period when the works are carried out (Ciria, 2004). Sunikka-Blank et al. (2012), Arge (2005) and Jones (2013) pointed out that one of the main barriers in retrofits is the disruption caused to users. Caixeta (2011) stated that the management of retrofit projects needs to be effective, in particular when the building remains occupied, and when planning retrofit works it is necessary to consider solutions that interfere as little as possible with users. Other challenges include the uncertainty related to existing building measures, poor understanding of user needs, technical challenges and, most importantly, the lack of approaches to evaluate retrofit options (Gholami et al., 2013).
This scenario offers an interesting opportunity for investigating the applicability of building information modelling (BIM), which has been described as a means to support energy efficiency and improved processes in both new and refurbishment projects (Eastman et al., 2011). There is much evidence in the literature that BIM can improve the retrofit process and deliver enhanced benefits and improved decision-making (Arayici, 2008; Becerik-Gerber et al., 2011). According to Hammond et al. (2014), BIM can potentially be used in retrofit projects in the following areas: (a) to determine the level of green building certification systems that can be achieved (e.g. Leadership in Energy and Environmental Design (LEED)); (b) to perform building design analyses, such as orientation, massing, enveloping and lighting to enhance design; and (c) to simulate building performance, including energy and water use, ventilation and lighting. In addition, BIM models can also be used for cost estimating and facilities management (Becerik-Gerber et al., 2011; Ilter and Ergen, 2015) and built heritage documentation (Woo et al., 2010).
Research is still scarce on the use of BIM in retrofit (Kemmer and Koskela, 2012; Volk et al., 2014). So far, most studies have focused on parametric tools for visualisation, coordination and simulation of energy efficiency (Alsaadi, 2014; Arayici, 2008; Hammond et al., 2014; Kim and Park, 2013; Moakher and Pimplikar, 2012; Sheth, 2011; Volk et al., 2014). This study contributes to fill this gap by exploring the potential of using BIM with the support of a collaborative planning and control model, named Last Planner system (LPS) (Ballard, 2000), to ensure that retrofit works cause as little disruption as possible.
The work presented in this paper is part of a wider research project entitled Solid Wall Innovative Insulation and Monitoring Processes Using Lean Energy Efficient Retrofit (S-impler), funded through Innovate UK (BRE, 2016). There are around 4·95 million dwellings in the UK’s social housing stock (DCLG, 2015). Solid-wall ‘no-fines’ housing represents 25% of that stock (Itard et al., 2008). These houses were built with no-fines cast-in-situ concrete panels, are not appropriately insulated and therefore do not meet the minimum requirements of energy conservation (Itard et al., 2008). As a result, they require retrofit activities to improve thermal comfort and to replace building components at the end of their useful life (Itard et al., 2008).
S-impler aims to investigate the retrofit of solid-wall housing to achieve a 60% reduction in monitored energy costs, with less disruption, at least 10% faster on site and with no reductions in quality and safety. The research is a joint initiative between a housing association, two small and medium enterprises, a contractor, academic institutions, a lean consultant and a construction organisation. For further information regarding S-impler project, including the project partners, please visit www.s-impler.com. One outcome of this project is a BIM protocol enabling ‘what-if’ scenarios for retrofit solutions. The protocol delivers an evaluation of retrofit options – what-if scenarios – to support the client’s decision-making, focused on (a) potential reduction in energy consumption, (b) estimated costs and (c) construction plans that reduce disruptions to the housing occupier. This paper focuses only on the use of four-dimensional (4D) (physical plus time) BIM and the LPS to support better planning of construction works and reduced disruption to users.
2 Retrofit in the context of social housing
Retrofit projects tend to be complex due to their intrinsic characteristics, such as (a) a high level of uncertainty (Bozorgi and Jones, 2013; Singh et al., 2014); (b) the construction process normally happens in short time frames (Manuel, 2011); (c) production generally needs to be undertaken in small batches; (d) challenges related to the poor understanding of user needs and to the technologies to be used (Gholami et al., 2013) and (e) such projects tend to have a high level of interference from users, as they may be occupying the building during construction works (Egbu, 1994; Mc Grath et al., 2013). These characteristics tend to lead to higher costs and longer project time frames than anticipated (Ciria, 2004). Therefore, retrofit requires improved management of information and project control in terms of cost, time and quality (Egbu, 1997; Egbu et al., 1998; Naaranoja and Uden, 2007; Swan and Brown, 2013).
Recent studies have investigated different approaches contributing to better energy efficiency of new and retrofitted dwellings. For instance, studies have analysed the usage of construction debris to be recycled and applied as new insulation materials (Dakwale and Ralegaonkar, 2016) and the utilisation of high-end technology for realising low carbon dioxide emissions (Gillott et al., 2010). These studies focused on technical solutions for improving insulation. However, research is scarce with respect to understanding how retrofit creates disruption to users during the construction process.
According to Ho Yee (2009), the retrofit of occupied buildings is normally more expensive and tends to take place over longer periods of time compared to the retrofit of empty buildings, as challenges occur due to the need to balance users requirements and those of the construction teams. Hence, there is a need to integrate space, organisation and time information to understand when, where and how occupiers will use the building during the retrofit process (Ho Yee, 2009).
In order to reduce disruption to users, Whiteman and Irwig (1988) highlighted the importance of planning and controlling retrofit works to ensure that all activities that are disruptive to users happen as early as possible in the process (Fawcett and Mayne, 2012). This paper adds to this discussion by focusing on how to reduce disruptions to users in social housing retrofit projects.
3 BIM in retrofit projects
In order to determine appropriate scenarios that are effective for saving cost and time, early-stage simulation methods are likely to be helpful in overcoming uncertainty, evaluating the performance of different design strategies and aiding decision-making (Sacks et al., 2009). The use of 4D BIM specifically can improve the understanding of the construction process by all stakeholders. This enables better decision-making through the identification and visualisation of alternative construction plans (Egbu, 1997; Papamichael, 1999; Sheth et al., 2010).
Other studies have suggested the need to develop collaborative production planning of retrofit works (Ho Yee, 2009; Miller and Buys, 2011; Sunikka-Blank et al., 2012; Wallace, 1986; Whiteman and Irwig, 1988). The LPS is a collaborative planning and control model that is able to increase the reliability of short-term planning by shielding planned work from upstream variability and by seeking conscious and reliable commitment to plan execution by the leaders of the work teams involved (Ballard, 2000). Dave et al. (2013) argued that collaborative planning can be enhanced with the support of 4D BIM, due to the fact that the team visually gains deeper understanding of the project when compared to the level of understanding obtained through traditional approaches.
Moreover, according to Kymmell (2008), 4D BIM has been widely used for simulating and visualising the construction process in a virtual environment, with the aim of improving site coordination, identifying time-based clashes in schedules and supporting material planning and management. 4D simulation may reveal potential problems in the existing plans and improvement opportunities in terms of construction sequence and location of equipment, avoiding spatial conflicts and health and safety issues, among others (Eastman et al., 2011).
Furthermore, 4D simulation supports early decision-making and facilitates the development of effective solutions (Capeluto and Ochoa, 2014). In fact, the simulation of the construction sequence can be based on a preliminary construction plan and a BIM model. Planning scenarios can be visualised in 4D sequences to help communicate the advantages and disadvantages of various scheduling options (Kymmell, 2008). Early 4D BIM simulation can provide stakeholders with a better understanding of the relationship between the key processes and constraints that can affect construction operations.
Despite the potential of BIM for retrofit, there is a scarcity of studies about its use with the aim of analysing disruptions to end users. Thus, this work helps to fill this gap, investigating the use of 4D BIM in retrofit projects and how it supports the understanding of disruption to occupants. The evaluation of retrofit scenarios by using 4D BIM has the potential to both improve the retrofit process itself and reduce disruption to users.
4 Disruption to users during retrofit works
Kelsey (2003) described how disruption to users needs to be treated as an additional variable in the management of retrofit projects and highlighted the need to consider disruption as part of the strategic objectives of such projects. According to Vadodaria et al. (2010), disruptions are related to the type of retrofit performed – for example, work carried out outside the building causes less disruption compared to internal works, which tend to have a strong impact on the daily activities of the users. However, even when the focus is on external retrofit, there may also be relevant disruption, for instance, when changing windows (DCLG, 2006).
Vainio (2011) suggested that disruptions may be better accepted if users are clearly informed of the issues to be faced in advance. Fawcett and Mayne (2012) and Fawcett (2014) further pointed out that end users tend to accept more readily retrofits that are developed in one go, as the level of disruption tends to be lower (e.g. the user will need to vacate the premises once). Whiteman and Irwig (1988) highlighted the need to plan a retrofit to ensure that all disruptive activities happen as early as possible in the process, therefore reducing users’ dissatisfaction. According to Haines and Mitchell (2014), end users accept disruptions better if these are perceived to be less significant than the results of enhancement of comfort and space after the retrofit. Moreover, unexpected changes and execution delays can cause stress for tenants (Vadodaria et al., 2010). However, there are situations in which users cannot vacate the premises and a staggered approach to retrofit work cannot be avoided.
Table 1 presents a set of categories of disruption, which was identified in a literature review of retrofit projects. In summary, there is a need to develop detailed plans for the execution of retrofit works, as well as clear communication of the costs and technical solutions adopted, to enable users to perceive explicitly the benefits of the retrofit and make appropriate decisions (Miller and Buys, 2011; Sunikka-Blank et al., 2012; Wallace, 1986). Ho Yee (2009) pointed out the possibility of engaging users during retrofit projects and the need for clear construction plans that enable users and workers to share effectively the same spaces during retrofit.
Factors affecting end users
| Category of disruption | Factors affecting end users | References |
|---|---|---|
| Disruption of utilities: happens when retrofit works affect the continuity of utility supplies | Provision of gas is interrupted | Wallace (1986), Whiteman and Irwig (1988), Ciria (2004) |
| Provision of electricity is interrupted | ||
| Provision of water is interrupted | ||
| Disruption of traffic: happens when retrofit works constrain the flow of tenants | Internal flow is interrupted | Whiteman and Irwig (1988), Kelsey (2003), Ciria (2004), Jones (2013) |
| Access to the building is blocked or limited | ||
| Disruption of physical space: happens when retrofit works restrict space for working or living because spaces are being shared between workers and tenants | Physical comfort is interrupted when the daily activities of tenants are affected | Wallace (1986), Ciria (2004), Ho Yee (2009), Vadodaria et al. (2010), Lee (2012), Haines and Mitchell (2014), Fawcett (2014) |
| Tenants need to move out to avoid sharing the same space with workers | ||
| Disruption of internal environment: happens when retrofit works affect the internal environment by generating different levels of pollution | Noise provided by use of work tools such as hammers and mallets | Whiteman and Irwig (1988), Ciria (2004), Miller and Buys (2011), Lee (2012), Jones (2013) |
| Dust or debris resulting from demolition, building, plaster and so on |
5 Research method
Design science research (DSR) was the methodological approach adopted in this investigation. The aim of DSR is to build an innovative solution, or an artefact, based on valid and reliable research, to solve a real problem (van Aken, 2004). Such a problem should be relevant to current practice, and the solution should provide theoretical contributions (Holmström et al., 2009; Lukka, 2003; van Aken, 2004).
The artefact produced in this investigation is a BIM protocol to create what-if scenarios for retrofit works aiming to reduce disruption to users. The aim of this investigation was to devise a protocol that is applicable to similar projects and can benefit the retrofit of a vast number of existing houses in the UK and elsewhere.
The research project was divided into four stages, following the steps for DSR suggested by van Aken (2004): (a) define the problem, (b) plan the intervention, (c) implement the intervention and (d) evaluate it. As shown in Figure 1, the development of the solution was highly iterative, which is typical of DSR projects.
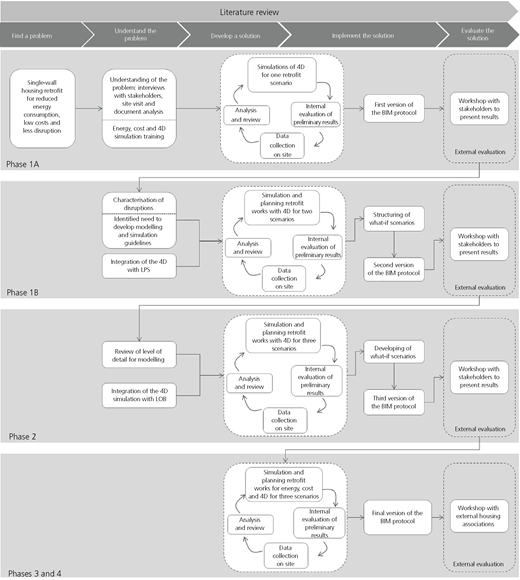
The protocol was tested in a housing retrofit project, which consisted of eight houses located in Northern Ireland. The main tasks involved in this project were (a) replacing the existing single glazed external windows and doors with polyvinyl chloride openings and double glass; (b) strengthening the existing loft insulation layer; (c) insulating the external walls by using dynamic insulation boards and rendering; and (d) changing the ventilation system to improve efficiency.
The retrofit project was carried out in four phases to enable analysis, learning and improvement between phases: phases 1A (house 6), 1B (houses 44 and 45), 2 (houses 46 and 47), 3 (houses 49 and 50) and 4 (house 48). This paper reports on the results achieved in phases 1A, 1B and 2.
5.1 Phase 1A
In order to have an in-depth understanding of the real problem, the researchers visited the houses, took part in project meetings and interviewed a set of tenants. These activities provided information on the existing houses that was needed for developing three-dimensional (3D) and 4D BIM models, and these helped in understanding the tenants’ expectations about the project. At the same time, the team selected BIM software tools to develop energy, cost and 4D simulations, considering the need for open standards.
A retrofit plan for one house was developed as a 4D BIM model by using the Synchro Professional software. The outcome was an initial solution in terms of a production plan for reducing disruption to users. The results were presented to the client and the project manager to evaluate constructability as well as disruption to users, followed by further data collection and analysis. Those activities were part of an iterative cycle of refinement of the 4D model.
The main sources of evidence in this phase were six semi-structured interviews with stakeholders, eight site visits, eight participant observations in planning meetings and document analysis (e.g. production plans, scope of work, design drawings). A preliminary version of the protocol was produced at the end of this phase.
5.2 Phase 1B
Phase 1B included the characterisation of end user’s disruptive activities, initially developed according to the literature and further enhanced through a rating by the project stakeholders. The disruption’s rating was developed through a questionnaire answered by a client representative, a project manager, a site manager, the foreman, the designer and the suppliers of the external wall insulation. A further questionnaire was also given to the tenants (five respondents). This included questions related to the tenants’ profiles, as well as questions about what type of disruptions the tenants perceived were caused or could be caused by a retrofit. Also, graphs were used to identify the perceived level of disruption from each of the factors identified in the literature, including measures of time and intensity – that is, low intensity, long time; high intensity, long time; low intensity, short time; and high intensity, short time.
In parallel, the LPS was implemented on the construction site, producing look-ahead and daily plans. These were also simulated through 4D models. The same iterative cycle of activities was developed: presenting the results, collecting data to refine the models, analysing the results and modifying the retrofit plan and 4D models. In this phase, two what-if scenarios were produced for different solutions for external wall insulation boards, which had different costs, energy performance and disruption levels. The site management team evaluated the models.
Data were collected in this phase through participant observation in three planning meetings, two structured interviews, two semi-structured interviews (as described earlier) and document analysis. At the end of this phase, the second version of the BIM protocol was produced.
5.3 Phase 2
Phase 2 started with adjustments in the level of development (LOD) of the 4D BIM model to facilitate stakeholders’ understanding. Also, retrofit activities were categorised from the point of view of disruption to users. Furthermore, the retrofit works for houses 46 and 47 were planned in three different scenarios by using the line-of-balance (LOB) technique as a long-term plan, to support the assessment of disruptions. Similarly to the previous phases, there were several iterative cycles of 4D simulations, involving the presentation of results, data collection and analysis. The researchers devised a what-if scenario matrix, integrating information from energy simulation solutions, retrofit planning dates and costs of each scenario.
The researchers internally evaluated the models and scenarios developed in phase 2. The main sources of evidence were participant observation in three planning meetings and direct observation in three site visits. By the end of phase 2, the third version of the BIM protocol was delivered.
6 Results
6.1 Phase 1A
Phase 1A started with the development of 3D models, based on existing plans and site visits. The second step was to model the retrofit design solution for house 6, including insulation elements (insulation boards, first-base coat, fibreglass and reinforcing mesh). The LOD of the post-retrofit model was LOD 300–350, which was considered to be adequate for the task of cross-referencing information from the 3D model and the schedule of retrofit works for 4D simulation.
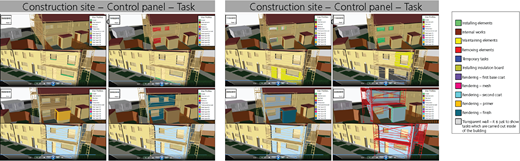
In the 4D model, the inputs required were the 3D model, construction schedule, list of equipment to be used and location of inventory of materials. The different trades were organised into task groups and identified by colour coding, so that their tasks could be easily visualised in the 4D simulation. Three 4D models were developed. The first was a starting point for task execution, based on information from planning meetings and guidelines provided by the suppliers. The original plan had to be changed due to site constraints, such as delays in the delivery of the windows and the lack of design details. As changes in the schedule occurred, these were incorporated and simulated in the second 4D model. Screenshots were generated from the second 4D model and displayed in the site office, as shown in Figure 2. The site manager and the foreman pointed out that those 4D images supported decision-making in production planning and control by increasing process transparency. In fact, they were able to detect inconsistencies in the existing plan, due to an inadequate sequence of some activities. A third version of the 4D model was then produced, incorporating feedback from the site team.
6.2 Phase 1B
A set of disruption categories was identified according to the literature (Table 1) and data obtained from questionnaires and feedback from planning meetings. Two new categories were identified: (a) disruption to the external environment (e.g. when tenants change the yards, e.g. a wood deck needs to be removed) and (b) disruption to parking spaces (e.g. when there is a reduction in parking facilities for residents due to skips and vehicles of tradespeople). This was followed by the identification of the importance of disruption categories from the stakeholders’ perspective.
The 4D model for houses 44 and 45 was based on the third version of the model produced in phase 1A, on the revised set of disruption categories and on the results from the first collaborative planning meeting. Moreover, the 4D BIM model was revised, as the managerial staff considered that there were too many details, which made clear visualisation of the sequence of activities difficult. Eventually, it was agreed that the LOD of the 3D BIM models to support planning should be 200 (Bedrick, 2008; Leite et al., 2011).
In order to produce a predictable workflow and rapid learning as well as reducing disruptions on site, the LPS of production control was adopted. Four-dimensional BIM simulations were also used as a visual aid for supporting decision-making within the LPS framework. They aimed to contribute to the development of the master plan by showing the implications of different production strategies in terms of disruptions to the residents. The target lead time set for this second phase of the project was 4 weeks for the retrofit of both houses.
In order to implement the LPS in such a specific project context, some adaptations had to be made. These are summarised in Table 2 (see further details about the implementation of the LPS in Kemmer et al.’s (2016) study).
LPS’s adaptations to suit the retrofit context (Kemmer et al., 2016)
| LPS element | Phase 1B |
|---|---|
| Long-term (master plan) | Devised in a collaborative fashion by the delivery team through the use of Post-it notes and a location-based chart |
| Phase planning | |
| Medium-term (look-ahead plan) | Constraints were listed for the entire project duration |
| Short-term (commitment plan) | Devised on a daily basis to register the assignment of tasks to crews on site |
| Learning | Daily measurements of percent of plan complete (PPC) along with root cause analysis |
As illustrated in Table 2, the master plan and phase planning were devised simultaneously due to the characteristics of the project, namely, a retrofit of small houses planned to be executed in a short amount of time. It was devised by the delivery team through the use of Post-it notes fixed on a chart at the site office.
The look-ahead planning was carried out for the entire project duration – that is, 4 weeks. A list of constraints was generated and circulated by way of a web-based platform in order to communicate the deadlines and necessary actions to the delivery team. The short-term plan was carried out on a daily basis as well as the PPC measurements and root cause analysis. The actual lead time for retrofitting both houses was 6 weeks.
6.3 Phase 2
Initially, the work packages and the sequence of activities were defined (see Figure 3) and a production resource capacity sheet was produced, based on data obtained from monitoring the implementation of the LPS short-term plans in phase 1B.
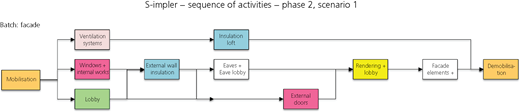
Sequence of activities for phase 2 – scenario 1
Sequence of activities for phase 2 – scenario 1
A classification of four levels of disruption to users was proposed to identify which scenario was less disruptive to the tenants (Table 3): (a) red, for the most disruptive activities, which means activities that need to be executed inside the houses or cause interruptions in everyday life or building services provision; (b) orange, for activities with a medium level of disruption – for example, activities that have a long duration, have the potential to block access temporarily to part of the house and/or services or can cause excessive dust; (c) yellow, for activities with a low level of disruption, such as activities that take place outside the houses; and (d) light green, for work in progress (WIP). WIP was considered as a disruption to users, as they perceive it as a waste of time – for example, days in which no activity is being carried out. The levels of disruption were developed on the basis of the information gathered from the literature as well as results from interviews and questionnaires. These represent a logic of increasing disruption levels attached to different work package types and aim to provide a simple visual representation of disruption. This is useful, for instance, to support the planning of the development of the most disruptive activities earlier on in the retrofit process. This information was used to adjust the LOB to reduce the number of WIP days in each house.
Levels of disruption of work packages
| Work packages | ||
|---|---|---|
| Disruption level |  | Windows, external door, internal works, loft insulation, building services |
| Lobby, render, facade element | ||
| Mobilisation, external wall insulation, eaves, demobilisation | ||
| WIP (no activities developed in the production batch) |
Also, the LOB made the master plan more visual and easy to understand for the planning meeting participants, in particular regarding disruption and WIP. The information provided by this plan included (a) duration and rhythm of activities, (b) the location of each crew daily, (c) interferences between crews, (d) necessary buffers for render coats, (e) WIP for each production batch, ( f ) overlapping days of disruption activities inside the house and (g) total duration of the retrofit project. In fact, the LOB was effective in terms of supporting discussions among the planning and control team members. For that reason, the new version of the 4D model was built using data extracted from the LOB.
An LOB was devised and presented by the research team to the site managerial team as one scenario for the retrofit works. In fact, the LOB was also a visual device that supported the discussion with the production manager team members. The site team produced a second scenario, and a third scenario combining information from scenarios 1 and 2 was produced. Each scenario contained the sequence of activities, production resources capacity, line of balance, days of disruption, and total duration.
The LOB was used to measure the disruptions days and WIP with the aim of comparing different scenarios. The tool permitted counting the number of days in which work packages classified as red and orange occur at the same time in a house. To measure the days of WIP, the days in light green were counted. Figure 4 presents the LOB for scenario 1. The dates from the LOB were used as input data in the 4D software to generate the three scenario simulations.

Example of an LOB for a scenario simulation
Example of an LOB for a scenario simulation
Table 4 compares the scenarios produced in this phase, including (a) the total duration of the project; (b) the number of days for the most disruptive activities – red and orange disruptions (excluding overlaps); (c) the number of days of disruptions for each house; (d) the number of days of disruptions for each scenario; (e) days of WIP in each house; and ( f ) the number of necessary workers. The total number of days is calculated on the basis of counting these activities on the LOB, and an example is provided in Figure 4.
Scenarios developed for 4D simulation in phase 2
| Scenario | House number | Total duration: d | Red disruptions: d | Orange disruptions: d | Number of disruptions/house: d | Number of disruptions/scenario: d | WIP: d | Number of workers |
|---|---|---|---|---|---|---|---|---|
| 1 | 46 | 19 | 6 | 16 | 22 | 41 | 52 | 9 |
| 47 | 20 | 7 | 12 | 19 | 41 | 39 | 9 | |
| 2 | 46 | 21 | 9 | 14 | 23 | 41 | 66 | 7 |
| 47 | 21 | 8 | 10 | 18 | 41 | 34 | 7 | |
| 3 | 46 | 21 | 7 | 15 | 22 | 42 | 60 | 8 |
| 47 | 22 | 7 | 13 | 20 | 42 | 37 | 8 |
Scenario 1 was considered to be the most effective, as it results in the shortest duration and smaller number of disruptive days. However, the option requires a larger number of workers on site
6.4 BIM protocol for assessing disruption to users
The BIM protocol was devised for creating what-if scenarios to support decision-making in retrofit projects, considering the need to reduce disruption to users, among other project objectives. The protocol is generic and can be applied to different social housing retrofit projects. It combines 4D BIM models and the LOB to understand how disruptions can be minimised while retrofit works are carried out. A schematic representation of the protocol is shown in Figure 5.
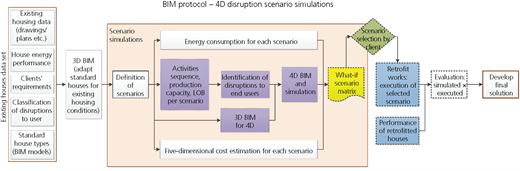
BIM protocol focused on disruption to tenants using 4D BIM simulations
BIM protocol focused on disruption to tenants using 4D BIM simulations
The first step is to identify the relevant data needed to perform the simulations, including drawings and measurements of existing houses, clients’ requirements, classification of disruptions to users, house energy performance (including energy costs) and standard house type models, among others. The standard house type models are 3D models created with the aim to be adjusted and adapted easily and quickly to fit the specific housing to be simulated. The standard house types include (a) detached, (b) semi-detached, (c) midterrace and (d) bungalow. In cases where there are no drawings of the existing houses, a detailed survey of the building is necessary.
Capturing the clients’ requirements is concerned with identifying the goals of the retrofit from the clients’ perspective. Two main clients are considered: the owner and the users of the dwellings. The classification of disruptions to users is used to support the assessment of retrofit construction plans in relation to disruptions to users (see Table 2).
Three-dimensional BIM involves the process of adapting the standard house type models to the existing conditions. Afterwards, the process includes the definition of scenarios to be simulated, which incorporate diverse technical solutions applicable to the project in hand, including insulation, heating and ventilation systems. Simulations are then developed for energy consumption and costs (not detailed in this paper).
The following step is the 4D BIM simulation, including the definition of the sequence of construction activities and production capacity. Each technical solution might have a set of execution guidelines (e.g. items need to be installed before the insulation boards in the external walls to avoid rework) and a sequence of activities.
There is a need to prepare the 3D BIM model for 4D disruption simulation, to incorporate site conditions as well as the new elements for the retrofit works – for example, insulation boards. It is recommended that the 4D scenarios be developed and evaluated in conjunction with an LOB which simplifies measuring disruption days and provides an extra visual device for communication. Moreover, the LOB can be used as a presentation of the long-term plan, which is the starting point for the implementation of the LPS.
The identification of disruption to end users in each scenario follows the modelling process. This involves the classification of the work packages according to the levels of disruption presented in Table 2. Table 3 can be used as a model to compare the scenarios in relation to duration, high and medium disruptive activity periods, days of WIP and number of workers.
The results from the 4D disruption simulations are incorporated into a what-if scenario matrix, which includes information from energy consumption and cost simulations. The matrix is used to inform clients on the results for each type of simulation; hence, it supports decision-making – that is, a cost-effective energy solution, which causes less disruption to end users during the retrofit works.
Following the decision-making process by the client, the execution of works on site occurs. The information derived from the execution will provide feedback to the process and should be considered as an input for further developments. As an example, interviews with the tenants can be performed to investigate whether the foreseen disruptions at the beginning of the process happened or if new disruptions emerged.
Information on the energy performance of retrofitted houses, if available, can be a parameter for enabling the comparison of the simulation results with the performance achieved in practice. The same comparison can be made for the duration of the retrofit works and real retrofit costs. This information can be used to refine the simulation parameters used and improve the reliability of the results in the simulation of further projects.
7 Discussion and conclusions
This paper discusses how 4D models can be used to support the reduction of disruption to users in retrofit projects, providing a prescriptive contribution to the management of retrofits through the use of DSR. Achieving a good level of understanding of which activities cause what type and level of disruption for users is essential. The identification and characterisation of disruption for users is a theoretical contribution of the work and was developed based on three sources of evidence: literature review, project stakeholders’ perspective and users’ perceptions. The definition of disruption enables the creation of alternatives for executing works on site, as well as the evaluation of diverse technical options from the perspective of the level of disruption caused.
The main contribution of the work is the development of recommendations describing the steps to be undertaken by decision makers in evaluating retrofit scenarios in situations where the dwellings are in use during the retrofit works. The proposed BIM protocol describes these recommendations and provides the means and tools to support the decision-making process when choosing the most appropriate retrofit solution. During design, the protocol enables the evaluation of the most effective retrofit solution for energy efficiency by considering costs and potential levels of disruption of alternative design solutions. During the construction process, it enables the identification and evaluation of different project execution plans and aligns 4D BIM with the LPS. The BIM protocol was partially evaluated throughout the project phases by the researchers, the overall S-impler research team, the construction team and the client. Further assessments will be developed in the future with clients (i.e. housing associations), aiming to further refine the protocol.
The results indicate that the development of 4D BIM models supports a better understanding of the retrofitting process on site, supporting the definition of production plans with the minimal disruption possible to users while still delivering energy-oriented and cost-effective solutions. The 4D BIM models are helpful for communicating the construction programme to clients and also valuable for enabling the visualisation of aspects related to site logistics such as material storage, scaffolding position and users’ access. They are an important tool for identifying disruptions related to the existing site conditions, including the neighbourhood, pavements and car parks.
Regarding the use of 4D BIM simulations as a visual aid during the development of the master plan, an important lesson was learned: there needs to be an alignment between the LOD of the 4D model and that of the construction plan. The use of an overly detailed model in phase 1B did not produce the expected results, as the participants could not see clearly the sequence of activities or the potential disruptions associated with each production scenario.
The use of 4D BIM models along with the LOB was positive, as the latter provides a simple way to measure disruption days. The LOB can also be used as a visual device showing the long-term plan in connection with the implementation of the LPS. Moreover, 4D BIM models can be used as a visual support tracking the development of works on site, comparing the simulation with the executed work on a set time frame.
The BIM protocol defines a process where diverse technical solutions can be evaluated considering three elements: energy efficiency, costs and 4D disruption. The availability of information supports clients’ decision-making, as well as the choice of the most effective retrofit scenario. It is suggested that the proposed protocol is explored in different project contexts in order to verify its wider applicability.
Acknowledgements
The authors would like to thank Innovate UK, Coordination for the Improvement of Higher Education Personnel (CAPES), Brazil, and National Council for Scientific and Technological Development (CNPq), Brazil, for the financial support received. In addition, they would like to thank the wider S-impler project team for their direct contributions to this investigation.

