


Cold heavy oil production with sand (CHOPS) is a primary oil recovery method that extracts heavy oil together with large volumes of sand. However, CHOPS typically results in low recovery efficiency, requiring enhanced oil recovery techniques, such as cyclic solvent injection (CSI), to access remaining reserves during the post-CHOPS phase. Effective CSI, particularly using solvents such as carbon dioxide, requires improved understanding of the interactions between gas behaviour, fluid flow, reservoir deformation, and borehole stability. Centrifuge physical modelling can support investigation of the coupled flow and geomechanical processes under field-representative stress conditions. This study introduces GeoTriax, a new geotechnical centrifuge cell developed to model post-CHOPS CSI processes. GeoTriax enables triaxial stress application and fluid flow under enhanced gravity, providing a platform for coupled flow–geomechanical studies. The cell enables investigation of large-scale reservoir behaviour while preserving boundary conditions through vertical and radial horizontal stress application and simultaneous collection of produced sand. This paper presents the design features of GeoTriax, including its mechanical and pneumatic systems, and outlines the experimental procedures developed to simulate post-CHOPS processes in a geotechnical centrifuge system.
1. Introduction
Heavy oil production from poorly cemented sand formations in Western Canada is primarily achieved using the cold heavy oil production with sand (CHOPS) method, in which oil and sand are co-produced through progressive cavity pumping (Dusseault, 2002). During CHOPS, the production of sand from poorly cemented formations leads to the development of highly permeable channels, also known as wormholes, extending from the wellbore into the reservoir. These channel-like structures create preferential flow paths that allow the extraction of viscous heavy oil that would otherwise remain immobile. Production typically continues until excessive sand or water cut renders operations uneconomic. Although CHOPS has been commercially successful, it typically yields low primary recovery factors (5%–15%), leaving a large portion of heavy oil trapped in the reservoir (Cartagena-Pérez et al., 2025). Following CHOPS depletion, post-CHOPS recovery techniques – particularly cyclic solvent injection (CSI) – have emerged as promising enhanced oil recovery (EOR) strategies for improving oil recovery while reducing environmental footprint (Soh et al., 2018; Cartagena-Perez et al., 2024). In CSI, a solvent such as carbon dioxide (CO2), methane, or propane is alternately injected, soaked, and produced to mobilise residual oil via viscosity reduction, gas expansion, and foamy-oil flow mechanisms.
Over the past two decades, numerous laboratory-scale studies have been conducted to investigate CSI performance, focusing on solvent type, cycle design, and flow behaviour within wormhole-dominated media. Du et al. (2015) performed CSI experiments in cylindrical sandpacks mimicking wormhole geometries and demonstrated that wormhole length, connectivity, and spatial arrangement play a critical role in enhancing solvent delivery. Other experimental studies have investigated the key driving mechanisms governing CSI (Oldakowski and Sawatzky, 2018; Shokri and Babadagli, 2017; Coskuner et al., 2015; Maini 1999). In particular, Plata et al. (2021) examined the effects of gravity, depletion rate, solvent composition, and initial oil saturation using Cold Lake heavy oil. Their results showed that bubble nucleation and foamy-oil flow are the dominant recovery mechanisms, with oil expansion during pressure drawdown contributing to early production and dispersed gas bubbles sustaining reservoir pressure after pressure falls below the bubble point (Plata et al., 2021). The first CSI cycle consistently produced the greatest incremental recovery, reflecting the strong influence of foamy-oil behaviour before a continuous gas phase developed – findings that align with field-scale observations (Plata et al., 2021). More recently, Palizdan et al. (2025) used microfluidic micromodels to visualise the effect of wormhole configuration and symmetry on carbon dioxide-based CSI, highlighting the impact of geometry on foamy-oil behaviour. The study also revealed that pressure depletion rate affects the relative contribution of different recovery mechanisms (Palizdan et al., 2025).
Across these experiments, common methodologies involve sandpack systems (laboratory columns packed with granular porous media to simulate reservoir flow (Lake, 1988)) or micromodel systems (transparent pore-scale models that enable direct visualisation of fluid displacement processes (Lenormand et al., 1988) that replicate simplified wormholes or channels, allowing direct visualisation of flow and gas–oil interactions. Parameters such as injection pressure, depletion rate (typically 4–12 kPa/min), number of cycles (3–5), and solvent composition are systematically varied to evaluate cumulative and incremental recovery. Despite their valuable insights, these studies are mostly 2D or quasi-2D, lack geomechanical confinement, and do not account for stress-induced deformation, compaction, or sand migration, which are critical in field-scale post-CHOPS reservoirs. Consequently, translating laboratory findings to realistic conditions remains challenging due to differences in geometry, stress state, and scaling.
The geotechnical centrifuge offers a powerful platform for physically modelling subsurface processes where stress, gravity, and time scaling are critical. In a centrifuge, a reduced-scale model is spun at enhanced acceleration (N·g) so that the stress field in the model equals that of the prototype (Madabhushi, 2017; Taylor, 2018). This allows small laboratory samples to reproduce full-scale reservoir stress and pore-pressure distributions while maintaining realistic mechanical behaviour. Scaling laws govern the relationship between model and prototype quantities – length ∝ 1/N, stress ∝ 1, and time for consolidation ∝ 1/N2 – ensuring that deformation, flow, and diffusion processes can be translated across scales with known accuracy (Taylor, 2018).
In the context of the GeoTriax system, these scaling laws directly inform the selection of specimen dimensions and loading capacity, ensuring that realistic stress states and pressure gradients representative of field conditions are achieved within the scaled sample. For fluid flow processes, flow velocity scales as 1/N under centrifuge scaling. According to centrifuge similitude relationships, when the same pore fluid is used in both model and prototype, the effective permeability scales with N to satisfy Darcy’s law, while hydraulic gradients are commonly treated as unchanged in conventional geotechnical practice (Garnier et al., 2007; Wood, 2017). In the present study, fluid viscosity was assumed to be identical in both model and prototype, and no viscous pore fluid was employed. Consequently, although the centrifuge correctly reproduces stress conditions and pressure-driven flow regimes, exact flow similitude and particle transport behaviour may not be fully replicated. Particle size was not scaled in the present study; however, the dominant mechanisms governing sand mobility in poorly cemented formations – namely, stress-induced failure, pressure gradients, and fluid-driven transport – remain physically representative under enhanced gravity. Therefore, the GeoTriax system provides a practical experimental framework for investigating coupled flow–geomechanical behaviour while recognising the limitations associated with fluid-flow scaling.
Applications of geotechnical centrifuge modelling in petroleum engineering have expanded in recent years. Early studies by Vaziri and Lemoine (2000) and later Pereira (2021) and Layeghpour (2021) used centrifuge tests to investigate sand production from poorly cemented sands, observing the development of conical cavities around the wellbore and challenging the traditional wormhole concept. Vaziri and Lemoine (2000) conducted one of the first geotechnical centrifuge experiments to investigate sand production mechanisms in uncemented sand formations. They designed and fabricated a specialised cell containing a central wellbore surrounded by sand, where produced sand was collected and quantified using a load cell during centrifuge spinning. Tests performed at an acceleration of 24g revealed the formation of a conical cavity around the wellbore, demonstrating how sand removal leads to localised failure and cavity development in weakly consolidated materials (Vaziri and Lemoine, 2000). More recently, Pereira (2021) and Layeghpour (2021) conducted a series of experiments using a beam-type geotechnical centrifuge to study sand production behaviour in CHOPS-type reservoirs, inspired by conditions in Canadian heavy-oil fields. Their results consistently showed the formation of a distinct cavity surrounding the wellbore following sand production in all tests, confirming the reproducibility of this phenomenon under enhanced gravity conditions (Layeghpour, 2021; Pereira, 2021). These works collectively demonstrate that centrifuge modelling can capture complex interactions among stress, fluid flow, and deformation that conventional 1g experiments cannot. Jia (2022) used geotechnical centrifuge modelling to investigate caprock deformation during thermal EOR by Steam-Assisted Gravity Drainage (SAGD) operations, observing shear bands and fractures in a shale analogue equivalent to approximately 15 years of field-scale behaviour. The study demonstrated the centrifuge’s ability to realistically capture long-term geomechanical responses within shortened laboratory timescales.
Despite the proven capabilities of geotechnical centrifuge modelling, a system is needed that can simultaneously reproduce triaxial stress states, multiphase fluid flow, and sand production characteristic of post-CHOPS reservoirs. Traditional sandpack or micromodel experiments lack stress control, while prior centrifuge cells for sand production were limited to single-axis loading and one-phase drainage. To overcome these limitations, a new geotechnical centrifuge cell, GeoTriax, was built at the Geotechnical Centrifuge Experimental Research Facility (GeoCERF), University of Alberta. GeoCERF houses a 2-m radius beam centrifuge capable of operating at accelerations up to 150g (a maximum rotational speed level of 280 rpm) and maximum payload of 500 kg, providing a versatile platform for physical modelling of geotechnical and geoenvironmental processes (Zambrano-Narvaez and Chalaturnyk, 2014). The GeoTriax system integrates vertical and horizontal stresses in a radial geometry application, controlled fluid injection and production, and a pneumatically remotely activated wellbore assembly within a single, large-scale cell operating at accelerations up to 30g. This configuration enables physical modelling of post-CHOPS and CSI processes under realistic stress, drainage, and boundary conditions. The objectives of this study are to present the design concept, configuration, and fabrication of the GeoTriax triaxial centrifuge cell; describe its integrated flow and instrumentation systems; summarise the commissioning and performance evaluation procedures conducted at both 1g and 30g; and demonstrate the system’s capability for investigating coupled flow–geomechanical behaviour in post-CHOPS reservoirs.
2. GeoTriax cell development
The GeoTriax system was designed as a custom centrifuge triaxial cell to reproduce the complex geomechanical and hydraulic conditions surrounding a wellbore and overcome the limitations of conventional triaxial systems in reproducing realistic post-CHOPS reservoir and wellbore conditions. The cell was developed to operate under enhanced gravity accelerations of up to 30g, corresponding to prototype stress levels encountered in shallow to intermediate-depth reservoirs (Cartagena-Perez, 2024). In such enhanced-gravity environments, stresses within the model scale with the centrifugal acceleration, enabling the reproduction of in situ effective stress magnitudes on reduced-scale specimens. This capability allows the investigation of coupled flow and deformation processes that are otherwise unachievable at 1g. The system was therefore required to satisfy stringent mechanical, hydraulic, and operational criteria.
The key design objectives are summarised as follows:
To accommodate large-scale cylindrical samples representative of reservoir conditions; to apply independent horizontal and vertical stresses to simulate in situ stress states; to enable controlled fluid flow and multiphase saturation under high-pressure conditions; to incorporate a remotely activated wellbore system for in-flight operation; to integrate comprehensive instrumentation for coupled hydro-mechanical measurements; and to ensure full operability within the GeoCERF centrifuge environment, including geometric, weight, and system constraints.
To satisfy the large-scale, reservoir-representative samples, the cell was designed to accommodate cylindrical specimens approximately 538 mm in diameter and 150 mm in height. This relatively large representative volume minimises boundary effects and enables the development of realistic pore pressure gradients, flow paths, and deformation zones within the sample while remaining compatible with centrifuge constraints.
To replicate in situ stress conditions, the GeoTriax system enables independent control of radial (confining) stresses up to approximately 3.5 MPa and axial stresses up to approximately 2.5 MPa. This triaxial configuration allows simulation of anisotropic stress states around a production well and enables investigation of shear localisation, dilation, and failure mechanisms under controlled loading paths.
Controlled fluid flow and multiphase saturation are achieved through an integrated hydraulic and pneumatic system capable of handling water, oil, and gas injection and production under pressures up to 3.5 MPa. The system incorporates high-strength fittings and sealing components to maintain leak-tight performance during high-pressure and high-g operation, enabling simulation of processes such as CSI and pressure depletion.
A key innovation of the GeoTriax system is the pneumatically actuated wellbore assembly, which can be remotely activated during centrifuge operation. This feature enables controlled initiation of flow and sand production without interrupting the test, ensuring both safety and continuity under high-g conditions. The system is equipped with pressure transducers and monitoring components to capture both mechanical and hydraulic responses during testing. These measurements enable detailed characterisation of pore pressure evolution, flow behaviour, and production rates, supporting analysis of coupled hydro-mechanical processes.
The overall design of the system – including its approximate mass of 350 kg and geometric configuration – was optimised for operation within the 2 m-radius beam centrifuge at the GeoCERF facility. All electrical, hydraulic, and pneumatic connections were routed through high-g-compatible slip rings and feedthrough systems, ensuring stable operation during acceleration, spinning, and deceleration.
Collectively, these design objectives ensured that GeoTriax could function as a multi-purpose centrifuge-based triaxial cell capable of investigating the interaction between mechanical deformation, fluid migration, and sand production under controlled, field-representative stress and flow conditions. The resulting system bridges the gap between small laboratory tests and full-scale reservoir behaviour, providing a novel experimental tool for coupled geomechanical research. Table 1 summarises the principal design and operational specifications that guided the development of GeoTriax.
Design and operational requirements for the GeoTriax centrifuge triaxial cell
| Feature | Target / specification | Design purpose / description |
|---|---|---|
| Maximum acceleration | Up to 30g | Reproduce prototype stress levels and simulate field-scale effective stresses |
| Sample dimensions | 538 mm (diameter) × 150 mm (height) | Large representative element minimising boundary effects and capturing stress gradients |
| Maximum horizontal stresses in a radial geometry | ≈3.5 MPa | Reproduce in situ horizontal stress around a wellbore |
| Maximum vertical stress | ≈2.5 MPa (pneumatically applied) | Simulate overburden and enable independent stress control |
| Stress anisotropy control | Independent radial and vertical loading | Allow variable triaxial stress states and anisotropy |
| Fluid types | Water, oil, gas (CO2 or N2) | Enable multiphase flow and saturation experiments |
| Flow system pressure capacity | Up to 2.5 MPa (The production flow system is connected to a back-pressure regulator that reduces the flow pressure to 100 kPa, allowing drainage into the acrylic cells located on both sides of the set-up) | Support high-pressure injection and production |
| Wellbore system | Remotely activated concentric perforated tubes | Permit sand and fluid production during spinning |
| Instrumentation | Pressure transducers, load cell, displacement sensors, DAQ integration | Monitor stress, pore pressure, and production in real time |
| Operating environment | 2 m-radius beam centrifuge (GeoCERF) | Safe and stable operation under high-g conditions |
| Total cell weight | ∼350 kg | Within centrifuge payload capacity and structural limits |
2.1 Mechanical design of GeoTriax
The GeoTriax centrifuge triaxial cell (Figure 1) was engineered as a robust, modular, and high-pressure vessel system capable of sustaining large-scale samples and reproducing triaxial stress states under enhanced gravity. Its design emphasises strength, precision, and accessibility, while ensuring full compatibility with the geometric and mass limitations of the GeoCERF.
 The panel a presents the experimental apparatus beside a 1 metre 75 centimetre human scale reference. The assembly includes a counterweight, flight P C s, an arm, a rotary union, an outlet of the rotary union, a data logger and an experimental payload. A detailed view presents the cylindrical experimental payload with its surrounding components and upper actuator assembly. The panel b presents a cutaway of the payload divided into chamber 1, the upper chamber, chamber 2, the central chamber, and chamber 3, the lower chamber. The panel c provides front and section A-A technical views of the chamber assembly. Section A-A marks chambers 1, 2 and 3 and gives an overall height of 818 millimetres, a width of 650 millimetres, a vertical dimension of 495 millimetres and a lower section dimension of 203 millimetres.
Overview of the GeoTriax system and its configuration for centrifuge testing: (a) rendered view of the GeoTriax assembly mounted on the 2 m-radius beam centrifuge at GeoCERF, showing its installation within the centrifuge platform; (b) exterior view with sectional 3D rendering illustrating the main cell body and three-chamber configuration, including the upper loading chamber, central specimen chamber, and lower sand-trap/collection chamber; and (c) 2D cross-sectional engineering schematic showing the internal layout and principal dimensions of the cell
The panel a presents the experimental apparatus beside a 1 metre 75 centimetre human scale reference. The assembly includes a counterweight, flight P C s, an arm, a rotary union, an outlet of the rotary union, a data logger and an experimental payload. A detailed view presents the cylindrical experimental payload with its surrounding components and upper actuator assembly. The panel b presents a cutaway of the payload divided into chamber 1, the upper chamber, chamber 2, the central chamber, and chamber 3, the lower chamber. The panel c provides front and section A-A technical views of the chamber assembly. Section A-A marks chambers 1, 2 and 3 and gives an overall height of 818 millimetres, a width of 650 millimetres, a vertical dimension of 495 millimetres and a lower section dimension of 203 millimetres.Overview of the GeoTriax system and its configuration for centrifuge testing: (a) rendered view of the GeoTriax assembly mounted on the 2 m-radius beam centrifuge at GeoCERF, showing its installation within the centrifuge platform; (b) exterior view with sectional 3D rendering illustrating the main cell body and three-chamber configuration, including the upper loading chamber, central specimen chamber, and lower sand-trap/collection chamber; and (c) 2D cross-sectional engineering schematic showing the internal layout and principal dimensions of the cell
The complete assembly is composed of three major chambers – upper, central, and lower – enclosed within a cylindrical steel body, as illustrated in Figures 1(b) and 1(c). These chambers are functionally interconnected to permit simultaneous stress application, fluid flow, and sand production monitoring (Cartagena-Perez, 2024). The overall structure was fabricated primarily from ASTM A515 (QT-100) steel, providing the necessary yield strength, with selected non-load-bearing components machined from aluminium 7075-T6 to reduce weight. Elastomeric elements (O-rings, membranes, and flexible seals) made of nitrile rubber and silicone were employed in areas requiring sealing and chemical compliance. All sealing interfaces employ nitrile or silicone O-rings housed in precision-machined grooves. Bolted flanges are tightened to calculated torques, following a star-pattern torque sequence to distribute preload evenly and avoid localised leakage.
Manufacturing was carried out using CNC machining, tungsten inert gas, and shielded metal arc welding, with all critical dimensions verified using coordinate-measuring tools to ensure tight tolerances in sealing surfaces.
To enhance durability and resistance to corrosion, all aluminium components were anodised, and the alloy-steel parts were phosphate-coated. This surface-protection approach ensures long-term stability when the cell is exposed to moisture, saline pore fluids, or hydrocarbon environments during testing. Figure 2 presents the GeoTriax cell immediately after fabrication (Figure 2(a)) and after the application of surface-protection treatments (Figure 2(b)).
 The panel a presents the cylindrical chamber with its upper section open. Multiple circular ports mount around the chamber wall, and regularly spaced fasteners surround the lower flange and open upper rim. A cylindrical assembly extends above the chamber opening. The panel b presents the assembled chamber with a circular cap secured by regularly spaced fasteners. A horizontal actuator assembly with parallel cylinders mounts across the cap. Additional actuators, ports, tubing, cables and fittings surround the chamber wall and connect to the assembly.
GeoTriax cell assembly during fabrication: (a) assembled immediately after machining and (b) after protective anodizing and phosphating treatments to prevent corrosion
The panel a presents the cylindrical chamber with its upper section open. Multiple circular ports mount around the chamber wall, and regularly spaced fasteners surround the lower flange and open upper rim. A cylindrical assembly extends above the chamber opening. The panel b presents the assembled chamber with a circular cap secured by regularly spaced fasteners. A horizontal actuator assembly with parallel cylinders mounts across the cap. Additional actuators, ports, tubing, cables and fittings surround the chamber wall and connect to the assembly.GeoTriax cell assembly during fabrication: (a) assembled immediately after machining and (b) after protective anodizing and phosphating treatments to prevent corrosion
A structural finite-element analysis (FEA) was performed using Autodesk Inventor Professional 2021 to verify the integrity and safety of the GeoTriax cell under combined pressure and gravitational loading as shown in Figure 3. The analysis was carried out on a detailed 3D model of the complete assembly to ensure that the principal stress-bearing components – vessel walls, actuator housings, flanges, and chamber interfaces – could withstand the maximum operating conditions within the 2 m-radius centrifuge. Boundary conditions were defined to represent the maximum internal pressure of approximately 2.52 MPa (365 psi) applied simultaneously in the upper chamber, central chamber, and sand-trap section. The gravitational acceleration corresponding to centrifuge operation at 30g was applied along the vertical axis of the model. For computational efficiency, non-load-bearing and low-stiffness elements such as Swagelok fittings, O-rings, Parker motors, and hydraulic pumps were excluded from the FEA study. The safety factor reported in this study corresponds to a deterministic factor of safety, calculated based on the ratio of material strength to induced stress under the maximum design loading conditions. No additional load or material partial factors were applied.
 The three-dimensional model presents the chamber assembly with its upper structure, central components, surrounding housing, actuators and external equipment. The safety factor scale ranges from 0.26 minimum through 3, 6, 9 and 12 to 15 maximum. The upper plate, internal plate, vertical supports and chamber housing carry varying safety factor values across their surfaces. A callout on the chamber identifies a safety factor of 1.8. The coordinate indicator identifies X, Y and Z directions.
Finite-element analysis of the GeoTriax cell. The minimum safety factor of approximately 1.8 occurs in localised regions near welds and structural junctions, while most of the assembly exhibits safety factors between 6 and 12, indicating adequate structural performance
The three-dimensional model presents the chamber assembly with its upper structure, central components, surrounding housing, actuators and external equipment. The safety factor scale ranges from 0.26 minimum through 3, 6, 9 and 12 to 15 maximum. The upper plate, internal plate, vertical supports and chamber housing carry varying safety factor values across their surfaces. A callout on the chamber identifies a safety factor of 1.8. The coordinate indicator identifies X, Y and Z directions.Finite-element analysis of the GeoTriax cell. The minimum safety factor of approximately 1.8 occurs in localised regions near welds and structural junctions, while most of the assembly exhibits safety factors between 6 and 12, indicating adequate structural performance
Results indicated that the minimum safety factor across the assembly was approximately 1.8, occurring in most stress intensive region (welds), as shown in Figure 3. Most structural regions exhibited safety factors between 6 and 12, confirming substantial design margins. Regions of lower safety factor are confined to highly stressed connection zones, whereas the primary load-bearing components, including the vessel walls and actuator housings, remain well within acceptable limits. These results confirm the structural integrity of the GeoTriax cell under combined pressure and centrifugal loading.
2.1.1 General configuration
The GeoTriax geometry was optimised to balance stiffness, sealing integrity, and manufacturability. The main pressure vessel has an internal diameter of approximately 543 mm to accommodate the sample, surrounded by eight hydraulic actuators uniformly distributed along its circumference. The chamber is welded at both ends with thick flanges and secured using lids with high-strength bolts to maintain pressure integrity under the combined influence of internal pressure and centrifugal acceleration.
The modular design allows disassembly for sample preparation and instrumentation access. Each chamber can be accessed individually, facilitating maintenance and the replacement of sensors or seals. The central chamber houses the specimen and most of the loading and flow components, while the upper and lower chambers perform specialised functions – vertical stress application and fluid/sand collection, respectively.
2.1.2 Central chamber and radial loading system
At the core of the GeoTriax lies the triaxial stress-application system, designed to simulate both isotropic and anisotropic stress conditions. Eight equally spaced hydraulic stress actuators apply controlled horizontal stresses in a radial geometry directly to the cylindrical specimen through hardened steel plates. Each actuator is capable of delivering pressures up to 3.5 MPa with a linear displacement of approximately 21.6 mm, allowing the development of realistic stress paths and controlled deformation. Figure 5 illustrates the components of the central chamber along with an example of the test specimen used in GeoTriax. The specimen is a modular 3D-printed porous model (538 mm in diameter and 150 mm in height) produced at the GeoPRINT facility at the University of Alberta using an ExOne M-Flex™ binder-jet printer and assembled from five individual parts due to printer size limitations (Cartagena-Perez, 2024).
The 3D-printed material consists of silica sand particles bonded with a furan-based binder system, forming a weakly cemented porous composite intended to represent poorly cemented reservoir sand. The particle size distribution of the silica sand was defined by characteristic diameters of 110 µm (D10), 175 µm (D50), and 220 µm (D90) (Primkulov et al., 2017). The printing process involves a layered approach. First, a thin coat of activator-treated silica sand is spread across the build platform. The print head then selectively deposits a predetermined volume of furan binder to define the geometry of the specimen. Once the binder contacts the acid-coated sand, polymerisation begins within the pore structure, forming a partially solidified layer. Heat is immediately applied to enhance the crystallisation and strengthening of the resin (Ardila, 2018). This sequence of spreading sand, applying binder, and heating is repeated until the entire specimen is constructed. The printed samples are then removed and placed in an oven to complete the curing process. The printed model of GeoTriax includes simplified internal wormhole features representing the discontinuities and dilated flow paths commonly observed in post-CHOPS reservoirs (Cartagena-Perez, 2024). Prior to centrifuge spinning, the specimen is saturated in stages using water followed by dead oil (oil without dissolved gas) to establish representative reservoir conditions and remove trapped air.
The actuators are driven by Parker BE233DJ-NPSN stepper motors (Figure 4) coupled with RX60-100 planetary gearheads. The working fluid for the Parker motor pump is hydraulic oil. Each motor controls four actuators, enabling symmetrical or asymmetrical loading as required. The use of stepper motors provides displacement control and repeatability. The hydraulic circuit was calibrated to ensure a linear and stable relationship between the applied motor pressure and the resulting radial stress, with dedicated pressure transducers installed at each actuator inlet.
 The first view presents the assembled apparatus with chamber 1, the upper chamber, and chamber 2, the central chamber. Parker motor A connects to piston B, which moves hydraulic oil across the cap. The cutaway identifies chamber 1 as the upper chamber, chamber 2 as the central chamber and chamber 3 as the lower chamber. Parker motor A drives piston B above cap C. Membrane D spans the upper region of the central chamber. Remotely activated wellbore E extends vertically through the sample region towards activator F. Pressure transducer G mounts near the wellbore base. Sand-trap H occupies the lower chamber.
Whole and internal sectional view of the GeoTriax cell highlighting the principal components
The first view presents the assembled apparatus with chamber 1, the upper chamber, and chamber 2, the central chamber. Parker motor A connects to piston B, which moves hydraulic oil across the cap. The cutaway identifies chamber 1 as the upper chamber, chamber 2 as the central chamber and chamber 3 as the lower chamber. Parker motor A drives piston B above cap C. Membrane D spans the upper region of the central chamber. Remotely activated wellbore E extends vertically through the sample region towards activator F. Pressure transducer G mounts near the wellbore base. Sand-trap H occupies the lower chamber.Whole and internal sectional view of the GeoTriax cell highlighting the principal components
 The panel a presents a section through sample A within the chamber. Wellbore B extends vertically through the sample. Stress actuator C presses against the sample perimeter. Out and inlet valve D provides saturation at one surface, while out and inlet valve E provides saturation at the opposite surface. Plate F supports the sample. An inset presents the cylindrical sample with segmented outer surfaces and a central opening. The panel b presents the circular sample assembly around wellbore B and plate F. Eight stress actuators C surround the perimeter. Out and inlet valves D and E occur at the sample perimeter. A second inset presents separated components of a stress actuator.
Central chamber of the GeoTriax triaxial centrifuge cell and its components: (a) sectional view and (b) top view
The panel a presents a section through sample A within the chamber. Wellbore B extends vertically through the sample. Stress actuator C presses against the sample perimeter. Out and inlet valve D provides saturation at one surface, while out and inlet valve E provides saturation at the opposite surface. Plate F supports the sample. An inset presents the cylindrical sample with segmented outer surfaces and a central opening. The panel b presents the circular sample assembly around wellbore B and plate F. Eight stress actuators C surround the perimeter. Out and inlet valves D and E occur at the sample perimeter. A second inset presents separated components of a stress actuator.Central chamber of the GeoTriax triaxial centrifuge cell and its components: (a) sectional view and (b) top view
The interior of the central chamber contains the movable wellbore assembly. The wellbore consists of two concentric stainless-steel tubes: the outer tube remains fixed and perforated along its midsection, while the inner tube (movable part) features two distinct perforation zones – one lined with porous stones for controlled fluid entry and another with open slots for free production. The perforations have a diameter of 8 mm, with five evenly spaced openings. The inner tube can be pneumatically displaced by approximately 23 mm, aligning or misaligning the perforations with those of the outer tube. This motion effectively opens or closes the wellbore, allowing fluid and sand to enter the production chamber. The activation is achieved remotely using compressed nitrogen delivered through a solenoid-controlled valve, eliminating the need for manual intervention during high-g operation. Figure 6 presents the concentric-tube wellbore system used in the GeoTriax cell.
 The panel a presents the piston assembly beside a scale. The upper section contains an open perforation and a porous stone perforation, with O rings below them. A circular piston surrounds the lower shaft. The panel b presents a sectional model of the assembly. The enlarged section details the internal passage through the perforated region. The piston travels vertically along the assembly, with movement indicated in both directions.
GeoTriax movable wellbore system: (a) details of actual inner wellbore and (b) arrangement and direction of movement of the wellbore assembly inside the GeoTriax central chamber
The panel a presents the piston assembly beside a scale. The upper section contains an open perforation and a porous stone perforation, with O rings below them. A circular piston surrounds the lower shaft. The panel b presents a sectional model of the assembly. The enlarged section details the internal passage through the perforated region. The piston travels vertically along the assembly, with movement indicated in both directions.GeoTriax movable wellbore system: (a) details of actual inner wellbore and (b) arrangement and direction of movement of the wellbore assembly inside the GeoTriax central chamber
This wellbore mechanism provides a versatile means of simulating the onset of production or sand failure at a chosen stage during a centrifuge test. The ability to trigger flow without halting the experiment represents a substantial advancement over traditional triaxial set-ups, which typically require disassembly or pressure release between test phases.
2.1.3 Upper chamber and vertical loading system
The upper chamber of GeoTriax is dedicated to the application of vertical (axial) stress. It is separated from the central specimen chamber by a flexible elastomeric membrane, made of fabric-reinforced multipurpose neoprene sheet, 3/16″ thick, as shown in Figure 7, which transmits vertical pressure uniformly to the top of the specimen. Vertical stress is applied pneumatically using compressed nitrogen or air, and the magnitude of stress can be precisely adjusted by regulating the chamber pressure.
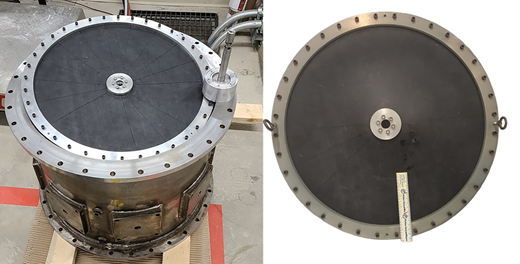
The vertical loading configuration was selected instead of a mechanical ram system to reduce the number of moving parts subjected to centrifugal forces and to ensure equal stress distribution across the sample top. Pneumatic loading also permits dynamic adjustment during spinning, allowing stress changes to be synchronised with flow or pressure variations in real time.
2.1.4 Lower chamber and sand-trap assembly
The lower chamber serves a dual purpose: it contains a sand trap for collecting fluids and sand produced during testing and provides a reservoir for monitoring production rates. Figure 8 presents the lower chamber, dividing plate, and sand trap. The sand trap is directly connected to the central wellbore. The outlet of sand trap is connected through Swagelok fittings to the back-pressure regulator (BPR) for remote control of outlet pressure of outflow fluids and gases (Figure 8(a)). A set of cylindrical tubes provide structural support for the plate that separates the two chambers (Figure 8(b)). Inside, a removable sand-trap canister captures mobilised solids, enabling post-test quantification of produced material.
 The panel a presents a three-dimensional arrangement inside the circular chamber. Back-pressure regulators A connect to tubing around the perimeter. Cylindrical structural support B stands among multiple vertical cylindrical supports. Wellbore C occupies the central region, with sand-trap D beside it and connected tubing extending across the internal plate. The panel b presents the corresponding chamber assembly with a circular upper plate supported by multiple vertical posts. A cylindrical central component and connected tubing mount on the plate. A separate view presents the upper cylindrical assembly positioned above the chamber opening.
Lower chamber and sand-trap assembly: (a) lower chamber configuration and (b) movable sand trap
The panel a presents a three-dimensional arrangement inside the circular chamber. Back-pressure regulators A connect to tubing around the perimeter. Cylindrical structural support B stands among multiple vertical cylindrical supports. Wellbore C occupies the central region, with sand-trap D beside it and connected tubing extending across the internal plate. The panel b presents the corresponding chamber assembly with a circular upper plate supported by multiple vertical posts. A cylindrical central component and connected tubing mount on the plate. A separate view presents the upper cylindrical assembly positioned above the chamber opening.Lower chamber and sand-trap assembly: (a) lower chamber configuration and (b) movable sand trap
2.2 Fluid flow and pneumatic system
The GeoTriax cell integrates a flow network designed to simulate multiphase fluid movement within a deformable reservoir. The flow system consists of inlet and outlet valves positioned at both the top and bottom of the sample (central chamber 2) (Figure 5), creating a controlled flow network that enables uniform saturation and drainage. This configuration ensures that pressure gradients and saturation fronts remain symmetrical during injection or production, minimising preferential flow paths and non-uniform pore-pressure distribution.
A pneumatic supply network delivers water, oil, or gas to the sample under controlled pressure conditions. The entire system is remotely operated for safety, allowing the user to perform injections, back-pressurisation, or depressurisation without direct interaction during centrifuge spinning. The saturation and production phases are divided into stages conducted prior to centrifuge operation and stages conducted during spinning. The flow network permits staged saturation procedures, such as sequential injection of water, oil, and solvent gas, thereby replicating field operations like CSI.
The saturation process with water and dead oil (oil with injected carbon dioxide) is conducted prior to centrifuge spinning, while the apparatus remains stationary in the laboratory. This pre-saturation stage ensures full fluid distribution and air removal within the specimen before loading the device onto the centrifuge platform. The process continued until stable pressure conditions were achieved and no visible air bubbles were observed at the outlet, indicating full saturation of the specimen. After saturation with ‘dead’ oil, the valves are closed, and the set-up is transferred to the centrifuge arm with minimal fluid loss, preserving the initial hydraulic conditions (Cartagena-Perez, 2024). Diagrams of saturation with carbon dioxide, water, and oil are shown in Figures 9(a)–(c), respectively.
 The panel a connects a C O 2 cylinder through P R 1 and valve A to the sample chamber. P R 2 supplies membrane pressure. A gauge monitors chamber pressure. Valves F and B connect the chamber to an accumulator and P R 3, which leads to the fume hood. Valve C and B P R 1 connect to pilot reference pressure. Valve D connects to the lower chamber line. The panel b connects a reservoir through valve E to a Quizix pump, then through valve A to the chamber. Valve G supplies pressure to the jacks, while P R 2 supplies the membrane. Valves F, K, B and C connect the chamber to B P R 1, pilot reference pressure and a Carboy leading to the fume hood. A second Carboy connects through B P R 2 and valve D to the chamber. The panel c connects pump A to three N 2 dead oil accumulators maintained at 40 to 45 degrees Celsius, then through valve A to the chamber. Valve G supplies the jacks and P R 2 supplies the membrane. B P R 2 and valve D connect a Carboy and pilot reference pressure to the chamber. Valves F, K, B and C provide additional chamber connections.
Schematic diagrams of the staged saturation procedures used for GeoTriax specimen preparation: diagrams of (a) CO2 saturation, (b) water saturation, and (c) dead oil saturation
The panel a connects a C O 2 cylinder through P R 1 and valve A to the sample chamber. P R 2 supplies membrane pressure. A gauge monitors chamber pressure. Valves F and B connect the chamber to an accumulator and P R 3, which leads to the fume hood. Valve C and B P R 1 connect to pilot reference pressure. Valve D connects to the lower chamber line. The panel b connects a reservoir through valve E to a Quizix pump, then through valve A to the chamber. Valve G supplies pressure to the jacks, while P R 2 supplies the membrane. Valves F, K, B and C connect the chamber to B P R 1, pilot reference pressure and a Carboy leading to the fume hood. A second Carboy connects through B P R 2 and valve D to the chamber. The panel c connects pump A to three N 2 dead oil accumulators maintained at 40 to 45 degrees Celsius, then through valve A to the chamber. Valve G supplies the jacks and P R 2 supplies the membrane. B P R 2 and valve D connect a Carboy and pilot reference pressure to the chamber. Valves F, K, B and C provide additional chamber connections.Schematic diagrams of the staged saturation procedures used for GeoTriax specimen preparation: diagrams of (a) CO2 saturation, (b) water saturation, and (c) dead oil saturation
Fluid injection and withdrawal are regulated using two BPRs that maintain reservoir-like pore pressures and govern outflow rates. The pneumatic and flow systems could provide the necessary control to reproduce dynamic reservoir conditions under centrifuge scaling, including transient pressure fluctuations, cyclic injection sequences, and multiphase displacement, all while maintaining stable operation and experimental repeatability.
2.3 Instrumentation and data acquisition
Comprehensive instrumentation was integrated into the GeoTriax system to enable continuous and synchronised monitoring of mechanical and hydraulic variables during centrifuge operation. The design and placement of sensors were optimised to capture the evolution of stresses and pore pressures throughout each test.
2.3.1 Pressure and stress transducers
A total of five high-accuracy pressure transducers, shown in Figure 10, were installed within the apparatus: four located beneath the sample plate to record pore-water pressures and stress changes near the base of the specimen, and one positioned on the side of the sand-trap chamber to monitor production pressure and flow continuity. These measurements provide direct insight into fluid migration and the development of excess pore pressures during injection and production cycles. For pressure measurements inside the cell, Avery sensors (AV800) with a capacity of 7 MPa were used to monitor changes in pore pressure. To ensure measurement accuracy, all pressure transducers were calibrated using a GE Druck DPI 603 portable pressure calibrator with a maximum operating pressure of 300 psi (2.07 MPa). The calibration procedure established the relationship between applied pressure and sensor voltage output and confirmed strong linearity and reliable sensor performance.
 The first panel presents a circular chamber plate with multiple cables arranged across its surface and connection points near the centre. A pressure transducer connects near the plate edge, with its cable extending across the plate. The second panel presents a transparent three-dimensional chamber model containing an internal cylindrical assembly, a central vertical tube, an internal plate and surrounding supports. A pressure transducer mounts on the outer chamber wall near the base.
Locations of pressure transducers installed within the GeoTriax system
The first panel presents a circular chamber plate with multiple cables arranged across its surface and connection points near the centre. A pressure transducer connects near the plate edge, with its cable extending across the plate. The second panel presents a transparent three-dimensional chamber model containing an internal cylindrical assembly, a central vertical tube, an internal plate and surrounding supports. A pressure transducer mounts on the outer chamber wall near the base.Locations of pressure transducers installed within the GeoTriax system
Additional auxiliary pressure/stress transducers were also used within the hydraulic control system, including Honeywell FPG-5000 psi (34.47 MPa) and MEAS (TE Connectivity) M5800-10,000 psi (68.95 MPa) sensors. These sensors were calibrated using the same procedure and served as reference sensors for monitoring actuator pressures and hydraulic loading during testing.
2.3.2 Load cell
An Omega LCMHD-10K load cell was installed to measure the total vertical force applied to the specimen. The load cell was calibrated using known weights prior to testing, and the results showed a coefficient of determination (R2) of approximately 99.9%, confirming accurate and reliable measurement of axial loading throughout the experiments (Cartagena-Perez, 2024).
2.3.3 Actuators
The horizontal confining stresses applied to the specimen were generated using Parker stepper-motor-driven hydraulic actuators. Since the centrifuge applies radial stress through hydraulic pistons, calibration was required to establish the relationship between motor displacement (number of motor steps), piston pressure, and the resulting confining stress applied to the sample. The calibration set-up consisted of a hydraulic oil reservoir, piston system, pressure transducers, and the Omega LCMHD-10K load cell used as a reference for applied force measurement. During calibration, the stepper motor progressively pressurised the hydraulic system, and the corresponding piston pressure and load cell response were recorded simultaneously. This procedure was performed during both loading and unloading stages to verify repeatability and consistency of the system. This calibration enabled accurate control of radial stresses during centrifuge testing and ensured that programmed stress paths could be reproduced reliably under high-g conditions.
2.3.4 Back-pressure regulators
Two BPRs were evaluated to control outlet pressure and maintain stable fluid discharge during centrifuge testing. The BPR regulates pressure upstream of the outlet line by opening only when the inlet pressure exceeds the preset reference pressure, thereby controlling pressure release and ensuring stable flow conditions. Both devices were Equilibar regulators with a maximum operational pressure of 800 psi (5.52 MPa). BPR1 was an Equilibar GSDM2SNT5A, while BPR2 was an Equilibar GSDH2SNT5A. One of the BPRs and connections are shown in Figure 11. These were different regulator models from the same manufacturer rather than duplicate units; the second model was included during the development stage as an available alternative for the GeoTriax flow-control system. One of the BPRs and its connections is shown in Figure 11.
 The first view presents the installed back pressure regulator, B P R 2, connected to an inlet and an outlet. Hydraulic oil flows through the horizontal line from the inlet, through B P R 2 and towards the outlet. A nitrogen, N 2, supply line connects to the regulator from above. The second view presents the cylindrical Equilibar back pressure regulator with multiple fasteners on its upper surface. A centimetre scale beside the regulator indicates its height.
Back-pressure regulator set-up
The first view presents the installed back pressure regulator, B P R 2, connected to an inlet and an outlet. Hydraulic oil flows through the horizontal line from the inlet, through B P R 2 and towards the outlet. A nitrogen, N 2, supply line connects to the regulator from above. The second view presents the cylindrical Equilibar back pressure regulator with multiple fasteners on its upper surface. A centimetre scale beside the regulator indicates its height.Back-pressure regulator set-up
2.3.5 Solenoid valve
A solenoid valve was incorporated into the hydraulic control system to regulate fluid flow and enable remote activation of selected flow paths during centrifuge operation. The valve operates through an electromagnetic plunger mechanism that opens or closes the flow passage when electrical current is applied (Cartagena-Perez, 2024). Because its performance depends on the movement of the internal plunger, commissioning tests were conducted under both 1 g and enhanced gravity conditions to verify reliable operation. Testing showed that the solenoid valve functioned properly in the horizontal position (Figure 12); however, under centrifuge spinning, the horizontal orientation cannot be used, therefore, the solenoid valve was replaced by a manual valve for the final system configuration to ensure consistent and safe flow control during high-g testing.
 The panel a presents solenoid valve A connected through tubes B between two vertical reservoirs C. The reservoirs contain liquid, with a horizontal reference line crossing both reservoirs above the visible liquid level. The panel b presents the solenoid valve connected by tubing to the two reservoirs. One reservoir contains a higher liquid level than the other. The lower liquid level in the second reservoir appears within the marked region near its base.
Performance of the solenoid valve during commissioning tests: (a) horizontal position resulting in pressure equalisation and (b) vertical orientation, showing no fluid transfer
The panel a presents solenoid valve A connected through tubes B between two vertical reservoirs C. The reservoirs contain liquid, with a horizontal reference line crossing both reservoirs above the visible liquid level. The panel b presents the solenoid valve connected by tubing to the two reservoirs. One reservoir contains a higher liquid level than the other. The lower liquid level in the second reservoir appears within the marked region near its base.Performance of the solenoid valve during commissioning tests: (a) horizontal position resulting in pressure equalisation and (b) vertical orientation, showing no fluid transfer
2.3.6 Data acquisition system
The data acquisition (DAQ) system was built around an HBM QuantumX MX1601 module integrated with the centrifuge control system to enable continuous and synchronised monitoring of mechanical and hydraulic responses during testing. The MX1601 supports up to 16 measurement channels, with 12 channels actively used in the system. The DAQ is capable of recording analogue voltage signals in the ranges of 100 mV, 10 V, and 60 V, as well as IEPE-type sensor inputs and 20 mA current signals. The system supports a sampling frequency range of 0.1–20 000 Hz. Power for the sensors was supplied directly through the DAQ. The onboard Broadbent system also provides auxiliary voltage supplies of −5, +5, +10, and +15 V for signal conditioning and sensor integration which was used for some of the sensors. All recorded parameters were time-stamped and stored for post-processing, enabling the reconstruction of complete stress and pore pressure histories.
Through this integrated instrumentation and DAQ framework, GeoTriax achieves high-fidelity monitoring of coupled hydro-mechanical behaviour under enhanced gravity, providing reliable datasets for both validation of numerical models and development of predictive constitutive relationships.
3. Experimental programme and performance evaluation
The commissioning and performance evaluation of GeoTriax were conducted through a series of progressively staged commissioning tests aimed at verifying the mechanical integrity, operational functionality, and integrated performance of the system under enhanced gravity conditions. These experiments evaluated not only the response of individual subsystems but also their ability to function collectively as a coordinated experimental platform during centrifuge operation.
3.1 Pre-commissioning and leak-integrity testing
The initial system-level commissioning focused on verifying the pressure integrity of the GeoTriax assembly prior to centrifuge operation. The cell was filled with approximately 50 kg of water to minimise nitrogen consumption and enhance leak detection sensitivity. The chambers were sealed and pressurised to approximately 2 MPa using nitrogen. Figure 13 shows the GeoTriax central chamber filled with water during pre-commissioning.
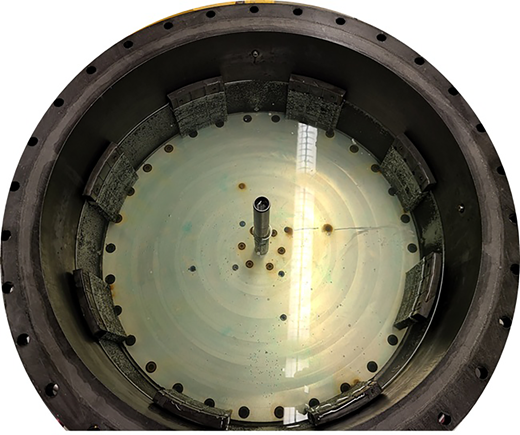
GeoTriax central chamber filled with water during pre-commissioning leak test
GeoTriax central chamber filled with water during pre-commissioning leak test
Following confirmation of stable pressure conditions, the system was mounted on the centrifuge swing (Figure 14), and the pressure response was monitored under 1 g for 1 h prior to spinning. The centrifuge was then gradually accelerated from 1g to 30g, while all sensors, actuators, and control systems remained active. During this stage, hydraulic actuators applied confining stresses, and the flow control system, including the BPR, was engaged to simulate operational conditions.
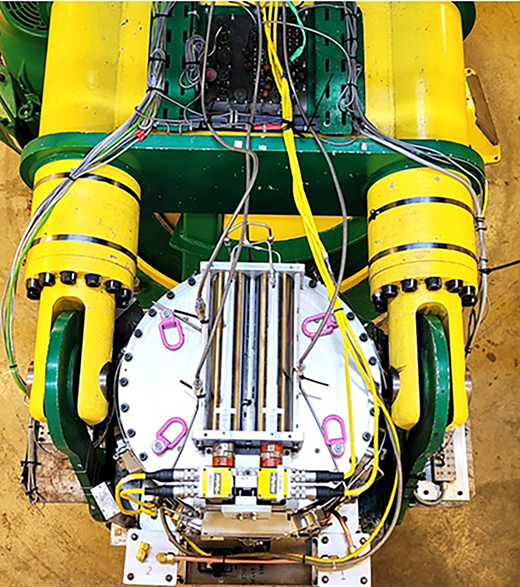
GeoTriax system installed on the GeoCERF centrifuge platform prior to enhanced-gravity testing
GeoTriax system installed on the GeoCERF centrifuge platform prior to enhanced-gravity testing
The evolution of internal pressures throughout the test is presented in Figure 15. Pressure transducers located in the sand trap (CH5, positioned below the other channels) and within the sample chamber (CH1, CH3, CH4) exhibited consistent and synchronised responses throughout the test stages. The test sequence is divided into six stages (A–F), corresponding to key operational steps:
Initial pressurisation, during which the system pressure is increased using nitrogen to reach the target operating level.
Sealing verification, where pressure is maintained under static conditions to confirm the absence of leakage.
Acceleration phase, during which the centrifuge is ramped from 1g to 30g.
Steady-state spinning, where the system operates at 30g without fluid production.
Controlled production, during which the BPR is adjusted to allow fluid discharge.
Deceleration phase, where the centrifuge is gradually brought back to 1g.
 The line graph plots pressure from 1.50 to 2.20 megapascals against time from 0 to 100 minutes. C H 1, C H 3, C H 4 and C H 5 rise rapidly from about 1.60 megapascals to approximately 2.05 to 2.14 megapascals during phase A, initial pressurisation. During phase B, sealing performance, pressures remain nearly steady, with C H 5 near 2.12 megapascals, C H 3 near 2.10 megapascals, C H 1 near 2.05 megapascals and C H 4 near 2.02 megapascals. During phase C, acceleration phase, all pressures rise. During phase D, steady-state spinning, C H 5 remains near 2.16 megapascals, C H 3 near 2.13 megapascals, C H 1 near 2.11 megapascals and C H 4 near 2.06 megapascals. During phase E, controlled production, the pressures decrease, then partially recover. Phase F follows, with pressures decreasing towards approximately 2.10, 2.08 and 2.00 megapascals for the visible series.
Evolution of pressure within the GeoTriax during the commissioning test
The line graph plots pressure from 1.50 to 2.20 megapascals against time from 0 to 100 minutes. C H 1, C H 3, C H 4 and C H 5 rise rapidly from about 1.60 megapascals to approximately 2.05 to 2.14 megapascals during phase A, initial pressurisation. During phase B, sealing performance, pressures remain nearly steady, with C H 5 near 2.12 megapascals, C H 3 near 2.10 megapascals, C H 1 near 2.05 megapascals and C H 4 near 2.02 megapascals. During phase C, acceleration phase, all pressures rise. During phase D, steady-state spinning, C H 5 remains near 2.16 megapascals, C H 3 near 2.13 megapascals, C H 1 near 2.11 megapascals and C H 4 near 2.06 megapascals. During phase E, controlled production, the pressures decrease, then partially recover. Phase F follows, with pressures decreasing towards approximately 2.10, 2.08 and 2.00 megapascals for the visible series.Evolution of pressure within the GeoTriax during the commissioning test
During the sealing verification stage (B), the pressure remained stable, indicating effective sealing with no detectable leakage between the sample chamber and sand-trap system. Throughout the steady-state spinning phase (D), pressure readings from CH1, CH3, and CH4 remained nearly constant and closely aligned, with differences of less than approximately 3.5%, demonstrating uniform pressure distribution within the sample chamber. As the centrifuge accelerated to 30g (stage C), a moderate increase in pressure was observed due to the contribution of fluid self-weight under enhanced gravity. The measured pressure increase was consistent with theoretical expectations, confirming the reliability of the system response under centrifuge scaling.
At stage E, the BPR was adjusted to initiate a short production interval of approximately 30 s. This resulted in a controlled pressure drop and subsequent stabilisation, confirming the proper functioning of the flow control system and the ability of the GeoTriax set-up to simulate production conditions. During this phase, approximately 245 cm³ of water was produced, demonstrating the system’s capability to generate measurable and controlled fluid flow under high-g conditions. Following production, the centrifuge was gradually decelerated (stage F), and pressure levels returned smoothly to initial conditions without instability. Overall, the consistent and synchronised pressure responses across all channels confirm the robustness of the GeoTriax system and its ability to maintain stable mechanical and hydraulic conditions throughout the full test sequence (Cartagena-Perez, 2024).
3.2 Wellbore activation performance evaluation
A subsequent commissioning test was conducted to evaluate the performance of the movable wellbore system under centrifuge spinning conditions. The GeoTriax cell was filled with water and pressurised to approximately 2 MPa, consistent with the pre-commissioning tests, and then installed on the centrifuge. The system was accelerated to 30g while maintaining stable hydraulic and mechanical conditions.
Once steady-state spinning was achieved, the wellbore was activated by applying nitrogen pressure of approximately 3.5 MPa through the pneumatic control line. The system response during this process is shown in Figure 16, which presents the evolution of pressure recorded by multiple transducers over time. At approximately 35 minutes, a distinct increase in pressure is observed. This pressure response indicates the successful opening of the inner perforated tube and the establishment of hydraulic communication between the sample chamber and the sand-trap system. The synchronised response across all sensors confirms that the activation process did not induce instability or abnormal pressure fluctuations within the system.
 The line graph plots pressure from 0.50 to 2.50 megapascals against time from 0 to 70 minutes for C H 1, C H 2, C H 3, C H 4 and C H 5. Near the start of spinning, C H 2 rises to about 2.18 megapascals, while the other series settle between approximately 2.03 and 2.09 megapascals. The pressures then remain nearly steady. Near 34 minutes, opening the wellbore produces a brief rise in C H 1 followed by recovery. Near 43 minutes, the series decrease slightly, with C H 2 remaining highest at about 2.15 megapascals and the others near 2.02 to 2.06 megapascals. At production near 53 minutes, all series fall sharply. They pass approximately 1.45 to 1.60 megapascals near 55 minutes and continue decreasing to approximately 0.92 to 1.04 megapascals near 64 minutes.
Evolution of pressure within the GeoTriax during the spinning and opening the wellbore
The line graph plots pressure from 0.50 to 2.50 megapascals against time from 0 to 70 minutes for C H 1, C H 2, C H 3, C H 4 and C H 5. Near the start of spinning, C H 2 rises to about 2.18 megapascals, while the other series settle between approximately 2.03 and 2.09 megapascals. The pressures then remain nearly steady. Near 34 minutes, opening the wellbore produces a brief rise in C H 1 followed by recovery. Near 43 minutes, the series decrease slightly, with C H 2 remaining highest at about 2.15 megapascals and the others near 2.02 to 2.06 megapascals. At production near 53 minutes, all series fall sharply. They pass approximately 1.45 to 1.60 megapascals near 55 minutes and continue decreasing to approximately 0.92 to 1.04 megapascals near 64 minutes.Evolution of pressure within the GeoTriax during the spinning and opening the wellbore
Following wellbore activation, the system maintained stable pressure conditions during continued spinning, demonstrating that the wellbore mechanism can be operated reliably without disrupting the overall stress and flow regime. Post-test inspection further confirmed the successful operation of the wellbore system. As shown in Figure 17, the inner perforated tube was fully displaced, and the alignment of the perforations between the concentric wellbore sleeves was clearly observed. This visual verification supports the sensor-based interpretation and confirms that the aperture mechanism functioned as intended under high-g conditions.
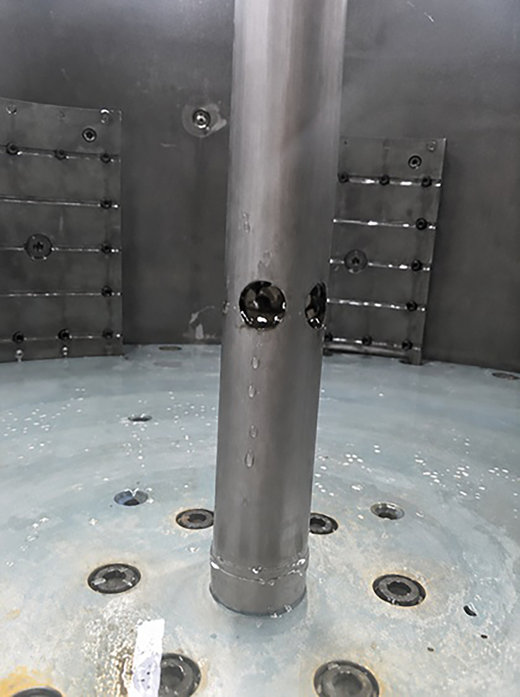
Post-test inspection showing successful activation and operation of the wellbore
Post-test inspection showing successful activation and operation of the wellbore
Overall, the combined pressure measurements and visual observations demonstrate that the remote-controlled wellbore activation system operates reliably and safely during centrifuge testing, enabling controlled initiation of flow and sand production without interrupting centrifuge operation.
3.3 Membrane commissioning and reinforcement
The membrane separating the upper and central chambers was tested to evaluate its performance under differential pressurisation. The membrane maintained effective sealing throughout most of the test but exhibited excessive displacement when subjected to transient overpressure, which led to localised tilting and subsequent leakage. Following the event, the assembly was reinforced with additional circumferential studs around the membrane perimeter to improve stiffness and prevent lateral displacement. Updated operating procedures were implemented to ensure safe pressurisation sequences, and subsequent trials confirmed reliable performance under nominal loading conditions.
3.4 Back-pressure regulator performance
Commissioning tests were conducted under both 1g and 30g conditions to evaluate the performance of two back-pressure regulators (BPR1 and BPR2) under enhanced gravity. At 1g, both BPRs maintained stable outlet pressure and responded appropriately when the inlet pressure exceeded the reference pressure. However, under 30g conditions, only BPR1 demonstrated reliable operation, with rapid pressure stabilisation and controlled outlet response at approximately 3 MPa. BPR2 exhibited unstable behaviour during repeated 30g tests and was unable to maintain consistent pressure control, making it unsuitable for final testing. The observed difference is therefore attributed to the different regulator model/configuration rather than malfunction of duplicate units. Based on these results, BPR1 was selected for the final GeoTriax configuration to ensure stable pressure regulation and reliable fluid production during centrifuge operation.
3.5 Integrated system functionality
The integrated tests assessed the combined mechanical–hydraulic performance of the GeoTriax cell. During prolonged spinning at 30g, the system maintained stable triaxial stress conditions, controlled fluid pressurisation, and real-time monitoring of pressure and flow responses. Controlled production through BPR-1 yielded approximately 245 cm³ of water within a 30-s interval, demonstrating the system’s capability to reproduce realistic multiphase flow and sand-production processes under centrifuge scaling.
Figure 18 presents a schematic diagram of the integrated centrifuge testing system, illustrating the hydraulic and pneumatic connections between the surface supply and the GeoTriax cell. Two pressurised cylinders located at the surface provide gas supply to the system through multiple lines: Line 1 is used for wellbore activation, Line 3 supplies pressure to the membrane system, and Line 4 provides reference pressure to the back-pressure regulator (BPR-1). A lower-pressure cylinder is used for controlled BPR operation. During centrifuge spinning, pressure is continuously supplied to both the membrane and BPR-1 to maintain stable confinement and prevent premature flow from the sand trap. Radial stresses are applied to the sample through hydraulic jacks driven by the Parker stepper-motor system, ensuring controlled mechanical loading throughout the test.
 The schematic places the GeoCERF pit below the surface and connects a rotary union through lines 1, 2, 3 and 4. Lines 1 and 3 connect to a cylinder with compressed air, carbon dioxide or nitrogen plus a pressure regulator. Line 4 connects to a pilot cylinder with compressed air, carbon dioxide or nitrogen plus a pressure regulator. Line 2 connects to the carbon dioxide collector. Maximum pressures of 3 megapascals, 4 megapascals, 300 kilopascals and 100 kilopascals mark different lines. The central assembly contains a membrane above the sample and P R 2 beneath it. A pressure supply for the membrane passes through P R 2, and another pressure supply serves the jacks. A Parker motor, gear head and hydraulic cylinder connect to the sample assembly. Valves A, B, C, D, F, G and K control connected lines. B P R 1 connects valve B to the pilot reference pressure line and the carbon dioxide collection circuit. Two dead oil containers connect to this circuit. An electrically operated air on and off valve has a 1 over 4 N P T port, normally closed operation and 120 V A C supply. The note states that 30 grams creates around 11 P S I, 75.8 kilopascals, pressure for the wellbore. A key identifies valve and manual pressure regulator symbols.
Schematic diagram of the integrated GeoTriax centrifuge test set-up
The schematic places the GeoCERF pit below the surface and connects a rotary union through lines 1, 2, 3 and 4. Lines 1 and 3 connect to a cylinder with compressed air, carbon dioxide or nitrogen plus a pressure regulator. Line 4 connects to a pilot cylinder with compressed air, carbon dioxide or nitrogen plus a pressure regulator. Line 2 connects to the carbon dioxide collector. Maximum pressures of 3 megapascals, 4 megapascals, 300 kilopascals and 100 kilopascals mark different lines. The central assembly contains a membrane above the sample and P R 2 beneath it. A pressure supply for the membrane passes through P R 2, and another pressure supply serves the jacks. A Parker motor, gear head and hydraulic cylinder connect to the sample assembly. Valves A, B, C, D, F, G and K control connected lines. B P R 1 connects valve B to the pilot reference pressure line and the carbon dioxide collection circuit. Two dead oil containers connect to this circuit. An electrically operated air on and off valve has a 1 over 4 N P T port, normally closed operation and 120 V A C supply. The note states that 30 grams creates around 11 P S I, 75.8 kilopascals, pressure for the wellbore. A key identifies valve and manual pressure regulator symbols.Schematic diagram of the integrated GeoTriax centrifuge test set-up
The BPR-1 is set to a predefined pressure to restrict fluid discharge under steady-state conditions. When production is initiated, pressure is applied through Line 1 to activate the wellbore system. At the same time, the air on/off valve is opened (It is normally closed during operation to prevent unintended wellbore activation under centrifugal forces). This controlled activation enables fluid flow from the sample into the sand trap. Following production, excess gas (carbon dioxide) is safely vented through Line 2 back to the surface collector system, ensuring stable pressure conditions within the cell.
4. Discussion
The commissioning and performance evaluation results presented in the previous section demonstrated that the GeoTriax centrifuge cell is capable of reproducing field-representative triaxial stress conditions, and wellbore production mechanisms under enhanced gravity scaling. The integrated system successfully combined mechanical loading, pneumatic pressurisation, and real-time DAQ, establishing its functionality as a novel experimental platform for coupled geomechanical and flow behaviour studies.
Compared with conventional triaxial cells, GeoTriax provides several significant advantages: (1) Sample size and stress capacity: the device accommodates cylindrical samples up to approximately 538 mm in height and 150 mm in diameter, while sustaining radial and axial stresses up to 2.5 MPa. This enables realistic stress gradients and deformation patterns that are otherwise unachievable in small-scale tests. (2) Integrated wellbore system: the inclusion of a remotely controlled, movable wellbore allows direct simulation of fluid production and sand release, a capability rarely available in centrifuge-based or standard triaxial systems. (3) Realistic flow regimes: pressure–time responses observed during commissioning (Figures 15 and 16) indicate the development of controlled flow behaviour around the wellbore.
Building upon these advantages, the study of carbon dioxide CSI in post-CHOPS reservoirs demonstrated the capability of GeoTriax to simulate and analyse coupled flow–geomechanical behaviour representative of post-CHOPS reservoir conditions (Cartagena-Perez, 2024). Beyond its mechanical versatility, the system enables direct quantification of pore-pressure evolution and fluid production changes during centrifuge spinning. Furthermore, visual and sensor-based observations could reveal cavity formation, cracking, and sand migration around the wellbore, offering valuable insight into failure mechanisms and wormhole evolution under realistic stress and drainage environments (Cartagena-Perez, 2024).
Despite these achievements, several limitations were observed during commissioning. The requirement for remote operation under spinning conditions limits direct experimental intervention, necessitating detailed pre-test planning and automation. In addition, certain gravity-sensitive components, such as BPRs solenoid valves, stepper motors, and gearheads, could exhibit altered behaviour under high-g conditions, highlighting the need for specialised high-gravity-compatible hardware.
Nonetheless, the successful commissioning of GeoTriax demonstrates the feasibility and reliability of conducting coupled flow–deformation experiments under centrifuge scaling. The system significantly extends the capabilities of geotechnical centrifuge modelling into the domain of petroleum, energy, and environmental geomechanics, enabling controlled studies of reservoir performance, sand migration, and multiphase transport processes. GeoTriax provides a foundation for diverse applications, including post-CHOPS reservoirs and wellbore stability analysis and can become a novel tool for multi-physics experimental research in subsurface energy systems.
5. Conclusions
This paper presented the design, commissioning, and performance evaluation of GeoTriax, a novel centrifuge triaxial cell developed to investigate coupled geomechanical and multiphase flow processes under elevated gravity. The main findings and conclusions are summarised as follows:
A robust large-scale centrifuge cell was constructed using steel and aluminium, weighing approximately 350 kg and designed to fit within the 2 m-radius beam centrifuge at the University of Alberta.
GeoTriax successfully applies triaxial stress states through eight hydraulic actuators and a pneumatic vertical loading system, achieving up to 3.5 MPa of horizontal stresses in a radial geometry.
The movable wellbore system operated reliably under 30g, enabling controlled activation and production of fluids and solids into the sand trap.
Commissioning tests, supported by measured pressure responses and controlled production data, verified leak integrity, accurate pressure monitoring, and stable flow regulation, confirming the system’s readiness for advanced experimental programmes.
Drawdown analysis validated that the centrifuge set-up reproduces radial flow regimes, bridging the gap between small-scale laboratory testing and field-scale reservoir behaviour.
The successful design and performance evaluation of the GeoTriax system demonstrate its capability as an integrated experimental platform for investigating coupled mechanical and hydraulic behaviour under centrifuge scaling. The combination of geotechnical centrifuge modelling and additive manufacturing establishes a framework for experimental exploration of multi-scale, multi-physics processes in subsurface systems. This platform enables controlled investigation of interactions between stress, fluid flow, and deformation, addressing challenges related to sampling, flow behaviour, and material response under field-representative conditions. Therefore, GeoTriax represents an advancement in centrifuge physical modelling and applied geomechanics. The apparatus provides an experimental framework for supporting the development and validation of numerical models and for improving the understanding of coupled processes relevant to subsurface engineering applications.
Daniel Felipe Cartagena-Perez
Mahsa Shafaei Bajestani
Dmytro Pantov
Alireza Rangriz Shokri
Rick Chalaturnyk
Gonzalo Zambrano-Narvaez
Acknowledgements
This work was partially supported by Mitacs through the Mitacs Accelerate programme. The authors gratefully acknowledge the Heavy Oil Research Network programme, managed by the Petroleum Technology Research Centre, Regina for providing partial funding of this research project. The authors gratefully acknowledge the NSERC/Energi Simulation Industrial Research Chair in Reservoir Geomechanics in Unconventional Resources for additional funding, and Autodesk Inventor for providing the analysis package.

