


Technology-enhanced learning (TEL), undoubtedly, creates a big difference in higher education students' knowledge and growth, which helps them become globally competitive in the job market eventually. The present study aims to investigate the effect of various factors, i.e. informational quality, compatibility, resource availability, subjective norms, subject interest, institutional branding and self-efficacy on students' adoption intention to TEL enrolled in different government and private educational institutes in Chhattisgarh state.
The primary data were collected from 600 students from different universities and colleges using purposive sampling technique with “criterion sampling”. Hierarchal multiple regression (stepwise) analysis was used on the collected data.
Results concluded that factors, i.e. compatibility, resource availability, subjective norms, subject interest and institutional branding are significantly and positively influencing students' adoption intention to TEL in Chhattisgarh, whereas self-efficacy and informational quality of TEL did not contribute significant effect for students' adoption intention.
There is a lack of research in the knowledge domain, especially in the field of TEL, in the state of Chhattisgarh. The different variables taken in the present study, such as informational quality, self-efficacy, institutional branding, subjective norms, resource availability, compatibility and subject interest of TEL, are the first of its kind where these variables are being examined on the students' adoption intention to TEL.
Introduction
Technology is everywhere in everything we are engaged (Muir-Herzig, 2004). Looking at current trend, the future will be more full of technology-equipped environment. For instance, the students who are entering schools are already skilled of using technology. As an effect, the educational institutions must upgrade and update their services, especially in the usage of learning technologies so that the ultimate learning outcome can be achieved. Cookson and Schneider (1995) have argued that as the children, who born in the year 1994, will graduate from primary school in the year 2013 and if they have normal endurance, their work lives will last till the mid of the 21st century. As a result, the world, they will live and work, will be completely different as compared to the world of their parents and teachers.
Newton (2003) stated that the use of technologies in education will enhance the access of education and training itself amongst learners, improve the teaching-learning process and will create an extra advantage for different higher educational institutions to cater services to students in the current cut-throat competitive environment. The author emphasised to full exploitation of technologies in order to improve the teaching–learning process, while reaching to more students with better educational services at lower cost (Peled, 2000).
Globally, all educational institutes are changing their strategy to reach to their prospective learners due to the tough times of COVID-19. Their approach, platform and teaching–learning environment, different services such as library, admission, counselling etc. have changed rapidly. Due to COVID-19, learners started adopting learning technologies increasingly and being attracted to the best services provided online. Hence, it can be said that the adoption of technologies in teaching–learning process can be viewed as the improvement of the learning environment as the educational institutes are undergoing technological revolution (Johnston and McCormack, 1996) in the world.
Since, the growth in usage of technology-enhanced learning (TEL) has been increased in the last two decades due to the tough competition between the higher education institutions to attain higher achievements and also to attract new aspirants in the institution (Clark and Meyer, 2011). In these times, no educational institute want to be lagged behind as that no one know how long this scenario of COVID-19 will remain with us. The WHO has also stated that COVID-19 will remain amongst us for a long time (Jagannath, 2020), which directly indicates that whatever the services were providing in the traditional teaching, it needs to transform into online rapidly in order to sustain and be competitive in the education sector. And, looking at the current competition in the EdTech (Education-Technology) sector, various players have already entered into the market place competing with their unique and quality-based approach. But above all these, it is imperative to understand the various factors affecting students' adoption intention to TEL, so that the educational institutes could prepare and offer their services to the latent learners in consistent with that. Therefore, the present research studies the effect of various factors i.e. informational quality, compatibility, resource availability, subjective norms, subject interest, institutional branding and self-efficacy on students' adoption intention to TEL enrolled in different higher education institutions in Chhattisgarh state.
Literature review
Technology has the potential to create new possibilities for better education (Nikou and Economides, 2017). The United Nations Educational, Scientific and Cultural Organisation (UNESCO) found that technological usage helps the students' test results. In addition, UNESCO suggested the government to use technology at the institutional level in order to enhance students' learning (UNESCO, 2009). Technology is critical factor, and thus, its acceptance and adoption are receiving growing interest amongst higher education institutions. However, recent studies (Kim et al., 2017; Hamidi and Chavoshi, 2018) have predicted that although many universities have extended their curricula to online platforms, students' technology usage and interest was not found as high as expected.
In the last two decades, the increased usage of information and communication technologies, especially Internet technologies, can be seen amongst the learners, along with that the universities also focussing to create improved virtual learning environment (e.g. Moodle, Virtual blackboard, WebCT) to enhance both face-to-face and online course delivery methods (Haven and Botterill, 2003; Pituch and Lee, 2006; Alexander and Golja, 2007; Liaw et al., 2007; Sun et al., 2008; Padilla-Melendez et al., 2013; Persico et al., 2014) in order to improve the performance and learning experience of students (Ngai et al., 2007; Tarhini et al., 2013).
Even though several universities have been using technology-based learning environment in their curricula for decades, only a few universities could have fully exploited the benefits of technology-based learning (Leem and Lim, 2007; Mehra and Omidian, 2012). In this regard, Park (2009) rightly stated that understanding students' adoption intention to TEL is the primary requirement in implementing and developing a successful technology-based environment. However, limited attention has been given in the previous studies to understand the perception and engagement factors of students (Keller and Cernerud, 2002; Pituch and Lee, 2006; Liaw et al., 2007; Park, 2009; Cheng, 2011; Ituma, 2011), especially in developing countries where there is a lack of research conducted in examining the students' adoption intention to TEL (Tarhini et al., 2015).
What is technology-enhanced learning (TEL)?
TEL can be defined as the usage of computer or any technology to provide training or education courses to learners or students; such courses may be learnt or studied online, off-line or mixed method of both modes (Hemming, 2008; Al-Busaidi, 2013). Thus, TEL provides students a better opportunity to study online or off-line at any time as per their convenience; it can also be considered as enforcing self-motivation, communication, technology and efficiency. Hence, TEL is the acquisition and usage of knowledge disseminated primarily by electronic means (Janda, 2016; Tetteh, 2016). TEL is also termed as technology-based learning, technology-assisted learning, e-learning, mobile learning, online learning, web-based learning, etc.
Benefits of technology-enhanced learning (TEL)
TEL offers benefits to learners such as flexibility in time and location (Fayter, 1998; Homan and Macpherson, 2005). It also helps in filling the learning gaps from the traditional system (Fayter, 1998) using learning technologies, whereas the traditional classroom method compels to lecturers and students to interact in the specific time and space. Also, TEL helps in creating online discussion platform where learners can interact with other participants as well as the teacher by eliminating constraints like time and space (Garrison and Kanuka, 2004; Hwang and Arbaugh, 2009).
TEL exploits Internet technologies to convey learning materials, knowledge and skills (Imamoglu, 2007) and offers incredible environment of learning to lecturers and students. Using TEL, students are able to fulfil their learning needs and lecturers are able to deliver their instruction and communicate with students other than the lecture time. Information technology (IT) has been increasingly leveraged to support teaching and learning in classrooms (Martins and Kellermanns, 2004; Voogt et al., 2005; Selwyn, 2007; Wan et al., 2007; Chang et al., 2008; Ozdemir et al., 2008). Park (2009) identified that TEL offers both face-to-face and online course delivery without any problem of time and distance. Similar study showed that the students are prepared and keen to use the different technologies in an active learning environment and develop their knowledge independently (Kirkwood and Price, 2014; Lorenzo Galés and Gallon, 2018).
Wenglinsky (1998) conducted a study to investigate the relations between computer technology proficiency and students' achievement of mathematics subject. The researcher found a significant and positive relationship between computer technology proficiency and students' achievement in mathematics subject. The researcher further added that those students who utilised computers and incorporated practical strategies demonstrated significantly higher score than the students who completely depend on computer-based drill and practice programmes to increase learning mathematics. In a review-based study conducted by Sivin-Kachala and Bialo (2000) to examine the relationship between technology and student achievement, they have found a significant and positive benefit for students who employed technology-rich environment for their learning. Those students depicted significant benefits and achievement in all subjects, improved subject score as well as their attitudes regarding their own learning and self-esteem. Thus, based on the previous studies, TEL is fruitful to students in terms of their academic achievement as well as improvement in knowledge and skills.
Incorporated variables in the study
Students' adoption intention to TEL
Students' adoption intention to TEL refers to the learners' intention to use learning technologies aiming to increase their academic performance. Learners believe that using technology-based learning methods will fulfil their learning gaps and improve their learning outcomes. Fishbein and Ajzen (1977) stated that intention is a subjective probability with regard to perform a specified task by an individual.
Informational quality
Informational quality is the quality of the material/content provided by information systems. Gustavsson and Wanstrom (2009) defined information quality as “the ability to satisfy the learners' informational needs”. The learners’ interest gets increased when the quality of information provided is accurate, easy to understand and reliable which encourages to use online learning platforms. Previous studies (Lin and Lu, 2000; Molla and Licker, 2001; Rai et al., 2002; Saeed et al., 2003; Ramayah et al., 2010; Panigrahi et al., 2020) explain the positive relationship between informational quality and intention to adopt learning technologies. On the contrary, the adoption intention amongst learners gets decreased when they receive inaccurate, difficult, non-reliable information using technology-based learning.
Compatibility
Compatibility is the degree to which engaging in a course-related study using TEL is perceived as being consistent with the students' existing values, beliefs, past information behavior. Rogers (2003) defined compatibility as “the degree in which a new technology is continuously seen with prior experience, existing values and needs of latent adopters”. Compatibility is considered as an indicator of students' adoption intention (Venkatesh et al., 2003) and was also found strongly associated with intention to adopt learning technologies (Hardgrave et al., 2003; Lee et al., 2011).
Resource availability
Resource availability is the availability of online learning resources with respect to TEL. Singh (2016) stated that TEL resources contain all digital resources available through online or offline used by higher education students. TEL resources in this research are OERs (i.e. MT-OCW, NPTEL lectures), MOOCs (i.e. courses available at Coursera, edX), several videos on YouTube platform, eBooks and various other freely educational websites like journals, articles, blogs etc. The availability of resources plays as facilitator which directly influences learners to adopt online learning technologies (Sharma et al., 2016; Tarhini et al., 2016, 2017; Salloum et al., 2019).
Subjective norms
Subjective norm refers as the social influence to perform or not to perform certain behavior (Ajzen, 1991). Finlay et al. (1999) defined subjective norm, specifically, as the individual's thinking and opinion based upon what others believe that they perform or not to perform in a precise manner. Social influence such as perceived pressure and motivation to pursue specific tasks has found to be directly linked with intention to adopt learning technologies (Schepers and Wetzel, 2007; Hussein, 2018). However, Saadé et al. (2008) explained an insignificant relationship with adoption intention to learning technologies as because the compliance effect might work only at mandatory situations but not in voluntary environment.
Self-efficacy
Self-efficacy is the degree of one's decision as per their ability to perform certain behavior (Bandura, 1977, 1986, 1997). Self-efficacy represents the self-confidence and capability to control over individuals' own motivation, behavior and social environment. Previous studies stated a positive and significant influence of self-efficacy on intention to adopt technology-based learning (Lim, 2000; Ong and Lai, 2006; Budu et al., 2018; Panigrahi et al., 2020).
Subject interest
Subject interest is the degree to learners' involvement into TEL environment which contributes into improved academics. Singh (2016) stated that subject interest of subject and related kinds of study resources (TEL contents, Textbooks) as playing complex situational factors which makes the learners likely to use more/less of a subject using TEL at any certain point of time. In addition, the interest amongst learners creates higher intentions to adopt technology-based learning (Lim, 2001; Lee et al., 2005; Liu et al., 2010; Hung and Jeng, 2013; Maheshwari, 2021). However, Hussein (2018) did not find significant relations between subject interest of learners and adoption intention to TEL.
Institutional branding
Institutional branding is the image of the institution in the society. Branding, mainly, focusses on the added value and creating more intangible relationship between the user and organisation. Kotler (1994) stated that a brand is essentially a promise of the organisation to transfer certain set of features, benefits and added services with respective product/services to the user.
Research question
The research question of the study is:
What effect does the various factors i.e. informational quality, compatibility, resource availability, subjective norms, self-efficacy, subject interest and institutional branding have on students' adoption intention enrolled in different higher education institutions of Chhattisgarh state.
Methodology
Conceptual framework
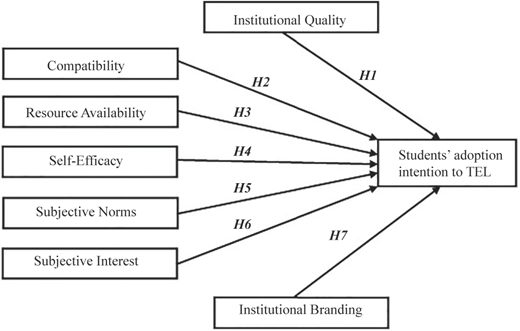
Conceptual framework of the study is shown in Figure 1.
Hypothesis
Perceived informational quality of TEL would positively influence students' adoption intention to TEL.
Perceived compatibility of TEL would positively influence students' adoption intention to TEL.
Perceived resource availability of TEL would positively influence students' adoption intention to TEL.
Perceived self-efficacy of TEL would positively influence students' adoption intention to TEL.
Perceived subjective norms of TEL would positively influence students' adoption intention to TEL.
Perceived subject interest of TEL would positively influence students' adoption intention to TEL.
Perceived institutional branding of TEL would positively influence students' adoption intention to TEL.
Primary data and sampling
Purposive sampling technique with “Criterion Sampling” (Palys, 2008) was used for collecting primary data Table 1. Participant were chosen with certain specification i.e. using TEL by student for at least one year and being an undergraduate and postgraduate student enrolled in non-technical courses in government/private educational institutes in Chhattisgarh state. Sample size chosen for the study was 600, and it was collected between April and November 2019 Table 2.
Description of sample
| Govt. college | Private college | Semi govt. college | Total respondents | |||
|---|---|---|---|---|---|---|
| 240 | 300 | 60 | 600 | |||
| Male | Female | Male | Female | Male | Female | |
| 66 | 174 | 102 | 198 | 32 | 28 | |
Demographic characteristics of the respondents (n = 600)
| Variables | Frequency | Per cent | Mean | SD | CI [95%] |
|---|---|---|---|---|---|
| Age group of the respondents | |||||
| 17–20 | 234 | 39 | 22.97 | 3.549 | 22.68–23.65 |
| 21–25 | 263 | 43.8 | |||
| 26–30 | 76 | 12.7 | |||
| Above 30 | 27 | 4.5 | |||
| Gender | |||||
| Male | 200 | 33.3 | 1.67 | 0.472 | 1.63–1.70 |
| Female | 400 | 66.7 | |||
| Background | |||||
| Rural | 292 | 48.7 | 1.51 | 0.5 | 1.47–1.55 |
| Urban | 398 | 51.3 | |||
| Family size | |||||
| 2–3 Members | 13 | 2.2 | 2.4 | 0.533 | 2.36–2.44 |
| 4–5 Members | 333 | 55.5 | |||
| More than five members | 254 | 42.3 | |||
| Occupation of family | |||||
| Govt. service | 146 | 24.3 | 2.908 | 1.355 | 2.80–3.02 |
| Private service | 89 | 14.8 | |||
| Business | 92 | 15.3 | |||
| Cultivation | 220 | 36.7 | |||
| Others | 53 | 8.8 | |||
| Monthly income of family | |||||
| Up to 20,000 | 227 | 37.8 | 1.923 | 0.822 | 1.86–1.99 |
| Rs 20,001–40,000 | 192 | 32 | |||
| Above Rs 40,000 | 181 | 30.2 | |||
| Stream of study | |||||
| Undergraduate | 414 | 69 | 1.4 | 0.656 | 1.34–1.45 |
| Postgraduate | 186 | 31 | |||
| Type of college/university | |||||
| Government | 226 | 37.7 | 1.732 | 0.643 | 168–1.78 |
| Private | 309 | 51.5 | |||
| Semi-government | 65 | 10.8 | |||
Research instrument and scale validation
Adoption of the right instrument is the prime necessity in order to collect the right form of data from respondent. Development, selection and validation is the process of establishing a right instrument, so that unbiased and correct form of data could be collected. The present study also follows the same procedure in collecting and validating the data. The author adapted or modified a 35-item questionnaire from previous studies for eight constructs. Then, it was sent to four subject experts for content validity and key insights for the scale. The items were reduced to 26-item questionnaire as suggested by the experts. After that, the pilot study was conducted to further examine the content validity of the questionnaire, and none recommended for modification. Finally, the established scale was found to be adequate and suitable to respond by the participants as showed in Table 3.
Theoretical constructs and measurement scale
| Informational quality | Modified from Ahn et al. (2007) |
| 1. Available online contents are complete and timely in nature | |
| 2. Available online contents provide accurate and reliable material | |
| 3. Online contents provide information in appropriate manner | |
| Compatibility | Adapted from Moore and Benbasat (1991) |
| 1. I spend many hours on the Internet | |
| 2. Using the web to communicate and access information for education is suitable for me | |
| 3. Using the web in my academic life is compatible with my style and habits | |
| Resource availability | Modified from Taylor and Todd (1995) and Lu (2008) |
| 1. I can use e-learning resources whenever I want it | |
| 2. My institution has adequate resources to properly use the e-learning system | |
| 3. My institution provides me adequate technical know-how regarding online resources | |
| Self-efficacy (self-confidence to complete tasks) | Adapted from Compeau and Higgins (1995) and Ajjan and Hartshorne (2009) |
| 1. I am confident of using the e-learning system even if there is no one around to show me how to do it | |
| 2. I am confident of using the e-learning system even if I have only the online instructions for reference | |
| 3. I am confident of using the e-learning system even if I have never used such a system before | |
| Subjective norms (social influence) | Modified from Tarhini et al. (2017) |
| 1. My teachers think that I should participate in the e-learning activities | |
| 2. My colleagues think that I should participate in the e-learning activities | |
| 3. The opinion of non-academic groups (e.g. friends and family) suggests that I should participate in e-learning activities | |
| Subject interest | Modified from Singh (2016) |
| 1. I am interested in learning course material for my subject | |
| 2. I am generally attentive in class | |
| 3. I feel the subject challenged me intellectually | |
| 4. by using e-learning tool I have become more competent in my subject | |
| Institutional branding | Modified from Singh (2016) |
| 1. The institution I study is looked upon as a prestigious institution in society | |
| 2. My institution provides me e-learning facilities | |
| 3. My institution has high media coverage in online learning activities | |
| 4. My institution remains in a prestigious place in various university ranking systems | |
| Students' adoption intention to TEL | Adapted from Ajjan and Hartshorne (2009) and Roca et al. (2006) |
| 1. I will use the e-learning platform on a regular basis in the future | |
| 2. I will continue using e-learning platform in order to fulfil my future needs | |
| 3. I will strongly recommend others to use the e-learning platform |
The present study incorporated partial least square confirmatory factor analysis for the validation of scale. Table 4 explains the measures of item loading. The value of t was also found greater than 1.96 and significant; thus, it explains that each item in the questionnaire contributing in making the construct. Also from the factor analysis results, it can be observed that the factor loading for each item was found to be higher than 0.5 (Hulland, 1999; Truong and McColl, 2011), indicating that each of the item has significant item loading and hence contributing to the formation of their respective constructs.
Measurement results
| Constructs | Items code | Item loading | Item errors | Cronbach's alpha | Rho A | CR | AVE |
|---|---|---|---|---|---|---|---|
| Informational quality | IQ1 | 0.721 | 0.382 | 0.706 | 0.756 | 0.813 | 0.592 |
| IQ2 | 0.806 | 0.442 | |||||
| IQ3 | 0.779 | 0.473 | |||||
| Compatibility | C1 | 0.768 | 0.330 | 0.712 | 0.731 | 0.775 | 0.538 |
| C2 | 0.840 | 0.623 | |||||
| C3 | 0.779 | 0.377 | |||||
| Resource availability | RA1 | 0.801 | 0.473 | 0.773 | 0.782 | 0.821 | 0.604 |
| RA2 | 0.761 | 0.399 | |||||
| RA3 | 0.769 | 0.413 | |||||
| Self-efficacy | SE1 | 0.732 | 0.385 | 0.726 | 0.751 | 0.747 | 0.698 |
| SE2 | 0.796 | 0.549 | |||||
| SE3 | 0.710 | 0.470 | |||||
| Subjective norms | SN1 | 0.824 | 0.464 | 0.701 | 0.705 | 0.832 | 0.624 |
| SN2 | 0.780 | 0.383 | |||||
| SN3 | 0.763 | 0.418 | |||||
| Subject interest | SI1 | 0.859 | 0.445 | 0.717 | 0.757 | 0.789 | 0.509 |
| SI2 | 0.809 | 0.396 | |||||
| SI3 | 0.749 | 0.359 | |||||
| SI4 | 0.711 | 0.096 | |||||
| Institutional branding | IB1 | 0.796 | 0.471 | 0.709 | 0.714 | 0.797 | 0.620 |
| IB2 | 0.783 | 0.385 | |||||
| IB3 | 0.764 | 0.281 | |||||
| IB4 | 0.758 | 0.245 | |||||
| Students' adoption intention to TEL | SAI1 | 0.844 | 0.440 | 0.727 | 0.731 | 0.846 | 0.648 |
| SAI2 | 0.785 | 0.411 | |||||
| SAI3 | 0.783 | 0.390 |
Reliability measures
Internal consistency is measured through Cronbach’s alpha whose value must be more than 0.7 (Nunnally, 1978). Table 4 explains the value of Cronbach’s alpha for all the constructs was found to be greater than 0.7. Cronbach’s alpha value for informational quality α = 0.706, compatibility α = 0.712, resource availability α = 0.773, self-efficacy α = 0.726, subjective norms α = 0.701, subject interest α = 0.717, institutional branding α = 0.709 and students' adoption intention to TEL α = 0.727.
The value of Rho A also depicts the reliability measures, and Rho A ≥ 0.7 is considered a fair measure for reliability. Table 4 explains the value of Rho A for informational quality = 0.756, compatibility = 0.731, resource availability = 0.782, self-efficacy = 0.751, subjective norms = 0.705, subject interest = 0.757, institutional branding = 0.714 and students' adoption intention to TEL = 0.731. Thus, the reliability measures of the data for the constructs were confirmed.
Validity measures
Convergent validity
Convergent validity is measured to examine whether the multiple items in the scale are in agreement (Fornell and Bookstein, 1982; Barclay et al., 1995). The value of composite reliability must be (CR) ≥ 0.7 which indicates a fair internal consistency reliability (Hair et al., 2010; Bagozzi and Yi, 1988). Table 4 predicts the value of composite reliability for informational quality = 0.813, compatibility = 0.775, resource availability = 0.821, self-efficacy = 0.747, subjective norms = 0.832, subject interest = 0.789, institutional branding = 0.797 and students' adoption intention to TEL = 0.846.
The average variance extracted (AVE) is considered a determinant of convergent validity of the scale. The value of AVE must be greater than 0.5 (Hu et al., 2004; Henseler et al., 2009). Table 4 indicates the value of AVE for informational quality = 0.592, compatibility = 0.538, resource availability = 0.604, self-efficacy = 0.698, subjective norms = 0.624, subject interest = 0.509, institutional branding = 0.620 and students' adoption intention to TEL = 0.648. Thus, all the values enumerated in Table 4 are fairly good related to convergent validity.
Discriminant validity
Discriminant validity explains whether the constructs are independent from each other. In Table 5, the value of discriminant validity for compatibility = 0.733, informational quality = 0.769, institutional branding = 0.707, students' adoption intention to TEL = 0.805, resource availability = 0.777, self-efficacy = 0.706, subject interest = 0.714 and subjective norms = 0.790 depicts the higher value than that of the constructs correlation and thus can be said to have satisfactory measurement model.
Discriminant validity
| Discriminant validity (Fornell–Larcker criterion) | ||||||||
|---|---|---|---|---|---|---|---|---|
| Constructs | Compatibility | Informational quality | Institutional branding | Students' adoption intention to TEL | Resource availability | Self-efficacy | Subject interest | Subjective norms |
| Compatibility | 0.733 | |||||||
| Informational quality | 0.497 | 0.769 | ||||||
| Institutional branding | 0.484 | 0.495 | 0.707 | |||||
| Students' adoption intention to TEL | 0.559 | 0.467 | 0.583 | 0.805 | ||||
| Resource availability | 0.464 | 0.53 | 0.539 | 0.502 | 0.777 | |||
| Self-efficacy | 0.481 | 0.458 | 0.501 | 0.506 | 0.541 | 0.706 | ||
| Subject interest | 0.548 | 0.474 | 0.593 | 0.621 | 0.416 | 0.554 | 0.714 | |
| Subjective norms | 0.434 | 0.416 | 0.555 | 0.597 | 0.472 | 0.503 | 0.577 | 0.790 |
Data analysis
SPSS (licensed v25) and smart PLS 3 (trial version) was incorporated to analyse the data for the present study.
Analysis and interpretations
Hierarchal multiple regression (stepwise) was run to determine whether informational quality, compatibility, resource availability, self-efficacy, subjective norms, subject interest and institutional branding have effect on students' adoption intention to TEL. Table 3 depicts the details of the model regression model with students' adoption intention to TEL as a criterion variable. In order to meet the assumption of multiple regression, partial regression plots and a plot of scrutinised residuals were assessed to check the linearity. The value of Durbin Watson statistics was 1.791 which indicated the independence of residuals. There was no multicollinearity in the data as all the tolerance values were greater than 0.1, Variance inflation factor (VIF) found, ranged from 1.000 to 1.55, which was distant from the 1.0 to 3.0, criteria that may indicate multicollinearity concern (O'brien, 2007). It means that multicollinearity found significant correlation between all predicting variables. The value of cook's distance is above 1, and the data were approximate normal accessed by Q-Q plot. The results of the hierarchical multiple regression analysis for the composite scores of the independent variables are presented in Table 6 and Figure 2.
Result of hierarchical multiple regression analysis
| Predictors | Model 1 | Model 2 | Model 3 | Model 4 | Model 5 | ||||||||||
|---|---|---|---|---|---|---|---|---|---|---|---|---|---|---|---|
| β | t | VIF | β | t | VIF | β | t | VIF | β | t | VIF | β | t | VIF | |
| Subjective norms | 0.596 | 18.152 | 1.00 | ||||||||||||
| Compatibility | 0.324 | 9.707 | 1.198 | ||||||||||||
| Institutional branding | 0.237 | 6.442 | 1.543 | ||||||||||||
| Subject interest | 0.136 | 3.192 | 1.426 | ||||||||||||
| Resource availability | 0.137 | 3.824 | 1.55 | ||||||||||||
| R | 0.596 | 0.666 | 0.692 | 0.702 | 0.71 | ||||||||||
| R2 | 0.355 | 0.443 | 0.479 | 0.492 | 0.505 | ||||||||||
| ΔR2 | 0.355 | 0.088 | 0.036 | 0.013 | 0.012 | ||||||||||
| ΔF | F (1,598) = 329.499** | F (1,597) = 94.235** | F (1,596) = 41.498** | F (1,595) = 15.301** | F (1,594) = 14.620** | ||||||||||
Note(s): *means p < 0.05 and **means p < 0.01
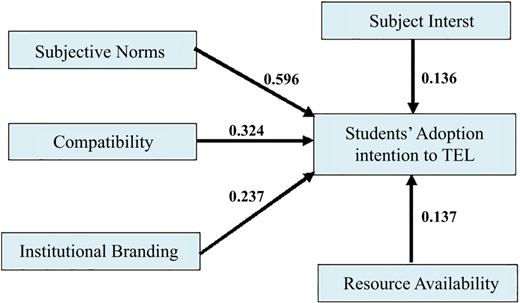
In Model 1, subjective norms made significant contribution in variation of students' adoption intention to TEL (F (1, 598) = 329.499, p < 0.01) and explained 35.5% of the variance in students' adoption intention to TEL (R = 0.596, R2 = 0.355). The standardised beta value (β = 0.596, t = 18.152, p < 0.01) indicated significant positive association between predictor subjective norms and students' adoption intention to TEL; it means, the higher subjective norms, the more will be intention to adopt TEL amongst students.
In Model 2, compatibility made significant contribution in variation of students' adoption intention to TEL (ΔF (1, 597) = 94.235, p < 0.01). The introduction of factor compatibility explained additional 8.8% variance in students' adoption intention to TEL with overall 44.3% (R = 0.666, ΔR2 = 0.088). The predictor compatibility was found to have significant positive association (β = 0.324, t = 9.707, p < 0.01) with students' adoption intention to TEL; which indicates that compatibility factor between the learner and learning technologies influences students' adoption intention to TEL.
In Model 3, institutional branding made significant contribution in variation of students' adoption intention to TEL (ΔF (1, 596) = 41.498, p < 0.01) and explained overall 47.9% of variance in students' adoption intention to TEL (R = 0.692, ΔR2 = 0.036); the model explained additional 3.6% of the variance in students' adoption intention to TEL. The results indicated significant positive association between predictor institutional branding on students' adoption intention to TEL (β = 0.237, t = 6.442, p < 0.01); that means, with institutions of higher brand name, students' adoption intention to TEL will gradually rise.
In Model 4, subject interest factor made significant contribution in variation of students' adoption intention to TEL (ΔF (1, 595) = 15.301, p < 0.01). The introduction of predictor subject interest explained additional 1.3% variance in students' adoption intention to TEL with overall 49.2% (R = 0.702, ΔR2 = 0.013). The predictor subject interest was found to have significant positive association (β = 0.136, t = 3.192, p < 0.01) with students' adoption intention to TEL; which indicates that higher subject interest is likely to increase students' adoption intention to TEL.
In Model 5, resource availability factor made significant contribution in variation of students' adoption intention to TEL (ΔF (1, 594) = 14.620, p < 0.01), and the model explained additional 1.2% of the variance in students' adoption intention to TEL (R = 0.71, ΔR2 = 0.012). The overall variance of the model was found to be 50.5%. The results indicated significant positive association between resource availability on students' adoption intention to TEL (β = 0.137, t = 3.824, p < 0.01); that means, higher the availability of resources, higher will be the students' adoption intention to TEL.
Findings clearly indicated that variable informational quality and self-efficacy did not make any significant variation in students' adoption intention to TEL.
Result indicates the explaining percentage of all predictors was 50.5%; this total of the variance included 35.5% for subjective norms, 8.8% for compatibility, 3.6% for institutional branding, 1.3% for subject interest and 1.2% for resource availability (see Table 7).
Outcomes of the proposed hypotheses of the study
| Hypothesis | Statement | Decision |
|---|---|---|
| H1 | Perceived informational quality of TEL would positively influence students' adoption intention to TEL | Not confirmed |
| H2 | Perceived compatibility of TEL would positively influence students' adoption intention to TEL | Confirmed |
| H3 | Perceived resource availability of TEL would positively influence students' adoption intention to TEL | Confirmed |
| H4 | Perceived self-efficacy of TEL would positively influence students' adoption intention to TEL | Not confirmed |
| H5 | Perceived subjective norms of TEL would positively influence students' adoption intention to TEL | Confirmed |
| H6 | Perceived subject interest of TEL would positively influence students' adoption intention to TEL | Confirmed |
| H7 | Perceived institutional branding of TEL would positively influence students' adoption intention to TEL | Confirmed |
Discussion and findings
The result of the first hypothesis test indicated that perceived informational quality of TEL is not found significant for students' adoption intention to TEL and the hypothesis is rejected. The result is found to be consistent with the previous research finding (Jarvenpaa and Todd, 1996; Lederer et al., 2000). It means that the quality of information delivered through online medium of learning does not affect the students' intention to adopt online medium of learning. Intention of students in this regard is an independent factor, and standard attribute of the online available learning materials has nothing to do with the choice of online learning.
The results of the second hypothesis test predicted that perceived compatibility of TEL has positive and significant effect on students' adoption intention to TEL and the hypothesis is accepted. The result is found in congruence with the previous research findings (Premkumar et al., 1994; Chin and Gopal, 1995; Karahanna et al., 1999; Hardgrave et al., 2003; Lee et al., 2011). This means that compatibility of learning medium generates positive intention amongst the learner groups to use online medium of learning. Conformity and concordance of the available and suitable resources generate planning amongst the learners for the adoption of online learning.
The outcome of the third hypothesis test concluded that the perceived resource availability of TEL has a significant and positive effect on students' adoption intention to TEL and the hypothesis is accepted. The obtained outcome is found to be consistent with the previous research findings (Taylor and Todd, 1995; Mathieson et al., 2001; Sharma et al., 2016; Tarhini et al., 2016, 2017; Salloum et al., 2018). Thus, it can be said that higher the resources for online learning, higher will be the students' adoption intention for online learning. The availability of learning technologies and other resources for creating an encouraging learning environment strongly affects the adoption intention of students to engage with it.
The outcome of the fourth hypothesis test predicted that perceived self-efficacy of TEL did not have significant influence on students' adoption intention to TEL and the hypothesis is rejected. The resultant outcome was found to be consistent with the previous research studies (Agarwal et al., 2000; Eastin and LaRose, 2000; Hasan, 2006; Roca et al., 2006; Lin and Huang, 2008; Aggelidis and Chatzoglou, 2009; Kaminski et al., 2009). Thus, it can be concluded that self-awareness and the self-ability of the students did not build positive intention amongst them to adopt online medium of learning. It means that students have not built the ability to fully exploit the learning technologies for the achievement of their learning purposes. Therefore, students' belief and ability to attain certain desired results does not contribute to the technology adoption.
The results of the fifth hypothesis test concluded that subjective norms of TEL have significantly and positively influenced students' adoption intention to TEL and the hypothesis is accepted. The result was found to be consistent with the previous research findings (Venkatesh and Davis, 2000; Chen et al., 2002, 2013; Schepers and Wetzel, 2007; Tung et al., 2008; Lee et al., 2011; Park et al., 2012; Zare and Yazdanparast, 2013; Hussein, 2018). Thus, it can be said that subjective norms in the form of societal encouragement from friends, family, environment, peer groups and others motivate students to take online medium of learning. Moreover, it can build strong positive image of the delivering sources for adoption in future time.
The results of the sixth hypothesis test indicated that perceived subject interest of TEL significantly and positively influenced students' adoption intention to TEL and the hypothesis is accepted. Similar findings have also been found from the previous research studies in the literature (Lim, 2001; Lee et al., 2005; Brown et al., 2006; Martínez-Torres et al., 2008; Liu et al., 2010; Shyu and Huang, 2011; Zare and Yazdanparast, 2013; Hung and Jeng, 2013; Al-Ammary et al., 2014; Maheshwari, 2021). This means that if the interest on a particular subject is high then and it will generate positive and significant curiosity amongst the students to take online medium of learning. Thus, it can be concluded that students would prefer online medium of learning when the curiosity to learn the subject is high, and they found it as interesting platform for search and adoption of learning materials.
Results of the seventh hypothesis test concluded that perceived institutional branding has a significant positive influence on students' adoption intention to TEL and the hypothesis is accepted. Thus, it can be stated that higher image of the institution, having higher brand name and status, would motivate the students to create impact on their mind to take up online medium of learning.
Contributions of the study
The outcomes of the present study contribute to the theory and practice of management field. The results can be drawn specifically for the policy making related to higher education by Chhattisgarh state government. It also helps those private colleges and universities too, who rigorously striving to attract more learners by offering various services in these tough times of COVID-19. Now, it is imperative to understand the needs and wants of today's learners and what drives them to adopt and not to adopt certain services in online learning. The present study offers answers to these important questions which may help educational institutions to make appropriate strategies out of it.
Seven major factors were chosen to examine the effect on adoption intention amongst those students who already using learning technologies for at least one year, expecting that they know more about the pros and cons of technology-based learning. The analysis explained that compatibility, resource availability, subjective norms, subject interest and institutional branding of TEL were predicted significant for students' adoption intention to TEL which concludes that if these variables be kept in mind while preparing strategies and policies by educational institutions, a positive outcome in terms of high enrolment of students can be seen in the near future.
However, information quality and self-efficacy did not contribute to the students' adoption intention to TEL, but it does not mean that these variables are not significant for the adoption and continue intention to use TEL. Previous studies suggest its significance for the learning effectiveness and better academic performance, which leads to higher level of satisfaction amongst students. Therefore, the educational institutes must consider all the variables when planning or developing policies to attract or retain potential learners in the virtual mode.
Globally, every educational institute is transforming and taking their services into virtual mode due to COVID-19 situation. However, the sudden transformation of educational institutes into online has been a challenge, but a necessary move to retain and attract new potential learners as the WHO has also announced that the COVID-19 situation will be amongst us for a long time (Jagannath, 2020). The WHO statement directly indicates that whatever sector you belong, whatever services you provide, you must change as per the environment as it will remain the same for a long time.
Conclusion
TEL has become an inevitable alternative in the field of higher education where change is imperative in the current cut-throat globalised competitive environment. It has been proven in this research that TEL is far better than the traditional method of learning because it increases the understanding of the learners about the subject matter by using TEL resources (i.e. MOOCs, NPTEL, eBooks, freely educational videos available at YouTube platform and various educational websites like blogs, journals, articles etc.). This research studied the effect of various factors on adoption intention to TEL amongst higher education students in the state of Chhattisgarh where the major challenge is to develop a quality educational and sustainable environment by improving the teaching-learning process in higher education by putting information and communication technology at the centre. The results indicated that the adoption intention amongst higher education students can be encouraged as the different factors used in the study predicted significantly. Looking at the current environment, educational institutes needed these to comprehend what factors drives today's learners to get motivated to adopt technology-based learning. According to Wadhwani and Gankar (2020), the market size of technology-based learning was 200 billion in 2019 and is estimated to grow at 8% compound annual grown rate between 2020 and 2026. But, due to the COVID-19 impact, the growth and usage of online learning technologies would increase faster than the calculated figure.

