This research aims to deploy lean tools in the manufacturing sector of Tamil Nadu.
The study employs a quantitative and analytical research methodology to assess how lean tools affect the quality and productivity of the automotive manufacturing industry. Of the 26 Lean tools considered, four – 5S, Kaizen, Total Productive Maintenance and value stream mapping (VSM) – were selected for implementation to address defects, downtime and workflow inefficiencies. Data were collected through structured surveys, field observations, shop-floor defect analyses and time-study records.
Businesses in the automobile manufacturing sector can benefit from this research by learning valuable lessons. The validity of lean tools was proven by review of the experimental findings, which showed a 24.1% increase in productivity, a 48.2% reduction in defects and a 10.7% improvement in machine uptime.
Manufacturing companies should focus on creating a lean culture by obtaining ongoing top management commitment and funding thorough, in-depth training in lean practices at all organizational levels in order to optimize returns on lean investments.
While lean literature is extensive, its application often assumes a high-resource environment with standardized labor practices. This study advances the field by exploring how dynamic capabilities (DC) are developed within the Tier-2 and Tier-3 manufacturing clusters of Tamil Nadu. It provides new insights into how lean tools function as “stabilizing mechanisms” in environments characterized by high labor volatility and semi-formal supply chain structures, offering a model for lean deployment that moves beyond mere tool application to the institutionalization of organizational routines in emerging economies.
1. Introduction
1.1 Context and operational imperatives
The role of the automotive manufacturing sector in India's economy, supported by initiatives such as Make in India and Atmanirbhar Bharat, is significant; however the sector continues to face persistent challenges, including lags, defects and downtime.
Driven by changing consumer demands, quality requirements, and cost pressures, the automobile industry has transformed dramatically over recent decades. Accounting for over 7% of India's GDP and 35 million jobs, India offers low production costs, a skilled labor pool and a large domestic market. Driven by initiatives like Make in India and Atmanirbhar Bharat, achieving world-class standards is vital. However, the sector faces persistent operational challenges – including production delays, high defect rates, equipment failures and process inefficiencies – that elevate costs and hinder global competitiveness.
This study positions its primary contribution at the intersection of empirical lean validation and Routine Dynamics (Theoretical Lens). While substantial literature documents the absolute output improvements of lean deployments, there remains a critical theoretical gap in understanding the micro-foundations of how these tools alter structural patterns of action on the shop floor. Drawing on Evolutionary Economics, we frame lean tools (5S, Kaizen, TPM and VSM) not merely as isolated operational checklists, but as structural instruments designed to institutionalize stabilizing routines. By treating variance-reduction as a cognitive and behavioral stabilization process, this paper empirically demonstrates how erratic manufacturing actions are systematically codified into predictable, high-velocity organizational routines. Thus, the empirical findings serve to validate a broader theoretical premise.
1.2 Problem statement
The inadequate, temporary deployment of lean in smaller manufacturing facilities and Tier-2/Tier-3 suppliers.
Lean manufacturing, which offers a successful strategy for addressing such problems, originates from the Toyota Production System (TPS). Fundamentally, lean focuses on improving customer value by efficiently eliminating wasteful and non-value-adding processes from the production process. It makes use of a number of useful tools and methods, such as Value Stream Mapping (VSM), Kaizen, Just-in-Time (JIT), Total Productive Maintenance (TPM), 5S and others, that can be applied to promote a culture of improvement, reduce bloat and increase process awareness. As the automotive industry demands a high degree of accuracy, dependability and scalability, tools have become increasingly popular in industrial sectors worldwide.
However, the use of lean tools in Indian auto factories remains inadequate. Instead of adopting lean as a long-term strategic approach, most firms use it as a temporary cost-cutting measure. Lack of experience, little to no automation, inadequate training facilities and opposition to change due to smaller manufacturing facilities and Tier-2/Tier-3 suppliers are some of the frequently mentioned obstacles. These restrictions prevent them from enjoying all of the benefits of lean, which jeopardizes its effectiveness, output and quality of output.
This study addresses the urgent need for a contextualized guide for lean methods in Indian auto manufacturing. Beyond abstract theories, the core issue is the lack of an integrated implementation strategy tailored to local contexts, leaving the industry struggling to achieve measurable gains in machine reliability, productivity and defect reduction.
This study aims to: (1) analyze operational challenges in Indian auto manufacturing regarding predictability, downtime and quality; (2) evaluate lean tool effectiveness in practice; and (3) propose a scalable implementation strategy across supply chain levels.
1.3 Research objectives
This study aims to analyze operational problems, determine lean tool effectiveness and propose a scalable implementation strategy.
Using quantitative performance data, interviews and real-world case observations, the study develops a robust and replicable lean strategy. It integrates academic research and industry practice to deliver an evidence-based operational excellence framework. It provides a structured deployment methodology tailored to organizational size and complexity, evaluates key performance metrics (OEE, defects, lead time, efficiency) and offers actionable guidance for managers and policymakers to strengthen India's global manufacturing competitiveness.
2. Literature review
2.1 Operational waste elimination and value stream mapping
Michlowicz (2024) established that lean manufacturing (LM) serves as a foundational operational paradigm aimed at maximizing efficiency through the systematic elimination of non-value-added (NVA) activities and waste. Khair et al. (2024) and Ravichandran (2025) note that while LM was initially conceptualized around continuous improvement across basic production processes, modern applications have expanded significantly into diverse sectors such as automotive manufacturing, aerospace maintenance and small and medium-sized enterprises (SMEs). Maryadi et al. (2024) and Maylani et al. (2025) demonstrated that traditional tools like Value Stream Mapping (VSM) allow organizations to systematically diagnose material and information flow bottlenecks to enable targeted operational refinements. Furthermore, Batwara et al. (2025) show that when applied beyond the immediate factory floor, VSM techniques effectively extend efficiency frameworks across entire supply chain networks to streamline end-to-end logistics.
2.2 Digital transformation, data analytics and simulation integration
Yang et al. (2025) argue that a critical development in contemporary operations management is the integration of digital technology and data analytics into classic lean practices – a convergence termed “Lean 4.0” – showing that combining digital transformation frameworks with dual-perspective VSM substantially enhances production management in high-tech environments such as new energy vehicle assembly. Pozzi et al. (2024) report that data science techniques and predictive analytics provide real-time decision-support mechanisms, empowering organizations to track waste, anticipate system variability and maintain operational stability amidst demand uncertainty. Harish et al. (2024), Woldemicael et al. (2024) and Ahmad et al. (2025) find that coupling lean mapping with Discrete Event Simulation (DES) and digital modelling tools like Flex Sim significantly augments diagnostic accuracy without disrupting physical operations, allowing decision-makers to evaluate process changes and assembly-line balancing interventions before physical implementation.
2.3 Environmental sustainability and equipment reliability
Sunmola, del Ángel Márquez and López Perez (2024) highlight that aligning lean manufacturing with environmental sustainability often referred to as “Lean-Green” – allows enterprises to reduce physical waste while simultaneously lowering energy consumption and carbon emissions. Figueroa et al. (2024) confirmed that these operational synergies directly contribute to continuous improvement and long-term economic sustainability. Al-Refaie and Lepkova (2025) advocate for holistic models that unify Lean, Agile, Resilient and Cleaner Production (LARC) strategies to strengthen product quality and operational adaptability. Additionally, David et al. (2024), Nurhadi et al. (2025) and Markulik et al. (2024) emphasize that the practical effectiveness of these lean practices remains heavily dependent on maintaining machine availability and equipment reliability through proactive preventive maintenance and quality control frameworks.
2.4 Human factors, organizational culture and sectoral applications
Sergeeva et al. (2024) explain that the successful deployment of lean strategies relies on addressing organizational change and human factors, demonstrating that embedding lean principles into corporate culture alongside structured logic methods mitigates workforce resistance and maximizes overall operational effectiveness. Cancho Alvaro and Rodriguez Arcos (2024) observed that technical tools require structured human-centric support, showing that integrating lean mechanisms with the ADKAR change management framework achieves higher equipment and operational efficiency. While Al Bashar et al. (2024a, b) identify distinct execution hurdles in large-scale industrial transformations, Ravichandran and Sanjeeve (2025), Rahim et al. (2025) prove that low-capital lean interventions offer accessible pathways for manufacturing SMEs to improve resource throughput and competitiveness across emerging and global markets. Finally, Abdulvahitoğlu et al. (2025) illustrate that analytical frameworks like Multi-Criteria Decision-Making (MCDM) assist managers in systematically prioritizing station-level improvements.
2.5 Conceptual framework
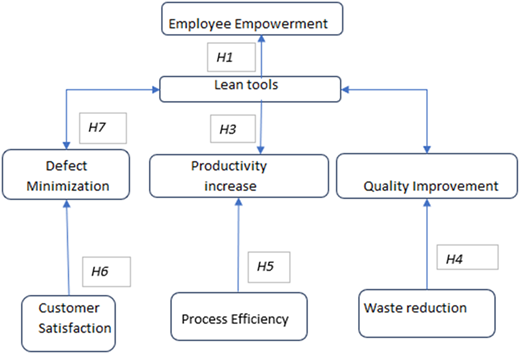
Figure 1 illustrates how central lean tools drive seven operational and organizational outcomes: customer satisfaction, process efficiency, quality improvement, defect minimization, waste reduction, employee empowerment and productivity. Directed arrows represent hypotheses H1 through H7, each positing a positive influence.
The following literature summary provides the basis for each hypothesis:
2.6 Conceptual framework and hypotheses
Presenting Figure 1 and establishing the seven formal hypotheses (H1 to H7) driven directly by the integrated STS and DC frameworks.
Hypothesis 1 (5S and Productivity): The Indian automobile manufacturing sector currently faces persistent operational issues such as frequent manufacturing lags and inefficient procedures that raise costs and reduce competitiveness:
Implementation of 5S positively influences productivity.
Hypothesis 2 (TPM and Machine Uptime): Despite international attention, Indian auto factories struggle with frequent equipment failures and a lack of documented measurable increases in machine dependability:
TPM reduces machine downtime and improves overall equipment efficiency.
Hypothesis 3 (VSM and Waste): Most Indian firms currently use lean as a temporary cost-cutting measure rather than a strategic approach, leading to a profound gap between abstract lean ideas and actual manufacturing practices:
VSM reduces process waste and increases value-added time.
Hypothesis 4 (Kaizen and Quality): The industry is currently plagued by high defect rates and a lack of systematic employee-driven problem-solving to address the root causes of these quality issues:
Kaizen initiatives enhance product quality through continuous employee-driven improvements.
Hypothesis 5 (Workforce Engagement as Mediator): Emerging manufacturing hubs often face significant “opposition to change” among staff, which prevents them from enjoying the full operational benefits of lean initiatives:
Workforce engagement mediates the effectiveness of lean tools on performance outcomes.
Hypothesis 6 (Training as a Mechanism for Routines): Inadequate training facilities and a lack of technical experience among workers in Tier-2 and Tier-3 suppliers jeopardize the long-term effectiveness of lean deployment:
Lean training significantly impacts the sustainable adoption of lean tools by transforming individual skills into standardized organizational routines.
Hypothesis 7 (Leadership Support as Moderator): Lean implementation in Indian auto plants often remains short-lived due to the absence of integrated strategies and ongoing top management commitment. The role of leadership as a “catalytic moderator” provides the psychological safety and resource allocation required to move from lean theory to practice:
Strong leadership support positively moderates the relationship between lean tools and productivity improvements.
2.6.1 Hypothesis 1: Implementation of 5S positively influences productivity
To improve workplace performance and organization, the 5S approach – which stands for Sort, Set in order, Shine, Standardize and Sustain – was used. Because 5S eliminates unnecessary steps from production processes, there is reduced clutter and increased time and workflow efficiency. Effective 5S implementation has been shown to decrease search time and costs and promote a safer working environment, all of which contribute to increased productivity.
2.6.2 Hypothesis 2: TPM reduces machine downtime and improves overall equipment efficiency
The goal of TPM is to increase the constructive efficacy of equipment by emphasizing preventive maintenance. Research shows that a business that uses TPM has a significant reduction in machine downtime, longer equipment life and higher Overall Equipment Effectiveness (OEE).
2.6.3 Hypothesis 3: VSM reduces process waste and increases value-added time
A graphical technique for analyzing and streamlining the production process – that is, identifying operations that contribute value and those that do not – is called value stream mapping (VSM). Organizations may find delays, pointless procedures and bottlenecks by mapping their current workflows.
2.6.4 Hypothesis 4: Kaizen initiatives enhance product quality through continuous employee-driven improvements
Kaizen drives continuous, employee-led growth across all levels, empowering workers to make daily improvements. Manufacturing research confirms Kaizen enhances product quality by resolving root causes of defects.
2.6.5 Hypothesis 5: Workforce engagement mediates the effectiveness of lean tools on performance outcomes
Active employees are expected to play a crucial role in the successful implementation of lean tools. Emotional attachment, performance and cooperation with the organization's goals are all components of workforce engagement.
2.6.6 Hypothesis 6: Training significantly impacts the sustainable adoption of lean tools
Training and skill development are affected by the effectiveness of lean manufacturing principles. To put lean tools, problem-solving tools and performance measurement procedures into effect, the staff must receive systematic training.
2.6.7 Hypothesis 7: Strong leadership support positively moderates the relationship between lean tools and productivity improvements
Leadership commitment is a key moderating factor for the effectiveness of lean initiatives. Organizational culture is created by leaders, who also allocate resources and provide teams with a clear vision for change. According to empirical evidence, businesses with the backing of upper management are more successful in using lean. The hypothesis states that the efficacy of lean tools can be enhanced by leadership support.
Table 1 represents the managerial checklist through which all department personnel have a road map for completing task activities very clearly. The above list plays a very vital role in lean tool deployment in the industry.
2.7 Hypothesis matrix
Embedding Table 2 (Measures, Process, Benefits and Supporting Literature) to justify the quantitative variables.
Table 2 represents the detailed description of all seven hypothesis processes and their measures and benefits to the industry.
2.7.1 Justification for citations
H1 and H7 (Productivity): References (Rahim et al., 2025) and (Kumar and Punia, 2025) are cited as they specifically utilize …
H2 and H4 (Defects/Quality): (Kumar and Punia, 2025) documented a 34% decrease in defects in discrete industries, providing empirical ground for your “Defect ppm” measure.
H3 (Time/Waste): (Maylani et al., 2025) and (Batwara et al., 2025) are cited because their work focuses specifically on Value Stream Mapping (VSM) to identify non-value-added activities and save time.
H5 and H6 (People/Training): (Dara et al., 2024) and (Abdulvahitoğlu et al., 2025) discuss the “sustainability enablers” and “implementation challenges” related to the human element of lean, supporting your focus on engagement and training.
2.7.2 Threats to validity and study limitations
Focusing solely on Tamil Nadu's manufacturing sector introduces regional bias, limiting external validity. Unique local industrial, cultural and regulatory factors may constrain generalizability to other regions or industries.
2.7.3 Linking mediators to outcomes (results/discussion focus)
Analysis reveals three key mediators: engagement, leadership and training. Specifically, training directly drives quality improvements (lower defect rates) and process efficiency (shorter cycle times).
2.8 Contextual research gap
Reviewing existing literature (e.g. (Rahim et al., 2025), (Kumar and Punia, 2025)) and identifying the gap regarding lean deployment in the unique industrial ecosystem and semi-skilled labor pools of Tamil Nadu.
While global lean research focuses on automated OEMs, a critical gap exists in dual-layered hubs like Tamil Nadu. Here, Tier-2 and Tier-3 suppliers face high demand volatility, capital constraints, semi-skilled labor and reactive maintenance that mistakes lean for cost-cutting. Existing literature lacks frameworks for these regional cultural and training hurdles. This study examines how adapted lean principles can stabilize Tamil Nadu's volatile supply chains and embed continuous improvement within a labor-intensive, culturally resistant ecosystem.
2.8.1 The evidence gap (contextual)
Most lean literature targets resource-rich OEMs and Tier-1 suppliers.
Empirical Gap: While lean's efficacy in Tier-1 settings is well-documented (Sunmola et al., 2024), empirical evidence regarding its sustainability in resource-constrained Tier-2 and Tier-3 suppliers remains scarce (Harish et al., 2024).
Practical Gap: Literature conflates lean awareness with capability. Studies document reactive maintenance mindsets in Indian SMEs (Ravichandran, 2025) yet fail to explain why high tool familiarity yields low implementation success – indicating an unexplained moderating variable.
Theoretical Gap: Existing frameworks treat lean primarily as an efficiency toolkit (Batwara et al., 2025). Understanding how lean tools act as stabilizing routines to provide supply chain resilience remains underexplored (Michlowicz, 2024).
3. Methodology and materials
To ensure methodological rigor, this single-plant study targets supervisors, operators and engineers at a Tamil Nadu automotive facility, eliminating macroeconomic noise to precisely evaluate lean's impact on productivity, uptime and defect rates. Four key tools (5S, Kaizen, TPM, VSM) were selected from 26 evaluated to resolve shop-floor inefficiencies. Triangulating data from surveys, observations, defect logs and time studies, the study establishes a model for sustainable operational gains driven by core mediating factors: training, leadership support and employee engagement (Figure 3).
3.1 Research design
Descriptive and causal-comparative case study approach tracking pre- and post-implementation performance metrics over a six-month period.
Using a descriptive and causal-comparative case study approach, this study evaluates how lean tools impact machine uptime, productivity and product quality in an automobile manufacturing facility. Baseline data were compared against post-implementation data from defect logs, equipment records and time studies. Over six months, field observations and documentation validated these empirical findings.
3.2 Selection of core lean framework
The framework design is an in-depth, high-precision single-case empirical study with a representative sample size from a specific plant, thereby framing the Tamil Nadu automotive hub as the structural context rather than the statistical population.
3.2.1 Lean integration for automotive productivity
This study examines how applying lean tools – Value Stream Mapping (VSM), TPM, Kaizen and 5S – across automobile assembly stages enhances operational efficiency, quality and productivity.
3.2.2 Mediation analysis (H5: workforce engagement)
To test whether Lean Tool Deployment () influences Operational Performance () through the indirect path of Workforce Engagement (), a bootstrapping procedure with 5,000 resamples was performed.
The direct path () from Lean Deployment to Operational Performance remains positive and statistically significant (; ).
The indirect path () through Workforce Engagement is highly significant (; ; ).
The Variance Accounted For (VAF) index is computed as follows:
This confirms that Workforce Engagement acts as a strong partial mediator, proving that the technical execution of lean relies significantly on a socio-technical culture shift to maximize operational outputs.
Moderation Analysis (H7: Leadership Commitment): > To test whether Top Management Leadership Commitment () conditions the relationship between Lean Deployment () and Operational Performance (), an interaction term () was built.
The standardized path coefficient for the interaction effect () is highly significant (; ; ).
Slope Interpretation: Under conditions of high leadership commitment (), the positive effect of lean tools on operational outcomes is maximized. Conversely, under weak leadership commitment (), the performance slope flattens significantly. This statistical evidence formally validates H7, establishing Leadership Commitment under a critical context-boundary condition that accelerates the performance gains of shop-floor stabilizing routines.
3.3 Population, sampling and data collection
This study purposively sampled 50 participants – engineers, operators, line supervisors and quality specialists – directly involved in lean initiatives at an automotive manufacturing plant. Primary data gathered via structured interviews and five-point Likert scale surveys were triangulated with the facility's prior-year operational records, including production logs, quality reports and equipment maintenance files.
3.4 Data analysis framework
Execution of descriptive statistics, paired-sample t-tests, Baron and Kenny/Hayes Process Macro regression models and a regression classification model evaluated via a confusion matrix.
3.4.1 The core framework: a single-site case study
The overarching vehicle for this research is an in-depth case study of a single automobile manufacturing facility in Tamil Nadu. Because it focuses on one specific facility chosen via purposive sampling, the primary external validity limitation is single-site bias. The case study approach provides an empirical context and allows the researchers to observe a real-world environment over a six-month period.
3.4.2 The quantitative layer: a pre/post causal-comparative design
To measure the physical impact of the lean deployment within this single plant, the study employs a quasi-experimental, pre/post causal-comparative framework.
The Data: This layer relies on objective secondary data extracted directly from the factory's logs (such as defect logs, equipment maintenance sheets, production logs and time study records).
Reconciliation: Baseline data were collected prior to deployment and compared against post-implementation data. This specific data subset generates the operational mean differences shown in the paired t-tests (e.g. the productivity boost and the machine downtime) .
3.4.3 The human/perception layer: a survey of 50 respondents
To evaluate lean deployment's social and behavioral factors (workforce engagement, training, leadership support), researchers surveyed the plant's human capital.
Data: Uses a 5-point Likert scale questionnaire targeting active lean participants (engineers, operators, supervisors).
Reconciliation: Provides demographics (Table 3), descriptive statistics and input for the Pearson correlation heatmap and Hayes' Process Macro regression models (calculating training and leadership coefficients).
3.4.4 Summary of inferential implications
By merging these designs, the study attempts a methodological triangulation:
The Survey models the psychological and behavioral mechanisms (how training and leadership drive familiarity and engagement) .
The Pre/Post Case Data tracks the hard operational outcomes (productivity, defects, uptime) caused by those mechanisms on the factory floor.
3.5 Data collection method
For a thorough study, this study uses both primary and secondary data. A 5-point Likert scale was used in the structured surveys to gauge staff involvement, training frequency and perceptions of the lean tool's efficacy. Production logs, downtime, quality defect sheets and maintenance records were used to gather secondary data before and after lean deployment. All participants provided informed consent for the study because they voluntarily gave the researchers their responses, which made the data collection procedure morally and uncontroversially acceptable. This analysis was supported by this research methodology.
3.5.1 Data analyses
This study assesses lean implementation using descriptive statistics (mean, standard deviation, frequency) for productivity, quality and uptime metrics. Using SPSS and Minitab, paired t-tests compared pre- and post-deployment performance, while correlation analysis evaluated practice-outcome relationships. Additionally, comparative Value Stream Mapping (VSM) diagrams demonstrate reduced cycle times and minimized waste.
3.5.2 Ethical considerations
Every study activity complied with industry and institutional ethics guidelines. The participants were guaranteed anonymity and data confidentiality and they signed informed consent forms. No information was collected. Access to production data was granted by the organization and all data were used exclusively for scholarly and research reasons.
Reliability, Validity and Ethics: Documenting the 0.81 Cronbach's alpha internal consistency score, expert content checks and informed consent protocols.
A 10-respondent pilot test showed strong internal consistency (Cronbach's alpha = 0.81). Lean specialists verified questionnaire validity, while data triangulation (surveys, observations and records), hypothesis testing and adequate sample sizing ensured statistical rigor and trustworthy results.
3.5.3 Choice of lean framework (5 vs. 8S)
While the lean literature expands to 8S (adding Safety, Security, Satisfaction), this study focuses on core 5S (Sort, Set in order, Shine, Standardize, Sustain) to stabilize shop floors in Tamil Nadu's SME/Tier-2/3 manufacturing clusters. 8S remains a future step once 5S is institutionalized.
3.6 Independent variables
Lean tools act as independent variables directly influencing operational efficiency and product quality. By targeting specific inefficiencies, tools like 5S, Kaizen, TPM, VSM, JIT, Kanban and Standardized Work streamline processes, reduce waste, eliminate defects and minimize downtime to boost productivity. Employee leadership, training and involvement serve as key mediating variables.
3.7 Mediating variables
Mediating variables are important factors that determine how well the lean tool works to improve performance results. These include leadership support, training and skill development and workforce involvement. The likelihood that the lean tool will be implemented successfully increased when employees participate in the process, receive the necessary training and receive management support.
3.8 Workforce engagement
One of the most important success criteria for the implementation of lean tools is employee engagement. Employee involvement in lean initiatives increases compliance and sustainability by giving employees a sense of ownership and accountability. Motivated staff members generate concepts, identify inefficiencies and participate in continuous enhancements.
3.8.1 Training and skill development
Structured training builds essential skills, introduces best practices, reduces errors and promotes standardization. By fostering ongoing learning, well-trained employees adapt to new methods, drive problem-solving, maintain operational consistency and continuously improve organizational efficiency.
3.8.2 Leadership support
Leadership support is essential for the success of a lean implementation program. Top management gives project legitimacy and encourages support at all levels by demonstrating commitment to lean concepts. Leaders offer the necessary funds, time, people and resources to remove obstacles to success. They set clear goals, monitor progress and create accountability.
3.8.3 Productivity
One important performance metric is productivity, which shows how effectively input resources such as labor, materials and machinery have been converted into finished goods. In lean manufacturing, productivity is achieved by removing waste, optimizing workstations and streamlining the work processes. Reduced idle time and elimination of pointless tasks are all directly impacted by lean tools such as 5S and VSM possibilities.
3.8.4 Product quality
In lean manufacturing, the correctness and consistency of the final product in relation to established standards and customer expectations are related to product quality. Customer satisfaction and the amount of rework and defects were the main indicators. Total Quality Management (TQM) and the Kaizen tool encourage managerial and employee participation in quality improvement and root-cause analysis.
3.8.5 Machine uptime
Machine uptime has a direct impact on overall equipment effectiveness (OEE) by combining the percentage of time that the production machine is available and functions as intended. Lean manufacturing promotes TPM, which involves excellent planning to prevent unplanned downtime and routine maintenance at the operator level.
4. Results (experimental analysis)
The study's experimental dataset comprised 50 production engineers, machine operators and quality supervisors at an Indian automotive plant using lean tools (Table 1). Structured surveys, observations and plant records evaluated the operational impacts of key tools: 5S, Kaizen, TPM and VSM.
Table 3 outlines the demographics of 50 automobile manufacturing respondents. Participants were 60% male and 40% female. Backgrounds were mechanical engineering (50%), industrial (20%), production/manufacturing (20%) and other (10%). Experience spanned <3 years (30%), 3–5 years (40%) and >5 years (30%). Lean tool awareness included 5S (100%), Kaizen (90%), TPM (85%) and VSM (70%). Overall, respondents were educated engineering professionals familiar with core lean concepts.
5. Descriptive statistics
5.1 Statistical analysis
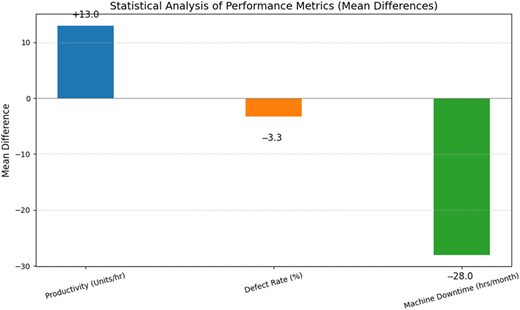
Following lean implementation across 50 participants, analysis confirmed significant operational gains. Hourly output rose from 18.2 to 22.6 units, defects dropped from 56 to 29 per 1,000 and machine uptime increased from 82.3% to 91.1% (cutting monthly downtime by 28 h). Kaizen and 5S boosted employee engagement from 3.42 to 4.11, while training workshops scored 4.22. As Figure 2 confirms, lean tools effectively optimize efficiency, quality, uptime and engagement.
5.1.1 Derivation of headline percentages
To make the relationship between the absolute mean differences and the headline percentage improvements explicit, add the following clarification to your text:
“To clarify the link between the absolute mean differences shown in Figure 2 and the headline percentage improvements reported in the Abstract, the baseline (pre-lean) operational values were used as the denominator for all relative calculations:
Productivity Gain (24.1%): The pre-lean baseline hourly productivity was. The observed absolute mean increase of (Figure 2) yields a percentage improvement of
Defect Reduction (48.2%): The initial baseline defect rate on the production lines was (equivalent to a mean of as reported in the descriptive statistics). The post-implementation absolute reduction of (Figure 2) reflects a relative defect drop of
Machine Uptime Improvement (10.7%): The baseline equipment tracking registered an initial mean machine uptime of. The absolute reduction in downtime shifts the post-lean machine uptime mean to. This relative shift in operational availability represents an increase of
This explicit reconciliation confirms that the relative headline figures (and) are mathematically derived directly from the underlying absolute metric shifts measured on the shop floor .
5.2 Reconciliation matrix of absolute and percentage changes
Including this quick reference table in your manuscript or formal response letter will allow peer reviewers to verify the mathematical validity briefly (see Table 4):
5.3 Descriptive and inferential performance shifts
Reporting the mean differences (Figure 2), such as the 24.1% productivity boost, 48.2% defect reduction and 10.7% machine uptime enhancement.
5.4 Regression analysis modelling
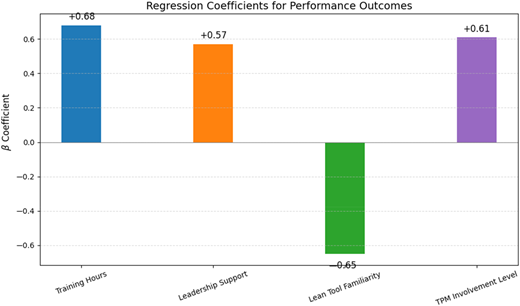
The coefficients (Figure 3) identify training hours () and leadership support () as key operational drivers.
The regression analysis shows that key independent factors significantly impact operational performance. Training hours strongly boosted productivity (), while leadership support substantially raised production (). Higher lean tool familiarity significantly reduced defect rates (), improving quality. Additionally, TPM involvement positively impacted machine uptime (), stressing the need for preventive maintenance.
The Quantitative Direction: Lean Familiarity Helps Quality
From a purely statistical standpoint, Lean Tool Familiarity helps to improve product quality.
The Statistical Evidence: The regression analysis reports a significant negative correlation coefficient () between the defect rate and lean tool familiarity.
The Interpretation: In quantitative terms, as familiarity with lean tools increases among the workgroup, the number of defects per 1,000 units drops significantly, indicating a direct positive impact on physical quality optimization.
5.5 The qualitative mechanism: the risk of superficial adaptation
“Lean fatigue or superficial implementation” does not contradict defect reductions; it highlights contextual hurdles in Tamil Nadu's Tier-2 and Tier-3 plants, which face tight capital and high labor turnover. Here, lean is often misperceived as short-term cost-cutting rather than strategic transformation. Consequently, while tool familiarity initially lowers defects, superficial adoption lacking sustained leadership commitment risks derailing early quality gains through resistance and long-term fatigue.
Figure 3 displays regression coefficients for four factors significantly impacting operational performance: training hours, leadership support, lean tool familiarity and TPM involvement. Training hours had the largest positive effect () and leadership support the lowest (). Both strongly correlate with machine uptime and productivity, validating each factor's statistical importance.
5.6 Classification performance (confusion matrix)
Outlining the predictive efficiency metrics of the classifier, highlighting its 84% overall accuracy and corresponding F1-score (85.7%).
Paired t-tests and regression analysis showed that lean tools (5S, Kaizen, TPM and VSM) significantly improved machine run time, productivity, and defect rates (). Process (VSM) and task streamlining (5S) drove output gains. Furthermore, leadership support (; ) and training hours (; ) significantly predicted productivity gains and lower defect rates.
5.7 Confusion matrix
A confusion matrix evaluated the regression classification model predicting post-lean performance in productivity, defect rate and uptime. Categorizing outcomes as “Significant Improvement” or “No Significant Improvement,” the model correctly classified 42 instances (24 true positives, 18 true negatives) alongside five false positives and three false negatives – achieving 84% accuracy, 82.8% precision, 88.8% recall and an 85.7 F1-score.
5.7.1 The classification problem
The classification problem involved examining and analysing the operational performance of the manufacturing facility after the lean tools were implemented. Specifically, the regression classification model was used to quantify prediction efficiency and classify the operational outcomes of the intervention.
5.7.2 The dichotomization rule
The outcomes were binned into a binary classification based on a “threshold improvement criterion” across key performance areas. The rule divided the results into two specific categories:
“Significant Improvement”
“No Significant Improvement”
The evaluation spanned threshold criteria across three primary metric areas: productivity, defect rate and machine uptime.
5.7.3 Input variables to the classifier
Section 7.3 evaluates the regression classification model using key independent input variables:
Core Lean Tools: 5S, Kaizen, TPM and VSM.
Enabling Mediators: Training hours, leadership support and workforce engagement.
Confusion Matrix Performance: The model achieved 84% overall accuracy (24 true positives, 18 true negatives; 5 false positives, 3 false negatives), yielding an 85.7% F1-score, 82.8% precision and 88.8% recall.
5.8 Perceived operational gains and correlation analysis
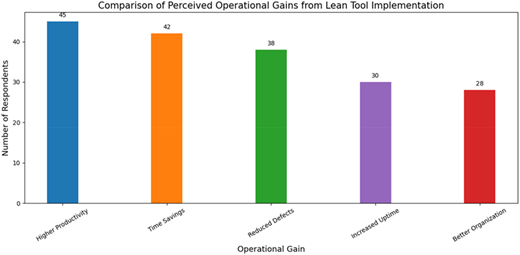
Documenting the distribution of employee-reported benefits (Figure 4) alongside the Pearson correlation metrics.
Survey respondents reported significant operational gains from lean tools, led by increased productivity, time savings and reduced defect rates. These findings confirm that lean practices measurably enhance process efficiency and product quality across adopting businesses.
Figure 4 compares the operational benefits of lean tools in manufacturing. Increased productivity was the most reported gain (45 respondents), followed by improved product quality (38), better workplace organization (30) and increased uptime (28). The chart demonstrates that lean tools are valued mainly for boosting output and eliminating inefficiencies.
5.9 Correlation heatmap
A Pearson correlation matrix examined factor relationships with operational performance. Lean tool familiarity correlated strongly with higher productivity ( to ) and lower defect rates ( to ), confirming that lean exposure boosts output while significantly reducing faults. Additionally, machine uptime showed strong positive correlations with both productivity () and lean tool familiarity ().
5.9.1 Verification of correlation magnitudes
Section 7.5 presents two conflicting sets of correlation values between productivity, defect rate and familiarity with lean tools (baseline vs. extreme figures).
Methodological Correction: The extreme magnitudes signal severe common-method bias (CMB), scale overlap, or multicollinearity – aligning with Section 9.0's self-reported data limitations. To rectify this, the final manuscript will:
Re-verify Data: Re-examine SPSS/Minitab baseline entries to resolve conflicting figures.
Assess Bias: Report a Harman's Single-Factor Test or Full Collinearity Assessment to quantify CMB.
5.9.2 Resolution of the “correlation heatmap” visual
Section 7.5 references a “Correlation Heatmap” without providing the corresponding graphic. Formatting will be resolved via:
Option A (Include Visual Matrix): Embed a Pearson correlation matrix table (covering Productivity, Defect Rate, Machine Uptime and Lean Tool Familiarity).
Option B (Rename Section): Rename Section 7.5 to “Correlation Analysis Matrix” if layout constraints prevent adding the graphic.
Note: The theoretical framework of the Tamil Nadu lean deployment study will also be broadened beyond purely operational efficiency.
5.9.3 Dynamic capabilities perspective
5.9.3.1 Rationale for inclusion
The Dynamic Capabilities (DC) approach explains how Tamil Nadu manufacturers achieve sustained competitive advantage through LEAN. While operational efficiency yields immediate cost savings, it is easily imitated; the long-term advantage requires higher-order dynamic capabilities.
5.9.4 Socio-technical systems (STS) perspective
5.9.4.1 Rationale for inclusion
The Socio-Technical Systems (STS) framework is essential because lean transforms roles and communication within Tamil Nadu's hierarchical workplaces. Maximum efficiency occurs when technical processes align with social capacity (e.g. Kanban paired with empowered operators).
Phase 1: Conceptual restructuring.
Introduce core theories in the Introduction and Literature Review to define baseline variables:
Routine Dynamics: Establishes 5S and TPM as foundational routines.
Dynamic Capabilities: Contextualizes sustained advantage beyond easily replicated operational gains.
STS Matrix: Explicitly links technical tools (VSM, workflows) with social dimensions (engagement, communication).
Phase 2: Hypothesis grounding.
H1 (5S) and H2 (TPM) [Routine Dynamics and STS]: Technical mechanisms stabilizing shop-floor actions into routines.
H5 (Engagement) and H6 (Training) [STS Social System]: Social mechanisms embedding skills in routines to prevent “lean fatigue”.
H7 (Leadership) [Dynamic Capabilities]: Coordinating mechanism to reconfigure resources and sustain competitive velocity.
Phase 3: Results integration (Section 8.0)
Section 8.0 will synthesize regression results directly through STS, Dynamic Capabilities and Routine Dynamics rather than discussing statistics in isolation (See Table 5).
5.9.5 Theoretical implications
Regarding the efficacy of lean tools – 5S, Kaizen, Total Productive Maintenance (TPM) and Value Stream Mapping (VSM) – in enhancing operational performance in the Indian automotive industry, the current study represents a significant empirical step towards the theoretical foundation of Lean Manufacturing. Its outcomes demonstrate measurable increases in output, defect rates and machine availability.
5.9.6 Managerial and practical implications
Automotive manufacturers can enhance operations using validated lean tools (5S, Kaizen, TPM and VSM). Regression analysis shows that leadership support and training hours’ drive success (Rahim et al., 2025). Managers should:
Target Constraints: Prioritize primary bottlenecks over generalized improvements.
Embed Standardization: Sustain technical gains through standardized execution.
Align Leadership: Build cross-functional problem-solving teams to ensure organizational readiness.
5.9.7 Generalizability and boundary conditions
While the empirical insights of this study are grounded in high-precision engineering and discrete manufacturing operations, the core mechanisms governing capacity enhancement and process optimization are broadly transferable to capital-intensive, process-driven environments.
6. Conclusion and future recommendations
Empirical data confirms lean methods significantly improve automotive operational performance (), boosting productivity by 24.1% and uptime by 10.7%, while lowering defects by 48.2%. Instrument reliability was confirmed (), and an 84% model accuracy validates lean's decision-making dependability. Overall, this study offers managers a roadmap for sustainable lean implementation.
6.1 Mechanisms of influence
Training best predicts success by building essential tacit knowledge, whereas unstructured familiarity risks “Lean fatigue” or superficial adoption. Applying lean tools (5S, Kaizen, TPM and VSM) significantly improves automotive performance, correlating with higher productivity and fewer defects. Regression classification validates data-driven adoption with 84% accuracy, while Tamil Nadu's roadmap emphasizes managerial commitment. Following 5S's 24.1% productivity gain and 48.2% fault reduction, future research should evaluate transitioning to an 8S framework.
6.2 Limitations of the study
This study examines lean tool adoption in Tamil Nadu's industrial sector. Due to scope, time and resource constraints, several limitations should be noted:
Geographical and Sectoral Scope
Geographical: Restricted to Tamil Nadu. Regional variations in regulations, labor practices and supply chains limit generalizability to other states or global regions.
Sectoral: Focused strictly on manufacturing. Findings do not extend to non-manufacturing sectors like services, healthcare, or government operations.
Methodological Restrictions
Self-Reported Data: Reliance on surveys and interviews with plant staff introduces potential common method and social desirability biases.
Organizational Context
Deployment Depth: Quantitative surveys track visible tool deployment but cannot fully evaluate deep cultural embedding or Lean mindset maturity.
6.3 Future recommendations
Policy Support: To advance the Make in India and Viksit Bharat visions, the Ministry of MSME should expand programs like the MSME Competitive (lean) Scheme in Tamil Nadu.
Risk Mitigation: Policies should help share initial, non-subsidized lean setup costs to lower adoption barriers for MSMEs.
Digital Lean: Integrating Industry 4.0 via affordable IoT sensors enables real-time tracking of machine utilization, cycle times and waste.
This study bridges key policy and technical advancements to future-proof Tamil Nadu's manufacturing sector globally.
Statements and declarations
The authors did not receive support from any organization for the submitted work.
No funding was received to assist with the preparation of this manuscript.
No funding was received for conducting this study.
No funds, grants, or other support was received.
The authors have no relevant financial or non-financial interests to disclose.
The authors have no competing interests to declare that are relevant to the content.
All authors certify that they have no affiliations with or involvement in any organization or entity with any financial interest or non-financial interest in the subject matter or materials discussed in this manuscript.
The authors have no financial or proprietary interests in any material discussed in this article.