The adoption of circular economy (CE) practices in the construction and demolition (C&D) sector remains limited, primarily due to a lack of practical knowledge about critical success factors, tools, techniques, and enabling technologies. Despite its strong potential to support Sustainable Development Goals (SDGs), CE implementation faces several barriers. This study aims to empirically identify and analyze the key success and failure factors, benefits, tools and technologies essential for effective CE adoption in C&D organizations, with a focus on enhancing global waste management practices.
A pilot survey was selected as the most suitable methodology, given that CE adoption in the C&D sector is still in its infancy. The survey targeted a diverse group of professionals, including managers, architects/designers, manufacturers, suppliers, engineers, contractors, facility managers and CE experts from the large enterprises and SMEs worldwide to collect relevant research information. The structured questionnaire was distributed to 300 participants and received 109 valid responses over a six-month period.
The study findings reveal that “Developing a market for circular materials and products” is a key success factor for CE adoption. Conversely, the most significant failure factors are “Limited market demand for secondary or recycled materials” and “Reluctance to use recycled products due to perceived quality concerns”. The results further highlight that successful CE implementation leads to greater conservation of natural resources, a reduction in greenhouse gas (GHG) emissions, improvements in public health, increased promotion of recycled materials, and enhanced regulatory compliance. Additionally, the analysis identifies artificial intelligence (AI), the Internet of Things (IoT), blockchain, vision-based robotic systems and digital twin as the most prominent technologies playing a crucial role across all stages of the CE adoption framework.
The study is limited by its sample size, as CE adoption in the C&D sector is still in its early stages, making it challenging to collect extensive data. Non-parametric methods were used for analysis. Future research should incorporate larger and more geographically diverse samples to explore cross-regional variations and enable parametric analyses for deeper insights.
The findings provide actionable insights for managers, planners, decision-makers, and researchers to understand the critical success and failure factors before implementing CE within their organizations. Additionally, the study helps convince top management of the benefits of CE adoption by presenting a comprehensive overview of its advantages. Furthermore, the research offers guidance to decision-makers in selecting the most appropriate Industry 4.0 technologies for each stage of the CE adoption framework.
This is the first global empirical study that integrates success factors, failure factors, and benefits of CE adoption in the C&D sector while examining the application of Industry 4.0 technologies across all stages of the CE adoption framework. The research contributes to both theoretical and practical understanding, offering a strategic roadmap for effective waste management in the C&D sector.
1. Introduction
Over the past decade, rapid population growth and accelerated urbanization have significantly driven construction and demolition (C&D) activities worldwide (Czekała et al., 2023). This surge has necessitated extensive infrastructure development, resulting in increased energy consumption, depletion of natural resources, heightened reliance on fossil fuels, and a substantial rise in waste generation. Studies estimate that C&D waste constitutes approximately 30–35% of global solid waste annually, with nearly 30% ending up in landfills (Doussoulin and Bittencourt, 2022). The rising volume of such waste has led to expanded landfill use, environmental degradation, water pollution, and various adverse social impacts. Despite these environmental challenges, the C&D sector remains vital to economic development, employment generation, and technological advancement (Swarnakar and Khalfan, 2024b). Globally, this sector employs around 220 million individuals and is projected to generate an additional 3.2 million jobs by 2029 (Construction Placements, 2024). In developing economies, the sector contributes approximately 6–10% of GDP annually, with the market size expected to reach USD 300–400 billion by 2030 (Global Data, 2024). However, a significant proportion of C&D organizations in these regions continue to depend on traditional construction methods, limiting their capacity to optimize resources or adopt sustainable practices. Key challenges include a lack of emphasis on critical success factors, minimal utilization of advanced tools and technologies, and limited focus on sustainability-oriented approaches (Swarnakar and Khalfan, 2024a, b; Czekała et al., 2023).
To address these concerns, there is a pressing need for sustainable models that enhance resource efficiency, reduce waste, and improve process effectiveness. Over recent decades, improvement frameworks such as Lean Construction, Total Quality Management (TQM), and Agile methodologies have been deployed to manage C&D waste (Zaman et al., 2023). While these approaches have shown promise in addressing specific aspects of waste management, they often fall short in delivering long-term sustainability and in comprehensively addressing environmental and social dimensions (Luciano et al., 2022). The Circular Economy (CE) model has emerged as a transformative paradigm that offers a promising solution. It emphasizes practices such as leasing, sharing, repairing, reusing, refurbishing, and recycling materials to reduce waste and conserve natural resources (Mahpour, 2018). CE seeks to decouple economic growth from resource consumption and mitigate global challenges including climate change, pollution, and biodiversity loss. Within the context of the C&D sector, CE principles and tools can play a critical role in reducing waste, minimizing resource use, and enhancing overall sustainability. Successful adoption of CE can help preserve natural ecosystems, promote public health, and advance social well-being by encouraging the use of renewable and recycled materials (Swarnakar and Khalfan, 2024a).
Nevertheless, implementing CE practices in the C&D industry presents significant challenges (Swarnakar and Khalfan, 2024a). It requires a structured framework that offers clear, actionable guidance for managers to embed CE practices into their operations effectively. A successful transition to CE also demands a comprehensive understanding of the critical success factors, potential barriers, associated benefits, and enabling tools and technologies. However, existing literature reveals a gap in empirical research that provides practical insights into these multifaceted requirements. Furthermore, C&D organizations often struggle with fragmented knowledge related to success and failure factors, as well as the role of emerging technologies across different stages of CE adoption (Swarnakar and Khalfan, 2024a, b). To address this research gap, the present study makes a novel contribution by empirically examining the success factors, failure factors, benefits, and technological enablers critical to CE implementation in C&D organizations. The study is guided by the following research questions:
What are the success and failure factors of CE within C&D waste management (CDWM) organizations?
What are the main benefits of CE within CDWM organizations?
Which tools and technologies can be frequently adopted and effectively used for CE implementation in CDWM organizations?
The remainder of the article is structured as follows: Section 2 presents a comprehensive literature review. Section 3 details the research methodology. Section 4 discusses the findings and their implications. Section 5 outlines the theoretical and managerial contributions. Finally, Section 6 concludes the study and suggests directions for future research.
2. Literature review
The literature review is conducted from four distinct perspectives aligned with the objectives of this study. These perspectives include: (1) success and failure factors for CE in CDWM, (2) benefits of CE adoption in CDWM environments, (3) tools and technologies used in CDWM organizations, and (4) Industry 4.0 technologies within the C&D waste management framework.
2.1 Success and failure factors of CE in CDWM
Success factors are essential drivers or enablers that facilitate the adoption of initiatives within organizations. Identifying and prioritizing these factors is critical for ensuring the successful implementation of CE practices in the CDWM sector (Swarnakar and Khalfan, 2024a). These factors form a vital component of organizational strategy, significantly influencing organizational performance and enabling the achievement of CE goals (Huang et al., 2021). Once categorized based on their importance, these success factors help decision-makers, construction managers, and building planners streamline their focus and resources toward the successful integration of CE principles in C&D organizations. Yuan et al. (2013) emphasized that on-site reuse approaches are instrumental in achieving CE in construction environments. Esa et al. (2017) underscored the significance of adopting advanced C&D techniques and encouraging clients to embrace CE principles. Similarly, Mahpour (2018) confirmed that advanced CDWM techniques contribute significantly to CE adoption. Huang et al. (2021) expanded upon these findings, emphasizing the need for incentives to promote sustainable practices, mandatory waste management plans, penalties for non-compliance, and supply chain partnerships. Ma et al. (2023) focused on the importance of clear recycling regulations, incentives for circular material adoption, effective waste management plans, and digital platforms for circular procurement. Swarnakar and Khalfan (2024a) emphasized the importance of standards for circular materials, mandatory waste management plans, top management commitment, and the integration of data analytics.
Failure factors represent significant barriers that hinder the successful implementation of any initiative (Swarnakar and Khalfan, 2024b). The failure to implement CE initiatives effectively can have adverse consequences on organizational performance, emphasizing the need to identify and address these factors proactively. Hence, it is crucial for organizational managers, planners, and decision-makers to focus on these failure factors before implementing CE initiatives (Mahpour, 2018). A comprehensive review of the literature reveals several critical failure factors impacting the adoption of CE in CDWM. For example, Liu et al. (2021) emphasized barriers such as the lack of incentives for circular materials, inconsistent CE policies, limited on-site reuse of materials, and unreliable data on CDW generation. Similarly, Sharma et al. (2022) identified critical barriers to CE adoption, including the availability of cheap virgin materials, inconsistent CE-related policies, and the absence of a clear vision and goals to adopt CE practices. Luciano et al. (2022) highlighted additional challenges such as the lack of incentives, uncertain market demand for recycled materials, inefficient logistics for CDW collection, and limited access to case studies and best practices. Shooshtarian et al. (2023) identified factors like the lack of supportive regulations, high operational costs for recycling facilities, poor awareness of CE benefits, and limited access to real-world case studies as critical barriers to CE implementation in the construction sector. Swarnakar and Khalfan (2024b) underscored barriers such as minimal stakeholder collaboration and engagement, lack of existing policies and regulations, unclear goals for CE adoption, lack of advanced recycling technologies, and ineffective waste management practices. The comprehensive list of success and failure factors identified from the literature is summarized in the Appendix to provide a clear understanding of the enablers and barriers of CE implementation in the CDWM sector.
2.2 Benefits of circular economy in CDWM
The adoption of a CE approach has been recognized as an efficient strategy for effective waste management, extending the lifecycle of materials, and optimizing resource utilization. Implementing CE principles within C&D organizations enhances infrastructure, manages C&D waste, improves material circularity, and supports environmental conservation (Gherman et al., 2023). CE fosters resource efficiency through its 3R concept—Reduce, Reuse, and Recycle—though additional Rs can be employed depending on specific needs and applications (Swarnakar and Khalfan, 2024b). Awareness of CE benefits serves as a significant motivator for managers to adopt CE practices in their organizations (Liu et al., 2021). Extensive knowledge about CE advantages plays a pivotal role in ensuring its successful implementation. Resource efficiency can also be achieved by minimizing the consumption of virgin natural resources and reusing materials already in circulation (Ma et al., 2023). Recycled materials can be repurposed for subsequent uses until they reach their end-of-life state (Han et al., 2024). Additionally, CE adoption creates new job opportunities, boosting employment and driving economic growth in the C&D sector (Doussoulin and Bittencourt, 2022). Public health can also benefit through circularity, as CE improves sustainability across C&D products and services (Swarnakar and Khalfan, 2024a). Several studies have reported various CE benefits in CDWM, such as enhancing organizational competitiveness, reducing landfill waste, addressing resource scarcity, and mitigating negative social and environmental impacts (Luciano et al., 2022; Herrador, 2024). The Appendix summarizes the benefits of CE in CDWM extracted from the existing literature.
2.3 Tools and techniques for CE adoption in CDWM
Adopting CE in the C&D environment requires the integration of advanced tools and techniques to effectively manage waste. Technologies such as mobile-based applications, barcode technology, vision-based robotic systems, Geographic Information Systems (GIS), and Radio-frequency Identification (RFID) are vital for assessing and managing waste for further reuse in different projects (Illankoon and Vithanage, 2023). These tools enhance process optimization, improve efficiency, and boost organizational performance (Swarnakar and Khalfan, 2024b). The following are some key tools and techniques for the successful adoption of CE in C&D organizations: (1) Mobile-based Applications: Mobile-based applications provide efficient tools for C&D waste management, enabling access to critical information, monitoring waste data, streamlining processes, and promoting sustainable disposal practices (Oliveira et al., 2021). (2) Barcode Technology: Barcode technology facilitates the identification and collection of detailed information related to C&D waste, thereby enhancing supply chain logistics (Rayhan and Bhuiyan, 2024). (3) Vision-based Robotic Systems: Vision-based robots, integrated with advanced computer vision modules, collect and sort C&D waste on-site, significantly improving process efficiency. These systems are particularly effective in complex and demanding industrial environments (Sharma et al., 2022). (4) Geographic Information Systems (GIS): GIS enhances waste collection and transportation efficiency while reducing costs. It also provides comprehensive information about material stocks for future C&D activities (Rašković et al., 2020). (5) Radio-frequency Identification (RFID): RFID is widely used in the waste management sector to automate data collection. It consists of three key components: a tag with a chip, a reader emitting radio signals, and middleware bridging the gap between hardware and software systems (Swarnakar and Khalfan, 2024b). The Appendix presents additional tools and techniques identified in literature. The effective utilization of these tools and techniques enables C&D organizations to optimize waste management, enhance efficiency, and improve the sustainability of their operations.
2.4 Industry 4.0 technologies within the C&D waste management framework
Preconstruction (Feasibility, Planning, and Design) – Procurement – Construction – Use and Operations – Predemolition (End-of-life assessment) – Demolition or Renovation – Collection and Distribution – Material Circularity (Recovery, Reproduction, and Recirculation) (PPCUPDCM) framework represents a comprehensive approach to managing C&D waste, aimed at improving circularity and optimizing operational efficiency (Swarnakar and Khalfan, 2024b). This framework enables organizations to effectively manage C&D waste while conserving resources for long-term sustainability. Additionally, it supports environmental and social well-being by minimizing landfill contributions and fostering healthier and more environmentally friendly practices. The PPCUPDCM framework offers several key advantages. First, it provides a structured and systematic approach to incorporating C&D materials at various stages of the C&D process. By guiding construction managers through a step-by-step process, the framework integrates principles, strategies, policies, tools, and techniques essential for successful CE implementation (Rašković et al., 2020). Second, the framework fosters strategic decision-making, ensuring that solutions align with CE objectives rather than traditional linear C&D practices (Shooshtarian et al., 2023). Finally, it supports sustainable and continuous improvement, enabling C&D organizations to identify and adopt iterative enhancements to their processes and operations (Swarnakar and Khalfan, 2024b).
In the context of Industry 4.0, the PPCUPDCM framework can be further enhanced by integrating advanced technologies such as digital twins, machine learning, blockchain, 3D printing, BIM, sensors, big data analytics, AI, and others. These tools provide organizations with deeper insights and capabilities for effective and efficient C&D waste management (Swarnakar and Khalfan, 2024b). For instance, digital twin technology can simulate and predict waste outcomes, while AI-powered analytics can optimize resource allocation and waste sorting. Moreover, the PPCUPDCM framework facilitates the handling of the complexity and interconnectedness of I4.0 systems in C&D waste management. By incorporating these advanced technologies, construction managers can better navigate the challenges associated with managing multi-layered processes, ensuring seamless operations while advancing CE objectives. This integration not only enhances operational efficiency but also aligns waste management practices with global sustainability goals, setting a precedent for the future of C&D waste management.
3. Research methodology
A survey-based methodology was deemed the most appropriate approach for this study, given that CE adoption in the C&D sector remains at an emerging stage. As emphasized by Babbie (2010) and Check and Schutt (2011), surveys are particularly effective for collecting data and generating insights in relatively unexplored or evolving domains by capturing perspectives from a targeted sample. The survey method offers several advantages, such as the ability to efficiently collect substantial volumes of data and the flexibility to address a broad range of questions from diverse respondent groups (Ponto, 2015). In emerging research areas like CE adoption in the C&D sector, gathering expert insights is crucial, reinforcing the suitability of surveys for obtaining accurate and relevant information (Check and Schutt, 2011). While numerous studies have explored CE implementation globally, several countries continue to face significant challenges in integrating CE practices within the C&D sector (Superti et al., 2021; Swarnakar and Khalfan, 2024a). Given this context, a pilot survey was conducted to ensure alignment with the study’s objectives and to validate the effectiveness of the survey instrument. The target population included global experts and professionals from the C&D industry, such as C&D project managers, architects/designers, manufacturers, suppliers, engineers, contractors, facility managers, and CE specialists.
The survey approach comprised three key phases: questionnaire design, validation, and distribution. One of the primary challenges in survey research is designing a questionnaire that ensures both reliability and validity of the collected data (Welman et al., 2005). To overcome this, the survey instrument was developed through a comprehensive literature review and refined with feedback from five domain experts. A pilot test was then conducted to evaluate the clarity, relevance, and comprehensiveness of the questionnaire before its final dissemination. The questionnaire was structured into two sections. The first section, General Information, collected demographic and organizational data of the participants. The second section, CE-related Aspects, focused on evaluating key factors identified from the literature, including success factors, failure factors, benefits, tools, and technologies related to CE adoption in CDWM. A seven-point Likert scale, ranging from 1 (“strongly disagree”) to 7 (“strongly agree”), was utilized to capture participant responses. This scale was chosen over a five-point scale to allow for greater differentiation and response accuracy (Sullivan and Artino, 2013).
The finalized questionnaire was distributed via SurveyMonkey, a widely adopted platform known for its customizable links and user-friendly interface, which enhances accessibility and response rates (Varela et al., 2016; Rice et al., 2017). Participants were selected from various countries—including the United States, United Kingdom, Brazil, Saudi Arabia, United Arab Emirates, India, Netherlands, China, Canada, Germany, Ireland, Spain, Pakistan, and Australia—based on their engagement in CE practices and initiatives to improve C&D waste management. To capture a diverse set of perspectives, professionals from both developed and developing economies were included. A total of 300 professionals were randomly selected using LinkedIn, corporate websites, and other professional networking platforms. Out of these, 117 responses were received over six months, of which 109 were deemed complete and valid for analysis, yielding a response rate of 36%. As noted by Easterby-Smith et al. (2012), a response rate above 20% is acceptable for survey research, and even lower rates may be adequate in emerging research areas (Sax et al., 2003). Table 1 presents detailed demographics of the survey participants, including organizational size and economic classification. Organizational size was categorized following existing literature, distinguishing Large Enterprises (LEs) as those with more than 250 employees and Small and Medium Enterprises (SMEs) as those with 50–249 employees (Page and Soderbom, 2015). The classification of countries as developed or developing was based on OECD standards (OECD, 2021).
Sample demographics
| Participants from C&D waste management organizations | Large size organization (LE) | Small and medium-sized organizations (SMEs) | Total |
|---|---|---|---|
| Developing economics | 22 | 9 | 31 |
| Professional experience (less than 5 years) | 3 | 1 | 4 |
| Professional experience (5–10 years) | 7 | 3 | 10 |
| Professional experience (more than 10 years) | 12 | 5 | 17 |
| Developed economics | 49 | 29 | 78 |
| Professional experience (less than 5 years) | 9 | 6 | 15 |
| Professional experience (5–10 years) | 17 | 11 | 28 |
| Professional experience (more than 10 years) | 23 | 12 | 35 |
| Grand total | 71 | 38 | 109 |
Source(s): Created by the authors
To analyze the collected data, several statistical techniques were employed. The Anderson-Darling test was first applied to assess data normality (Razali and Wah, 2011). Since the data did not follow a normal distribution (p < 0.05), non-parametric tests were selected for further analysis. Specifically, the Mann-Whitney U test was used to examine differences in perceptions of success factors, failure factors, benefits, tools, and technologies across organizational size (LEs vs. SMEs) and economic classification (developed vs. developing economies). The Mann-Whitney U test serves as a robust alternative to the parametric Student’s t-test for independent samples and is well-suited for identifying significant intergroup differences (McKnight and Najab, 2010; Milenovic, 2011). Furthermore, the survey examined the integration of Industry 4.0 technologies across the phases of the PPCUPDCM framework. Response frequencies related to I4.0 adoption were analyzed, and Fisher’s exact test for two-sample proportions was employed to assess differences in technology adoption based on organizational size and country classification. The detailed findings and interpretations of these analyses are presented in the Results and Discussion section.
4. Results and discussion
The findings of the analysis are presented in this section. Initially, the success factors for CE implementation in CDWM organizations are analyzed and reported, followed by an evaluation of failure factors, benefits, and tools and technologies. Lastly, an analysis of I4.0 technologies integrated into different phases of the PPCUPDCM framework is provided.
4.1 Success factors
To examine whether CE success factors vary based on organizational size and economic context, the results of the analysis are presented in Table 2. The five most prominent success factors for effective CE adoption in CDWM organizations were identified as follows: (1) Develop markets for circular materials and products, (2) Encourage customers to use recycled materials and products, (3) Establish a system for the procurement of circular materials and products, (4) Promote collaboration among industry, academia, and government stakeholders, and (5) Develop and enforce effective mandatory CWMM plans for projects and Establish a clear guidelines, and regulations to promote CE strategies. Among these, the development of markets for circular materials and products emerged as the most critical success factor across both LEs and SMEs, as well as in both developing and developed economies. This finding aligns with previous studies by Swarnakar and Khalfan (2024a) and Ma et al. (2023). Similarly, Shooshtarian et al. (2023) and Gherman et al. (2023) emphasized the central role of market development in advancing CE implementation in CDWM sector.
Success factors of CE adoption in the C&D sector
| Success factor | Overall | Organization type | Economics | ||
|---|---|---|---|---|---|
| LE | SME | Developing | Developed | ||
| Allocate funds for R&D activities focused on sustainable CDWM | 5.63 | 5.57 | 5.47 | 5.97 | 5.30 |
| Provide training to employees on sustainable CDWM practices | 5.77 | 5.91 | 5.35 | 5.95 | 5.67 |
| Offer tax rebates for organizations implementing CE practices | 5.54 | 5.67 | 5.14 | 6.10 | 5.23 |
| Establish clear guidelines, and regulations to promote CE strategies | 6.08 | 6.12 | 5.90 | 6.16 | 5.98 |
| Adopt advanced and modular C&D techniques | 5.54 | 5.65 | 5.21 | 5.89 | 5.34 |
| Encourage customers to use recycled materials and products | 6.14 | 6.21 | 5.97 | 6.22 | 6.05 |
| Develop novel materials that can be easily recycled or reused | 5.85 | 5.88 | 5.78 | 6.28 | 5.61 |
| Ensure top management actively supports and adopts CE practices | 5.08 | 5.04 | 5.22 | 5.46 | 4.88 |
| Organize CE awareness programs to engage the community | 5.69 | 5.68 | 5.40 | 6.01 | 5.45 |
| Implement material tracking systems to effectively manage CDW | 5.62 | 5.66 | 5.50 | 5.80 | 5.52 |
| Conduct research on circular materials, recycling tools, and techniques | 5.85 | 5.99 | 5.43 | 6.03 | 5.75 |
| Prepare regular reports on CE goals and achievements | 5.23 | 5.19 | 5.37 | 5.61 | 5.03 |
| Promote the on-site reuse of CDW | 5.54 | 5.67 | 5.17 | 5.89 | 5.35 |
| Develop markets for circular materials and products | 6.22 | 6.29 | 6.23 | 6.34 | 6.07 |
| Adopt BIM technology to plan for material reuse | 5.77 | 5.89 | 5.39 | 6.11 | 5.40 |
| Foster partnerships across supply chain to optimize resource usage | 5.77 | 5.86 | 5.48 | 6.19 | 5.53 |
| Provide quality certifications for circular materials and products | 5.85 | 5.98 | 5.48 | 6.20 | 5.66 |
| Use data analytics to enhance CDWM efficiency | 5.62 | 5.75 | 5.24 | 6.14 | 5.19 |
| Establish a system for the procurement of circular materials and products | 6.12 | 6.19 | 5.93 | 6.20 | 6.00 |
| Offer incentives to encourage CE adoption | 5.85 | 5.98 | 5.47 | 6.05 | 5.04 |
| Ensure sufficient resources and financing for recycling facilities and technologies | 5.85 | 5.99 | 5.43 | 6.03 | 5.75 |
| Develop and enforce effective mandatory CWMM plans for projects | 6.08 | 6.12 | 5.90 | 6.16 | 5.98 |
| Impose significant penalties for unethical landfill practices and non-compliance | 5.23 | 5.36 | 4.83 | 5.68 | 4.97 |
| Create digital platforms for efficient materials management | 5.92 | 6.04 | 5.54 | 6.11 | 5.19 |
| Build storage facilities for circular products and materials | 5.46 | 5.42 | 5.60 | 5.84 | 5.26 |
| Design buildings for easy disassembly and material recovery | 5.62 | 5.75 | 5.25 | 5.97 | 5.43 |
| Promote collaboration among industry, academia, and government stakeholders | 6.10 | 6.17 | 5.91 | 6.18 | 5.99 |
Source(s): Created by the authors
To explore statistical difference in success factor perceptions, a Mann-Whitney U test was conducted. The results indicated no significant differences between LEs and SMEs (p > 0.05). However, statistically significant differences were observed between developing and developed economies for the following factors: (1) Offer tax rebates for organizations implementing CE practices (mean: developing = 6.10; developed = 5.23; p = 0.043), (2) Adopt BIM technology to plan for material reuse (developing = 6.11; developed = 5.40; p = 0.046), (3) Use data analytics to enhance CDWM efficiency (developing = 6.14; developed = 5.19; p = 0.048), (4) Offer incentives to encourage CE adoption (developing = 6.05; developed = 5.04; p = 0.041), (5) Impose significant penalties for unethical landfill practices and non-compliance (developing = 5.68; developed = 4.97; p = 0.037), and (6) Create digital platforms for efficient materials management (developing = 6.11; developed = 5.19; p = 0.023). These findings suggest that financial incentives, stricter regulations, and digital technologies—such as BIM, data analytics, and material management platforms—play a more influential role in driving CE adoption in developing economies. Policymakers should leverage these insights by offering tax rebates, enforcing compliance, and promoting digital tools to enhance CDWM. Overall, the results underscore the need for context-specific strategies to advance CE implementation and support global sustainability goals in the construction and demolition sector.
4.2 Failure factors
The barriers to CE adoption in CDWM organizations were identified and are summarized in Table 3. Based on the analysis, the five most critical failure factors impeding CE implementation in the C&D sector are: (1) Limited market for secondary or recycled products and materials, (2) Reluctance to use recycled products due to perceived quality concerns, (3) Complexity in handling and managing CDW materials, (4) High initial investment required for recycling facilities, (5) Poor stakeholder collaboration and engagement. The findings emphasize the urgent need to establish robust market for recycled materials to foster CE adoption. Furthermore, the availability of high-quality recycled materials, supported by technological advancements in waste management systems, can alleviate concerns around material performance and usability. Quality assurance frameworks and awareness campaigns may encourage greater acceptance of recycled materials. In addition, government subsidies or tax relief can help offset the high capital costs associated with setting up recycling facilities. Strengthening multi-stakeholder collaboration—including industry leaders, policymakers, and waste management professionals—is also essential for an integrated and effective CE implementation. These observations are consistent with prior studies, such as those by Gherman et al. (2023) and Herrador (2024), which similarly highlighted market limitations as a critical constraint to CE adoption.
Failure factors of CE adoption in C&D sector
| Failure factor | Overall | Organization type | Economics | ||
|---|---|---|---|---|---|
| LE | SME | Developing | Developed | ||
| Lack of awareness about the benefits of CE adoption | 5.62 | 5.64 | 5.61 | 5.67 | 5.55 |
| Insufficient incentives and support mechanisms | 5.69 | 5.76 | 5.60 | 5.72 | 5.39 |
| Weak enforcement of CDWM regulations and policies | 5.23 | 5.21 | 5.27 | 5.33 | 5.04 |
| Limited access to best practices and real-world case studies | 5.79 | 5.66 | 5.70 | 5.61 | 5.58 |
| High initial investment required for recycling facilities | 6.15 | 5.89 | 5.93 | 6.08 | 5.80 |
| Inadequate advanced recycling technologies and material flow tracing systems | 5.78 | 5.64 | 6.68 | 5.59 | 5.56 |
| Insufficient resources and infrastructure for effective CDWM | 5.54 | 5.41 | 5.65 | 5.58 | 5.46 |
| Reluctance to use recycled products due to perceived quality concerns | 6.30 | 6.15 | 5.88 | 5.98 | 6.16 |
| Limited space for on-site material sorting and storage | 5.64 | 5.52 | 5.71 | 5.69 | 5.57 |
| Resistance to transitioning from a linear to a CE model | 5.67 | 5.55 | 5.72 | 5.73 | 5.61 |
| Uncertain demand for recycled products or materials | 5.69 | 5.68 | 5.69 | 5.76 | 5.66 |
| Challenges in separating materials from C&D wastes | 5.38 | 5.47 | 5.09 | 5.27 | 5.60 |
| Lack of information on the performance of recycled materials | 5.47 | 5.56 | 5.18 | 5.36 | 5.69 |
| Easy access to inexpensive virgin materials in the market | 5.69 | 5.55 | 5.04 | 5.93 | 5.09 |
| Limited market for secondary or recycled products and materials | 6.47 | 6.17 | 6.71 | 6.22 | 6.35 |
| Insufficient integration of CE principles into building design | 5.62 | 5.63 | 5.59 | 5.67 | 5.54 |
| Inadequate logistics for CDW collection and transportation | 5.63 | 5.64 | 5.60 | 5.68 | 5.55 |
| Poor stakeholder collaboration and engagement | 6.00 | 5.87 | 5.91 | 5.96 | 5.78 |
| Inconsistent policies and regulations across regions | 5.77 | 5.79 | 5.71 | 5.78 | 5.75 |
| Lack of clear goals, vision, and targets for CE adoption | 4.92 | 4.94 | 4.89 | 4.98 | 4.82 |
| Low landfill gate fees and insufficient penalties for non-compliance | 5.31 | 5.39 | 4.89 | 5.72 | 4.87 |
| Poor planning for end-of-life material reuse and recovery | 5.92 | 5.74 | 5.72 | 5.88 | 5.69 |
| Complexity in handling and managing CDW materials | 6.21 | 6.00 | 5.73 | 6.01 | 5.89 |
| Absence of standardized design practices for deconstruction and material reuse | 5.77 | 5.82 | 5.39 | 5.95 | 5.08 |
| Insufficient funding to implement CE initiatives | 5.23 | 5.21 | 5.27 | 5.33 | 5.24 |
| Perceived financial risks and low profit margins | 5.46 | 5.55 | 5.17 | 5.35 | 5.68 |
| Lack of reliable data on CDW generation and composition | 5.77 | 5.79 | 5.69 | 5.78 | 5.75 |
| Fragmented supply chains for circular materials | 5.78 | 5.81 | 5.70 | 5.79 | 5.65 |
Source(s): Created by the authors
To explore differences in the perception of failure factors, a Mann–Whitney U test was employed. While no statistically significant differences were found between LEs and SMEs (p > 0.05), significant disparities were observed between developing and developed economies in the following areas: (1) Easy access to inexpensive virgin materials in the market (mean: developing = 5.93; developed = 5.09; p = 0.031), (2) Low landfill gate fees and insufficient penalties for non-compliance (developing = 5.72; developed = 4.87; p = 0.034), and (3) Absence of standardized design practice for deconstruction and material use (developing = 5.95; developed = 5.08; p = 0.038). These findings underscore the specific challenges faced by developing economies, including low-cost availability of virgin materials, weak enforcement of landfill regulations, and the absence of standardized design frameworks. Targeted interventions—such as stricter landfill penalties, tax incentives for the use of recycled materials, and comprehensive design standards—can significantly enhance CE adoption in these regions. By addressing these structural and regulatory gaps, developing countries can foster more resilient, sustainable, and circular construction ecosystems.
4.3 Benefits
The key benefits of implementing CE principles in CDWM are summarized in Table 4. The top five benefits identified through empirical analysis are: (1) Protect natural resources, (2) Minimize GHGs emissions, fossil fuel use, and other pollutants, (3) Improve public health and social well-being, (4) Promote renewable and recycled materials, and (5) Comply with relevant regulations and policies. These findings are consistent with earlier studies, which emphasize that CE adoption in construction organizations supports resource conservation, GHG reduction, enhanced public health, and regulatory compliance (Huang et al., 2021; Zaman et al., 2023; Swarnakar and Khalfan, 2024b). Furthermore, CE implementation facilitates excellence in resource optimization, emission reduction, and the promotion of recycled materials (Sharma et al., 2022; Han et al., 2024).
Benefits of CE adoption in C&D waste management
| Benefits | Overall | Organization type | Economics | ||
|---|---|---|---|---|---|
| LE | SME | Developing | Developed | ||
| Improve public health and social well-being | 6.49 | 6.12 | 5.86 | 6.13 | 6.09 |
| Minimize the need for new land for waste disposal | 5.89 | 5.87 | 5.69 | 5.83 | 5.79 |
| Comply with relevant regulations and policies | 6.22 | 5.99 | 5.73 | 6.01 | 6.04 |
| Promote renewable and recycled materials | 6.35 | 6.07 | 5.78 | 6.08 | 6.06 |
| Protect natural resources | 6.71 | 6.17 | 6.21 | 6.36 | 6.18 |
| Meet community housing and land requirements | 5.13 | 5.26 | 5.32 | 5.38 | 4.09 |
| Reduce reliance on imports | 4.88 | 4.85 | 4.75 | 4.85 | 4.85 |
| Increase job creation and employment opportunities | 5.29 | 5.24 | 5.30 | 5.36 | 4.27 |
| Minimize illegal disposal | 5.09 | 5.14 | 5.03 | 5.16 | 5.07 |
| Minimize the volume of CDW going into landfills | 6.10 | 6.17 | 5.91 | 6.18 | 5.99 |
| Improve the organization’s competitiveness | 5.33 | 5.31 | 5.37 | 5.43 | 5.34 |
| Minimize GHGs emissions, fossil fuel use, and other pollutants | 6.52 | 6.15 | 5.88 | 6.16 | 6.10 |
| Reduce demand-driven price and supply cahin risks | 5.01 | 4.87 | 4.91 | 4.96 | 4.78 |
| Minimize transportation and disposal costs | 5.72 | 5.74 | 5.64 | 5.73 | 5.70 |
| Maximize the use of CDW | 6.08 | 5.87 | 5.33 | 5.77 | 5.58 |
| Educate the public and industries about circular practices | 6.00 | 5.87 | 5.91 | 5.96 | 5.78 |
| Improve resource efficiencies | 5.94 | 5.74 | 5.72 | 5.88 | 5.69 |
| Maximize monetary benefits | 5.48 | 5.57 | 5.19 | 5.37 | 4.40 |
| Minimize resource scarcity | 5.99 | 5.92 | 5.70 | 5.89 | 5.76 |
| Foster clean energy and sustainable environments | 4.77 | 4.79 | 4.69 | 4.78 | 4.75 |
Source(s): Created by the authors
The study empirically validates that CE adoption significantly contributes to sustainable development. Organizations integrating CE practices can expect multifaceted benefits, enhancing both environmental performance and regulatory alignment. To assess whether these perceived benefits vary across organizational types and economic contexts, a Mann–Whitney U test was conducted. The results revealed no significant difference between LEs and SMEs, indicating a uniform distribution of CE benefits across organization sizes. However, significant differences emerged between organizations from developing and developed economies, particularly for: (1) Meet community housing and land requirements (p = 0.040), (2) Increase job creation and employment opportunities (p = 0.034), and Maximize monetary benefits (p = 0.038). These findings suggest that while developed countries benefit from established recycling infrastructure and supportive policies, developing nations view CE as a strategic tool for addressing basic needs, such as housing, employment, and economic development (Mahpour, 2018; Swarnakar and Khalfan, 2024b).
4.4 Tools and technologies
This study also explored the tools and technologies facilitating CE implementation in CDWM, are summarized in Table 5. Based on respondents’ ratings using a 7-point Likert scale, tools were categorized (following Joshi et al., 2015) as follows: Top-Priority (Mean scores between 6.0 and 7.0), High-Priority (5.0 and 5.9), Moderate-Priority (3.0 and 4.9), and Low-Priority (1.0 and 2.9). The analysis revealed significant insights into the prioritization of tools and technologies within each category.
Tools and technologies for CE adoption in CDWM
| Tools and technologies | Overall mean | Classification of tools and technologies based on frequency | |||
|---|---|---|---|---|---|
| Top-priority (mean score between 6.0 to 7.0) | High-priority (mean score between 5.0 to 5.9) | Moderate-priority (mean score between 3.0 to 4.9) | Low-priority (mean score between 1.0 to 2.9) | ||
| Material Flow Analysis | 6.57 | Life Cycle Assessment Tool | Machine Learning Approaches | X-ray Diffraction and Scanning Electron Microscopy Techniques | Greenhouse Gas Design Optimization and Net Waste Tool |
| Barcode Technology | 5.46 | Building Information Modeling | Geographic Information Systems | Image Recognition Technology | Finite Element Modeling |
| Material Passports | 5.52 | Material Flow Analysis | Global Positioning System | Vision-based Robotic Systems | Mobile-based Applications |
| Building Information Modeling | 6.61 | Artificial Intelligence based Approaches | Material Passports | Virtual Reality | Multi-sensor Fusion Methods |
| Multi-criteria Decision Analysis-based Tools | 5.49 | Big Data Technology | MCDA-based Tools | 3D Printing Technology | Algorithm-based Analysis Tools |
| Life Cycle Assessment Tool | 6.73 | Digital Twin | Barcode Technology | Boundary-aware Transformer Model | |
| Global Positioning System | 5.63 | Blockchain Technology | Timed Petri Net | ||
| Artificial Intelligence-based Approaches | 6.54 | Radio-frequency Identification | Balanced Scorecard Approach | ||
| Machine Learning Approaches | 5.89 | ||||
| Geographic Information Systems | 5.71 | ||||
| Big Data Technology | 6.49 | ||||
| Image Recognition Technology | 4.54 | ||||
| Radio-frequency Identification | 6.06 | ||||
| Vision-based Robotic Systems | 4.31 | ||||
| Boundary-aware Transformer Model | 3.92 | ||||
| Digital Twin | 6.33 | ||||
| Virtual Reality | 4.21 | ||||
| 3D Printing Technology | 4.14 | ||||
| X-ray Diffraction and Scanning Electron Microscopy Techniques | 4.70 | ||||
| Blockchain Technology | 6.28 | ||||
| Greenhouse Gas Design Optimization and Net Waste Tool | 1.72 | ||||
| Algorithm-based Analysis Tools | 1.22 | ||||
| Greenhouse Gas Design Optimization and Net Waste Tool | 1.73 | ||||
| Timed Petri Net | 3.79 | ||||
| Balanced Scorecard Approach | 3.40 | ||||
| Mobile-based Applications | 1.42 | ||||
| Finite Element Modeling | 1.54 | ||||
| Multi-sensor Fusion Methods | 1.36 | ||||
Source(s): Created by the authors
4.4.1 Top-priority tools and technologies
The most impactful tools and technologies adopted globally for CE implementation in CDWM included Life Cycle Assessment (LCA), Building Information Modeling (BIM), and Material Flow Analysis (MFA). LCA and BIM are widely recognized for their role in optimizing resource efficiency and ensuring sustainability in CDWM (Rašković et al., 2020). MFA is a key tool for identifying waste streams and optimizing resource flows, making it essential for successful CE implementation (Swarnakar and Khalfan, 2024b).
4.4.2 High-priority tools and technologies
Machine Learning (ML), Geographic Information Systems (GIS), and Global Positioning Systems (GPS) were classified under high-priority tools and technologies. Machine learning plays a critical role in optimizing and predicting waste sorting and recycling processes (Czekała et al., 2023), whereas GIS and GPS are vital for tracking material flows and managing resource distribution effectively.
4.4.3 Moderate-priority tools and technologies
Technologies such as X-ray Diffraction and Scanning Electron Microscopy Techniques, Image Recognition Technology, and Vision-based Robotic Systems were placed in Moderate-Priority category. These tools are increasingly being explored but are not yet widely adopted due to their limited practical applications and high costs.
4.4.4 Low-priority tools and technologies
Tools such as Greenhouse Gas Design Optimization and Net Waste Tool, Finite Element Modeling, and Mobile-Based Applications were classified as low-priority. These technologies are in the early stages of development and have limited applicability in CDWM (Sharma et al., 2022).
Emerging technologies such as Artificial Intelligence (AI), Big Data, Digital Twin, Blockchain, and RFID are gaining momentum. AI supports predictive modeling and process optimization, Big Data enables large-scale analytics, and Digital Twins create virtual simulations to improve operational decisions (Rayhan and Bhuiyan, 2024). Blockchain and RFID technologies contribute to transparency and traceability in material flows (Swarnakar and Khalfan, 2024a). Conversely, Finite Element Modeling and Multi-Sensor Fusion Methods remain underutilized due to developmental constraints. In summary, selecting appropriate tools based on organizational context is vital for effective CE implementation. These technologies enhance resource and energy efficiency, facilitating the transition to a circular model in the C&D sector.
4.5 Industry 4.0 technologies integration in the PPCUPDCM framework
The study further examined the integration of Industry 4.0 technologies within the PPCUPDCM framework, which maps CE practices across the CDWM lifecycle. Tables 6 and 7 provide adoption frequencies and stage-wise technology prioritization, respectively.
Industry 4.0 technologies integration in different stages of PPCUPDCM construction and demolition waste management framework
| I4.0 technology | P | P | C | U | P | D | C | M |
|---|---|---|---|---|---|---|---|---|
| Material Flow Analysis | 0 | 0 | 0 | 0 | 14 | 23 | 0 | 94 |
| Material Passports | 0 | 0 | 0 | 0 | 94 | 0 | 0 | 0 |
| Building Information Modeling | 97 | 0 | 5 | 0 | 4 | 0 | 0 | 3 |
| Robotic demolition system | 0 | 0 | 0 | 0 | 0 | 96 | 0 | 0 |
| Life Cycle Assessment Tool | 0 | 0 | 0 | 0 | 86 | 3 | 0 | 2 |
| Global Positioning System | 2 | 5 | 13 | 0 | 3 | 2 | 82 | 0 |
| Artificial Intelligence based sorting systems | 65 | 0 | 37 | 0 | 71 | 25 | 33 | 73 |
| Machine Learning Approaches | 2 | 0 | 0 | 0 | 69 | 3 | 13 | 0 |
| Geographic Information Systems | 77 | 12 | 0 | 0 | 37 | 0 | 7 | 0 |
| Big Data Analytics | 3 | 98 | 0 | 0 | 22 | 0 | 12 | 0 |
| Radio-frequency Identification | 0 | 95 | 23 | 0 | 0 | 13 | 4 | 0 |
| Vision-based Robotic Systems | 0 | 0 | 91 | 0 | 0 | 78 | 22 | 0 |
| Digital Twin | 86 | 4 | 0 | 71 | 22 | 0 | 0 | 0 |
| 3D Printing Technology | 0 | 0 | 76 | 0 | 0 | 0 | 0 | 68 |
| X-ray Diffraction and Scanning Electron Microscopy Techniques | 0 | 0 | 0 | 0 | 0 | 4 | 8 | 85 |
| Blockchain Technology | 0 | 101 | 0 | 0 | 0 | 22 | 77 | 3 |
| Multi-sensor Fusion Methods | 0 | 0 | 7 | 0 | 0 | 0 | 61 | 0 |
| Internet of Things Sensors | 0 | 0 | 85 | 91 | 0 | 81 | 0 | 0 |
| AI based maintenance System | 0 | 0 | 0 | 83 | 0 | 0 | 0 | 0 |
Note(s): *P: Preconstruction, P: Procurement, C: Construction, U: Use and Operations, P: Pre-demolition, D: Demolition or Renovation, C: Collection and Distribution, M: Material Circularity
Source(s): Created by the authors
Industry 4.0 technologies integration in different stages of PPCUPDCM framework based on preference frequency
| I4.0 technology | First position | Second position | Third position | Fourth position |
|---|---|---|---|---|
| Preconstruction (P) | Building Information Modeling | Digital Twin | Geographic Information Systems | Artificial Intelligence based sorting systems |
| Procurement (P) | Blockchain Technology | Big Data Analytics | Radio-frequency Identification | |
| Construction (C) | Vision-based Robotic Systems | Internet of Things Sensors | 3D Printing Technology | |
| Use and Operations (U) | Internet of Things Sensors | AI based maintenance System | Digital Twin | |
| Pre-demolition (P) | Material Passports | Life Cycle Assessment Tool | Artificial Intelligence based sorting systems | Machine Learning Approaches |
| Demolition or Renovation (D) | Robotic demolition system | Internet of Things Sensors | Vision-based Robotic Systems | |
| Collection and Distribution (C) | Global Positioning System | Blockchain Technology | Multi-sensor Fusion Methods | |
| Material Circularity (M) | Material Flow Analysis | X-ray Diffraction and Scanning Electron Microscopy Techniques | Artificial Intelligence based sorting systems | 3D Printing Technology |
Source(s): Created by the authors
The findings reveal that the integration of I4.0 technologies across PPCUPDCM Stages.
4.5.1 Stage 1: preconstruction (feasibility, planning, and design)
Building Information Modeling (BIM) emerged as the most frequently applied technology in this stage, facilitating precise material optimization, resource planning, and life cycle analysis for effective CDW management (Rašković et al., 2020). Digital Twin, Geographic Information Systems (GIS), and Artificial Intelligence (AI)-based sorting systems were also widely adopted. Digital Twin aids in simulating design and operational processes for informed decision-making (Illankoon and Vithanage, 2023). GIS supports material logistics and site analysis, while AI-based sorting systems predict material requirements and waste generation (Rašković et al., 2020).
4.5.2 Stage 2: procurement
Blockchain technology was identified as the most adoptable technology for enhancing traceability in CDW collection and distribution processes. Big Data Analytics and Radio-Frequency Identification (RFID) were also frequently used. Big Data aids in demand forecasting and vendor selection, whereas RFID tracks material deliveries efficiently (Rayhan and Bhuiyan, 2024).
4.5.3 Stage 3: construction
Vision-based robotic systems were the most frequently applied technology, followed by IoT sensors and 3D printing technologies. Vision-based robotic systems facilitate sorting of C&D wastes, IoT sensors monitor real-time material usage, and 3D printing helps reduce transportation emissions by fabricating components on-site, thereby promoting environmental sustainability (Sharma et al., 2022).
4.5.4 Stage 4: use and operations
IoT sensors were the most prominent technology, followed by AI-based maintenance systems and Digital Twin. These technologies primarily monitor building performance, reduce operational waste, prevent failures, and simulate efficient resource use (Illankoon and Vithanage, 2023; Czekała et al., 2023).
4.5.5 Stage 5: predemolition (end-of-life assessment)
Material Passports were the most commonly used technology, followed by Life Cycle Assessment (LCA) tools, AI-based sorting systems, and Machine Learning (ML) approaches. Material Passports document material properties, facilitating reuse and recycling (Superti et al., 2021). LCA evaluates the environmental impact of end-of-life scenarios, while AI and ML systems predict C&D waste and assess reuse possibilities (Swarnakar and Khalfan, 2024b).
4.5.6 Stage 6: demolition or renovation
Robotic demolition systems were the most widely adopted technology in this stage, with IoT sensors and vision-based robotic systems also being frequently utilized. These technologies enhance efficiency and safety during demolition and renovation processes.
4.5.7 Stage 7: collection and distribution
Global Positioning System (GPS) was the most frequently used technology to optimize C&D waste transportation routes. Blockchain and multi-sensor fusion methods were also employed to ensure traceability and enhance sorting accuracy (Sharma et al., 2022; Swarnakar and Khalfan, 2024a).
4.5.8 Stage 8: material circularity (recovery, reproduction, and recirculation)
Material Flow Analysis (MFA) was the most frequently applied technology in this stage, helping to track material recovery (Gherman et al., 2023). X-ray Diffraction and Scanning Electron Microscopy, AI-based sorting systems, and 3D printing technologies were also used to analyze material quality, improve material efficiency, and convert recovered materials into usable components (Colorado et al., 2022). The findings indicate that integrating I4.0 technologies into the PPCUPDCM framework enables C&D organizations to optimize resources, enhance waste management efficiency, reduce costs, and improve the quality of recycled materials, contributing to sustainable performance. Figure 1 illustrates the adoption frequency of I4.0 technologies across various PPCUPDCM stages. By leveraging these technologies, C&D organizations can minimize waste, improve resource efficiency, and achieve optimal performance. However, successful integration requires prioritizing the most impactful technologies across all stages. Based on the empirical analysis, the top five I4.0 technologies for CE implementation in C&D waste management organizations are as follows:
Artificial Intelligence-based Sorting Systems: These systems predict material requirements, reduce waste generation, and enhance material reuse and recovery (Czekała et al., 2023).
Internet of Things (IoT) Sensors: IoT sensors enable real-time monitoring of CDW generation and building performance, reducing operational waste and extending service life (Swarnakar and Khalfan, 2024b).
Blockchain Technology: Blockchain ensures transparency and traceability in sourcing materials and managing CDW collection and distribution chains (Sharma et al., 2022; Swarnakar and Khalfan, 2024a).
Vision-based Robotic Systems: These systems automate sorting and segregation of C&D wastes, improving efficiency and reducing time in waste management processes (Sharma et al., 2022).
Digital Twin: Digital Twin technology simulates design and operational processes, enabling better decision-making and efficient resource use (Illankoon and Vithanage, 2023).
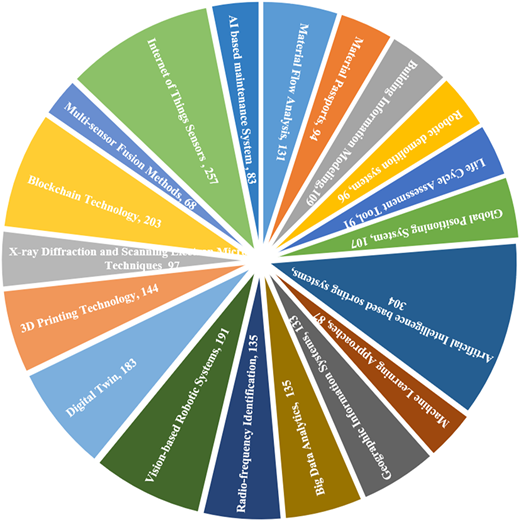
I4.0 technologies across all stages of PPCUPDCM framework. Source: Created by the authors
I4.0 technologies across all stages of PPCUPDCM framework. Source: Created by the authors
Integrating these technologies effectively across the PPCUPDCM framework will significantly advance CE implementation in the CDWM sector, promoting environmental sustainability and economic efficiency.
5. Implications
5.1 Theoretical implications
This study makes significant theoretical contributions by providing insights into the implementation of CE in C&D organizations, an area that has received limited empirical attention in existing literature. It identifies critical success factors, failure factors, benefits, and technologies influencing CE adoption in C&D environments, thereby enhancing the theoretical understanding of this field. The first key theoretical contribution is the identification of “developing markets for circular materials and products” as the most impactful success factor. This finding underscores the importance of establishing robust markets for circular products and materials to extend their lifecycle, conserve natural resources, and promote sustainability in construction activities. Secondly, the study identifies “a limited market for secondary or recycled materials” as the most significant failure factor hindering CE adoption in C&D organizations. This highlights the urgent need for investment in creating accessible markets for secondary or recycled materials, enabling wider adoption of circular practices and reducing reliance on virgin materials. The third contribution lies in the comprehensive identification of CE implementation benefits, including natural resource conservation, reduction of GHG emissions, improved public health and social well-being, promotion of renewable and recycled materials, and compliance with environmental regulations. These insights provide a strong foundation for organizational decision-makers to recognize the advantages of CE adoption. The fourth theoretical contribution is the prioritization of tools and technologies critical to CE adoption. The study identifies LCA, BIM, and MFA as top-priority tools, while Machine Learning, GIS, and GPS are highlighted as high-priority enablers. This finding assists organizations in selecting the most effective tools and technologies to optimize CE implementation without unnecessary resource expenditure. Lastly, the study proposes a structured eight-stage PPCUPDCM framework for CE implementation, integrating Industry 4.0 technologies at each stage. This framework emphasizes efficient waste management, resource optimization, and alignment with SDGs, thereby promoting circularity in C&D organizations.
5.2 Managerial implications
The findings of this study provide actionable guidance for managers in the C&D sector seeking to adopt CE practices effectively. Managers can leverage the identified success factors to establish the foundational requirements for CE adoption while proactively addressing failure factors to mitigate potential risks. By understanding the benefits of CE implementation, such as resource conservation, GHG emissions reduction, and regulatory compliance, managers can present a compelling case for CE adoption to stakeholders. Additionally, knowledge of prioritized tools and technologies enables managers to allocate resources efficiently and adopt solutions with the greatest impact on waste management and circular practices. The study also offers a practical roadmap by outlining the role of Industry 4.0 technologies at different stages of the PPCUPDCM framework. Managers can strategically integrate these technologies, such as BIM in the preconstruction stage, IoT and machine learning for real-time monitoring during construction and demolition, and blockchain for material traceability in the material circularity stage. Furthermore, the findings emphasize the need for market development for circular products and materials. Managers can advocate for the creation of dedicated marketplaces to facilitate the sale of recycled and circular products, providing cost-effective, high-quality alternatives for customers. This step is critical for initiating and sustaining CE adoption in the C&D sector. To overcome failure factors, managers should focus on enhancing the quality and availability of recycled materials to build trust and drive demand for secondary products. By effectively addressing both success and failure factors, managers can unlock the full potential of CE, leading to substantial benefits such as resource savings, environmental protection, and improved public health outcomes. Finally, a strategic approach to integrating I4.0 technologies is crucial to ensuring their effective implementation across various stages of the CE framework. By leveraging insights from this study, managers can transform C&D organizations into sustainable and efficient operations, fostering innovation and aligning with global sustainability goals.
6. Conclusion, limitations, and future research directions
This empirical research highlights the critical factors influencing the successful implementation of CE in C&D organizations for effective waste management. Key elements, including success factors, failure factors, associated benefits, and the tools and technologies driving CE adoption, were gathered from CE professionals globally through a pilot survey approach and analyzed using various statistical techniques. The study identifies “Developing markets for circular materials and products,” “Encouraging customers to use recycled materials and products,” and “Establishing a system for the procurement of circular materials and products” as the top three key success factors. Conversely, “Limited market for secondary or recycled products and materials,” “Reluctance to use recycled products due to perceived quality concerns,” and “Complexity in handling and managing CDW materials” emerge as the top three major challenge or failure factors. The findings underscore the potential benefits of CE implementation, such as conserving natural resources, minimizing GHG emissions, reducing fossil fuel use and other pollutants, improving public health and social well-being, promoting renewable and recycled materials, and ensuring compliance with relevant regulations and policies. Moreover, this research emphasizes the transformative role of I4.0 technologies, particularly Artificial Intelligence-based sorting systems, IoT sensors, Blockchain Technology, Vision-based Robotic Systems, and Digital Twin applications, across different stages of the PPCUPDCM framework for effective C&D waste management. These insights provide valuable guidance for organizations looking to adopt CE practices, enhance sustainability, gain a competitive edge, and contribute to achieving SDGs.
Despite its contributions, this study has certain limitations, particularly regarding sample size. As CE remains an emerging concept in the C&D sector (Swarnakar and Khalfan, 2024a, b), collecting a larger sample size posed challenges. However, significant efforts were made to increase the sample size by actively engaging with respondents. Future research should address this limitation by examining CE implementation in C&D organizations from a country-specific perspective, enabling deeper regional insights. Additionally, future studies could benefit from longitudinal case studies to assess variations in CE adoption factors, challenges, benefits, and technologies across different organizational contexts and time frames. Further investigation is also needed into the integration of economic, technical, organizational, regulatory, and cultural factors within CE adoption processes to better understand their collective impact. Moreover, future research could explore the influence of I4.0 technologies on organizational performance, particularly their economic, technical, regulatory, and cultural dimensions, through empirical research. Understanding how these technologies drive CE adoption and enhance organizational performance could provide valuable insights for both practitioners and policymakers in the C&D sector.
Funding: This publication is based upon work supported by Khalifa University of Science and Technology, Abu Dhabi, United Arab Emirates under Award No. FSU-2023-007.
References
The supplementary material for this article can be found online.
