


Despite the significant benefits of passive retrofitting, various dimensions of awareness, critical success factors (CSFs) and barriers have been examined in isolation by past studies. In this study, however, a relationship is drawn amongst the different dimensions of these variables to promote a successful implementation of passive retrofitting of residential buildings in Lagos, Nigeria.
A total of 118 property managers and 163 homeowners were surveyed in Lagos State. The direct, mediating and moderating relationships between the variables were analysed using partial least squares structural equation modelling (PLS-SEM), while the configurational pathways to successful implementation were identified in both groups of stakeholders using fuzzy-set qualitative comparative analysis (fsQCA).
The positive association of the perceived importance of passive measures (PIPM) with both resource management and communication (RMAC: β = 0.600, p < 0.001) and project planning and risk management (PPRM: β = 0.355, p < 0.001) can be highlighted. An increased understanding of retrofit benefits was positively associated with financial support and stakeholder engagement (FSSE: β = 0.464, p < 0.001). Also, awareness of retrofit policies was found to be positively associated with PPRM (β = 0.355, p < 0.001) and regulatory compliance and expert involvement (RCEI: β = 0.311, p < 0.001). Amongst all the implementation enabling factors, only RMAC had a weak positive relationship (β = 0.351, p < 0.054). Conversely, for homeowners, PIPM was positively associated with professional expertise and knowledge management (β = 0.328, p < 0.001), PPRM (β = 0.349, p < 0.001) and RMAC (β = 0.377, p < 0.001). Awareness of retrofit benefits (ARB) was positively associated with FSSE (β = 0.277, p < 0.001) and PPRM (β = 0.239, p < 0.016). Furthermore, PPRM (β = 0.382, p < 0.001) and RCEI (β = 0.315, p = 0.005) were positively associated with retrofit implementation intention. The fsQCA results revealed 16 configurational pathways for managers and eight for homeowners. For managers, the minimal presence of institutional/awareness and technical/planning barriers (∼iac, ∼tpc) could be offset by other facilitating conditions. For homeowners, ARB was consistently present in all configurations; PPRM and RCEI were present in most pathways, meaning they compensate for the absence of financial support/stakeholder engagement and RMAC in several pathways.
Property managers need to improve on the management of resources and communication rather than finding solutions solely in financial instruments. Homeowners can be motivated to retrofit their buildings if financial incentives are guaranteed, professional advice is provided and community-based approaches are used, since mere awareness does not guarantee that action will be taken.
To the best of the authors’ knowledge, this research is the first empirical attempt to integrate retrofit benefits, policy awareness, perceived importance of measures, CSFs and barriers into a single framework using a two-stakeholder approach in Sub-Saharan Africa, showing that the success of retrofit implementation is not only additive but also configurational.
1. Introduction
Reducing carbon emissions is at the heart of the national objectives of all countries that have ratified the Paris Agreement, which targets a 45% reduction in global carbon emissions by 2030 (Clark, 2026). Buildings alone account for more than 32% of the world's energy use, and 34% of total carbon emissions (United Nations Environment Programme [UNEP], 2025). Many buildings existing today are largely energy inefficient, and it is expected that this situation will persist beyond the target net-zero year 2050. Despite the urgency of climate action, particularly in developing countries, progress towards decarbonising buildings is slow (Trenga, 2024). Given that carbon emissions are a global concern and in order for the world to meet net-zero targets, there is a need for drastic measures to be put in place, as insufficient action in some countries can offset emission reductions achieved in others.
Most of the existing buildings will still be in use by the year 2050. Replacing them with new net-zero buildings seems difficult, as it may take approximately 65 years for investments in the building sector to make up for losses arising from wasted energy (US Environmental Protection Agency, 2026). Therefore, retrofitting them is widely recognised as a suitable way to fill the sustainable development gap. Retrofit measures can be active and/or passive (Galvin and Sunikka-Blank, 2013; Yang et al., 2025). While the former involves the use of mechanical cooling systems, the latter improves thermal comfort without relying on mechanical appliances or technologies (Weerasinghe et al., 2024). A case is often made for passive measures in developing countries, including Nigeria, given the affordability challenges associated with active retrofit measures (Xiaoxiang et al., 2024).
Past related studies have focused on awareness and relationships between benefits (Adegoke et al., 2023a; Sánchez et al., 2023; Weerasinghe et al., 2025), policies (Galvin and Sunikka-Blank, 2013; Oke et al., 2025), measures (Weerasinghe et al., 2024; Ye et al., 2021), as well as critical success factors (CSFs) (Achtnicht and Madlener, 2014; Adegoke et al., 2024; Alfaiz et al., 2021; Hatvani-Kovacs et al., 2015), and barriers (Adegoke et al., 2023b, 2026a, c; Hatvani-Kovacs et al., 2015; Liao et al., 2025; Weerasinghe et al., 2024), without integrating them into a unified empirical model, especially in the context of rapidly growing cities in developing countries. Furthermore, linear models used by most studies assume an additive influence of predictors on the outcome variable (e.g. Walter and Sohn, 2016; Weerasinghe et al., 2025). In addition, most of the existing studies are from Europe, Asia, Australia and a few African countries. This pattern leaves a considerable geographic gap in passive retrofit knowledge.
In Nigeria, stakeholders still lack full awareness of the diverse passive measures and their benefits (Adegoke et al., 2025). Specifically, the rapid population growth, informal housing sector, weak regulations, poor infrastructure, low public awareness, fragmented supply chains/value chains and affordability concerns in Lagos make it a suitable setting for this study (Ugbodaga, 2024). The city possesses peculiar characteristics that could limit the application of research findings from other countries. More specifically, the Lagos State Building Control Agency (LASBCA)'s identification of building energy efficiency as a key issue for Lagos State does not have implementation strategies in place to facilitate building retrofitting across the state and country (LASBCA, 2021). Despite these specificities, there remains a dearth of empirical studies that investigate the relationship between awareness, CSFs and barriers to the uptake of passive retrofitting in Lagos or in other cities with similar characteristics. It is crucial to close this gap in order to avoid hindering the achievement of Sustainable Development Goals (SDG11 – Sustainable Cities and Communities) and SDG 13 (Climate Action). This study addresses the research problem by adopting the Awareness-Motivation-Capability (AMC) framework (Chen, 1996) combined with institutional theory (Scott, 2014). To understand the problem, this study carried out a dual-stakeholder analysis from the perspectives of property managers (hereafter referred to as managers) and homeowners.
The novelty of this study does not rest on the use of partial least squares structural equation modelling (PLS-SEM) and fuzzy-set qualitative comparative analysis (fsQCA). Rather, it lies in integrating three interconnected variables: awareness, CSF and barrier variables into a single empirical model rather than examining them in isolation, as is common in prior studies. These relationships between the variables are formulated into 18 hypotheses and organised around 3 conceptual relationships: awareness as a driver of operational capabilities, capabilities as enablers of implementation and barriers as moderators of the capability-implementation relationship.
2. Theoretical framework and research hypotheses
Retrofitting has a connection to a broader category of factors. These factors have been studied separately by past studies, but this study presents a combination of the AMC framework with institutional theory to provide a conceptual understanding of passive retrofit implementation. The AMC framework explains how awareness, motivation and capabilities translate into implementation. However, institutional theory further helps to understand external factors in the relationships. The sections below are organised around these three connected mechanisms rather than treated as separate topics.
2.1 Awareness drives CSF development
2.1.1 Perceived importance of passive measures (PIPM)
Awareness is considered a key construct under the AMC framework (Chen, 1996) and is defined as a conscious recognition of the significance of a phenomenon within a specific context. For passive measures, awareness is operationalised as perceived importance in this study. Doing so ensures that stakeholder awareness and how they prioritise the measures in the context of Lagos are properly captured. This operationalisation aligns with Rogers' (2003) diffusion of innovation (DOI) theory, which suggests that the adoption of innovations is related to key attributes such as relative advantage, compatibility and complexity.
The literature shows that practitioners may already be aware of passive measures, but how they perceive their importance is critical to providing useful advice to their clients (Anand et al., 2023). According to Simpson et al. (2021), knowledge sharing is one of the most efficient strategies for building capabilities in this area. The inability of practitioners to understand the importance of passive measures creates uncertainty, especially during the early stage (Zong et al., 2024). In the Nigerian context, to advise clients appropriately on the use of suitable passive measures, managers need to understand the requirements by collaborating with experts in building retrofitting (Adegoke et al., 2023a). This helps to improve their understanding of the importance of passive measures in different contexts. As a consequence, the passive measures recognised as important by the practitioners can be integrated into knowledge management. Based on this discussion, the following hypothesis is proposed:
“Perceived importance of passive measures” positively associated with “professional expertise and knowledge management”.
The PIPM plays a crucial role in retrofit project planning. As Mlecnik (2010) noted, stakeholders unaware of passive measures often struggle to establish essential planning steps. Comprehending the possible risks of moisture, for example, would help prevent failures in the insulation of building components (Gori et al., 2021). While advanced software may be available, only practitioners who assign high importance to passive measures are likely to invest the effort required to learn and apply such tools effectively (Menconi et al., 2025). Understanding passive strategies is a prerequisite for proper planning and effective management of risks. This perspective leads to the formulation of the following hypothesis.
“Perceived importance of passive measures” positively associated with “project planning and risk management”.
Regarding resource management, stakeholders often feel that passive measures are essential low-cost approaches that can help to reduce reliance on expensive mechanical devices (Adegoke et al., 2025). They draw on different sources of information to deploy these measures effectively. A lack of information may be detrimental to retrofit adoption because of the need to create trust before any action is taken (Bobrova et al., 2021). In the words of Tozer et al. (2023), building trust amongst stakeholders is a function of relevance and importance. This suggests that practitioners who find passive designs important will be more willing to build up the necessary communication processes to sustain their ability to manage resources. Based on the AMC framework, PIPM can be seen as a cognitive precondition for resource management and how information is communicated. Drawing on this discussion, the following hypothesis is proposed:
“Perceived importance of passive measures” positively associated with “resource management and communication”.
In sum, the AMC framework shows that Hypotheses 1–3 collectively demonstrate that PIPM can lead to the formation of capability through simultaneous professional expertise and knowledge management (PEKM), project planning and risk management (PPRM) and resource management and communication (RMAC). It becomes apparent that what practitioners know about passive measures is not all that counts; rather, their perceived importance of such measures is what can initiate the development of capability.
2.1.2 Awareness of retrofit benefits (ARB)
According to Adegoke et al. (2025), stakeholders who are aware of retrofit benefits are more likely allocate money to it. In other words, stakeholders can be motivated by benefits from retrofits. This is also shown by Rogers (2003), in the definition of relative advantage as a key determinant of innovation adoption. However, while Rogers' DOI theory explains adoption at the level of an innovation's spread through a population, the AMC framework gives relevance to how motivation can cause stakeholders to seek financial assistance and engagement.
Retrofit benefits can be looked at from economic, environmental and social perspectives (Adegoke et al., 2025; Weerasinghe et al., 2025). Without proper awareness, especially in poor families, costs can be considered the most significant concern, while other factors remain invisible (Pillai et al., 2021). Poorisat et al. (2026) noted that cooperation, communication and the alignment of objectives of various stakeholders contribute to successful sustainable practices in construction, and this requires higher awareness amongst stakeholders. This was shown in a Croatian study by Ceric and Ivic (2021), where educating homeowners was found to improve communication and cooperation in multi-house projects. All of these reflect the association between benefit awareness and financing and stakeholder engagement. For example, when stakeholders are aware of the potential cost savings from retrofitting, they are more likely to see it as a worthwhile investment (Adegoke et al., 2025; Yang et al., 2023). Based on this discussion, the following hypothesis is developed:
“Awareness of retrofit benefits” positively associated with “financial support and stakeholder engagement”.
Benefit awareness within the AMC framework is associated with knowledge acquisition: recognising the gains that can be achieved through retrofitting is linked to stakeholders' motivation to learn about the required expertise (Chen, 1996). However, merely having awareness is not sufficient; education needs to follow to drive home the importance of gaining expertise (Janda et al., 2014). Expertise is developed when awareness is combined with proper education (Simpson et al., 2020). According to Simpson et al. (2020), professionals known as “middle actors” play an important role in connecting policy with practice, and education provides the knowledge and skills needed to support this process. Therefore, there is a need to promote structured education so that the awareness of retrofit benefits can be translated into actual expertise and knowledge management (see Adegoke et al., 2025). With this view in mind, the following hypothesis was formulated.
“Awareness of retrofit benefits” positively associated with “professional expertise and knowledge management”.
In line with the AMC framework, stakeholders who are aware of the benefits of retrofitting are more likely to engage in cost-benefit and risk analyses. In other words, ARB shapes strategic project planning, as stakeholders' strategies are determined by their evaluation of costs, benefits and risks (Yang et al., 2023). One method of conducting such assessments is life cycle cost assessment, which, according to Altaf et al. (2022), may serve as a useful means of assessing the cost-benefit ratio of retrofitting. The same is the case with risk perception, which can lead stakeholders to undertake risk management measures for the energy-efficient retrofitting of residential buildings (Jia et al., 2020). Based on this discussion, the following research hypothesis was proposed.
“Awareness of retrofit benefits” positively associated with “project planning and risk management”.
Becoming aware of retrofit benefits ensures that there is better coordination between all stakeholders involved. The benefits should be promoted through an improved, targeted awareness campaign, utilising the managers as intermediaries to facilitate better collaboration and communication amongst other stakeholders involved in retrofit implementation (Adegoke et al., 2025). As Gillich et al. (2018) argued, the creation of awareness is a vital factor for promoting retrofit actions, and community-based social marketing is effective for engaging the community and supporting the effective deployment of resources, including the workforce. Thus, benefit awareness can also enable RMAC by creating a shared understanding of retrofit value and motivating the development of collaborative structures. Therefore, we propose the following hypothesis:
“Awareness of retrofit benefits” positively associated with “resource management and communication”.
All the hypotheses highlighted above, i.e. 4–7, show that awareness is associated with motivational response. It converts perceived importance into resource management and stakeholder engagement actions, but not into technical capability. Without technical capacity, motivation could result in intention rather than action. Therefore, benefit awareness needs to be combined with capabilities.
2.1.3 Awareness of retrofit policies (ARP)
From a cultural-cognitive perspective, ARP provides the schema through which managers interpret institutional expectations and operate within the building environment. In Sub-Saharan contexts specifically, Oke et al. (2025) have shown that knowledge about green policies amongst construction professionals in Nigeria is still poor. This suggests that, despite the universal recognition of the significance of green technology, limited policy awareness may limit actual capability.
Once managers are able to realise the necessity of policy implementation regarding green retrofits, compliance ceases to become optional and instead becomes a necessity, compelling them to incorporate policy requirements into their practices to safeguard legitimacy and relevance in the property market (see Scott, 2014). As Zhang et al. (2021) noted, retrofit policies provide essential guidance related to the requirements for assessment and support, as well as resources. Stakeholder interests and collaborations may also be shaped by anticipated regulatory or financial gains. Awareness of policies does more than ensure proper procedures; it also contributes to learning and cooperation between various sectors at all levels of project implementation (Yang et al., 2023).
Moreover, knowledge of relevant policies helps identify possible risks associated with a project. According to Huo et al. (2023), stakeholders' awareness of regulations in relation to old residential areas is an important factor influencing risk identification and mitigation plans. The study used a risk evaluation model established using Combined Ordered Weighted Averaging and grey clustering, and feedback from stakeholders on the degree of probability and importance of risks was collected. The studies provide insights into the need to identify possible risks and control them based on specific plans and policy guideline. This goes on to demonstrate the important role of policy awareness in retrofit projects. Therefore, we hypothesised that:
“Awareness of retrofit policies” positively associated with “project planning and risk management”.
Awareness of retrofit policy indicates the regulations and the normative pressures in the retrofit context. In other words, these are the legal aspects as well as the cultural or professional norms that impact practice. When people are highly aware of existing policies, it becomes easy to formalise retrofit process by seeking the help of professionals to achieve both compliance and legitimacy (see Scott, 2014).
Retrofit policies also help stakeholders acquire technical knowledge and recognise advantages through clear guidance, information and incentives (Zhang et al., 2021). The dissemination of effective policy information can further promote cooperation amongst actors involved in retrofit projects (Liu et al., 2022). On the contrary, according to Fylan and Glew (2021), a lack of awareness regarding policy standards on the part of the installer leads to scepticism and reluctance to comply. Thus, policy awareness acts as a tipping point: low levels of awareness result in a reactive response, while high awareness allows stakeholders to engage in proactive compliance. This supports the following hypothesis:
“Awareness of retrofit policies” positively associated with “regulatory compliance and expert involvement”.
Awareness of retrofit policy operates in a normative manner, leading to institutional compliance without the need for mere allocation of resources (Scott, 2014). All three awareness constructs defined in Hypotheses 1–9 reflect different aspects of the AMC framework: the aspect of perceived importance of measures could enhance capability, benefit awareness could facilitate resource mobilisation, while policy awareness could lead to stakeholder alignment with institutional demands. None of these three awareness-to-capability pathways, on their own, explains why awareness sometimes stalls before it reaches implementation. That gap is what institutional theory addresses in the next section.
2.2 Capabilities enable retrofit implementation
Capability is the wider construct postulated in the AMC framework, while the CSFs are used to measure that capability. The two constructs are not the same, with capability being the construct, and CSFs are the observable, measurable indicators through which underlying capability and regulations are expressed. They include planning behaviour, resource coordination, professional expertise, and so on. The AMC framework explains how the relationship between five capabilities are drawn to retrofit implementation; institutional theory, on the other hand, explains why some of these capabilities can translate into actual implementation once built, since capability still has to be recognised as legitimate by the surrounding regulatory and normative environment before stakeholders act on it (Scott, 2014).
Financial support is usually seen as a CSF as well as a challenge, especially amongst homeowners (Adegoke et al., 2026a; Amoah and Smith, 2024). In simpler terms, finance acts as an incentive for homeowners to make an initial decision to invest. However, finance is not everything; it needs to be supplemented with stakeholder involvement, thereby highlighting the importance of the normative and cultural acceptability of retrofit projects. Social relations should never be overlooked, as even adequately financed projects can sometimes fail (Gillich et al., 2018). This complexity is especially more pronounced in developing countries, where affordable funding sources are scarce (Alajmi, 2012) and property owners are often concerned about immediate costs rather than long-term savings (Gillingham and Palmer, 2014). This pattern is consistent with behavioural economics, particularly present bias and loss aversion (Kahneman and Tversky, 1979), whereby the immediate, certain cost of retrofit work outweighs a larger but delayed benefit, even when the financial case favours retrofitting. However, this study does not model these cognitive biases directly but rather captures their effects through contextual stakeholder engagement in a resource-constrained economy. By treating financial support and stakeholder engagement (FSSE) as mutually reinforcing rather than independent, this study extends both the AMC framework and institutional theory by proposing the following hypothesis:
“Financial support and stakeholder engagement” positively associated with retrofit implementation.
Within the AMC framework, professional expertise represents the capability component most directly linked to technical readiness; without professional expertise, awareness and motivation cannot be converted into successful retrofit outcomes, even when the requisite resources are available.. Professional expertise is central because the quality of retrofits depends on the proficiency of builders and other relevant professionals. As Killip (2013) pointed out, renovation challenges are attributed to insufficient knowledge and skill, inadequate definition of roles, and communication challenges between the design and construction stages; thus, there is a need to improve the proficiency of builders in achieving successful low-carbon retrofits. Killip et al. (2014) further suggested that there is a need to increase the technical capabilities and knowledge of builders to ensure quality retrofits.
Mlecnik et al. (2010) found that participation in demonstration projects deepens stakeholder understanding of the retrofit process. This is why learning and quality assurance are seen as key factors in transferring best practices as well as promoting innovation amongst retrofit stakeholders. In trun, these processes are essential for the knowledge management in retrofit projects. Based on the foregoing, the following hypothesis is proposed:
“Professional expertise and knowledge management” positively associated with retrofit implementation.
Effective retrofitting requires careful planning with a definition of scope, sequencing of tasks, schedule and coordination at all levels of project delivery (Abbà et al., 2024; Topouzi et al., 2019). Hulathdoowage et al. (2026) mentioned that it is through timing and sequencing that the sustainability results are ultimately achieved. With regard to capability, the capacity to coordinate these processes becomes a relevant measure of investors' capability (Coulentianos et al., 2024). Coordination of activities is required to prevent potential disruptions resulting from fragmented execution of processes (Gori et al., 2021). From an institutional theory perspective, structured planning signals organisational legitimacy, demonstrating to regulators, funders and clients that the retrofit process is being managed to recognised standards (Scott, 2014).
While proper planning is put in place, risk management procedure, which includes disruption identification, probability and impact assessment, and response and mitigation strategies, must be fully integrated with the overall retrofit process (Gori et al., 2021). The framework for risk management in building retrofitting involves the identification, analysis and mitigation of risks to ensure effective implementation amid various uncertainties. Based on the foregoing discussion, the following hypothesis is proposed:
“Project planning and risk management” positively associated with retrofit implementation.
Regulatory compliance and expert involvement (RCEI) are important considerations for retrofit investors. These capabilities ensure that retrofit companies put into place the appropriate routines needed to meet institutional requirements. Based on institutional theory, analysis of policies shows how regulative pressure acts on the process. Integrated codes and standards, as well as verification processes required under approval regimes, could determine what is expected to be done by institutions and the way things should be done (Ürge-Vorsatz et al., 2012). The normative institutional expectations created as a result, using networks of experts, play an important role in the coordination and sustainability of high-performance standards throughout the retrofit process (see Scott, 2014). In residential properties, improved Energy Performance Certificates lead to positive price premiums, indicating that the market recognises the value of institutional compliance (Fuerst et al., 2015). This legal compliance could further build legitimacy and improve access to incentives from an institutional theory perspective. Taken together, this points towards the formulation of the following hypothesis:
“Regulatory compliance and expert involvement” positively associated with retrofit implementation.
The management of resources is central to how retrofit implementation is conceptualised. Brocklehurst et al. (2021) asserted that scheduling and coordination amongst different trades form key elements in the success of a retrofit. Availability of skilled labour and materials on time is equally important. Coordination skills develop through the establishment of certain procedures and sequences. This process allows cooperation across organisational boundaries and increases the chances of successful retrofitting. In addition, effective communication about retrofit options could improve decision-making by stakeholders (Ahmed et al., 2025).
The disruption angle further reinforces this argument from another point of view. Chiu et al. (2014) found that proper communication reduces the disruption and inconvenience occupants experience. This, in turn, keeps them engaged throughout the retrofit process. According to Tozer et al. (2023), stakeholder engagement and the provision of appropriate information contribute to building trust and confidence, as well as increasing interest in retrofits. This phenomenon is especially relevant in Lagos due to its fragmented and informal supply chains, which make the role of RMAC indispensable for successful retrofit projects. This observation is consistent with sociotechnical transition theory, which suggests that niche innovations often struggle to scale up due to a lack of an institutional framework (Geels, 2002). Drawing on this, the following hypothesis was proposed:
“Resource management and communication” positively associated with retrofit implementation.
Taken together, Hypotheses 10–14 provide an understanding of the capability dimension of the AMC framework, providing a means of translating awareness-driven motivation into practical implementation. However, the effectiveness of these CSF is shaped by the institutional and contextual environment in which they operate. While several of the capabilities described here reflect significant behavioural and institutional influences, the influence of retrofit barriers also warrant consideration, as discussed in the next section.
2.3 Barriers to retrofit implementation
In this study, barriers are modelled based on their relevance to the roles of stakeholder groups. Information and communication (IAC) and technical and professional capacity (TPC) disrupt the operational side of capability for managers, while compliance and implementation (CAI) and financial and policy (FAP) disrupt its institutional legitimacy and resource conditions that shape retrofit decision-making and implementation by homeowners. Research consistently reveals that the success of retrofit implementation could be affected by IAC barriers. Effective communication amongst landlords and residents, as well as project teams, not only affects acceptance of retrofitting technologies but also shapes the effectiveness of those technologies themselves. Brown et al. (2014) observed that difficulties in helping residents adapt to new energy consumption patterns can create confusion about the use of the technology, as well as a mismatch between intended and actual behaviours.
Within the AMC framework, IAC barriers are associated with poor management of resources, which is further linked to implementation action (see Chen, 1996). Barriers related to IAC were the most significant, with particular emphasis on the misinterpretation of terminologies amongst stakeholders in Lagos, Nigeria (Adegoke et al., 2026a). The lack of effective communication can result in the gradual disintegration of supply chain capacity. This often arises from fragmentation and a mismatch between industry culture and collaboration within the retrofit process (Brocklehurst et al., 2021). IAC barriers can also limit organisational capacity in several interconnected ways: tenants may be slower to come on board, and their behaviour may not align with retrofit requirements, thereby inhibiting supply chain and professional collaboration. Ineffective communication, therefore, becomes a critical determinant of both organisational capacity and overall retrofit effectiveness. From this discussion, the following hypothesis was formulated:
“Information and communication” negatively moderates the positive association between “resource management and communication” and retrofit implementation.
From the perspective of the AMC framework (Chen, 1996), TPC refers to the resources, technical competence and infrastructure a firm has, along with its ability to put them to effective use. Adegoke et al. (2026a) found that investors lack the required technical expertise and collaborative capacity needed to deliver these upgrades, and often need to seek professional guidance. However, retrofitting is faced with shortage of professionals, knowledge gaps, uneven training and limited access to skilled trades. This problems are not limited to Sub-Saharan Africa. For context, it has been observed in the UK retrofit industry, where retrofitting is characterised by fragmented supply chain, weak quality oversight and poor coordination between trades (Brocklehurst et al., 2021; Fathalizadeh et al., 2022; Killip, 2013).
TPC barriers can be linked to the pathway from PEKM to retrofit implementation. Strong technical capabilities and effective coordination, as well as robust quality assurance are expected to to serve as a function of retrofit implementation. Based on this discussion, the following hypothesis was proposed..
“Technical and professional capacity” negatively moderates the positive association between “professional expertise and knowledge management” and retrofit implementation.
CAI barriers are often rooted in bureaucracy and fragmented permitting systems, as well as regulatory constraints that do not quite fit together. Regulation is a major barrier in green retrofitting, as installers may lack confidence in available standards or consider them unrealistic (Amoah and Smith, 2024; Fylan and Glew, 2021). Fathalizadeh et al. (2022) also pointed to a lack of systematic effort towards sustainability. These barriers also include fragmented governance support and organisational capacity issues, especially for social housing (Charles, 2025). From an institutional theory perspective, weak or inconsistent compliance standards could undermine the legitimacy mechanisms through which RCEI enables implementation, thereby reducing the effectiveness of compliance efforts (Scott, 2014). The following hypothesis is proposed:
“Compliance and implementation” negatively moderates the positive association between “regulatory compliance and expert involvement” and retrofit implementation.
Finance is an important factor central to interest and participation in the retrofitting process. As the AMC framework shows, finance has the potential to increase the willingness to invest by minimising risks and optimising the potential for gains (Achtnicht and Madlener, 2014). However, these dynamics can be affected by other related factors. For example, Gillich et al. (2018) argued that finance's complexity may prevent participation despite the provision of incentives. In addition, the lack of financial mechanisms, such as green mortgages, can limit access to finance (Alajmi, 2012; Beavor et al., 2023).
The availability of supportive policies is another important factor in the process of retrofitting a building. From the institutional theory perspective, a stable and consistent policy environment is critical for sustaining stakeholder engagement (Charles, 2025). Misalignment between funding and policy can be associated with weaker shared social understanding and organisational commitment, both of which are essential for engagement. FAP barriers weaken the cooperation of building owners, occupants and relevant stakeholders (Yik and Lee, 2004). While finance is an important motivator for engagement in retrofitting, its motivating effect is likely to weaken when policy and financing arrangements become unreliable. This discussion supports the following hypothesis:
“Financial and policy” negatively moderates the positive association between “financial support and stakeholder engagement” and retrofit implementation.
In summary, Hypotheses 15–18 consider barriers as moderating factors in the positive associations between CSFs and retrofit implementation. Overall, these associations have not been examined within an integrative framework, especially in developing regions such as Sub-Saharan Africa. In the past, most research was conducted in advanced economies while overlooking the perspectives of the managers and homeowners. To address this research gap, the present study adopts a two-stakeholder perspective and examines these variables in a unified empirical framework for Lagos through Hypotheses 1–18.
2.4 Conceptual framework
Figure 1 presents the integration of these theoretical relationships into a single conceptual framework. Awareness dimensions are associated with CSFs, which in turn affect the retrofit implementation. While the two groups are subject to different constraints in practice, barriers are expected to influence specific CSF → retrofit implementation relationships differently. The framework recognises the direct pathways and mediated pathways (awareness → CSFs → retrofit implementation). The awareness dimensions, CSFs and barriers were selected because they frequently appear in the existing retrofit literature. Each of these corresponds to specific constructs operationalised based on the AMC framework and institutional theory while remaining grounded in the context of Lagos. For example, RCEI was operationalised in direct connection to Lagos State Physical Planning Permit Authority (LASPPPA) and LASBCA requirements. These modifications reflect contextual differences in formality, which are addressed in this study.
 A conceptual framework diagram illustrating the relationships between awareness, critical success factors, barriers, and retrofit implementation. The diagram is divided into four main sections: Awareness, CSFs, Barriers, and Outcome. The Awareness section includes Awareness/Motivation with ARB, Awareness with ARP and PIPM. The CSFs section includes Regulative/normative pressures associated with RCEI, Capability in terms of PPRM, PEKM, FSSE, and RMAC. The Barriers section includes Motivation; regulative/normative pressures; normative/cultural-cognitive perspective with FAP and CAI, and Capability with IAC and TPC. The Outcome section includes IMPL. Arrows indicate the directional relationships between these components, with specific hypotheses labeled as H1 through H18. The diagram shows how awareness dimensions are associated with CSFs, which directly affect retrofit implementation, and how different barriers moderate the relationships between CSFs and IMPL in each case of the stakeholder groups.
Conceptual framework
A conceptual framework diagram illustrating the relationships between awareness, critical success factors, barriers, and retrofit implementation. The diagram is divided into four main sections: Awareness, CSFs, Barriers, and Outcome. The Awareness section includes Awareness/Motivation with ARB, Awareness with ARP and PIPM. The CSFs section includes Regulative/normative pressures associated with RCEI, Capability in terms of PPRM, PEKM, FSSE, and RMAC. The Barriers section includes Motivation; regulative/normative pressures; normative/cultural-cognitive perspective with FAP and CAI, and Capability with IAC and TPC. The Outcome section includes IMPL. Arrows indicate the directional relationships between these components, with specific hypotheses labeled as H1 through H18. The diagram shows how awareness dimensions are associated with CSFs, which directly affect retrofit implementation, and how different barriers moderate the relationships between CSFs and IMPL in each case of the stakeholder groups.Conceptual framework
The idea that awareness, CSFs and barriers can be considered individually by merely summing up items within the same dimension does not hold for this paper. Beyond arguing that awareness can inspire readiness, the conceptual framework presents a complex system that draws relationships between awareness and the capabilities provided by CSFs, as well as the presence of specific barriers that can influence along the pathway to successful retrofit implementation. This conception helps to distinguish this study from existing literature, which considered the variables individually.
3. Research methods
3.1 Research design
This study used a quantitative research approach in the collection and analysis of data, as it enables the measurement of the relationship between variables based on a specified sample, thereby allowing for statistical generalisation of the results (Creswell and Creswell, 2018). Data were collected at a single point in time, which makes the direction of the relationships identified in the structural model associative rather than causal (as shown in H1–H18). Two complementary methods were used to analyse the data collected. PLS-SEM was used to identify direct associations, as well as mediation and moderation effects, while fsQCA identified different equifinal configurations that produce similar retrofit implementation outcomes (Pappas and Woodside, 2021). These two methods were used because of the need to identify which variables matter most on average (PLS-SEM) and which combinations of them are sufficient for implementation in practice (fsQCA).
3.2 Sampling strategy
The target populations were managers and homeowners responsible for residential retrofit decisions in Lagos State, Nigeria. The sample of managers was drawn purposively from the list of members of the Nigerian Institution of Estate Surveyors and Valuers (NIESV). The members' professional credentials were important for ensuring the reliability of the data collected. The NIESV (2023) directory of financial members comprised 857 managers (estate surveyors and valuers) in Lagos State. Of this total, 813 email addresses were available. A census was carried out using all 813 available email addresses to increase response rates. Out of all emails sent, 796 were successfully delivered. After data cleaning, out of 190 questionnaire responses, only 118 (14.8%) were retained for further analysis.
In the selection of homeowners, estate surveying and valuation firms (ESVFs) were used as one of the most practical means because their directory was not available in Lagos State. By contacting the 436 ESVFs listed in the (NIESV, 2024) directory, it was possible to ensure geographic spread in data collection from different property markets and tenure arrangements across the 5 administrative divisions of Lagos State (Ikeja, Lagos Island, Epe, Badagry and Ikorodu). The heterogeneity of homeowners across these divisions was deemed a good approximation of the state-level heterogeneity amongst homeowners. A total of 163 (69.4%) of the 235 returned questionnaires were retained for analysis. However, interpretation of the results obtained from homeowners must remain within the context of those whose residential buildings are managed by professional real estate firms, acknowledging that this may introduce some level of bias against others whose properties are managed informally.
These two sample sizes satisfy the minimum requirements for data analysis and capture the dual decision-making structure underpinning retrofit implementation, that is, the managers and the homeowners. They are also comparable to existing building and real estate research (Adilieme et al., 2025 – 9%; Balogun et al., 2024 – 9.29%). Furthermore, they exceed the minimum suggested by the a priori power analysis conducted using G*Power version 3.1.9.7. With an effect size of f2 = 0.15, a significance level of α = 0.05, and a desired power of 1 − β = 0.8, the results showed that at least 114 participants were sufficient for PLS-SEM analysis (see Figure 2).
 The line graph displays the critical F value of 1.9711. The graph includes two curves: a red curve representing the alpha distribution and a blue dashed curve representing the beta distribution. The x-axis ranges from 0 to 5, and the y-axis ranges from 0 to 0.8. The critical F value is marked by a vertical green line at approximately 1.9711. The red curve peaks around 1 on the x-axis and then declines, while the blue dashed curve rises and falls more gradually. The graph is part of a statistical analysis for linear multiple regression, specifically for a fixed model, R squared deviation from zero. The input parameters include an effect size of 0.15, an alpha error probability of 0.05, a power of 0.8, and 9 predictors. The output parameters include a noncentrality parameter of 17.1000000, a critical F value of 1.9711129, 9 numerator degrees of freedom, 104 denominator degrees of freedom, a total sample size of 114, and an actual power of 0.8043554. All values are approximated.
Derivation of minimum sample size
The line graph displays the critical F value of 1.9711. The graph includes two curves: a red curve representing the alpha distribution and a blue dashed curve representing the beta distribution. The x-axis ranges from 0 to 5, and the y-axis ranges from 0 to 0.8. The critical F value is marked by a vertical green line at approximately 1.9711. The red curve peaks around 1 on the x-axis and then declines, while the blue dashed curve rises and falls more gradually. The graph is part of a statistical analysis for linear multiple regression, specifically for a fixed model, R squared deviation from zero. The input parameters include an effect size of 0.15, an alpha error probability of 0.05, a power of 0.8, and 9 predictors. The output parameters include a noncentrality parameter of 17.1000000, a critical F value of 1.9711129, 9 numerator degrees of freedom, 104 denominator degrees of freedom, a total sample size of 114, and an actual power of 0.8043554. All values are approximated.Derivation of minimum sample size
3.3 Data collection instruments
Data were collected through self-administered online questionnaires distributed via the Qualtrics platform. The questionnaire contained sections designed to collect data on ARB, ARP, PIPM, CSFs, BARs and IMPL. All options were designed based on evidence from the literature, and the respondents were asked to rate them on 5-point Likert scales [1 (strongly unaware) to 5 (strongly aware) for ARB and ARP; 1 (important at all) to 5 (very important) for PIPM; 1 (strongly disagree) to 5 (strongly agree) for CSFs, while the scale used for BARs ranges from 1 (strongly agree) to 5 (strongly disagree)].
The specific constructs measured were as follows:
PIPM assessed respondents' knowledge of 11 different passive retrofit measures (Weerasinghe et al., 2024; Ye et al., 2021).
ARB contained seven environmental benefits (ENV), four economic benefits (ECO) and five social benefits (SOC) (Sánchez et al., 2023; Weerasinghe et al., 2024). ARB was the only higher-order construct in the model and was embedded during the measurement model stage in PLS-SEM analysis.
ARP included four dimensions featuring Building Energy Efficiency Code (BEEC), Building Energy Efficiency Guidelines (BEEG), Excellence in Design for Greater Efficiency (EDGE) and National Climate Change Policy (NCCP) (Beavor et al., 2023).
The 34 CSF items were clustered within five constructs: FSSE, PEKM, PPRM, RCEI and RMAC (Adegoke et al., 2026b; Alfaiz et al., 2021; Hatvani-Kovacs et al., 2015).
Twenty-seven BAR items were also categorised under four constructs: IAC, TPC, CAI and FAP (Adegoke et al., 2026a; Amoah and Smith, 2024; Liao et al., 2025). For the managers, the importance of IAC and TPC was higher, while that of CAI and FAP was higher for homeowners.
The last section of the questionnaire contained statements regarding retrofit implementation: 11 for managers and 9 for homeowners. The statements sought to assess intentions and behaviours across the different spectrums of property management and ownership.
These variables were assigned alphanumeric codes for ease of reference and analysis (see Appendix).
3.4 Data validity and reliability
Most of the items measured were adopted from previously validated scales but grounded in the local context of Lagos. This approach was necessitated by the informal nature of the housing market in Lagos, inconsistent regulations and enforcement, and limited access to retrofit finance. These specificities may cause some constructs to have varying practical meanings compared to those in housing market in developed contexts. For example, questions referencing existing green financing instruments were restated in light of the availability of financial markets that provide access to informal capital and community-based funding mechanisms typically found in the Nigerian context. A similar adaptation was made to items relating to the sufficiency of available financial instruments and resources.
The items included in the research questionnaire were pre-tested for clarity, relevance and appropriateness. The validity of its contents was established by 2 academic researchers and 5 practising estate surveyors and valuers, all with at least 10 years of experience in property management in Lagos State. To ensure the comprehensibility of the questions for participants, these two groups were asked to revise the items and identify any ambiguities in the wording and structure of the questions. Reliability and validity were analysed using the PLS-SEM measurement stage (see Section 4.2). The criteria for testing convergent validity include factor loadings, internal reliability, composite reliability and average variance extracted (AVE). For the convergent validity test, the cut-off values were applied according to the criteria above. The Heterotrait–Monotrait (HTMT) ratio, along with cross-loadings, was tested for discriminant validity. Variables with factor loadings lower than 0.5 were sequentially excluded, provided that the remaining factor structure demonstrated conceptual soundness.
There are limitations in the process used to collect the data. The possibility of social desirability bias arises when analysing self-reported items; however, because the questionnaires were administered anonymously and the variance inflation factor (VIF) values were low (less than 5.0), its effect on the analysis is likely to be minimal. It is also important to note that causal inferences cannot be concluded due to the nature of the cross-sectional study design.
3.5 Data analysis procedures
3.5.1 PLS-SEM analysis
The software used for PLS-SEM analysis was SmartPLS 4.1.1.2, which is suitable for complex models with a moderate sample size and non-normal data (Hair et al., 2021). There are two stages to this approach (Hair et al., 2021). Stage one involves the assessment of the reliability and validity of the measurement model for lower-order constructs. The value of indicator loadings should be higher than 0.5, while Cronbach's alpha and composite reliability should be above 0.7 to ensure internal consistency reliability. At the same time, AVE values should be greater than 0.5 to ensure convergent validity by removing the items with loadings less than 0.5 where necessary. At this stage, the only higher-order construct (ARB) in the model was embedded and estimated. The significance of the structural relationships was assessed in the second stage. The significance of the paths was determined using bias-corrected and accelerated (BCa) bootstrapping with 5,000 subsamples at a 95% confidence interval. Cohen's f2 was used to determine the effect size: 0.02 (small), 0.15 (medium) and 0.35 (large). The model was also used for checking the predictive relevance, using Stone–Geisser Q2 (Q2 > 0 means predictive relevance). In addition, VIF values <5 were used to reduce the possibility of common method bias (CMB) (Kock, 2015). Interaction terms were calculated and evaluated for the moderation effects in terms of incremental R2 value and path significance.
3.5.2 fsQCA
The fsQCA method, described by Ragin (2008), was used to analyse the data. The analysis was conducted using fsQCA 4.1 Software and carried out in five steps.
Step 1: Defining variables. The outcome variable (IMPL) represents retrofit implementation. There are 10 conditions in each case of managers and homeowners, spreading across 3 dimensions of awareness and perception (ARB, ARP and PIPM), 5 CSF dimensions (FSSE, PECM, PPRM, RCEI and RMAC), 2 barrier dimensions for managers (IAC, TPC) and the remaining 2 for homeowners (CAI and FAP) (see Adegoke et al., 2026c).
Step 2: Data calibration. The direct calibration technique was used in assigning fuzzy memberships (values between 0 and 1) to the scores of latent variables obtained from the PLS-SEM. Calibration was done by inserting the membership values using the calibrate function: “calibrate (x, n1, n2, n3)” within the fsQCA Software interface. From the function, “x” refers to each of the 10 variables; n1 is full membership (fuzzy membership value = 1), and n2 represents the crossover membership (fuzzy membership value = 0.5). Lastly, n3 indicates full non-membership (fuzzy membership value = 0). This type of calibration procedure is widely accepted in fsQCA research.
Stage 3: Evaluation of the required conditions. The necessity of the conditions was determined before the truth table analysis. If a condition had a consistency greater than or equal to 0.9, it was considered necessary; that is, there was a high degree of consistency with the occurrence of the outcome (Ragin, 2008). Coverage scores are also included to indicate, in practice, the relevance of any necessary condition found.
Step 4: Create a truth table. There are 1,024 different possible combinations of conditions (i.e. 2ˆ10). Combinations that occurred only once in the data set were excluded from the analysis. A consistency score of 0.85 or above was considered sufficient for a successful outcome (Ragin, 2008).
Step 5: Solution analysis. Intermediate solutions were analysed, as they incorporate only theoretically plausible simplifying assumptions based on directional expectations. Consistency thresholds for sufficient configurations were set at a minimum of 0.8. Solution coverage and consistency were reported to assess the explanatory power of the identified configurations. Any individual pathways with raw coverage of less than 0.2 are retained and reported but classified as peripheral pathways. Although such pathways offers limited explanatory guidance, they remain analytically valid, as they may be the only viable pathways for certain subgroups in heterogeneous populations, enabling further investigation by future research.
The details of the research process framework are shown in Figure 3.
 The flowchart illustrates the research process framework. It begins with an extensive literature review and conceptual framework development, leading to questionnaire design. This is followed by sampling and data collection, which feed into data preparation. Data preparation then leads to analysis of data, including sample characteristics, CMB, and NRB analyses. The analysis results are used in two parallel paths: PLS-SEM involving measurement and structural models, and fsQCA involving data calibration, truth table construction, and the analysis of necessary and sufficient conditions. Both paths converge to produce results, which are then discussed. The final step includes conclusions, limitations, and future research.
Research process framework
The flowchart illustrates the research process framework. It begins with an extensive literature review and conceptual framework development, leading to questionnaire design. This is followed by sampling and data collection, which feed into data preparation. Data preparation then leads to analysis of data, including sample characteristics, CMB, and NRB analyses. The analysis results are used in two parallel paths: PLS-SEM involving measurement and structural models, and fsQCA involving data calibration, truth table construction, and the analysis of necessary and sufficient conditions. Both paths converge to produce results, which are then discussed. The final step includes conclusions, limitations, and future research.Research process framework
4. Results
4.1 Sample characteristics, CMB and NRB
As for the managers, the majority were male, representing 63.6% of the participants, with the remaining participants, 36.4% being female. The majority of the participants had an Higher National Diploma (HND)/bachelor's degree, representing 66.1%. Only 29.6% had a postgraduate degree. The experience of the participants working in property management was mainly high, with 48.3% having 1–5 years of experience and a further 12.7% having over 20 years. The participants' areas of specialisation were mainly involved in property management (84.7%), real estate agency (59.3%) and valuation (58.5%). Most of the participants managed detached houses (83.1%) and semi-detached houses (72.0%).
Most of the homeowners were male (72.4%). The largest percentage of these homeowners had an HND/bachelor's degree, accounting for 30.7%. Furthermore, the majority of the participants owned blocks of flats (33.7%), while most of the residential buildings (29.4%) had been in existence for 11–20 years. Most homeowners (representing 38.0%) shared their buildings with others.
For all constructs, the VIF scores ranged from 1.249 to 3.768 for managers and from 1 to 2.346 for homeowners, all of which were below the 5.0 cut-off threshold (Kock, 2015). This indicates that CMB does not meaningfully inflate the relationships, supporting the validity of the results.
Non-response bias was assessed using the early–late response method. The number of managers whose early and late responses were compared was 59 individuals per category, while for homeowners, the corresponding numbers were 81 and 82, respectively. Regarding the sample of managers, 60.1% of the variables showed no significant differences (p > 0.05), which shows a low likelihood of non-response bias, even though a degree of caution should be exercised when analysing the data. On the other hand, for homeowners, 91.4% of the variables did not show any statistically significant differences (p > 0.05). This suggests that non-response bias is negligible.
4.2 Stage 1 – measurement model assessment
4.2.1 Managers
Three items were omitted from the model because they had low factor loadings. Specifically, PRM2 loaded at 0.485, PRM11 at 0.491 and BAR27 at 0.432. To improve AVE scores of PIPM and ARB (0.489 and 0.476, respectively), only items that showed factor loadings greater than 0.50 were selected. All the retained items had satisfactory reliability values (above 0.7) and validity. The factor loading of each of the retained items was found to be in the range of 0.576–0.903 and AVE ranged from 0.707 to 0.949. Discriminant validity was confirmed through both the Fornell–Larcker criterion and HTMT ratios below 0.90 (Henseler et al., 2015), as shown in Tables 1–3.
Measurement model – managers
| Construct | Code | Factor loading | Cronbach's alpha | rho_A | CR | AVE |
|---|---|---|---|---|---|---|
| ENV | 0.847 | 0.852 | 0.891 | 0.621 | ||
| ENV1 | 0.729 | |||||
| ENV2 | 0.813 | |||||
| ENV3 | 0.843 | |||||
| ENV5 | 0.748 | |||||
| ENV6 | 0.802 | |||||
| ECO | 0.858 | 0.860 | 0.904 | 0.703 | ||
| ECO1 | 0.816 | |||||
| ECO2 | 0.869 | |||||
| ECO3 | 0.805 | |||||
| ECO4 | 0.861 | |||||
| SOC | 0.834 | 0.835 | 0.883 | 0.602 | ||
| SOC1 | 0.733 | |||||
| SOC2 | 0.764 | |||||
| SOC3 | 0.770 | |||||
| SOC4 | 0.780 | |||||
| SOC5 | 0.829 | |||||
| ARP | 0.734 | 0.758 | 0.830 | 0.554 | ||
| BEEC | 0.848 | |||||
| BEEG | 0.764 | |||||
| EDGE | 0.602 | |||||
| NCCP | 0.742 | |||||
| PIPM | 0.866 | 0.876 | 0.896 | 0.520 | ||
| PRM3 | 0.576 | |||||
| PRM4 | 0.767 | |||||
| PRM5 | 0.667 | |||||
| PRM6 | 0.759 | |||||
| PRM7 | 0.794 | |||||
| PRM8 | 0.817 | |||||
| PRM9 | 0.714 | |||||
| PRM10 | 0.643 | |||||
| PPRM | 0.885 | 0.888 | 0.908 | 0.555 | ||
| CSF1 | 0.803 | |||||
| CSF2 | 0.788 | |||||
| CSF3 | 0.795 | |||||
| CSF4 | 0.686 | |||||
| CSF5 | 0.712 | |||||
| CSF6 | 0.708 | |||||
| CSF7 | 0.763 | |||||
| CSF21 | 0.691 | |||||
| PEKM | 0.681 | 0.683 | 0.862 | 0.758 | ||
| CSF10 | 0.879 | |||||
| CSF11 | 0.862 | |||||
| RMAC | 0.870 | 0.871 | 0.906 | 0.658 | ||
| CSF15 | 0.839 | |||||
| CSF16 | 0.794 | |||||
| CSF17 | 0.814 | |||||
| CSF18 | 0.816 | |||||
| CSF19 | 0.793 | |||||
| RCEI | 0.728 | 0.738 | 0.880 | 0.786 | ||
| CSF20 | 0.870 | |||||
| CSF22 | 0.903 | |||||
| FSSE | 0.915 | 0.920 | 0.930 | 0.626 | ||
| CSF25 | 0.798 | |||||
| CSF26 | 0.834 | |||||
| CSF27 | 0.778 | |||||
| CSF28 | 0.801 | |||||
| CSF29 | 0.806 | |||||
| CSF30 | 0.769 | |||||
| CSF32 | 0.804 | |||||
| CSF33 | 0.735 | |||||
| IAC | 0.724 | 0.739 | 0.829 | 0.549 | ||
| BAR1 | 0.710 | |||||
| BAR2 | 0.830 | |||||
| BAR3 | 0.683 | |||||
| BAR4 | 0.731 | |||||
| TPC | 0.791 | 0.794 | 0.856 | 0.542 | ||
| BAR21 | 0.702 | |||||
| BAR22 | 0.740 | |||||
| BAR23 | 0.732 | |||||
| BAR24 | 0.759 | |||||
| BAR26 | 0.749 | |||||
| IMPL | 0.940 | 0.942 | 0.949 | 0.627 | ||
| IMP1 | 0.743 | |||||
| IMP2 | 0.793 | |||||
| IMP3 | 0.767 | |||||
| IMP4 | 0.704 | |||||
| IMP5 | 0.828 | |||||
| IMP6 | 0.813 | |||||
| IMP7 | 0.791 | |||||
| IMP8 | 0.844 | |||||
| IMP9 | 0.817 | |||||
| IMP10 | 0.799 | |||||
| IMP11 | 0.798 |
Fornell–Larcker – managers
| PIPM | ARP | ECO | ENV | FSSE | IAC | IMPL | PEKM | PPRM | RCEI | RMAC | SOC | TPC | |
|---|---|---|---|---|---|---|---|---|---|---|---|---|---|
| PIPM | 0.721 | ||||||||||||
| ARP | 0.443 | 0.744 | |||||||||||
| ECO | 0.545 | 0.382 | 0.838 | ||||||||||
| ENV | 0.418 | 0.45 | 0.71 | 0.788 | |||||||||
| FSSE | 0.623 | 0.371 | 0.458 | 0.229 | 0.791 | ||||||||
| IAC | −0.462 | −0.31 | −0.336 | −0.306 | −0.551 | 0.741 | |||||||
| IMPL | 0.514 | 0.396 | 0.475 | 0.247 | 0.585 | −0.441 | 0.792 | ||||||
| PEKM | 0.354 | 0.241 | 0.264 | 0.236 | 0.368 | −0.393 | 0.366 | 0.871 | |||||
| PPRM | 0.542 | 0.535 | 0.343 | 0.408 | 0.579 | −0.502 | 0.495 | 0.597 | 0.745 | ||||
| RCEI | 0.386 | 0.311 | 0.348 | 0.297 | 0.5 | −0.457 | 0.402 | 0.547 | 0.632 | 0.886 | |||
| RMAC | 0.668 | 0.509 | 0.43 | 0.408 | 0.715 | −0.486 | 0.598 | 0.489 | 0.76 | 0.614 | 0.811 | ||
| SOC | 0.64 | 0.437 | 0.772 | 0.593 | 0.519 | −0.396 | 0.501 | 0.279 | 0.411 | 0.297 | 0.439 | 0.776 | |
| TPC | −0.321 | −0.297 | −0.086 | −0.111 | −0.408 | 0.379 | −0.248 | −0.052 | −0.258 | −0.201 | −0.26 | −0.18 | 0.736 |
HTMT – managers
| PIPM | ARP | ECO | ENV | FSSE | IAC | IMPL | PEKM | PPRM | RCEI | RMAC | SOC | TPC | |
|---|---|---|---|---|---|---|---|---|---|---|---|---|---|
| PIPM | |||||||||||||
| ARP | 0.569 | ||||||||||||
| ECO | 0.627 | 0.517 | |||||||||||
| ENV | 0.485 | 0.57 | 0.825 | ||||||||||
| FSSE | 0.704 | 0.47 | 0.506 | 0.255 | |||||||||
| IAC | 0.593 | 0.428 | 0.423 | 0.393 | 0.665 | ||||||||
| IMPL | 0.568 | 0.463 | 0.531 | 0.278 | 0.618 | 0.53 | |||||||
| PEKM | 0.45 | 0.32 | 0.346 | 0.316 | 0.468 | 0.561 | 0.458 | ||||||
| PPRM | 0.608 | 0.632 | 0.386 | 0.482 | 0.631 | 0.627 | 0.527 | 0.776 | |||||
| RCEI | 0.481 | 0.399 | 0.437 | 0.379 | 0.604 | 0.617 | 0.486 | 0.772 | 0.779 | ||||
| RMAC | 0.765 | 0.627 | 0.497 | 0.481 | 0.794 | 0.613 | 0.651 | 0.635 | 0.865 | 0.769 | |||
| SOC | 0.756 | 0.587 | 0.911 | 0.697 | 0.59 | 0.507 | 0.566 | 0.37 | 0.47 | 0.377 | 0.515 | ||
| TPC | 0.395 | 0.406 | 0.126 | 0.177 | 0.471 | 0.537 | 0.285 | 0.147 | 0.33 | 0.298 | 0.31 | 0.263 |
4.2.2 Homeowners
A few items were omitted from the homeowner model because their loadings were less than 0.50 (Hair et al., 2021). The following were the items excluded: ECO4, SOC1, SOC4, PRM1, PRM11, PRM7, PRM8, CSF33, BAR23, IMP4 and ECO2, with loadings ranging from 0.136 to 0.496. The remaining items had loadings higher than 0.70; this finding indicates a satisfactory reliability score (Hair et al., 2021). Other items such as PRM2, PRM6, PRM9, CSF32, IMP5, IMP3 and IMP7 were also excluded to increase AVE scores for the following constructs: PIPM, FSSE and IMPL. After further exclusions, the loadings for retained items ranged between 0.50 and 0.943, while their Cronbach's alpha values ranged from 0.308 to 0.925. In addition, the composite reliability values have a range from 0.707 to 0.938, and AVE values ranged from 0.520 to 0.800. Discriminant validity was established for all factors using the Fornell–Larcker criterion and the HTMT ratio. Even though the HTMT ratio had relatively high results for ECO, the value was 1.223 for ENV and 1.478 for SOC (see Tables 4–6 and Figures 4 and 5).
Measurement model – homeowners
| Construct | Code | Factor loading | Cronbach's alpha | rho_A | CR | AVE |
|---|---|---|---|---|---|---|
| ENV | 0.913 | 0.925 | 0.932 | 0.667 | ||
| ENV1 | 0.841 | |||||
| ENV2 | 0.891 | |||||
| ENV3 | 0.862 | |||||
| ENV4 | 0.887 | |||||
| ENV5 | 0.877 | |||||
| ENV6 | 0.587 | |||||
| ENV7 | 0.724 | |||||
| ECO | 0.308 | 0.483 | 0.707 | 0.569 | ||
| ECO1 | 0.500 | |||||
| ECO3 | 0.943 | |||||
| SOC | 0.676 | 0.686 | 0.822 | 0.606 | ||
| SOC2 | 0.810 | |||||
| SOC3 | 0.794 | |||||
| SOC5 | 0.729 | |||||
| ARP | 0.876 | 0.875 | 0.916 | 0.732 | ||
| BEEC | 0.902 | |||||
| BEEG | 0.901 | |||||
| EDGE | 0.855 | |||||
| NCCP | 0.757 | |||||
| PIPM | 0.695 | 0.701 | 0.812 | 0.520 | ||
| PRM3 | 0.751 | |||||
| PRM4 | 0.723 | |||||
| PRM5 | 0.697 | |||||
| PRM10 | 0.712 | |||||
| PPRM | 0.893 | 0.897 | 0.914 | 0.573 | ||
| CSF1 | 0.782 | |||||
| CSF2 | 0.766 | |||||
| CSF3 | 0.794 | |||||
| CSF4 | 0.734 | |||||
| CSF5 | 0.794 | |||||
| CSF6 | 0.768 | |||||
| CSF7 | 0.769 | |||||
| CSF21 | 0.634 | |||||
| PEKM | 0.578 | 0.579 | 0.825 | 0.703 | ||
| CSF10 | 0.826 | |||||
| CSF11 | 0.850 | |||||
| RMAC | 0.874 | 0.876 | 0.908 | 0.665 | ||
| CSF15 | 0.794 | |||||
| CSF16 | 0.823 | |||||
| CSF17 | 0.821 | |||||
| CSF18 | 0.832 | |||||
| CSF19 | 0.806 | |||||
| RCEI | 0.751 | 0.752 | 0.889 | 0.800 | ||
| CSF20 | 0.900 | |||||
| CSF22 | 0.889 | |||||
| FSSE | 0.822 | 0.833 | 0.868 | 0.525 | ||
| CSF25 | 0.739 | |||||
| CSF26 | 0.697 | |||||
| CSF27 | 0.765 | |||||
| CSF28 | 0.782 | |||||
| CSF29 | 0.737 | |||||
| CSF30 | 0.613 | |||||
| CAI | 0.800 | 0.900 | 0.865 | 0.623 | ||
| BAR6 | 0.650 | |||||
| BAR8 | 0.916 | |||||
| BAR9 | 0.890 | |||||
| BAR27 | 0.661 | |||||
| FAP | 0.925 | 0.989 | 0.938 | 0.684 | ||
| BAR13 | 0.819 | |||||
| BAR14 | 0.774 | |||||
| BAR16 | 0.813 | |||||
| BAR17 | 0.895 | |||||
| BAR18 | 0.868 | |||||
| BAR19 | 0.805 | |||||
| BAR20 | 0.809 | |||||
| IMPL | 0.772 | 0.777 | 0.845 | 0.523 | ||
| IMP1 | 0.766 | |||||
| IMP2 | 0.758 | |||||
| IMP6 | 0.670 | |||||
| IMP8 | 0.723 | |||||
| IMP9 | 0.695 |
Fornell–Larcker – homeowners
| PIPM | ARP | CAI | ECO | ENV | FAP | FSSE | IMPL | PEKM | PPRM | RCEI | RMAC | SOC | |
|---|---|---|---|---|---|---|---|---|---|---|---|---|---|
| PIPM | 0.721 | ||||||||||||
| ARP | 0.362 | 0.856 | |||||||||||
| CAI | −0.267 | −0.009 | 0.789 | ||||||||||
| ECO | 0.445 | 0.649 | −0.037 | 0.754 | |||||||||
| ENV | 0.396 | 0.724 | −0.027 | 0.755 | 0.817 | ||||||||
| FAP | −0.299 | 0.066 | 0.687 | 0.015 | 0.052 | 0.827 | |||||||
| FSSE | 0.53 | 0.221 | −0.341 | 0.264 | 0.25 | −0.379 | 0.724 | ||||||
| IMPL | 0.472 | 0.282 | −0.236 | 0.345 | 0.301 | −0.203 | 0.329 | 0.723 | |||||
| PEKM | 0.365 | 0.253 | −0.147 | 0.239 | 0.15 | −0.183 | 0.46 | 0.181 | 0.838 | ||||
| PPRM | 0.506 | 0.443 | −0.268 | 0.411 | 0.429 | −0.272 | 0.591 | 0.46 | 0.512 | 0.757 | |||
| RCEI | 0.451 | 0.119 | −0.271 | 0.239 | 0.179 | −0.373 | 0.588 | 0.444 | 0.495 | 0.586 | 0.895 | ||
| RMAC | 0.419 | 0.275 | −0.316 | 0.207 | 0.207 | −0.367 | 0.486 | 0.306 | 0.52 | 0.596 | 0.624 | 0.815 | |
| SOC | 0.37 | 0.631 | −0.099 | 0.725 | 0.716 | −0.034 | 0.239 | 0.363 | 0.206 | 0.506 | 0.156 | 0.264 | 0.779 |
HTMT – homeowners
| PIPM | ARP | CAI | ECO | ENV | FAP | FSSE | IMPL | PEKM | PPRM | RCEI | RMAC | SOC | |
|---|---|---|---|---|---|---|---|---|---|---|---|---|---|
| PIPM | |||||||||||||
| ARP | 0.463 | ||||||||||||
| CAI | 0.337 | 0.183 | |||||||||||
| ECO | 0.94 | 1.036 | 0.346 | ||||||||||
| ENV | 0.526 | 0.806 | 0.168 | 1.223 | |||||||||
| FAP | 0.35 | 0.137 | 0.781 | 0.242 | 0.136 | ||||||||
| FSSE | 0.687 | 0.24 | 0.404 | 0.541 | 0.277 | 0.423 | |||||||
| IMPL | 0.642 | 0.337 | 0.268 | 0.756 | 0.371 | 0.227 | 0.39 | ||||||
| PEKM | 0.557 | 0.353 | 0.217 | 0.65 | 0.207 | 0.239 | 0.682 | 0.267 | |||||
| PPRM | 0.643 | 0.495 | 0.321 | 0.686 | 0.475 | 0.285 | 0.656 | 0.537 | 0.716 | ||||
| RCEI | 0.624 | 0.138 | 0.332 | 0.55 | 0.223 | 0.42 | 0.756 | 0.574 | 0.756 | 0.716 | |||
| RMAC | 0.52 | 0.307 | 0.358 | 0.379 | 0.234 | 0.395 | 0.56 | 0.361 | 0.733 | 0.674 | 0.767 | ||
| SOC | 0.539 | 0.812 | 0.206 | 1.478 | 0.899 | 0.179 | 0.299 | 0.493 | 0.331 | 0.651 | 0.235 | 0.357 |
 The diagram illustrates the Stage 1 model for managers, depicting various factors and their interrelationships. The factors are represented by circles, each labeled with abbreviations such as ARP, PPRM, PEKM, FSSE, RMAC, IMPL, IAC, TPC, ENV, ECO, SOC, and PIPM. Apart from ARB, which is a higher order construct, all others are lower order constructs. Arrows indicate the directional flow and relationships between these factors. Each factor has associated loadings, with some items excluded due to loadings less than 0.50.
Stage 1 model – managers
The diagram illustrates the Stage 1 model for managers, depicting various factors and their interrelationships. The factors are represented by circles, each labeled with abbreviations such as ARP, PPRM, PEKM, FSSE, RMAC, IMPL, IAC, TPC, ENV, ECO, SOC, and PIPM. Apart from ARB, which is a higher order construct, all others are lower order constructs. Arrows indicate the directional flow and relationships between these factors. Each factor has associated loadings, with some items excluded due to loadings less than 0.50.Stage 1 model – managers
 The diagram shows the Stage 1 model for homeowners. It illustrates the relationships between different factors such as ARP, ENV, ECO, SOC, PIPM, PPRM, PEKM, FSSE, RMAC, CAI, FAP, and IMPL. Again, only ARB is a higher order construct, while others are lower order constructs. Each factor is represented by a circle with arrows indicating the direction of relationships between them. The arrows are labeled with values representing the strength of the relationships. The diagram includes labels for individual components within each factor, such as BEEG, EDGE, NCCP for ARP, and IMP1, IMP2 for IMPL.
Stage 1 model – homeowners
The diagram shows the Stage 1 model for homeowners. It illustrates the relationships between different factors such as ARP, ENV, ECO, SOC, PIPM, PPRM, PEKM, FSSE, RMAC, CAI, FAP, and IMPL. Again, only ARB is a higher order construct, while others are lower order constructs. Each factor is represented by a circle with arrows indicating the direction of relationships between them. The arrows are labeled with values representing the strength of the relationships. The diagram includes labels for individual components within each factor, such as BEEG, EDGE, NCCP for ARP, and IMP1, IMP2 for IMPL.Stage 1 model – homeowners
4.3 Stage 2 – structural model assessment
4.3.1 Direct effects: managers
According to the structural model, the direct effects on retrofit implementation were analysed. The effect of PIPM on PEKM was marginally significant (β = 0.278, p = 0.063, f2 = 0.056). This finding provides marginal support for H1. Also, the effect of PIPM on PPRM was significant (β = 0.355, p = 0.001, f2 = 0.126), lending support to H2. PIPM also showed the strongest association with RMAC (β = 0.600, p < 0.001, f2 = 0.415), supportting H3. ARB showed a positive association with FSSE (β = 0.464, p < 0.001, f2 = 0.275), supporting H4. On the contrary, ARB did not have a significant direct effect on PEKM (H5: β = 0.124, p = 0.195), nor does it have a significant effect on PPRM (H6: β = 0.050, p = 0.498) or RMAC (H7: β = 0.113, p = 0.118).
Significant associations were found between ARP and PPRM (β = 0.355, p < 0.001, f2 = 0.156), and between ARP and RCEI (β = 0.311, p < 0.001, f2 = 0.107). These findings support H8 and H9 and indicate that the association of policy awareness with the planning and compliance capabilities of managers is medium to large. In terms of CSFs, the positive association of RMAC with IMPL was marginally supported amongst managers (β = 0.351, p = 0.054, f2 = 0.059). This pattern indicates marginal support for H14. The associations of other CSFs, such as FSSE (H10), PEKM (H11), PPRM (H12) and RCEI (H13), with IMPL were not supported. This implies that these capabilities amongst managers depend on each other as factors associated with the implementation through different configurational pathways, as will be further substantiated with the fsQCA results later in Section 4.4.
4.3.2 Direct effects: homeowners
The results suggest that PIPM had a significant effect on PEKM (β = 0.328, p < 0.001, f2 = 0.100), PPRM (β = 0.349, p < 0.001, f2 = 0.151) and RMAC (β = 0.377, p < 0.001, f2 = 0.138), thus supporting H1–H3. ARB was found to be significantly associated with FSSE (β = 0.277, p < 0.001, f2 = 0.083) and PPRM (β = 0.239, p = 0.016, f2 = 0.038), supporting H4 and H6. Hypotheses 5 and 7 were not supported as ARB had an insignificant effect on PEKM and RMAC. Similarly, ARP failed to have a significant effect on PPRM (β = 0.140, p = 0.149) and RCEI (β = 0.124, p = 0.171), thereby failing to support H8 and H9. Out of the five CSFs associated with retrofit implementation, only two were found to have a significant association, that is, PPRM (β = 0.382, p < 0.001, f2 = 0.097) and RCEI (β = 0.315, p = 0.005, f2 = 0.065). These two significant associations support H12 and H13. Although PEKM had a marginally significant association (β = −0.166, p = 0.075, f2 = 0.023), H11 was not supported because β was found to be negative. FSSE and RMAC did not show any significant association and, hence, were unable to support Hypotheses 10 and 14. The absence of significant association between FSSE and retrofit implementation, and between RMAC and retrofit implementation, for homeowners suggests that these capabilities carry little weight on their own. Their relevance appears to be contingent on the existence of planning mechanisms.
4.3.3 Moderation effects
From the point of view of the managers, the negative moderation effects of IAC in the association between RMAC and IMPL (H15: β = 0.033, p = 0.603) and TPC in the relationship between PEKM and IMPL were not supported (H16: β = 0.154, p = 0.074). For homeowners, the role of CAI in negatively moderating the relationship between RCEI and IMPL was not significant (H17: β = −0.124, p = 0.239), nor was the moderating role of FAP in the relationship between FSSE and IMPL (H18: β = 0.017, p = 0.854). All these results indicate that the hypothesised barriers do not function as significant moderators of the capability-implementation relationships for either stakeholder group. Rather than weakening specific pathways, barriers seem to operate more as background constraints within the decision-making environment. This interpretation lines up with fsQCA results in Section 4.4, where the minimal presence of barriers, which did not emerge as significant moderators in the PLS-SEM analysis, is common in several pathways.
Tables 7 and 8 present the total direct effects, multicollinearity and effect size from the perspectives of both managers and homeowners.
Total direct effects, multicollinearity and effect size – managers
| Effect type | Hypothesis | Relationship | β | Mean | SE | t-Stat | VIF | Confidence interval (95% bias-corrected) | f2 | p-value | Interpretation | |
|---|---|---|---|---|---|---|---|---|---|---|---|---|
| LB | UB | |||||||||||
| Direct | H1 | PIPM → PEKM | 0.278 | 0.283 | 0.15 | 1.861 | 1.588 | −0.042 | 0.538 | 0.056 | 0.063 | Marginally supported |
| H2 | PIPM → PPRM | 0.355 | 0.359 | 0.109 | 3.255 | 1.671 | 0.125 | 0.552 | 0.126 | 0.001 | Fully supported | |
| H3 | PIPM → RMAC | 0.600 | 0.588 | 0.095 | 6.342 | 1.588 | 0.413 | 0.774 | 0.415 | 0.000 | Fully supported | |
| H4 | ARB → FSSE | 0.464 | 0.465 | 0.089 | 5.231 | 1,000 | 0.283 | 0.631 | 0.275 | 0.000 | Fully supported | |
| H5 | ARB → PEKM | 0.124 | 0.128 | 0.095 | 1.295 | 1.588 | −0.069 | 0.303 | 0.011 | 0.195 | Not supported | |
| H6 | ARB → PPRM | 0.050 | 0.057 | 0.074 | 0.677 | 1.729 | −0.101 | 0.184 | 0.002 | 0.498 | Not supported | |
| H7 | ARB → RMAC | 0.113 | 0.121 | 0.072 | 1.565 | 1.588 | −0.026 | 0.257 | 0.015 | 0.118 | Not supported | |
| H8 | ARP → PPRM | 0.355 | 0.351 | 0.085 | 4.196 | 1.354 | 0.179 | 0.508 | 0.156 | 0.000 | Fully supported | |
| H9 | ARP → RCEI | 0.311 | 0.312 | 0.081 | 3.835 | 1.000 | 0.145 | 0.464 | 0.107 | 0.000 | Fully supported | |
| H10 | FSSE → IMPL | 0.238 | 0.239 | 0.168 | 1.421 | 2.617 | −0.095 | 0.561 | 0.039 | 0.155 | Not supported | |
| H11 | PEKM → IMPL | 0.037 | 0.050 | 0.104 | 0.356 | 1.922 | −0.168 | 0.238 | 0.001 | 0.722 | Not supported | |
| H12 | PPRM → IMPL | 0.003 | 0.010 | 0.162 | 0.016 | 3.187 | −0.328 | 0.313 | 0.000 | 0.987 | Not supported | |
| H13 | RCEI → IMPL | −0.065 | −0.048 | 0.103 | 0.63 | 2.012 | −0.269 | 0.133 | 0.004 | 0.529 | Not supported | |
| H14 | RMAC → IMPL | 0.351 | 0.320 | 0.182 | 1.925 | 3.768 | 0.003 | 0.712 | 0.059 | 0.054 | Marginally supported | |
| Moderating | H15 | IAC × RMAC → IMPL | 0.033 | 0.030 | 0.064 | 0.52 | 1.401 | −0.094 | 0.162 | 0.003 | 0.603 | Not supported |
| H16 | TPC × PEKM → IMPL | 0.154 | 0.154 | 0.086 | 1.786 | 1.263 | −0.014 | 0.326 | 0.035 | 0.074 | Not supported | |
Total direct effects, multicollinearity and effect size – homeowners
| Effect type | Hypothesis | Relationship | β | Mean | SE | t-Stat | VIF | Confidence interval (95% bias-corrected) | f2 | p-value | Interpretation | |
|---|---|---|---|---|---|---|---|---|---|---|---|---|
| LB | UB | |||||||||||
| Direct | H1 | PIPM → PEKM | 0.328 | 0.327 | 0.068 | 4.859 | 1.249 | 0.187 | 0.450 | 0.100 | 0.000 | Fully supported |
| H2 | PIPM → PPRM | 0.349 | 0.345 | 0.075 | 4.682 | 1.255 | 0.203 | 0.495 | 0.151 | 0.000 | Fully supported | |
| H3 | PIPM → RMAC | 0.377 | 0.377 | 0.07 | 5.374 | 1.249 | 0.237 | 0.510 | 0.138 | 0.000 | Fully supported | |
| H4 | ARB → FSSE | 0.277 | 0.279 | 0.078 | 3.556 | 1.000 | 0.119 | 0.421 | 0.083 | 0.000 | Fully supported | |
| H5 | ARB → PEKM | 0.073 | 0.076 | 0.089 | 0.825 | 1.249 | −0.099 | 0.248 | 0.005 | 0.409 | Not supported | |
| H6 | ARB → PPRM | 0.239 | 0.237 | 0.099 | 2.403 | 2.346 | 0.045 | 0.431 | 0.038 | 0.016 | Fully supported | |
| H7 | ARB → RMAC | 0.082 | 0.084 | 0.081 | 1.015 | 1.249 | −0.074 | 0.242 | 0.007 | 0.310 | Not supported | |
| H8 | ARP → PPRM | 0.140 | 0.145 | 0.097 | 1.442 | 2.177 | −0.055 | 0.326 | 0.014 | 0.149 | Not supported | |
| H9 | ARP → RCEI | 0.124 | 0.126 | 0.091 | 1.370 | 1.000 | −0.048 | 0.296 | 0.016 | 0.171 | Not supported | |
| H10 | FSSE → IMPL | −0.016 | −0.03 | 0.102 | 0.156 | 1.966 | −0.200 | 0.205 | 0.000 | 0.876 | Not supported | |
| H11 | PEKM → IMPL | −0.166 | −0.161 | 0.094 | 1.78 | 1.683 | −0.351 | 0.017 | 0.023 | 0.075 | Not supported | |
| H12 | PPRM → IMPL | 0.382 | 0.368 | 0.109 | 3.503 | 2.124 | 0.180 | 0.610 | 0.097 | 0.000 | Fully supported | |
| H13 | RCEI → IMPL | 0.315 | 0.299 | 0.112 | 2.807 | 2.179 | 0.103 | 0.541 | 0.065 | 0.005 | Fully supported | |
| H14 | RMAC → IMPL | −0.031 | −0.015 | 0.114 | 0.274 | 2.111 | −0.238 | 0.208 | 0.001 | 0.784 | Not supported | |
| Moderating | H17 | CAI × RCEI → IMPL | −0.124 | −0.122 | 0.105 | 1.178 | 1.299 | −0.345 | 0.071 | 0.018 | 0.239 | Not supported |
| H18 | FAP × FSSE → IMPL | 0.017 | −0.005 | 0.09 | 0.184 | 1.366 | −0.152 | 0.193 | 0.000 | 0.854 | Not supported | |
4.3.4 Mediation effects
A further analysis was conducted to see whether the capabilities played a mediating role between awareness/perceived importance and retrofit implementation. For managers, the results showed that only RMAC had a marginally significant mediation effect on the relationship between PIPM and IMPL (β = 0.210, p = 0.064). As for homeowners, PPRM fully mediated the relationships between PIPM and IMPL (β = 0.134, p = 0.010) as well as the relationship between ARB and IMPL (β = 0.091, p = 0.039).
Specific indirect effects – managers
| Effect type | Relationship | β | Mean | SE | t-Stat | Confidence interval (95% bias-corrected) | p-value | Interpretation | |
|---|---|---|---|---|---|---|---|---|---|
| LB | UB | ||||||||
| Mediating | ARB → FSSE → IMPL | 0.111 | 0.115 | 0.087 | 1.268 | −0.034 | 0.309 | 0.205 | Not significant |
| PIPM → RMAC → IMPL | 0.210 | 0.190 | 0.113 | 1.852 | 0.014 | 0.464 | 0.064 | Marginally significant | |
| ARB → RMAC → IMPL | 0.040 | 0.041 | 0.037 | 1.068 | −0.002 | 0.158 | 0.286 | Not significant | |
| PIPM → PPRM → IMPL | 0.001 | 0.004 | 0.063 | 0.014 | −0.135 | 0.130 | 0.989 | Not significant | |
| PIPM → PEKM → IMPL | 0.010 | 0.013 | 0.035 | 0.297 | −0.047 | 0.097 | 0.767 | Not significant | |
| ARB → PPRM → IMPL | 0.000 | 0.001 | 0.015 | 0.009 | −0.032 | 0.033 | 0.993 | Not significant | |
| ARP → RCEI → IMPL | −0.020 | −0.015 | 0.034 | 0.592 | −0.104 | 0.038 | 0.554 | Not significant | |
| ARB → PEKM → IMPL | 0.005 | 0.009 | 0.019 | 0.243 | −0.017 | 0.059 | 0.808 | Not significant | |
| ARP → PPRM → IMPL | 0.001 | 0.005 | 0.057 | 0.016 | −0.110 | 0.117 | 0.987 | Not significant | |
Specific indirect effects – homeowners
| Effect type | Relationship | β | Mean | SE | t-Stat | Confidence interval (95% bias-corrected) | p-value | Interpretation | |
|---|---|---|---|---|---|---|---|---|---|
| LB | UB | ||||||||
| Mediating | ARB → FSSE → IMPL | −0.004 | −0.007 | 0.03 | 0.148 | −0.059 | 0.063 | 0.882 | Not significant |
| PIPM → RMAC → IMPL | −0.012 | −0.004 | 0.044 | 0.266 | −0.092 | 0.084 | 0.79 | Not significant | |
| ARB → RMAC → IMPL | −0.003 | −0.003 | 0.013 | 0.196 | −0.042 | 0.016 | 0.845 | Not significant | |
| PIPM → PPRM → IMPL | 0.134 | 0.128 | 0.052 | 2.581 | 0.053 | 0.273 | 0.01 | Fully significant | |
| PIPM → PEKM → IMPL | −0.055 | −0.053 | 0.034 | 1.598 | −0.135 | 0.000 | 0.11 | Not significant | |
| ARB → PPRM → IMPL | 0.091 | 0.086 | 0.044 | 2.069 | 0.025 | 0.211 | 0.039 | Fully significant | |
| ARP → RCEI → IMPL | 0.039 | 0.037 | 0.031 | 1.258 | −0.005 | 0.125 | 0.208 | Not significant | |
| ARB → PEKM → IMPL | −0.012 | −0.012 | 0.017 | 0.7 | −0.066 | 0.010 | 0.484 | Not significant | |
| ARP → PPRM → IMPL | 0.054 | 0.053 | 0.041 | 1.318 | −0.007 | 0.154 | 0.188 | Not significant | |
4.3.5 Explained variance and predictive relevance
For managers, the model accounted for 44.5% of the variance in IMPL (R2 = 0.445, Q2 = 0.282). Of the antecedent variables included in the model for managers, RMAC showed the strongest association with implementation intention (R2 = 0.455, Q2 = 0.446). A similar explanatory power was found for PPRM (R2 = 0.404, Q2 = 0.342). The model for homeowners accounted for a 35.9% variance in PPRM (R2 = 0.359, Q2 = 0.331) but a relatively lower percentage of variance in IMPL at 29.3% (R2 = 0.293, Q2 = 0.126). By conventional thresholds, this constitutes weak explanatory power (Hair et al., 2021). This gap suggests the model captures the managers' implementation decisions considerably better than homeowners', with substantially more of the variance amongst the latter unexplained by the constructs measured. According to Panakaduwa et al. (2025), homeowners' retrofit decisions are influenced by psychological and demographic attributes as well as capability assessment. Amongst the antecedent variables considered in the current model, PPRM emerged as an important factor in predicting retrofit implementation amongst homeowners (R2 = 0.359, Q2 = 0.331), whereas RCEI explained none of the variance in homeowners' decision-making (R2 = 0.015, Q2 = −0.005). Details of this analysis are presented in Tables 11 and 12 and Figures 6 and 7.
R2 and Stone–Geisser Q2 – managers
| Endogenous variable | R2 | R2 adjusted | Q2 predict | Interpretation |
|---|---|---|---|---|
| FSSE | 0.216 | 0.209 | 0.177 | Weak to moderate explanatory power; medium predictive relevance |
| PEKM | 0.135 | 0.12 | 0.047 | Weak explanatory power; small predictive relevance |
| PPRM | 0.404 | 0.388 | 0.342 | Moderate explanatory power; medium predictive relevance |
| RCEI | 0.097 | 0.089 | 0.079 | Very weak explanatory power; small predictive relevance |
| RMAC | 0.455 | 0.445 | 0.446 | Moderate explanatory power; large predictive relevance |
| IMPL | 0.445 | 0.399 | 0.282 | Moderate explanatory power; medium predictive relevance |
R2 and Stone–Geisser Q2 – homeowners
| Endogenous variable | R2 | R2 adjusted | Q2 predict | Interpretation |
|---|---|---|---|---|
| FSSE | 0.077 | 0.071 | 0.063 | Very weak explanatory power; small predictive relevance |
| PEKM | 0.135 | 0.124 | 0.110 | Weak explanatory power; small predictive relevance |
| PPRM | 0.359 | 0.347 | 0.331 | Moderate explanatory power; medium predictive relevance |
| RCEI | 0.015 | 0.009 | −0.005 | Very weak explanatory power; small predictive relevance |
| RMAC | 0.177 | 0.166 | 0.156 | Weak explanatory power; medium predictive relevance |
| IMPL | 0.293 | 0.251 | 0.126 | Weak to moderate explanatory power; small predictive relevance |
 The diagram illustrates the structural model for managers, depicting the relationships between the antecedent lower-order constructs (e.g., RCEI, PPRM, PEKM, FSSE, RMAC, PIPM, IAC, TPC, ARP & PIPM), and a higher order construct (ARB) and implementation intention (IMPL). Arrows represent the direction and strength of the relationships, while solid and dashed lines indicate different levels of significance. The model also presents the variance in implementation intention explained by the antecedent variables and highlights the relative explanatory power of each construct. Among the relationships examined, only RMAC had a marginally significant influence on IMPL, either directly or indirectly.
Stage 2 model – managers
The diagram illustrates the structural model for managers, depicting the relationships between the antecedent lower-order constructs (e.g., RCEI, PPRM, PEKM, FSSE, RMAC, PIPM, IAC, TPC, ARP & PIPM), and a higher order construct (ARB) and implementation intention (IMPL). Arrows represent the direction and strength of the relationships, while solid and dashed lines indicate different levels of significance. The model also presents the variance in implementation intention explained by the antecedent variables and highlights the relative explanatory power of each construct. Among the relationships examined, only RMAC had a marginally significant influence on IMPL, either directly or indirectly.Stage 2 model – managers
 The diagram represents the relationships between various factors influencing implementation intention (IMPL) among homeowners. It includes several lower-order constructs, namely ARP, RCEI, CAI, PPRM, PEKM, FSSE, RMAC, PIPM, ECO, ENV, SOC, and the higher-order construct ARB, which are connected by arrows indicating directional relationships. The diagram uses solid and dashed lines to represent different types of relationships, with solid lines indicating stronger associations. Overall, the model depicts a complex network of influences leading to implementation intention. Among the examined relationships, PPRM and RCEI showed the strongest associations with IMPL.
Stage 2 model – homeowners
The diagram represents the relationships between various factors influencing implementation intention (IMPL) among homeowners. It includes several lower-order constructs, namely ARP, RCEI, CAI, PPRM, PEKM, FSSE, RMAC, PIPM, ECO, ENV, SOC, and the higher-order construct ARB, which are connected by arrows indicating directional relationships. The diagram uses solid and dashed lines to represent different types of relationships, with solid lines indicating stronger associations. Overall, the model depicts a complex network of influences leading to implementation intention. Among the examined relationships, PPRM and RCEI showed the strongest associations with IMPL.Stage 2 model – homeowners
4.4 fsQCA results
4.4.1 Necessary conditions
Following Ragin (2008), the necessity threshold was set at 0.9, meaning that a condition must be present in at least 90% of successful outcome cases to qualify as necessary. Coverage scores indicate the empirical relevance of each condition; high consistency with low coverage signals theoretical importance but limited empirical scope. For homeowners, ∼fap came closest to meeting the necessity criterion (consistency = 0.917, coverage = 0.314). For managers, ∼iac (consistency = 0.883, coverage = 0.354) and ∼tpc (consistency = 0.823, coverage = 0.336) were the highest-scoring conditions but remained below the threshold. What this suggests is that none of the conditions achieved statistical necessity across either groups. Details are provided in Table 13.
Necessary conditions
| Managers | Homeowners | ||||||
|---|---|---|---|---|---|---|---|
| Causal conditions | inclN | RoN | covN | Causal conditions | inclN | RoN | covN |
| ∼pipm | 0.474 | 0.357 | 0.202 | ∼pipm | 0.554 | 0.362 | 0.213 |
| pipm | 0.622 | 0.850 | 0.600 | pipm | 0.541 | 0.808 | 0.466 |
| ∼arb | 0.456 | 0.382 | 0.202 | ∼arb | 0.439 | 0.409 | 0.183 |
| arb | 0.688 | 0.841 | 0.617 | arb | 0.670 | 0.777 | 0.492 |
| ∼arp | 0.507 | 0.365 | 0.218 | ∼arp | 0.570 | 0.406 | 0.231 |
| arp | 0.639 | 0.851 | 0.610 | arp | 0.545 | 0.767 | 0.421 |
| ∼rmac | 0.444 | 0.379 | 0.196 | ∼rmac | 0.433 | 0.456 | 0.193 |
| rmac | 0.668 | 0.836 | 0.600 | rmac | 0.636 | 0.718 | 0.419 |
| ∼fsse | 0.479 | 0.359 | 0.205 | ∼fsse | 0.483 | 0.412 | 0.200 |
| fsse | 0.680 | 0.867 | 0.654 | fsse | 0.590 | 0.760 | 0.437 |
| ∼pekm | 0.471 | 0.376 | 0.206 | ∼pekm | 0.545 | 0.395 | 0.219 |
| pekm | 0.620 | 0.829 | 0.569 | pekm | 0.518 | 0.767 | 0.407 |
| ∼pprm | 0.437 | 0.380 | 0.193 | ∼pprm | 0.455 | 0.390 | 0.184 |
| pprm | 0.688 | 0.841 | 0.616 | pprm | 0.601 | 0.782 | 0.466 |
| ∼rcei | 0.447 | 0.441 | 0.214 | ∼rcei | 0.435 | 0.490 | 0.204 |
| rcei | 0.641 | 0.762 | 0.497 | rcei | 0.677 | 0.691 | 0.415 |
| ∼iac | 0.883 | 0.353 | 0.354 | ∼cai | 0.878 | 0.299 | 0.303 |
| iac | 0.179 | 0.780 | 0.203 | cai | 0.223 | 0.819 | 0.258 |
| ∼tpc | 0.823 | 0.363 | 0.336 | ∼fap | 0.917 | 0.296 | 0.314 |
| tpc | 0.226 | 0.777 | 0.244 | fap | 0.164 | 0.812 | 0.195 |
Note(s): Outcome variable: impl
4.4.2 Sufficient configurations: managers
Conditions that met the 0.85 consistency threshold were retained on the truth table, as they are considered indicative of potential sufficiency for successful implementation (Ragin, 2008). Based on this threshold, 16 distinct pathways to successful retrofit implementation were identified for managers. The solution consistency of 0.907, which is above the minimum requirement of 0.8, suggests that the solutions found are genuine rather than a result of random error. In total, the configurational pathways covered 53.4% of success cases; this is a moderate level of coverage.
The pathway with the highest coverage, pipm*arb*arp*rmac*fsse*pprm*rcei*∼iac*∼tpc (raw coverage = 0.236; consistency = 0.905), captures the PIPM and benefits awareness, RMAC, adequate financing/stakeholder engagement, strategic planning/risk management and regulatory compliance, in the presence of minimal TPC and IAC barriers. The second most influential pathway, pipm*arb*arp*rmac*fsse*pekm*pprm*rcei*∼iac (raw coverage = 0.220; consistency = 0.885), closely mirrors the first, but it further includes professional expertise/knowledge management. Other pathways with raw coverage below 0.2 are included to provide a complete account of the configurational solutions. For example, pipm*arb*arp*rmac*fsse*∼pekm*pprm*∼iac*∼tpc and arb*arp*rmac*fsse*∼pekm*pprm*∼rcei*∼iac*∼tpc, indicate that implementation can occur with the minimal presence of professional skills and the absence regulatory compliance, provided other facilitating conditions are present. This pattern reflects an early stage of retrofit markets where technical and informational barriers coexist alongside considerable planning and awareness, allowing motivated actors to compensate for systemic deficiencies through effective RMAC. Across the 16 pathways, the recurrence of ∼iac and ∼tpc shows that barriers are close to a precondition for managers, regardless of which other conditions vary. On top of that, pprm together with either fsse or pekm frequently accompanies awareness and perceived importance, while rmac and rcei were present in some pathways, but not in others. This suggests that they may act as alternative rather than universal pathways. Details are provided in Table 14 and Figures 8–10.
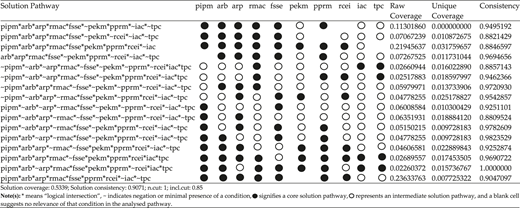
 The scatter plot displays the relationship between membership in 'Path_1' on X-axis and membership in implementation (IMPL) (Y-axis). The plot contains dozens of data points, each representing a case. The plot contains numerous data points distributed across the 0-1 membership range, with many observations located above the diagonal reference line. The diagonal line represents the threshold at which membership in the pathway equals membership in the outcome. The concentration of observations above the line is consistent with the high sufficiency consistency score (Consistency X ≤ Y: 0.886171), indicating that membership in Path_1 is largely a subset of membership in IMPL. The lower consistency score for X ≥ Y (0.269528) suggests limited evidence that IMPL is a subset of Path_1.
Fuzzy plot of Path 1 for managers
The scatter plot displays the relationship between membership in 'Path_1' on X-axis and membership in implementation (IMPL) (Y-axis). The plot contains dozens of data points, each representing a case. The plot contains numerous data points distributed across the 0-1 membership range, with many observations located above the diagonal reference line. The diagonal line represents the threshold at which membership in the pathway equals membership in the outcome. The concentration of observations above the line is consistent with the high sufficiency consistency score (Consistency X ≤ Y: 0.886171), indicating that membership in Path_1 is largely a subset of membership in IMPL. The lower consistency score for X ≥ Y (0.269528) suggests limited evidence that IMPL is a subset of Path_1.Fuzzy plot of Path 1 for managers
 The scatter plot displays the relationship between membership in 'Path_2' on X-axis and membership in implementation (IMPL) (Y-axis). The plot contains dozens of data points, each representing a case. The plot contains numerous data points distributed across the 0-1 membership range, with many observations located above the diagonal reference line. The diagonal line represents the threshold at which membership in the pathway equals membership in the outcome. The concentration of observations above the line is consistent with the high sufficiency consistency score (Consistency X ≤ Y: 0.878049), indicating that membership in Path_2 is largely a subset of membership in IMPL. The lower consistency score for X ≥ Y (0.113305) suggests limited evidence that IMPL is a subset of Path_2.
Fuzzy plot of Path 2 for managers
The scatter plot displays the relationship between membership in 'Path_2' on X-axis and membership in implementation (IMPL) (Y-axis). The plot contains dozens of data points, each representing a case. The plot contains numerous data points distributed across the 0-1 membership range, with many observations located above the diagonal reference line. The diagonal line represents the threshold at which membership in the pathway equals membership in the outcome. The concentration of observations above the line is consistent with the high sufficiency consistency score (Consistency X ≤ Y: 0.878049), indicating that membership in Path_2 is largely a subset of membership in IMPL. The lower consistency score for X ≥ Y (0.113305) suggests limited evidence that IMPL is a subset of Path_2.Fuzzy plot of Path 2 for managers
 The scatter plot displays the relationship between membership in 'Path_3' on X-axis and membership in implementation (IMPL) (Y-axis). The plot contains dozens of data points, each representing a case. The plot contains numerous data points distributed across the 0-1 membership range, with many observations located above the diagonal reference line. The diagonal line represents the threshold at which membership in the pathway equals membership in the outcome. The concentration of observations above the line is consistent with the high sufficiency consistency score (Consistency X ≤ Y: 0.969582), indicating that membership in Path_3 is largely a subset of membership in IMPL. The lower consistency score for X ≥ Y (0.0729613) suggests limited evidence that IMPL is a subset of Path_3.
Fuzzy plot of Path 3 for managers
The scatter plot displays the relationship between membership in 'Path_3' on X-axis and membership in implementation (IMPL) (Y-axis). The plot contains dozens of data points, each representing a case. The plot contains numerous data points distributed across the 0-1 membership range, with many observations located above the diagonal reference line. The diagonal line represents the threshold at which membership in the pathway equals membership in the outcome. The concentration of observations above the line is consistent with the high sufficiency consistency score (Consistency X ≤ Y: 0.969582), indicating that membership in Path_3 is largely a subset of membership in IMPL. The lower consistency score for X ≥ Y (0.0729613) suggests limited evidence that IMPL is a subset of Path_3.Fuzzy plot of Path 3 for managers
4.4.3 Sufficient configurations: homeowners
There are eight different pathways through which homeowners could proceed with retrofit implementation. A consistency score of 0.917 proves that the pathways are dependable, while a coverage of 0.380 shows that homeowners have fewer dependable pathways to success than managers. This suggests that pathways from homeowners' perspectives are not only specific but also less flexible.
The primary configuration pathway was pipm*arb*pekm*pprm*rcei*arp*rmac*∼cai*∼fap, which had a raw coverage of 0.211 and a consistency of 0.910. It emphasises the importance of planning, skills and awareness in supporting its implementation even in the minimal presence of FAP barriers. Also, pathways with raw coverage less than 0.2 were not thrown out as they are not necessarily theoretically insignificant. On this note, other influential pathways, such as pipm*arb*∼pekm*rcei*∼arp*fsse*rmac*∼cai*∼fap (raw coverage = 0.062; consistency = 0.884), follow a similar logic but without professional expert knowledge (∼pekm) or regulatory approval (∼arp), suggesting fsse and rmac can substitute for these when present. Pathways such as ∼pipm*arb*∼pekm*pprm*∼rcei*∼arp*∼fsse*∼rmac*cai*∼fap and ∼pipm*arb*pekm*pprm*rcei*arp*∼fsse*∼rmac*cai*fap show that cai can compensate for the minimal presence of FSSE (∼fsse) as well as RMAC (∼rmac), allowing implementation to proceed even where these facilitating conditions are missing. A lower-coverage pathway like pipm*arb*pekm*pprm*rcei*∼arp*∼fsse*rmac*∼cai*fap (raw coverage = 0.018) suggests that successful implementation can still occur despite the full presence of fap barrier and the minimal presence of arp (i.e. ∼arp) and fsse (i.e. ∼fsse). Although ∼fap satisfied the necessity condition, the pathways show that some homeowners can achieve success through implementation even under constrained circumstances, provided that the requisite knowledge/skills, planning ability, compliance, and resource management capacity co-exist concurrently. This suggests that they can implement retrofitting in phase, starting with the less-costly strategies.
Overall, arb was consistent in each of the eight pathways, suggesting the central role of homeowners' ARB in successful implementation. Similarly, pprm and rcei occurred alongside arb in most pathways, meaning they can compensate for the absence of pipm, arp, fsse and rmac in some pathways. The summary of these results is presented in Table 15 and Figures 11–13.
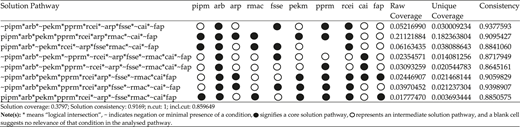
 The scatter plot displays the relationship between membership in 'Path_1' on X-axis and membership in implementation (IMPL) (Y-axis). The plot contains dozens of data points, each representing a case. The plot contains numerous data points distributed across the 0-1 membership range, with many observations located above the diagonal reference line. The diagonal line represents the threshold at which membership in the pathway equals membership in the outcome. The concentration of observations above the line is consistent with the high sufficiency consistency score (Consistency X ≤ Y: 0.909543), indicating that membership in Path_1 is largely a subset of membership in IMPL. The lower consistency score for X ≥ Y (0.211219) suggests limited evidence that IMPL is a subset of Path_1.
Fuzzy plot of Path 1 for homeowners
The scatter plot displays the relationship between membership in 'Path_1' on X-axis and membership in implementation (IMPL) (Y-axis). The plot contains dozens of data points, each representing a case. The plot contains numerous data points distributed across the 0-1 membership range, with many observations located above the diagonal reference line. The diagonal line represents the threshold at which membership in the pathway equals membership in the outcome. The concentration of observations above the line is consistent with the high sufficiency consistency score (Consistency X ≤ Y: 0.909543), indicating that membership in Path_1 is largely a subset of membership in IMPL. The lower consistency score for X ≥ Y (0.211219) suggests limited evidence that IMPL is a subset of Path_1.Fuzzy plot of Path 1 for homeowners
 The scatter plot displays the relationship between membership in 'Path_2' on X-axis and membership in implementation (IMPL) (Y-axis). The plot contains dozens of data points, each representing a case. The plot contains numerous data points distributed across the 0-1 membership range, with many observations located above the diagonal reference line. The diagonal line represents the threshold at which membership in the pathway equals membership in the outcome. The concentration of observations above the line is consistent with the high sufficiency consistency score (Consistency X ≤ Y: 0.937759), indicating that membership in Path_2 is largely a subset of membership in IMPL. The lower consistency score for X ≥ Y (0.0521699) suggests limited evidence that IMPL is a subset of Path_2.
Fuzzy plot of Path 2 for homeowners
The scatter plot displays the relationship between membership in 'Path_2' on X-axis and membership in implementation (IMPL) (Y-axis). The plot contains dozens of data points, each representing a case. The plot contains numerous data points distributed across the 0-1 membership range, with many observations located above the diagonal reference line. The diagonal line represents the threshold at which membership in the pathway equals membership in the outcome. The concentration of observations above the line is consistent with the high sufficiency consistency score (Consistency X ≤ Y: 0.937759), indicating that membership in Path_2 is largely a subset of membership in IMPL. The lower consistency score for X ≥ Y (0.0521699) suggests limited evidence that IMPL is a subset of Path_2.Fuzzy plot of Path 2 for homeowners
 The scatter plot displays the relationship between membership in 'Path_3' on X-axis and membership in implementation (IMPL) (Y-axis). The plot contains dozens of data points, each representing a case. The plot contains numerous data points distributed across the 0-1 membership range, with many observations located above the diagonal reference line. The diagonal line represents the threshold at which membership in the pathway equals membership in the outcome. The concentration of observations above the line is consistent with the high sufficiency consistency score (Consistency X ≤ Y: 0.921466), indicating that membership in Path_3 is largely a subset of membership in IMPL. The lower consistency score for X ≥ Y (0.0406279) suggests limited evidence that IMPL is a subset of Path_3.
Fuzzy plot of Path 3 for homeowners
The scatter plot displays the relationship between membership in 'Path_3' on X-axis and membership in implementation (IMPL) (Y-axis). The plot contains dozens of data points, each representing a case. The plot contains numerous data points distributed across the 0-1 membership range, with many observations located above the diagonal reference line. The diagonal line represents the threshold at which membership in the pathway equals membership in the outcome. The concentration of observations above the line is consistent with the high sufficiency consistency score (Consistency X ≤ Y: 0.921466), indicating that membership in Path_3 is largely a subset of membership in IMPL. The lower consistency score for X ≥ Y (0.0406279) suggests limited evidence that IMPL is a subset of Path_3.Fuzzy plot of Path 3 for homeowners
5. Discussion
The positive associations of PIPM with RMAC and PPRM were fully supported for both managers and homeowners. This conforms with prior evidence that PIPM is associated with stronger planning and RMAC capabilities (Bobrova et al., 2021; Mlecnik, 2010). PIPM's positive association with PEKM was only marginally supported for managers but fully supported for homeowners. This suggests that the pathway from awareness to regulative/normative and capability may vary across stakeholder groups. The positive association of ARB with FSSE was fully supported for managers, while ARB's association with PPRM was supported for homeowners. This is consistent with homeowners channelling benefit awareness into planning decisions, leaving financial judgements to professionals (Altaf et al., 2022; Yang et al., 2023). The association of ARP with PPRM and RCEI was fully supported from the managers' perspective, which can be explained by the AMC framework: when actors are motivated by policy awareness and have the capacity to act, retrofit implementation becomes more achievable (Scott, 2014).
Although ARB's associations with PEKM, PPRM and RMAC for managers (H5–H7) were insignificant, they offer important insights. This result shows that ARB appears more closely associated with FSSE than with overall capability enablers amongst managers, which was not expected from the AMC framework. The weak explanatory power of RCEI (R2 = 0.015) for homeowners implies that regulation does not appear to be sufficiently explained by the factors included in the model for this group. The dominance of PPRM's R2 suggests that the confidence of homeowners in their planning and risk management accounts for more of the variance than other competencies considered, despite the significant association of RCEI with retrofit implementation.
While the positive association of RMAC with retrofit implementation was only marginally supported for managers, the positive associations of PPRM and RCEI with IMPL were fully supported for homeowners. This could be because homeowners face greater uncertainty about the practicality of retrofitting and are more likely to respond to compliance pressures and professional guidance when making retrofit decisions (Tozer et al., 2023). However, the AMC framework suggests that motivation must accompany capability; without planning and regulations to ensure implementation, advice alone is insufficient. The insignificant roles of FSSE, PEKM, PPRM and RCEI for managers, along with the lack of associations of PEKM, FSSE and RMAC with IMPL for homeowners, suggest that these factors can only be effective when supported by other enabling conditions. Manager who have excellent abilities to guide their principals in accessing finance and other requisite resources still requires an adequate understanding of resource planning and management, as these would distinguish them from other who only focus on rent collection. On the other hand, homeowners' financial and communication capabilities seem to matter most when planning and coordination , as well as familiarity with the regulations, are present.
In the same vein, the marginal significance of the mediation pathway (PIPM → RMAC → IMPL) suggests that RMAC represents one of the most relevant factors associated with the link between PIPM and retrofit implementation amongst managers. The result agrees with prior literature, which highlights effective coordination, communication and resource allocation as important enablers of retrofit delivery (Brocklehurst et al., 2021; Tozer et al., 2023). In contrast, different mediating pathways exist amongst homeowners. In particular, two mediation pathways (PIPM → PPRM → IMPL and ARB → PPRM → IMPL) were fully significant, while the rest were not significant. This shows that PPRM acts as the intermediary linking the homeowners' awareness to action. The absence of planning is associated with awareness not translating into action (Abbà et al., 2024; Tozer et al., 2023).
The insignificant moderation results indicate that changes in barriers do not have a significant effect on the pathways from regulative/normative and capability factors to implementation. The relationship seems to operate across the entire process of decision-making, rather than through a particular pathway. According to Brocklehurst et al. (2021), the fragmentation of the supply chain and poor communication result in systemic barriers as opposed to the existence of barriers to specific pathways. This contradicts the traditional assumption that in resource-limited environments such as Lagos, barriers serve as thresholds that limit specific capability-implementation relationships.
A subsequent analysis using fsQCA revealed that none of the conditions reached the necessity criterion for managers. However, the minimal presence of IAC (i.e. ∼iac) barriers showed high consistency (0.883) and appeared frequently amongst the most consistent pathways. The optimal solution pairs high awareness with strong capability across resource management/communication, finance, planning and compliance, combined with ∼iac as well as ∼tpc. This supports prior studies such as Killip et al. (2014), who emphasised the roles of coordination and knowledge, as well as capability constraints in retrofit delivery. Other pathways showed that RMAC as well as FSSE can substitute for professional expertise/knowledge management or regulatory compliance/expert involvement. For homeowners, no condition met the necessity threshold either, though the minimal presence of FAP (∼fap) barriers came closest (consistency = 0.917), acting as a near-universal facilitating condition (Charles, 2025). Apart from awareness of retrofit benefits, which had the highest frequency across homeowner pathways, project planning/risk management and regulatory compliance/expert involvement also appeared frequent across the configurations. Other pathways with lower coverage demonstrated that the presence of CAI can compensate for the absence of financial support/stakeholder engagement as well as RMAC.
The findings from both PLS-SEM and fsQCA methods do not conflict. While PLS-SEM reveals which factors have relationship with the outcome, the latter indicates how these factors can interact and create feasible pathways. Managers' responsiveness to RMAC is consistent with how policy and funding correspond to project-level action (Brocklehurst et al., 2021). Financial incentives, in turn, appear to be a compensatory factor for homeowners' response, and planning confidence emerge as a more common enabler. This lines up with the findings of Panakaduwa et al. (2025) and Tozer et al. (2023). Such a difference raises the question of whether a policy that motivates homeowners soley through financial viability can be successful. The evidence suggests that planning support, combined with financial instruments, is more effective in reaching this segment.
6. Implications
6.1 Theoretical
This study contributes to the theory of retrofit adoption in three ways. First, it provides more clarity on the specific contributions of different dimensions of awareness in the development of operational capacities. PIPM contributes to the AMC framework (Chen, 1996), while awareness of the benefits of retrofitting is associated with financial engagement, thereby supporting the theory of resource-allocation linkages with perceived value to action (Barney, 1991). ARP supports the institutional theory (Scott, 2014). Second, the use of PLS-SEM identifies the relative association of individual factors on retrofit implementation. Finally, fsQCA demonstrates that successful retrofit implementation is determined by different combinations of awareness, capacities and barriers, thereby supporting the concept of equifinality and the heterogeneity of adoption decisions (Pappas and Woodside, 2021). Therefore, this research not only contributes to the refinement of existing theories but also demonstrates that barriers are not absolute inhibitors of successful implementation where alternative configurational pathways exists.
6.2 Practical
The strongest direct enabler of retrofit implementation amongst managers is RMAC, which is further associated with PIPM. This suggests that awareness creation programmes should aim at strengthening RMAC skills embedded in onboarding and professional development rather than conducting general training. Decision-makers such as homeowners are more likely to have confidence in managers with astute capability to manage resources and communicate retrofit benefits effectively. With institutional bodies such as NIESV, coordination skills can be assessed alongside technical skills. Managers can also gain from systematic project controls, as project planning and project risk management play a key role in the project implementation process, even under limited budgets. A standard scheduling and trade-coordination checklist, distributed through collaboration between professional and regulatory bodies (e.g. LASBCA and LASPPPA), could provide managers with a low-cost starting point regardless of project size. Policy should be flexible rather than incentive-only, as there is no single dominant pathways for managers, as confirmed by the 16 fsQCA pathways. In addition, LASBCA could provide coordination assistance along with limited regulatory relief for managers with partial technical/regulatory knowledge instead of denying approval where any requirement is unmet. The minimal presence of IAC barriers was near-necessary for managers, appearing in almost every pathway leading to successful implementation. This could be further reinforced through the development of a shared, standardised terminology glossary for passive retrofit measures.
For homeowners, only two CSFs had a significant association with retrofit implementation: PPRM and RCEI. In other words, financial measures alone are not sufficient to explain this. These insights are clear from the mediation analysis. From the homeowners' perspective, ARB and PIPM can be indirectly associated with implementation through PPRM. This means that a programme offering financial and technical support, such as access to qualified technical experts, retrofit knowledge and manuals delivered at the local level, would be more successful than financial incentives alone. On the practical side, a homeowner retrofit helpdesk, run together by LASBCA and community development associations, is necessary. This should provide a vetted-installer directory, a step-by-step retrofit checklist and any subsidy or green mortgage scheme should accompany technical and planning support rather than financing alone. Implementation pathway options amongst homeowners are less broad than those of managers; there are only eight fsQCA pathways for homeowners as opposed to 16 for managers. Energy efficiency mandates carry benefits well beyond cost savings (Panakaduwa et al., 2025). The benefits of these features could be made explicit in messages on energy bills or community association meetings where health and comfort benefits are explained alongside cost savings rather than as additional benefits, which may have a greater impact on shifting homeowners' motivation away from cost.
While these recommendations have been made keeping Lagos' peculiarities in mind, the concepts themselves, such as the importance of flexibility in policies, the need to provide both financial and technical assistance, and that of coordination capability, can be extended to other fast-growing cities with similar characteristics. That said, there is still a need to validate these findings by replicating them in different local contexts, as detailed in Section 8.
7. Conclusions
This research examines the interaction between retrofit awareness dimensions, organisational capabilities and implementation barriers in the context of passive retrofitting of residential buildings. It also identifies several pathways to successful implementation, each characterised by its own set of awareness, capabilities and barrier configurations. The research was conducted using PLS-SEM and fsQCA methods based on the data collected from managers and homeowners. The study revealed the following findings:
Based on the PLS-SEM results, PIPM showed the strongest and most consistent association with regulative/normative and capability variables for both managers and homeowners.
Policy awareness is associated with PPRM and RCEI from managers' perspective.
Awareness of retrofit benefit is mostly associated with FSSE for both managers and homeowners, and significantly associated with PPRM for the latter.
RMAC shows the strongest association with implementation of passive retrofitting for managers, whereas PPRM and RCEI had significant associations with retrofit implementation from homeowners' perspective.
Most of the insignificant direct predictors and moderating factors from the PLS-SEM results featured as part of the configurational pathways produced by fsQCA. It shows that successful implementation is achievable even with the minimal presence of IAC (∼iac) and TPC (∼tpc) barriers for managers' pathways, as well as FAP (∼fap) in the case of homeowners.
Managers can overcome institutional/planning barriers via many pathways that combine conditions such as pprm, fsse, pekm, rmac and rcei; homeowners, on the other hand, can rely on arb, and in most pathways, pprm and rcei, to offset the absence of financial support/stakeholder engagement and RMAC.
Rather than confirming the AMC framework and institutional theory, these findings qualify them. The consistent effect of PIPM on the capability constructs helps validate the AMC framework regarding the awareness–capabilities relationship. However, the insignificant association of ARB with PEKM and PPRM, as well as RMAC from managers' perspectives (H5–H7), shows that even with benefit awareness, there is no additional capability created when there is prior technical exposure. The significance of RCEI for homeowners and its non-significance for managers (H13) suggests that compliance is mainly a legitimising tool used for actors outside the regulations. The non-significance of FSSE and PEKM for retrofit implementation by both groups (H10, H11) supports the AMC framework on the need for capability and enabling conditions to take action. Lastly, the absence of moderating effects (H15–H18) suggests that, in Lagos's weak institutional context, barriers operate as background constraints rather than pathway-specific mechanisms.
These results indicate that retrofit strategies must move beyond standard incentive schemes. For managers, the focus should be on RMAC, being the strongest direct predictor of retrofit implementation among managers. In their case, financial resources are likely to be most effective when paired with effective planning. For homeowners, PPRM and RCEI had the strongest association with retrofit implementation. This does not mean subsidies and green mortgages, mostly reported by past studies, are unimportant; rather, this study revealed that they are likely to be more effective when combined with proper project planning and risk management. This context is quite relevant in Lagos, Nigeria because the combined effect of informal housing markets, weak regulation enforcement and limited access to finance suggests a policy approach centred on community-based planning and support rather than finance alone. This, therefore, gives relevance to public health consequences, which should be considered alongside economic benefits when promoting residential building retrofitting.
This study presents a useful starting point for other rapidly expanding cities in Sub-Saharan Africa; the research findings requires empirical testing because of its cross-sectional design and limited scope, as only one city was examined in this research. The configurational approach and dual-source weighting framework are generalisable across different building types, though indicators, such as managers' awareness of energy costs and tenant comfort, and CSFs need to be redefined and validated accordingly.
8. Limitations and future research
This study has some limitations that must be acknowledged. To begin with, it is important to point out that the research adopted a cross-sectional design, which means that data were collected at a single point in time from respondents. Besides, the construct of retrofit implementation was measured using subjective attitudes and intentions rather than objective behaviours. This study also identified the possibility of non-response bias in the manager sample. In the same vein, while not affected by non-response bias, the data sample from homeowners, the possibility of sampling bias cannot be ruled out. Lagos has unique characteristics that make it difficult to generalise the findings to other cities with different socio-economic, regulatory and climate conditions. In view of the weak explanatory power demonstrated by the variables analysed in this study, future research could incorporate additional elements such as values and norms, amongst other contextual factors.
This study presents a few possible directions for future research. A further study is needed to confirm the level of success that can be achieved in Lagos by using the implementation pathways suggested in this study. Given differences in building types, climate and legislation, there is a need to examine whether the replication of the configurational pathways identified in this study can produce similar results in similar cities in Nigerian and other Sub-Saharan African countries. Differences in market maturity and industry professionalisation may also influence pathway development over time. Therefore, a longitudinal design would allow the researchers to examine temporal sequencing of awareness, capability development and implementation. There is potential for future studies to utilise more rigorous methodologies to facilitate a deeper understanding of the results. For example, future studies can employ multi-group SEM to further test whether the manager-homeowner differences observed are statistically significant. Also, integrating qualitative case studies with fsQCA would further illuminate the mechanisms within the pathways identified, moving beyond identifying which pathways succeed to explaining why they do.
This research forms part of a larger doctoral study on the improvement of residential building energy performance in Nigeria, from which other publications are prepared, though they have different research objectives. This study. with Project ID: iRECS 7205, was approved by the Human Research Ethics Approval Panel (HREAP B) in the School of Built Environment at the University of New South Wales on 8 October 2024. Informed consent was obtained from all respondents to the survey. The process of data collection, storage and analysis followed the university's approved guidelines.
We employed QuillBot Grammar Checker to check and correct all spelling mistakes, grammar errors, punctuation and typing errors. No generative AI tool was used for creating ideas, analysing data, developing arguments or writing the content. All intellectual contributions are the authors' own work.
Appendix
Alphanumeric coding for variables
| Dimensions | Variable | Code |
|---|---|---|
| ENV | Reduces heavy reliance on non-renewable energy consumption | Env1 |
| Reduces carbon emissions and household energy consumption | Env2 | |
| Enhances air quality | Env3 | |
| Mitigation of climate change | Env4 | |
| Enhances energy security | Env5 | |
| Increases the energy star rating of existing residential dwellings | Env6 | |
| Reduces solar radiation and glare | Env7 | |
| ECO | Improves competitive positioning in the property market and attracts more willing tenants | Eco1 |
| Increases property value | Eco2 | |
| Saves energy and reduces consumption cost | Eco3 | |
| Improves real estate's contribution to national economic growth in the long run | Eco4 | |
| SOC | Enhances homeowners' social reputation | Soc1 |
| Reduces illness and health care expenditures and guarantees good health and well-being | Soc2 | |
| Improves indoor thermal comfort, tenants' satisfaction and productivity | Soc3 | |
| Creates local jobs and drives community growth | Soc4 | |
| Fosters positive tenant-owner relationship | Soc5 | |
| ARP | Building Energy Efficiency Code | BEEC |
| Building Energy Efficiency Guidelines | BEEG | |
| Excellence in Design for Greater Efficiency | EDGE | |
| National Climate Change Policy | NCCP | |
| PIPM | Increasing the thickness of wall insulation layers to reduce heat absorption | PRM1 |
| Optimising window design (e.g. double or triple-paned glazed windows) | PRM2 | |
| Using natural ventilation on building envelope | PRM3 | |
| Installing sun-shading devices | PRM4 | |
| Using reflective coating on the roof | PRM5 | |
| Insulation of the ceiling | PRM6 | |
| Enhancing the building's ability to prevent moisture from entering or escaping | PRM7 | |
| Integrating openings in building envelopes | PRM8 | |
| Improving components: overhangs, blinds or louvres to reduce heat gain | PRM9 | |
| Using reflective surfaces to distribute natural light and reduce reliance on artificial lighting | PRM10 | |
| Planting trees and vegetation around buildings to provide natural shade and reduce cooling loads | PRM11 | |
| CSFs | Comprehensive plans and detailed specifications | CSF1 |
| Balanced allocation of tasks with achievable project timelines | CSF2 | |
| Provision of oversight to ensure tasks are completed correctly | CSF3 | |
| Establishment of systems to achieve project objectives | CSF4 | |
| Adopting new and creative methods in project execution | CSF5 | |
| Accessibility of the required materials and tools | CSF6 | |
| Identification and mitigation of potential risks | CSF7 | |
| Sufficient financial and material resources | CSF8 | |
| A set out contracts and project goals, and a structured process for resolving conflicts | CSF9 | |
| Project team's experience in design and management for current retrofit projects | CSF10 | |
| Prompt and effective communication of information | CSF11 | |
| Appropriate organisational structure for the project | CSF12 | |
| Provision of motivation and incentives to keep stakeholders engaged | CSF13 | |
| Utilisation of data from the building for better decision-making | CSF14 | |
| Effective management of project costs | CSF15 | |
| Collaboration and trust amongst all retrofit stakeholders | CSF16 | |
| Strong leadership, skilled project managers and team members with relevant competencies | CSF17 | |
| Clear communication channels to keep residential building owners informed and engaged, and feedback mechanisms | CSF18 | |
| Clear project priorities and vision | CSF19 | |
| Compliance with environmental laws and regulations and conducting regular audits | CSF20 | |
| Putting substantial effort into design and construction planning | CSF21 | |
| Early involvement of knowledgeable, dedicated and motivated experts with an understanding of retrofit measures | CSF22 | |
| Responsiveness of residential building owners to retrofit needs | CSF23 | |
| Strong policies and regulations, along with clear criteria and standards supported by government programmes | CSF24 | |
| Comprehensive guidance, incentives and subsidies from the government | CSF25 | |
| Standardised administrative procedures, criteria and home energy-efficiency review periods by government | CSF26 | |
| Availability of financial markets and affordable capital for project funding | CSF27 | |
| Prior knowledge of initial costs and ongoing operational/maintenance expenses | CSF28 | |
| Long-term funding repayment based on return on investment | CSF29 | |
| Fair sharing of energy savings amongst stakeholders | CSF30 | |
| Certainty of increased rent, high occupancy rates and tax benefits for retrofitted buildings | CSF31 | |
| Gaining support from the local community | CSF32 | |
| Strong cultural reputation, and raising public awareness and education about building retrofitting | CSF33 | |
| Sharing experiences and best practices | CSF34 | |
| BARs | Stakeholders' limited/lack of awareness/knowledge or information regarding building retrofit | BAR1 |
| Confusion and lack of trust due to unclear information | BAR2 | |
| Lack of social acceptability of retrofit measures and confidence in the retrofit process | BAR3 | |
| Lack of communication with building owners | BAR4 | |
| Poor retrofit/renovation culture amongst homeowners | BAR5 | |
| Absence of desire from owners to monitor and record building energy data | BAR6 | |
| Lack of interdisciplinary expertise and collaboration | BAR7 | |
| Cost implications and time-consuming paperwork for retrofit project approval | BAR8 | |
| Lack of capital to implement residential building retrofitting | BAR9 | |
| Lack of motivation to invest in retrofitting | BAR10 | |
| Long payback period | BAR11 | |
| Differing interests of stakeholders | BAR12 | |
| Price fluctuations for green materials | BAR13 | |
| Limited supply of dedicated financing instruments | BAR14 | |
| Uncertainty of return on investment | BAR15 | |
| Difficulties in access to loans and higher upfront payments | BAR16 | |
| Lack of government subsidies | BAR17 | |
| Inadequate or lack of overarching government policies, laws, standards, codes or guidelines | BAR18 | |
| Lack of long-term strategic guidance | BAR19 | |
| Enforcement issues | BAR20 | |
| Lack or shortage of qualified institutes capable of assessing and certifying residential building energy performance | BAR21 | |
| Difficulty in finding reliable professionals to successfully retrofit residential buildings | BAR22 | |
| Some residential buildings are difficult to retrofit | BAR23 | |
| Lack of access to efficient passive tools and technologies for building retrofitting | BAR24 | |
| Safety risks associated with extensive renovation process | BAR25 | |
| Logistics issues relating to passive retrofit material sourcing and transporting | BAR26 | |
| Difficulty in meeting building regulation requirements | BAR27 | |
| IMPL (managers) | I advocate for passive retrofitting measures in the properties I manage | IMP1 |
| I love to influence the decision to allocate budgets for passive retrofit measures | IMP2 | |
| I facilitate discussions about the benefits of passive retrofitting with property owners | IMP3 | |
| I love to ensure that retrofitting initiatives are aligned with property management goals | IMP4 | |
| I plan to assess and support the selection of appropriate passive retrofit measures for the properties I manage | IMP5 | |
| I will work to integrate passive retrofit measures into routine property maintenance schedules | IMP6 | |
| I seek to build partnerships with contractors who specialise in passive retrofitting | IMP7 | |
| I aim to ensure that all passive retrofitting efforts comply with relevant local building codes | IMP8 | |
| I intend to explore available financial options that align with the residential building retrofit objectives | IMP9 | |
| I advocate for regular audits to ensure the effectiveness of retrofit measures | IMP10 | |
| I aim to foster collaboration amongst tenants, property owners and other stakeholders for successful retrofit implementation | IMP11 | |
| IMPL (homeowners) | I am interested in setting aside a budget for implementing passive retrofitting measures | IMP1 |
| I intend to enlist the services of professionals to execute the passive retrofitting project | IMP2 | |
| I am committed to ensuring my property adheres to sustainable building practices and regulations | IMP3 | |
| I am interested in receiving the financial incentives provided by the government to assist with retrofit projects | IMP4 | |
| I plan to collaborate with organisations that specialise in energy efficiency | IMP5 | |
| I love to grant permission my property management company to initiate passive retrofit plans | IMP6 | |
| I aim to choose suitable passive retrofitting measures for my property | IMP7 | |
| I wish to set realistic timelines for retrofitting my property | IMP8 | |
| I love to discuss retrofit plans with my tenants | IMP9 |

