Skip to article sections
Purpose

This study aims to investigate whether decision-making towards sustainable products is influenced by social pressure, and whether the visibility of sustainable consumption is a decisive factor for purchasing Fairtrade chocolate among Czech students.

Design/methodology/approach

This study aimed to examine the relationship between the anticipated conspicuousness of sustainable consumer behaviour (SCB) and willingness to pay (WTP) for Fairtrade chocolate in the stimulus–organism–response (SOR) model. Moreover, moderation of this relationship by self-monitoring and attention to social comparison information (ATSCI) was examined. Data were collected from 203 Czech students (participants) using a consumer experiment.

Findings

No existence of a relationship between conspicuousness and the WTP for Fairtrade chocolate, no practically significant partial relationship between conspicuousness and the purchase of sustainable chocolate when smoothed from self-monitoring, and finally, no practically significant partial relationship between conspicuousness and sustainable chocolate purchase when smoothed from ATSCI was observed.

Originality/value

Therefore, making sustainable consumption visible and explicitly supporting people with high ATSCI/self-monitoring in this sense is less likely to support SCB than previously expected.

Interest in the sustainable development of society is growing in all its aspects (Van der Wal et al., 2018; Zucchella and Previtali, 2018). Intensive media coverage and social networks enable the presentation of the views of activists and Non-Governmental Organizations in particular (Attanasio et al., 2021). This leads to mounting public pressure on the sustainable behaviour of organisations (Shao et al., 2020). Unlike these societal phenomena, consumer behaviour is a purely private activity.

However, people are active actors within social groups influencing their behaviour (Zheng et al., 2022), which brings the “purely private activity” under social pressure. The conspicuousness of a consumption situation may then result in real, sustainable consumer behaviour (SCB). In other words, there is an assumption that if a consumer knows that other people can see their sustainable purchase, they tend to buy more sustainably (see, e.g. Costa Pinto et al., 2019).

This phenomenon has already been studied by many scholars (e.g. Caniëls et al., 2021; Sahin and Nasir, 2021; Ghorban Nejad and Hansen, 2021; Wenting et al., 2022 etc.) and also by Aagerup and Nilsson (2016), who investigated whether the participants in their consumer experiment, would buy Fairtrade or regular coffee if they knew that other people would see their (conspicuous) choice, or that it would remain (inconspicuously) hidden. The country of Aagerup and Nilsson’s research project – Sweden – represents strong social norms associated with a sustainable lifestyle. Thus, it posed a challenge to repeat the Swedish experiment in the conditions of the Czech Republic, where public awareness of norms favouring sustainable development is not sufficiently anchored (Čábelková et al., 2021). The experiment and subsequent questionnaire survey were conducted in two possible scenarios. Each involved a choice between Fairtrade and normal chocolate – one where the conspicuous SCB (visible sustainable purchases) took place, and the other in which inconspicuous choices were made, respectively.

This study is a critical replication of the Aagerup and Nilsson (2016) study, in which “green consumer behaviour” was redefined as “sustainable consumer behaviour,” and chocolate was tested in place of coffee. The study's design was fundamentally revised, using a real consumption experiment rather than a paper-based questionnaire. Our critical perspective on the original research led us to different conclusions.

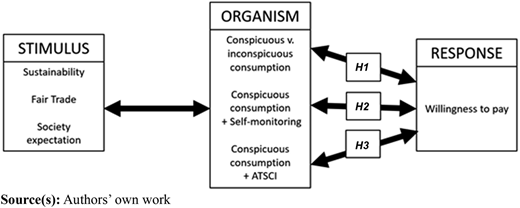
This study aimed to examine the relationship between the anticipated conspicuousness of SCB, and willingness to pay (WTP) for Fairtrade chocolate. In addition, moderation of this relationship by self-monitoring and attention to social comparison information (ATSCI) was explored. The stimulus–organism–response (SOR) model was used as the theoretical framework. The underlying question was whether sustainable branding and making SCB more visible could influence consumers’ preferences, enhancing the purchase of sustainable products and ultimately encouraging SCB. An answer to this question could help retailers and Fairtrade product processing companies in their marketing activities. Another issue was whether the above-mentioned relationship could be moderated by specific personality variables, such as self-monitoring ability and ATSCI.

This research paper also addressed the product-price effect representing a research gap (Zhang et al., 2018; Yue et al., 2020), considering the threshold at which consumers begin to prioritize economic utility over SCB, by defining the price difference at which the participant would no longer choose the sustainable product.

SCB is a widely researched topic (Essiz and Mandrik, 2022). However, there is a so-called intention-action gap, meaning that people claim to behave sustainably (e.g. support Fairtrade), but these words do not transfer into deeds (Kossmann and Gomez-Suarez, 2019). Many scholars study this topic and reveal various obstacles to behaving sustainably, such as financial and information barriers, too much effort needed or lack of sense of responsibility (Falcão and Roseira, 2022). Social factors, on which this paper focuses, are also important.

One social factor is society's pressure to comply with the norms. Aagerup and Nilsson (2016) claim in their paper that if marketers focus on enabling the customers of their sustainable products to show off, it will encourage sustainable consumption. Also, Friedrichsen and Engelmann (2018) showed that the WTP for Fairtrade chocolate increased (with normal chocolate buyers) when other people observed their choice. In our paper, we want to research whether this is true using the SOR model.

The reason for using Fairtrade chocolate in our experiment lies in filling the research gap by analyzing the variables affecting the WTP for Fairtrade products, as Zerbini et al. (2019) urge. Also, Del Prette and Sammogia (2020) see a research gap in the price and promotion of Fairtrade chocolate. Siddiqui et al. (2024), researching the sustainable cocoa market, ask for further studies in this area as well.

The theoretical framework used in this paper is the SOR model (Mehrabian and Russell, 1974; Utama et al., 2021; Laos-Espinoza et al., 2024), which explains how stimuli from the external environment (S) affect the individual's organism (internal and psychological states, O), which then leads to their reaction (behaviour, R). Currently, this approach is becoming increasingly popular for researching consumer behaviour because it allows for the inclusion of more factors of the external environment, which is relatively dynamic in the research. Moreover, it enables the selection and examination of factors relevant to the researched environment. It is suitable for including factors that belong to the area of sustainability, whether the reasons for purchasing organic products (Laos-Espinoza et al., 2024) or other sustainability factors (such as Fairtrade) are examined.

The resulting model looks as follows:

2.1.1 Stimuli

As for stimuli, sustainability is understood in the broadest sense as environmental, but also social and economic (Attanasio et al., 2021). Fairtrade principles are defined as dignified remuneration, prohibition of forced and child labour, environmental friendliness and the development of local communities for long-term sustainability (Siddiqui et al., 2024). Society expectations arise from social standards determining the (non)desirable behaviour and values of the majority of the population (Lu et al., 2021).

2.1.2 Organism

2.1.2.1 (In)conspicuous consumption

This part of the model is represented by the area of the consumer's internal “world”. Showing one’s SCB to the others is called conspicuous SCB. These internal processes responding to the stimuli are surveyed by many scholars under concepts such as herding bias (Ghorban Nejad and Hansen, 2021) or social crowding (Wenting et al., 2022). “Looking good rather than doing good” applies to young people if they want to impress their friends with sustainable consumption (Caniëls et al., 2021). Purchases of sustainable products manifest consumers' ”eagerness to be recognised” and become members of an ”elite group” (Gandhi, 2020). By SCB, consumers get the chance to acquire social status and prestige, according to Braun Kohlová and Urban (2020). Papista and Dimitradis (2019) call it the self-expressive benefits of products that clearly show they are sustainable. All the above-named studies are based on the fact that “the organism” processes the “stimuli” of expectations of society to behave sustainably (“response”).

Based on Aagerup and Nilsson’s hypothesis that “individuals who anticipate a conspicuous consumption situation will choose environmentally friendly products to a greater extent than individuals who anticipate an inconspicuous consumption situation” (Aagerup and Nilsson, 2016, p. 276), the first research hypothesis was formulated as follows:

H1.

There is a pairwise relationship between conspicuous consumption and the WTP for Fairtrade chocolate. Specifically, the proportion of Fairtrade chocolate bought by participants in the conspicuous consumption group, is expected to be markedly higher than in the inconspicuous consumption group.

2.1.2.2 Self-monitoring and ATSCI

Self-monitoring ability as a socio-psychological construct of self-expression is an important element of consumer behaviour (O´Cass, 2000). Aagerup and Nilsson used the theoretical model of self-monitoring developed by Snyder (1974), revised by Lennox and Wolfe (1984) and adapted by Snyder and Gangestad (1986). Social comparison on the ATSCI scale is related to self-monitoring. Still, instead of self-presentation skills, it measures the extent to which people are aware of other’s reactions to their behaviour, and whether they are sensitive to them. Self-monitoring and ATSCI as personality variables have been applied in many other consumer behaviour research projects such as Attiq and Azam (2015), Yoon et al. (2016), Zou and Chan (2019) and Essiz and Mandrik (2022).

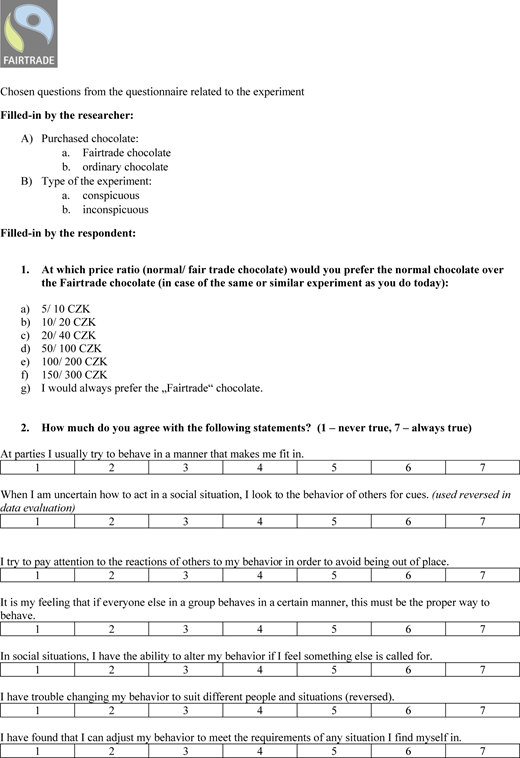
Having evaluated the applicability of self-monitoring and ATSCI scales for the SCB context, Aagerup and Nilsson (2016) used a set of seven chosen statements developed by Lennox and Wolfe (1984). They are listed in  Appendix, question 2: the first three defining the level of self-monitoring and the remaining ones that of ATSCI. Based on Aagerup and Nilsson (2016, pp. 276 and 277, respectively), the following hypotheses H2 and H3 were developed, and Figure 1 above summarizes these hypotheses proposed in the study in the conceptual model.

H2.

There is a partial relationship between conspicuous consumption and WTP for Fairtrade chocolate when smoothed from self-monitoring. Specifically, the positive difference between the proportions of Fairtrade chocolate bought by participants in conspicuous and inconspicuous consumption groups is expected to be greater for those with a higher self-monitoring ability.

H3.

There is a partial relationship between conspicuous consumption and WTP for Fairtrade chocolate when smoothed from ATSCI. Specifically, the positive difference between the proportions of Fairtrade chocolate bought by participants in conspicuous and inconspicuous consumption groups is expected to be greater for those with a higher ATSCI score.

2.1.3 Response

The WTP (Zhang et al., 2018) a higher price for sustainable products is the response of the organism to the stimuli in this application of the SOR model.

Two data collection methods – a field experiment and a questionnaire survey – were combined, both involving the same group of participants at the same time.

In line with Aagerup and Nilsson’s study involving undergraduates, a data set of Czech Generation Z participants was chosen as participants for the present analysis. Obviously, this data set cannot represent the entire country’s population; however, some authors stress the need to address 15–25-year-old consumers by applying the so-called Catch-Them-Young strategy (Adnan et al., 2022).

The study participants were recruited with the help of the university PR department through social networks, posters and screens so that Czech students from different majors were reached. Participants were only informed about participating in a scientific experiment and getting chocolate for free in advance. Also, some lessons with temporary study groups were used to increase the number of participants.

The experiment took place on six non-consecutive days from March to May 2022; sometimes, it was repeated several times in a row in one day with different groups. In the end, 13 groups of 203 Czech students participated. For each experimental group, the researchers determined in advance whether conspicuous or inconspicuous consumption situations would be tested.

After being instructed on the experiment procedure, every participant received 10 CZK (approx. 0.4 €), with which they could choose between the following three purchase options:

  1. A Fairtrade chocolate bar, associated with SCB (for 10 CZK)

  2. Two regular chocolate bars (for 5 CZK each)

  3. A regular chocolate bar (for 5 CZK, keeping 5 CZK)

The price of chocolate was set taking into account the weight of the bar, and reflecting actual usual market prices, Fairtrade chocolate was at twice the price of regular chocolate (In the pilot experiment, it turned out that participants felt ashamed to keep money that was not theirs. Therefore, an option was added so that the participant could exchange the allocated money for two pieces of regular chocolate).

Both kinds of chocolate were identical in shape and size; the information, whether it was ordinary or Fairtrade, was indicated only on the price tag (outer packaging was removed).

When buying and paying for the chocolate, each participant was alone in a temporary shop with one researcher so that no one could see their purchase decision between the 2 bars. The supervising staff member did not influence the participant in any way, and the communication consisted only of greetings and thanks.

In the conspicuous consumption group, each Fairtrade chocolate buyer was given a distinctive sticker during the purchase (green colour, big size, with a slogan), which they prominently displayed on their clothes. The key point is that the conspicuous group was informed in advance that they would meet the others for discussions after the experiment, so they were aware that if they bought Fairtrade chocolate, others would find out from the sticker (or lack thereof) on their clothes.

After the experimental purchase, each participant received a questionnaire (see  Appendix). Situational constructs were adapted from Lennox and Wolfe (1984), who introduced two personality variables – self-monitoring and ATSCI – as discussed above. Individual statements were rated by the participants on a 7-point scale from (1) “never true” to (7) “always true,” the calculated average of the scale points representing the value of the variables. Moderation of the relationship between the expected consumption conspicuousness and SCB was assessed, as stated in the H2 and H3 hypotheses.

The questionnaire was designed in two variants according to the preferred kind of chocolate, containing 11 and 12 content questions, respectively. For the Fairtrade variant, an additional question asked what price difference between regular and Fairtrade chocolate the participant would change their buying decision in favour of the former. In the last part of the questionnaire, participants were exposed to the self-monitoring/ATSCI statements (see  Appendix), expressing their degree of agreement on a 7-point Likert scale. The goal was to determine whether these variables could moderate the relationship between conspicuousness and SCB.

The obtained data were coded to allow for calculations using statistical software, incomplete responses and incorrectly filled questionnaire items having been omitted. Assuming that the differences between inconspicuous and conspicuous consumption among Czech participants are in line with the previous research findings, the proposed hypotheses were then examined. 113 participants (55.6%) fall into the group of inconspicuous consumption and 90 (44.4%) into that of conspicuous consumption.

Referring to the assumed pairwise (H1) and partial (H2, H3) relationships, the three above-specified research hypotheses were evaluated, using a paired and partial comparison analysis of the relationships between the variables in the analysed data set. Due to its origin, the data set cannot be considered a random sample from a clearly defined population, which attaches greater weight to the tools of descriptive statistics. In the case of inferential methods, the theoretical assumptions are listed, pointing out possible drawbacks. This paper also follows recent recommendations for suppressing the excessive role of the label of “statistical significance” in scientific papers (Greenland, 2019; McShane et al., 2019; Asmalovskij and Sadílek, 2016; Velčovská and Sadílek, 2014).

Two kinds of plots are employed in the analysis, namely a stacked bar chart (the relationships specified in H2 and H3) and a kernel density estimation graph (bandwidth adjustment 1.5; discussion of the presence of the interaction term in logistic regression models used to assess H2 and H3). To judge the null hypothesis of independence between the conspicuousness of consumption and the WTP for Fairtrade chocolate, Pearson’s chi-squared test with Yates’ continuity correction was performed. Logistic regression models were constructed to allow additional comments on the patterns seen in the stacked bar charts; see the list in Table 1 below. Point estimates of relevant partial regression parameters and corresponding odds ratio estimates are also provided, along with profile likelihood confidence intervals. Theoretical assumptions for the justified use of statistical inference tools are given in Table 2.

Strictly speaking, this statistical analysis does not allow for justified causal conclusions, as the observed relationships cannot be smoothed out from the effect of all other factors influencing the WTP for Fairtrade chocolate. In other words, the results of the present study cannot be seen as any “proof” of the existence/absence of causal relationships. On the other hand, based on the data available, the research outcomes obtained here show the respective – pairwise and partial – relationships in detail, regardless of whether they support the above-proposed hypotheses or not. For the purposes of the inferential analysis, individual significance and confidence levels of 5 and 95% respectively, were chosen a priori. The whole analysis was performed in RStudio.

Overall, 70.4% of experiment participants were willing to pay for Fairtrade chocolate. In the examined data set, there were 90 conspicuous and 113 inconspicuous consumers. 72.22% of members of the conspicuous consumption group were willing to pay for Fairtrade chocolate, while in the group of inconspicuous consumers, the share of Fairtrade product buyers was 69.03%, the difference in relative frequencies of Fairtrade chocolate purchases conditional upon their conspicuousness being practically insignificant; see Table 3. The p-value of the Pearson’s chi-square test with Yates’ continuity correction equals 0.7332, no support against the null hypothesis of independence between conspicuous consumption and the WTP for Fairtrade chocolate in the population was provided (at a 5% significance level). The respective relationship was also investigated using Model 1; see Table 4. A descriptive interpretation of the estimated odds ratio suggests that a participant from the conspicuous consumption group is 16.67% more likely to buy Fairtrade chocolate, than a participant from the group of inconspicuous consumption. However, given that the lower limit of the 95% confidence interval of the profile likelihood odds ratio is below 1 and the upper limit above 1, it is equally likely that a conspicuous consumer is less/more likely to be willing to purchase Fairtrade chocolate than an inconspicuous one. It can therefore be concluded that the tendency towards WTP for Fairtrade chocolate is strong for both groups, the properties of the analysed data set not corroborating the H1 hypothesis.

Due to the limitation given by the low price of the product in the experiment, the participants who bought Fairtrade chocolate were asked in the questionnaire whether there is any price difference (while maintaining the ratio of Fairtrade vs regular price at 2:1) at which they would prefer normal chocolate. The outcomes are displayed in Table 5 underneath.

A substantial majority (76.06%) of the surveyed consumers would no longer “go sustainable” if the price ratio was 50 CZK for regular and 100 CZK for Fairtrade chocolate. In terms of their spending choices, conspicuous and inconspicuous consumption groups do not seem to be different in a practically significant way.

A total of 113 inconspicuous consumers were in the analysed data set. With one exception, they completed the questionnaire so that self-monitoring and ATSCI scores could be computed. To evaluate the H2 hypothesis, participants were split into the following four consumer categories according to the magnitude of self-monitoring – (1) below the 1st quartile (25% quantile), (2) from the 1st quartile (incl.) to the median (excl.), (3) from the median (incl.) to the 3rd quartile (75% quantile, excl.), and (4) from the 3rd quartile (incl.) onwards. In an optimally designed study, the data set would be divided into even more categories by self-monitoring, but the present research is limited by data availability.

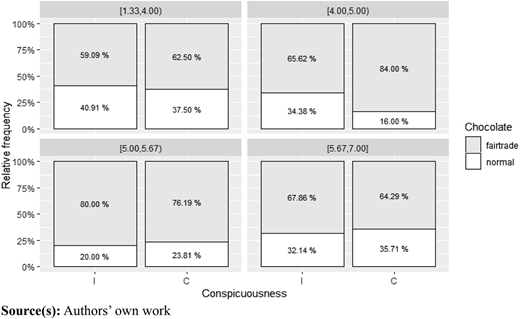
For H2 to be supported, the pattern in Figure 2 should meet the following two preconditions:

  1. A higher proportion of Fairtrade chocolate purchases in the conspicuous consumption group for all sizes of self-monitoring (i.e. in all four consumer categories).

  2. An increasing positive difference in the proportions of Fairtrade chocolate purchases between the two consumer groups, with increasing self-monitoring.

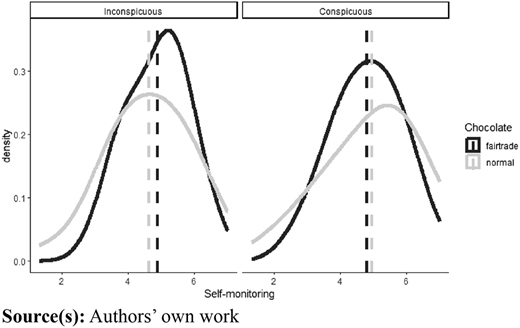
The proportion of Fairtrade chocolate bought by conspicuous consumers is higher for self-monitoring groups 1 and 2 (the former scoring the lowest), while in categories 3 and 4 (the latter indicating the highest self-monitoring ability) the proportion of Fairtrade chocolate is slightly higher for inconspicuous consumers (e.g. 64.29 vs 67.86% in the case of group 4). Thus, the first condition of support for H2 mentioned above is not fulfilled. There are some differences between self-monitoring groups in the relative frequencies of particular chocolate purchases conditional upon their conspicuousness. A different light is shed on the assessment of H2 by logistic regression Model 2; see Table 6, Model 3 is added to calculate the 95% confidence interval for the conspicuous consumption group. The model is fitted with an interaction term, allowing the variables (conspicuous consumption and self-monitoring) to interact, as the relationship between self-monitoring and WTP for Fairtrade chocolate purchased is different for the two consumer groups, the difference existing in both the level and the variation; see Figure 3. The arithmetic mean of self-monitoring in the inconspicuous consumption group is higher for the participants who bought Fairtrade products (4.88) than for those who preferred normal chocolate (4.62), in contrast to the group of conspicuous consumption, whose self-monitoring mean showed the opposite ratio (4.81 and 4.95, respectively).

Table 6 provides information about estimated Models 2 and 3. A descriptive interpretation of the estimated odds ratio for the group of inconspicuous consumption indicates that a participant with a self-monitoring score of 1 point higher than another participant, in the analysed data set, is 27.84% more likely to buy Fairtrade chocolate. For the same case in the conspicuous consumption group, the likelihood of buying sustainably is 10.52% lower. This is not just seemingly unfavourable to the H2 hypothesis, but slightly against it. However, the lower and upper limits of the 95% confidence intervals of the profile likelihood odds ratio for both groups are below and above 1 respectively, thus it is equally likely that a participant with a relative self-monitoring score of 1 point higher, than that of another participant in the analysed data set, is less/more likely to buy Fairtrade chocolate. Only low self-monitoring participants from the conspicuous consumption group are relatively more inclined to make sustainable purchases than members of the other group. The research findings do not corroborate H2, the properties of the analysed data set lend slight support against it.

A similar procedure as for H2 was repeated for the H3 hypothesis, the analysis again being limited by the data availability. Participants were divided into four groups, this time according to the magnitude of ATSCI.

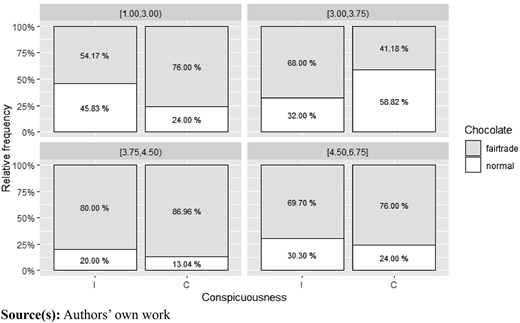
As observed in Figure 4, the proportion of Fairtrade chocolate bought by conspicuous consumers is higher than that in the other cohort for ATSCI categories 1, 3 and 4 (in the order from the lowest to highest ATSCI score), while for ATSCI group 2 the share of Fairtrade chocolate is markedly higher among inconspicuous consumers (68 vs 41.18%). The second precondition is not present in the analysed data either – even if focusing only on ATSCI categories 1, 3 and 4, the highest difference in the shares of Fairtrade chocolate purchase proportions between conspicuous and inconspicuous consumers is seen in the lowest-scoring ATSCI group 1 (76.00 vs 54.17%, the difference reaching 21.83 percentage points), while there are some practically significant differences in the relative frequencies of chocolate types between ATSCI groups conditional upon consumption conspicuousness.

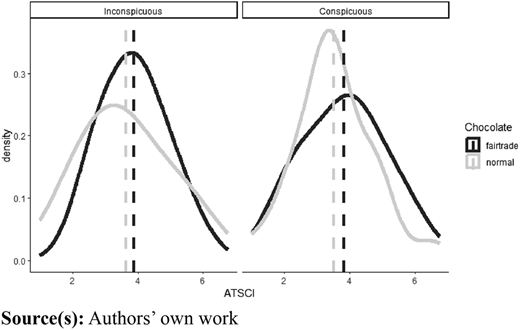
When assessing H3, the logistic regression Model 4 can also be utilised. The decision not to include the interaction term this time resulted from the graph in Figure 5. Unlike self-monitoring, the relationship between ATSCI and WTP for Fairtrade chocolate is very similar in the two consumer groups; the difference between ATSCI distributions is only in variation but not in level; see Figure 5. In both consumer groups, a higher ATSCI mean was recorded for participants who bought a Fairtrade product than for those who preferred normal chocolate – in the inconspicuous group 3.87 vs 3.63, in the group of conspicuous consumption 3.81 vs 3.51, respectively.

Information about the estimated Model 4 is presented in Table 7 below. By the descriptive interpretation of the estimated odds ratio, it can be concluded that in the analysed data set, a participant with an ATSCI score higher by 1 point than another participant is typically 22.70% more likely willing to pay for Fairtrade chocolate, regardless of consumption conspicuousness. However, the existence of a weak pairwise relationship between ATSCI and the type of chocolate is not supportive of H3, which focuses on a different relationship. Additionally, if the lower and upper bounds of the 95% confidence intervals of the profile likelihood odds ratio are below and above 1 respectively, it is equally likely that a consumer with a relative ATSCI score of 1 point higher is less/more likely willing to pay for Fairtrade chocolate. Considering the above findings, it can be concluded that the properties of the analysed data set do not support H3.

The majority of the respondents in this survey behaved sustainably. However, hypotheses H1H3 were not supported by the data, which is why it cannot be claimed that, in the SOR model, organisms would respond to society's expectations connected with Fairtrade and sustainability (stimuli) based on the conspicuousness of their SCB. What other stimuli led the organisms to a sustainable response remains subject to further research.

Unfortunately, the international comparison with Aagerup and Nilsson´s experiment cannot be straightforward and systematic, as the authors do not present a proportion of Fairtrade preference in the whole data set, reporting only preference percentages for two unequally small groups of conspicuous and inconspicuous consumption (83 and 43%, respectively). However, if they were divided into halves, it would mean that Fairtrade was preferred by 63% of Swedish participants (presumably in 2015; the date of the experiment is not given) compared to 70.4% of Czech participants (in 2022). Moreover, for the group of inconspicuous consumption, the difference between the two countries is even more obvious, with Fairtrade products being preferred by 69.03% of Czech and 43% of Swedish consumers.

Assuming that consumers in developed Western countries are typically more inclined towards SCB (Tyson et al., 2021; Adnan et al., 2022) and that the age of the participants is comparable in both surveys (21–33 years in the Swedish study and 19–25 years in the present data set), it can be argued that the attitude regarding sustainability has been evolving (over at least the last seven years) on a more global scale (Tyson et al., 2021). This positive attitude may not be decisively determined by the age of the consumers, but rather by their generational affiliation. Generation participants, who participated in Aagerup and Nilsson’s research project, were replaced seven years later by participants recruited from Generation Z (Průša and Sadílek, 2019) who are said to be more environmentally friendly than the others (Tyson et al., 2021). Different sizes of the research data set – 52 Swedish vs 203 Czech participants – may also play their role.

Differences between products (“Swedish coffee” vs “Czech chocolate”) may also affect their reflection of social status, as claimed by e.g. Papista et al. (2017). The results may be affected by the price of the product bought as well. In 2015, the average exchange rate was 1 SEK = 2.917 CZK (Czech National Bank, 2023), which translates to Aagerup and Nilsson selling their Fairtrade coffee for 29 CZK, whereas the present 2022 experiment charged 10 CZK for a very small bar of Fairtrade chocolate. The price of the regular product was half the Fairtrade price in both research cases. Too small an amount to be paid for normal chocolate could have made the Czech participants buy sustainably (However, the price of coffee in the Swedish experiment was also rather low).

The outcomes of this paper indicate a growing tendency to buy Fairtrade products only at affordable prices (see Table 5). Contrary to warnings that reducing the price of sustainable products might lead to a lower social status of the buyer, and therefore lower demand (Braun Kohlová and Urban, 2020), this research shows that price affordability can encourage young people to buy sustainably.

The choice of a Fairtrade product could have also been prompted by the principles of sustainability permeating the courses taught at the Czech university. Despite certain drawbacks, the experiment participants tended quite clearly to buy sustainably. This also has managerial implications, as Generation Z – entering the productive age – can be expected to lean towards sustainable products. They even have the potential to make their peers and fellow citizens behave sustainably (Adnan et al., 2022).

The added value of our experiment lies in its design and execution, distinguishing it from mere imitation of Aagerup and Nilsson´s (2016) study. The following shortcomings were put aside: (1) Aagerup and Nilsson´s study 1 (experiment) involved a relatively small number of participants (52). (2) Their study 2 (182 participants) was a questionnaire only, not an experiment. (3) Participants of Aagerup and Nilsson´s study were exposed to both conspicuous and inconspicuous scenarios. Our participants were engaged in only one scenario (either conspicuous or inconspicuous) and therefore did not feel the need to behave differently under different scenarios.

The entry of consumers born after 2000 into the market is a challenge and an opportunity for both producers and retailers. In this research, no support was found for the motivational impact of conspicuous SCB on young shoppers to buy sustainably, no moderating effects of higher self-monitoring and ATSCI have been revealed either.

The results show that there is no practically significant difference between conspicuous and non-conspicuous consumption for young consumers in this context. The present experimental survey therefore suggests that there is no point in investing in the visibility of SCB within this target group, and that attention should be focused on the design and implementation of other factors that should be researched. There is also no sense in focusing on people with higher self-monitoring or ATSCI, and supporting them in showing off by buying sustainable products as the anticipated moderating effect was not found.

The study's findings are useful for Fairtrade brand managers as it can help them adjust their marketing strategies to improve brand communication. This suggests that as young consumers are not motivated to buy Fairtrade chocolate based on a desire to stand out or signal status, marketing efforts should focus on other values rather than emphasising visibility or status associated with Fairtrade products. Nevertheless, the analysed data supports the assumption that Czech Generation Z members tend to buy sustainable products whose affordability is important to them. Therefore, producers and retailers should address this target group and exploit its considerable consumer potential. They can also use their influence on other target groups.

Another important issue is the price affordability of sustainable products, as the results of our research show that too high an absolute difference between prices of regular and sustainable products, would discourage young consumers from purchasing the more expensive one.

This paper outlined a theoretical model of ATSCI and self-monitoring personality variables, whose hypothesised effect on conspicuous and inconspicuous SCB was assessed. Firstly, this research extends theoretical insight into the moderating effect of ATSCI and self-monitoring on the relationship between anticipated conspicuousness and SCB. Secondly, it expands knowledge about the consumption of sustainable products (Fairtrade chocolate specifically), and the influence of sustainability on the purchase decisions of young consumers – i.e. the age cohort that will be the main driver of consumption in the upcoming decades. Thirdly, the theoretical reflection of the first experimental test of SCB in a post-communist country – the Czech Republic combining the cross-cultural influence of Western and Eastern Europe – is also beneficial.

Having been mentioned throughout the discussion above, the limitations of this study are only briefly summarised here. Not representing potentially different attitudes of other layers of Generation Z, the data set of participants recruited from only one Prague-based university accounts for an apparent weakness. The results could also be affected by the relatively low price of the tested eco-product (and the correspondingly very small size of the chocolate bar). Moreover, the participants were given the money to pay for it, thus not being tempted to “optimize” the transaction costs. In addition, the price difference between sustainable and regular products was very low, with the questionnaire survey eventually indicating that if the price were to increase substantially, consumer behaviour would become less sustainable. The majority of participants who bought Fairtrade chocolate declared that they would not buy the sustainable product if the difference was 50 CZK and higher, given that the Fairtrade product costs twice as much as the normal one.

It would be useful to conduct identical experiments at various universities to detect the differences across the fields of study (e.g. technical vs social sciences). To better mimic a real-life situation, participants in the field experiment should pay with their own money for a product of a reasonable size, and a higher price difference between its Fairtrade and regular version. A qualitative method of research (in-depth interviews) could also help to understand.

Future research should aim to analyse this phenomenon through the lens of signalling theory (Gomes et al., 2023). Additionally, it would be valuable to expand the scope to encompass personal and social factors that shape pro-environmental concerns and behavior (Gifford and Nilsson, 2014).

It is recommended that future studies broaden the participant data set beyond university students, to include a more diverse group representative of the general workforce. It would also be beneficial to increase the data set size in future research, to enhance the generalisability of the findings.

In the long term, a cross-country research project implementing a single methodology that would enable relevant comparison of data and results could measure SCB on an international scale.

This study revealed that Czech Gen Z is inclined to buy sustainably, at least in the case of favourable price affordability. Contrary to expectations, the conspicuousness of SCB seems not to be a decisive factor in WTP for Fairtrade chocolate by Czech Generation Z members, self-monitoring and ATSCI not having any moderating effect. Other stimuli shaping SCB should, therefore, become the subject of further experiments supplemented by qualitative research.

The authors would like to acknowledge the funding provided by the Technology Agency of the Czech Republic (No: TQ01000183), titled “Promoting behavioural change in Generation Z and designing interventions to prevent food waste, including evaluation of their impact” and the support provided by the Faculty of Informatics and Statistics of the Prague University of Economics and Business (No: IP400040).
Aagerup
,
U.
and
Nilsson
,
J.
(
2016
), “
Green consumer behaviour: being good or seeming good?
”,
The Journal of Product and Brand Management
, Vol. 
25
No. 
3
, pp. 
274
-
284
, doi: .
Adnan
,
A.
,
Ahmad
,
A.
and
Khan
,
M.N.
(
2022
), “
Consumer lifestyles and ecological behaviour: a study of car buyers in India
”,
Business Strategy and the Environment
, Vol. 
32
No. 
4
, pp. 
1752
-
1764
, doi: .
Asmalovskij
,
A.
and
Sadílek
,
T.
(
2016
), “
Food quality perception in the Czech Republic: trial study results
”,
Ukranian food journal
, Vol. 
5
No. 
1
, pp. 
186
-
194
.
Attanasio
,
G.
,
Preghenella
,
N.
,
De Toni
,
A.F.
and
Battistella
,
C.
(
2021
), “
Stakeholder engagement in business models for sustainability: the stakeholder value flow model for sustainable development
”,
Business Strategy and the Environment
, Vol. 
31
No. 
3
, pp. 
860
-
874
, doi: .
Attiq
,
S.
and
Azam
,
R.i.
(
2015
), “
Attention to social comparison information and compulsive buying behaviour: an S-O-R analysis
”,
Journal of Behavioural Sciences
, Vol. 
25
No. 
1
, pp. 
39
-
58
.
Braun Kohlová
,
M.
and
Urban
,
J.
(
2020
), “
Buy green, gain prestige and social status
”,
Journal of Environmental Psychology
, Vol. 
69
, 101416, doi: .
Čábelková
,
I.
,
Smutka
,
L.
and
Strielkowski
,
W.
(
2021
), “
Public support for sustainable development and environmental policy: a case of the Czech Republic
”,
Sustainable Development
, Vol. 
30
No. 
1
, pp. 
110
-
126
, doi: .
Caniëls
,
M.C.
,
Lambrechts
,
W.
,
Platje
,
J.
,
Motylska-Kuźma
,
A.
and
Fortuński
,
B.
(
2021
), “
Impressing my friends: the role of social value in green purchasing attitude for youthful consumers
”,
Journal of Cleaner Production
, Vol. 
303
, 126993, doi: .
Costa Pinto
,
D.
,
Maurer Herter
,
M.
,
Rossi
,
P.
,
Meucci Nique
,
W.
and
Borges
,
A.
(
2019
), “
Recycling cooperation and buying status
”,
European Journal of Marketing
, Vol. 
53
No. 
5
, pp. 
944
-
971
, doi: .
Czech National Bank
(
2023
), “
Czech National Bank
”,
available at:
 https://www.cnb.cz/en (
accessed
 2 March 2023).
Del Prete
,
M.
and
Samoggia
,
A.
(
2020
), “
Chocolate consumption and purchasing behaviour review: research issues and insights for future research
”,
Sustainability
, Vol. 
12
No. 
14
, p.
5586
, doi: .
Essiz
,
O.
and
Mandrik
,
C.
(
2022
), “
Intergenerational influence on sustainable consumer attitudes and behaviours: roles of family communication and peer influence in environmental consumer socialization
”,
Psychology and Marketing
, Vol. 
39
No. 
1
, pp. 
5
-
26
, doi: .
Falcão
,
D.
and
Roseira
,
C.
(
2022
), “
Mapping the socially responsible consumption gap research: review and future research agenda
”,
International Journal of Consumer Studies
, Vol. 
46
No. 
5
, pp. 
1718
-
1760
, doi: .
Friedrichsen
,
J.
and
Engelmann
,
D.
(
2018
), “
Who cares about social image
”,
European Economic Review
, Vol. 
110
, pp. 
61
-
77
, doi: .
Gandhi
,
A.V.
(
2020
), “
Studying green consumer behaviour through multiple lenses in a developing country
”,
Smart and Sustainable Built Environment
, Vol. 
10
No. 
2
, pp. 
274
-
292
, doi: .
Ghorban Nejad
,
S.
and
Hansen
,
H.
(
2021
), “
Environmentally motivated travel reduction: the effects of availability, herding bias, and self-monitoring
”,
Sustainability
, Vol. 
13
No. 
2
, p.
691
, doi: .
Gifford
,
R.
and
Nilsson
,
A.
(
2014
), “
Personal and social factors that influence pro-environmental concern and behaviour: a review
”,
International Journal of Psychology
, Vol. 
49
No. 
3
, pp. 
141
-
157
, doi: .
Gomes
,
S.
,
Lopes
,
J.M.
and
Nogueira
,
S.
(
2023
), “
Willingness to pay more for green products: a critical challenge for Gen Z
”,
Journal of Cleaner Production
, Vol. 
390
, 136092, doi: .
Greenland
,
S.
(
2019
), “
Valid p-values behave exactly as they should: some misleading criticisms of p-values and their resolution with S-values
”,
The American Statistician
, Vol. 
73
No. 
1
, pp. 
106
-
114
, doi: .
Kossmann
,
E.
and
Gomez-Suarez
,
M.
(
2019
), “
Words-deeds gap for the purchase of Fairtrade products: a systematic literature review
”,
Frontiers in Psychology
, Vol. 
10
, 2705, doi: .
Laos-Espinoza
,
J.
,
Juaneda-Ayensa
,
E.
,
García-Milon
,
A.
and
Olarte-Pascual
,
C.
(
2024
), “
Why do you want an organic coffee? Self-care vs world-care: a new SOR model approach to explain organic product purchase intentions of Spanish consumers
”,
Fooy and Preference
, Vol. 
118
, 105203, doi: .
Lennox
,
R.D.
and
Wolfe
,
R.N.
(
1984
), “
Revision of the self-monitoring scale
”,
Journal of Personality and Social Psychology
, Vol. 
46
No. 
6
, pp. 
1349
-
1364
, doi: .
Lu
,
Y.
,
Wang
,
Z.
,
Yang
,
D.
and
Kakuda
,
N.
(
2021
), “
To be or not to be equal: the impact of pride on brands associated with dissociative out-groups
”,
The Journal of Product and Brand Management
, Vol. 
31
No. 
1
, pp. 
127
-
148
, doi: .
McShane
,
B.B.
,
Gal
,
D.
,
Gelman
,
A.
,
Robert
,
C.
and
Tackett
,
J.L.
(
2019
), “
Abandon statistical significance
”,
The American Statistician
, Vol. 
73
No. 
s1
, pp. 
235
-
245
, doi: .
Mehrabian
,
A.
and
Russell
,
J.A.
(
1974
),
An Approach to Environmental Psychology
,
MIT Press (MA)
.
O'Cass
,
A.
(
2000
), “
A psychometric evaluation of a revised version of the Lennox and Wolfe revised self-monitoring scale
”,
Psychology and Marketing
, Vol. 
17
No. 
5
, pp. 
397
-
419
, doi: .
Papista
,
E.
and
Dimitriadis
,
S.
(
2019
), “
Consumer – green brand relationships: revisiting benefits, relationship quality and outcomes
”,
The Journal of Product and Brand Management
, Vol. 
28
No. 
2
, pp. 
166
-
187
, doi: .
Papista
,
E.
,
Chrysochou
,
P.
,
Krystallis
,
A.
and
Dimitriadis
,
S.
(
2017
), “
Types of value and cost in consumer-green brands relationship and loyalty behaviour
”,
Journal of Consumer Behaviour
, Vol. 
17
No. 
1
, pp. 
e101
-
e113
, doi: .
Průša
,
P.
and
Sadílek
,
T.
(
2019
), “
Green consumer behaviour: the case of Czech consumers of generation Y
”,
Social Marketing Quarterly
, Vol. 
25
No. 
4
, pp. 
243
-
255
, doi: .
Sahin
,
O.
and
Nasir
,
S.
(
2021
), “
The effects of status consumption and conspicuous consumption on perceived symbolic status
”,
Journal of Marketing Theory and Practice
, Vol. 
30
No. 
1
, pp. 
68
-
85
, doi: .
Shao
,
S.
,
Hu
,
Z.
,
Cao
,
J.
,
Yang
,
L.
and
Guan
,
D.
(
2020
), “
Environmental regulation and enterprise innovation: a review
”,
Business Strategy and the Environment
, Vol. 
29
No. 
3
, pp. 
1465
-
1478
, doi: .
Siddiqui
,
S.A.
,
Karim
,
I.
,
Shahiya
,
C.
,
Shityakov
,
S.
,
Nugraha
,
W.S.
and
Kasza
,
G.
(
2024
), “
A critical review of consumer responsibility in promoting sustainable cocoa production
”,
Current Research in Food Science
, Vol. 
9
, 100818, doi: .
Snyder
,
M.
(
1974
), “
Self-monitoring of expressive behaviour
”,
Journal of Personality and Social Psychology
, Vol. 
30
No. 
4
, pp. 
526
-
537
, doi: .
Snyder
,
M.
and
Gangestad
,
S.
(
1986
), “
On the nature of self-monitoring: matters of assessment, matters of validity
”,
Journal of Personality and Social Psychology
, Vol. 
51
No. 
1
, pp. 
125
-
139
, doi: .
Tyson
,
A.
,
Kennedy
,
B.
and
Funk
,
C.
(
2021
), “
Gen Z, millennials stand out for climate change activism, social media engagement with issue
”,
Pew Research Center Science and Society
,
available at:
 https://www.pewresearch.org/science/2021/05/26/climate-and-generations-acknowledgments/ (
accessed
 1 March 2023).
Utama
,
A.P.
,
Sumarwan
,
U.
,
Suroso
,
A.I.
and
Najib
,
M.
(
2021
), “
Influences of product attributes and lifestyles on consumer behavior: a case study of coffee consumption in Indonesia
”,
Journal of Asian Finance Economics and Business
, Vol. 
8
No. 
5
, pp. 
939
-
950
.
Van der Wal
,
A.J.
,
Van Horen
,
F.
and
Grinstein
,
A.
(
2018
), “
Temporal myopia in sustainable behaviour under uncertainty
”,
International Journal of Research in Marketing
, Vol. 
35
No. 
3
, pp. 
378
-
393
, doi: .
Velcovská
,
Š.
and
Sadílek
,
T.
(
2014
), “
The system of the geographical indication – important component of the politics of the consumers' protection in European union
”,
Amfiteatru Economic
, Vol. 
16
No. 
35
, pp. 
228
-
242
.
Wenting
,
F.
,
Lijia
,
W.
and
Cuixin
,
G.
(
2022
), “
The influence of social crowding on consumers' preference for green products
”,
Frontiers in Psychology
, Vol. 
13
, 832869, doi: .
Yoon
,
H.J.
,
La Ferle
,
C.
and
Edwards
,
S.M.
(
2016
), “
A normative approach to motivating savings behaviour: the moderating effects of attention to social comparison information
”,
International Journal of Advertising
, Vol. 
35
No. 
5
, pp. 
799
-
822
, doi: .
Yue
,
B.
,
Sheng
,
G.
,
She
,
S.
and
Xu
,
J.
(
2020
), “
Impact of consumer environmental responsibility on green consumption behavior in China: the role of environmental concern and price sensitivity
”,
Sustainability
, Vol. 
12
No. 
5
, p.
2074
, doi: .
Zerbini
,
C.
,
Vergura
,
D.T.
and
Luceri
,
B.
(
2019
), “
How fair-trade claims and emotional empathy affect the consumer's propensity to buy fair chocolate?
”,
British Food Journal
, Vol. 
121
No. 
7
, pp. 
1605
-
1613
, doi: .
Zhang
,
B.
,
Fu
,
Z.
,
Huang
,
J.
,
Wang
,
J.
,
Xu
,
S.
and
Zhang
,
L.
(
2018
), “
Consumers' perceptions, purchase intention, and willingness to pay a premium price for safe vegetables: a case study of Beijing, China
”,
Journal of Cleaner Production
, Vol. 
197
, pp. 
1498
-
1507
, doi: .
Zheng
,
X.
,
Xu
,
J.
and
Shen
,
H.
(
2022
), “
To be respected or liked: the influence of social comparisons on consumer preference for competence- versus warmth-oriented products
”,
International Journal of Research in Marketing
, Vol. 
39
No. 
1
, pp. 
170
-
189
, doi: .
Zou
,
L.W.
and
Chan
,
R.Y.
(
2019
), “
Why and when do consumers perform green behaviours? An examination of regulatory focus and ethical ideology
”,
Journal of Business Research
, Vol. 
94
, pp. 
113
-
127
, doi: .
Zucchella
,
A.
and
Previtali
,
P.
(
2018
), “
Circular business models for sustainable development: a “waste is food” restorative ecosystem
”,
Business Strategy and the Environment
, Vol. 
28
No. 
2
, pp. 
274
-
285
, doi: .
Published by Emerald Publishing Limited. This article is published under the Creative Commons Attribution (CC BY 4.0) licence. Anyone may reproduce, distribute, translate and create derivative works of this article (for both commercial and non-commercial purposes), subject to full attribution to the original publication and authors. The full terms of this licence may be seen at http://creativecommons.org/licences/by/4.0/legalcode

Data & Figures

Figure 1
A conceptual model shows stimulus, organism, and response boxes connected by arrows labeled H 1, H 2, and H 3.The model shows a box titled “STIMULUS”, and inside this box, the listed points are as follows: “Sustainability”, “Fair Trade”, and “Society expectation”. From “STIMULUS”, a double-headed arrow is raised and extends rightward and points to a text box in a vertical orientation titled “ORGANISM”, with the following points listed inside the box as follows, “Conspicuous versus inconspicuous consumption”, “Conspicuous consumption plus Self-monitoring”, and “Conspicuous consumption plus A T S C I”. From “Conspicuous versus inconspicuous consumption”, a double-headed arrow labeled “H 1” is raised and extends rightward and points to a text box titled “RESPONSE”, which contains the following text inside it, “Willingness to pay”. From “Conspicuous consumption plus Self-monitoring”, a double-headed arrow labeled “H 2” is raised and extends rightward and points to “RESPONSE”. From “Conspicuous consumption plus A T S C I”, a double-headed arrow labeled “H 3” is raised and extends rightward and points to “RESPONSE”. At the bottom left, a text reads “Source(s): Authors’ own work”.

Conceptual model

Figure 1
A conceptual model shows stimulus, organism, and response boxes connected by arrows labeled H 1, H 2, and H 3.The model shows a box titled “STIMULUS”, and inside this box, the listed points are as follows: “Sustainability”, “Fair Trade”, and “Society expectation”. From “STIMULUS”, a double-headed arrow is raised and extends rightward and points to a text box in a vertical orientation titled “ORGANISM”, with the following points listed inside the box as follows, “Conspicuous versus inconspicuous consumption”, “Conspicuous consumption plus Self-monitoring”, and “Conspicuous consumption plus A T S C I”. From “Conspicuous versus inconspicuous consumption”, a double-headed arrow labeled “H 1” is raised and extends rightward and points to a text box titled “RESPONSE”, which contains the following text inside it, “Willingness to pay”. From “Conspicuous consumption plus Self-monitoring”, a double-headed arrow labeled “H 2” is raised and extends rightward and points to “RESPONSE”. From “Conspicuous consumption plus A T S C I”, a double-headed arrow labeled “H 3” is raised and extends rightward and points to “RESPONSE”. At the bottom left, a text reads “Source(s): Authors’ own work”.

Conceptual model

Close modal
Figure 2
A figure shows four bar graphs comparing fairtrade and normal chocolate by conspicuousness range.The figure shows four graphs arranged in two rows, with two graphs in each row. The vertical axis in all four graphs is labeled “Relative frequency”, ranging from 0 percent to 100 percent. The horizontal axis is labeled “Conspicuousness”, with two categories labeled “i” on the left and “C.” on the right. Each graph contains two vertically stacked bars representing different categories of chocolate consumption labeled in the legend on the right as “fairtrade” and “normal”. The “fairtrade” category is represented by a grey shade at the top, while the “normal” category is shown in white at the bottom. Each graph corresponds to a specific range of conspicuousness values indicated at the top of each panel. The ranges and their respective data are as follows. The top-left graph corresponds to the range “(1.33, 4.00)”. For “i”, fairtrade chocolate is 59.09 percent and normal chocolate is 40.91 percent. For “C.”, fairtrade chocolate is 62.50 percent and normal chocolate is 37.50 percent. The top-right graph corresponds to the range “(4.00, 5.00)”. For “i”, fairtrade chocolate is 65.62 percent and normal chocolate is 34.38 percent. For “C.”, fairtrade chocolate is 84.00 percent and normal chocolate is 16.00 percent. The bottom-left graph corresponds to the range “(5.00, 5.67)”. For “i”, fairtrade chocolate is 80.00 percent and normal chocolate is 20.00 percent. For “C.”, fairtrade chocolate is 76.19 percent and normal chocolate is 23.81 percent. The bottom-right graph corresponds to the range “(5.67, 7.00)”. For “i”, fairtrade chocolate is 67.86 percent and normal chocolate is 32.14 percent. For “C.”, fairtrade chocolate is 64.29 percent and normal chocolate is 35.71 percent. Note: All numerical data values are approximated.

Partial relationship between consumption conspicuousness and type of chocolate smoothed from self-monitoring

Figure 2
A figure shows four bar graphs comparing fairtrade and normal chocolate by conspicuousness range.The figure shows four graphs arranged in two rows, with two graphs in each row. The vertical axis in all four graphs is labeled “Relative frequency”, ranging from 0 percent to 100 percent. The horizontal axis is labeled “Conspicuousness”, with two categories labeled “i” on the left and “C.” on the right. Each graph contains two vertically stacked bars representing different categories of chocolate consumption labeled in the legend on the right as “fairtrade” and “normal”. The “fairtrade” category is represented by a grey shade at the top, while the “normal” category is shown in white at the bottom. Each graph corresponds to a specific range of conspicuousness values indicated at the top of each panel. The ranges and their respective data are as follows. The top-left graph corresponds to the range “(1.33, 4.00)”. For “i”, fairtrade chocolate is 59.09 percent and normal chocolate is 40.91 percent. For “C.”, fairtrade chocolate is 62.50 percent and normal chocolate is 37.50 percent. The top-right graph corresponds to the range “(4.00, 5.00)”. For “i”, fairtrade chocolate is 65.62 percent and normal chocolate is 34.38 percent. For “C.”, fairtrade chocolate is 84.00 percent and normal chocolate is 16.00 percent. The bottom-left graph corresponds to the range “(5.00, 5.67)”. For “i”, fairtrade chocolate is 80.00 percent and normal chocolate is 20.00 percent. For “C.”, fairtrade chocolate is 76.19 percent and normal chocolate is 23.81 percent. The bottom-right graph corresponds to the range “(5.67, 7.00)”. For “i”, fairtrade chocolate is 67.86 percent and normal chocolate is 32.14 percent. For “C.”, fairtrade chocolate is 64.29 percent and normal chocolate is 35.71 percent. Note: All numerical data values are approximated.

Partial relationship between consumption conspicuousness and type of chocolate smoothed from self-monitoring

Close modal
Figure 3
Two graphs show fairtrade and normal chocolate density by self-monitoring for inconspicuous and conspicuous groups.The two graphs are shown side by side. The graph on the left is labeled “Inconspicuous”, and the graph on the right is labeled “Conspicuous”. In both graphs, the horizontal axis is labeled “Self-monitoring” and ranges from 2 to 6 in increments of 2 units. The vertical axis is labeled “Density” and ranges from 0.0 to 0.3 in increments of 0.1. Each graph contains two curves. The dark black curve represents “fairtrade” chocolate, and the light gray curve represents “normal” chocolate, as indicated by the legend located on the right side of the graphs labeled “Chocolate”. In the “Inconspicuous” graph, the “fairtrade” curve begins at (1.3, 0.0), rises steeply in a concave-up manner, reaches a peak at (5.16, 0.37), and declines gradually with a decreasing slope, ending at (7, 0.05). The “normal” curve starts at (1.3, 0.03), rises smoothly in a concave-up manner to a lower peak near the self-monitoring value of (4.6, 0.26), and then descends gradually toward (7, 0.08). A vertical gray dashed line is drawn at the point 4.62 on the horizontal axis, and a dashed black line is drawn at the point 4.88 on the horizontal axis. In the “Conspicuous” graph, the “fairtrade” curve begins at (1.3, 0.01), rises steeply in a concave-up manner, reaches a peak at (4.86, 0.32), and declines gradually with a decreasing slope, ending at (7, 0.06). The “normal” curve starts at (1, 0.03), rises smoothly in a concave-up manner to a lower peak near the self-monitoring value of (5.45, 0.24), and then descends gradually toward (7, 0.13). A vertical gray dashed line is drawn at the point 4.95 on the horizontal axis, and a dashed black line is drawn at the point 4.81 on the horizontal axis. Two dashed vertical lines are plotted in each panel to mark mean positions for “fairtrade” (black dashed line) and “normal” (grey dashed line). Note: All numerical data values are approximated.

Partial relationship between self-monitoring and chocolate kind, smoothed by conspicuousness; the vertical dashed lines show the arithmetic means

Figure 3
Two graphs show fairtrade and normal chocolate density by self-monitoring for inconspicuous and conspicuous groups.The two graphs are shown side by side. The graph on the left is labeled “Inconspicuous”, and the graph on the right is labeled “Conspicuous”. In both graphs, the horizontal axis is labeled “Self-monitoring” and ranges from 2 to 6 in increments of 2 units. The vertical axis is labeled “Density” and ranges from 0.0 to 0.3 in increments of 0.1. Each graph contains two curves. The dark black curve represents “fairtrade” chocolate, and the light gray curve represents “normal” chocolate, as indicated by the legend located on the right side of the graphs labeled “Chocolate”. In the “Inconspicuous” graph, the “fairtrade” curve begins at (1.3, 0.0), rises steeply in a concave-up manner, reaches a peak at (5.16, 0.37), and declines gradually with a decreasing slope, ending at (7, 0.05). The “normal” curve starts at (1.3, 0.03), rises smoothly in a concave-up manner to a lower peak near the self-monitoring value of (4.6, 0.26), and then descends gradually toward (7, 0.08). A vertical gray dashed line is drawn at the point 4.62 on the horizontal axis, and a dashed black line is drawn at the point 4.88 on the horizontal axis. In the “Conspicuous” graph, the “fairtrade” curve begins at (1.3, 0.01), rises steeply in a concave-up manner, reaches a peak at (4.86, 0.32), and declines gradually with a decreasing slope, ending at (7, 0.06). The “normal” curve starts at (1, 0.03), rises smoothly in a concave-up manner to a lower peak near the self-monitoring value of (5.45, 0.24), and then descends gradually toward (7, 0.13). A vertical gray dashed line is drawn at the point 4.95 on the horizontal axis, and a dashed black line is drawn at the point 4.81 on the horizontal axis. Two dashed vertical lines are plotted in each panel to mark mean positions for “fairtrade” (black dashed line) and “normal” (grey dashed line). Note: All numerical data values are approximated.

Partial relationship between self-monitoring and chocolate kind, smoothed by conspicuousness; the vertical dashed lines show the arithmetic means

Close modal
Figure 4
Four bar graphs show fairtrade and normal chocolate by conspicuousness range and A T S C I relationship.The figure shows four graphs arranged in two rows, with two graphs in each row. The vertical axis in all four graphs is labeled “Relative frequency”, ranging from 0 percent to 100 percent. The horizontal axis is labeled “Conspicuousness”, with two categories labeled “i” on the left and “C.” on the right. Each graph contains two vertically stacked bars representing different categories of chocolate consumption labeled in the legend on the right as “fairtrade” and “normal”. The “fairtrade” category is represented by a grey shade at the top, while the “normal” category is shown in white at the bottom. Each graph corresponds to a specific range of conspicuousness values indicated at the top of each panel. The ranges and their respective data are as follows. The top-left graph corresponds to the range “(1.00, 3.00)”. For “i”, fairtrade chocolate: 54.17 percent and normal chocolate: 45.83 percent. For “C.”, fairtrade chocolate: 76.00 percent and normal chocolate: 24.00 percent. The top-right graph corresponds to the range “(3.00, 3.75)”. For “i”, fairtrade chocolate: 68.00 percent and normal chocolate: 32.00 percent. For “C.”, fairtrade chocolate: 41.18 percent and normal chocolate: 58.82 percent. The bottom-left graph corresponds to the range “(3.75, 4.50)”. For “i”, fairtrade chocolate: 80.00 percent and normal chocolate: 20.00 percent. For “C.”, fairtrade chocolate: 86.96 percent and normal chocolate: 13.04 percent. The bottom-right graph corresponds to the range “(4.50, 5.75)”. For “i”, fairtrade chocolate: 69.70 percent and normal chocolate: 30.30 percent. For “C.”, fairtrade chocolate: 76.00 percent and normal chocolate: 24.00 percent. Note: All numerical data values are approximated.

Partial relationship between consumption conspicuousness and type of chocolate smoothed from ATSCI

Figure 4
Four bar graphs show fairtrade and normal chocolate by conspicuousness range and A T S C I relationship.The figure shows four graphs arranged in two rows, with two graphs in each row. The vertical axis in all four graphs is labeled “Relative frequency”, ranging from 0 percent to 100 percent. The horizontal axis is labeled “Conspicuousness”, with two categories labeled “i” on the left and “C.” on the right. Each graph contains two vertically stacked bars representing different categories of chocolate consumption labeled in the legend on the right as “fairtrade” and “normal”. The “fairtrade” category is represented by a grey shade at the top, while the “normal” category is shown in white at the bottom. Each graph corresponds to a specific range of conspicuousness values indicated at the top of each panel. The ranges and their respective data are as follows. The top-left graph corresponds to the range “(1.00, 3.00)”. For “i”, fairtrade chocolate: 54.17 percent and normal chocolate: 45.83 percent. For “C.”, fairtrade chocolate: 76.00 percent and normal chocolate: 24.00 percent. The top-right graph corresponds to the range “(3.00, 3.75)”. For “i”, fairtrade chocolate: 68.00 percent and normal chocolate: 32.00 percent. For “C.”, fairtrade chocolate: 41.18 percent and normal chocolate: 58.82 percent. The bottom-left graph corresponds to the range “(3.75, 4.50)”. For “i”, fairtrade chocolate: 80.00 percent and normal chocolate: 20.00 percent. For “C.”, fairtrade chocolate: 86.96 percent and normal chocolate: 13.04 percent. The bottom-right graph corresponds to the range “(4.50, 5.75)”. For “i”, fairtrade chocolate: 69.70 percent and normal chocolate: 30.30 percent. For “C.”, fairtrade chocolate: 76.00 percent and normal chocolate: 24.00 percent. Note: All numerical data values are approximated.

Partial relationship between consumption conspicuousness and type of chocolate smoothed from ATSCI

Close modal
Figure 5
Two graphs show fairtrade and normal chocolate density by A T S C I for inconspicuous and conspicuous groups.The two graphs are shown side by side. The graph on the left is labeled “Inconspicuous”, and the graph on the right is labeled “Conspicuous”. In both graphs, the horizontal axis is labeled “A T S C I” and ranges from 2 to 6 in increments of 2 units. The vertical axis is labeled “Density” and ranges from 0.0 to 0.3 in increments of 0.1. Each graph contains two curves. The dark black curve represents “fairtrade” chocolate, and the light gray curve represents “normal” chocolate, as indicated by the legend located on the right side of the graphs labeled “Chocolate”. In the “Inconspicuous” graph, the “fairtrade” curve begins at (1.01, 0.01), rises steeply in a concave-up manner, reaches a peak around (3.84, 0.33), and declines gradually with a decreasing slope, ending at (6.7, 0.02). The “normal” curve begins at (1.01, 0.06), rises smoothly in a concave-up manner to a lower peak near the A T S C I value of (3.25, 0.25), and then descends gradually, ending near (6.7, 0.04). A vertical gray dashed line is drawn at approximately 3.6 on the horizontal axis, and a black dashed line is drawn at 3.88, indicating the mean A T S C I positions for “normal” and “fairtrade” chocolate, respectively. In the “Conspicuous” graph, the “fairtrade” curve begins near (0.95, 0.04), rises gradually, reaches a peak at (3.95, 0.26), and declines symmetrically, ending close to (6.7, 0.04). The “normal” curve starts around (0.95, 0.04), rises sharply to a higher peak at (3.35, 0.36), and then decreases gradually, reaching near (6.7, 0.03). A vertical gray dashed line is drawn at 3.45 on the horizontal axis, and a black dashed line is drawn at 3.7 on the horizontal axis. Note: All numerical data values are approximated.

Partial relationship between ATSCI and chocolate kind, smoothed by conspicuousness; the vertical dashed lines show the arithmetic means

Figure 5
Two graphs show fairtrade and normal chocolate density by A T S C I for inconspicuous and conspicuous groups.The two graphs are shown side by side. The graph on the left is labeled “Inconspicuous”, and the graph on the right is labeled “Conspicuous”. In both graphs, the horizontal axis is labeled “A T S C I” and ranges from 2 to 6 in increments of 2 units. The vertical axis is labeled “Density” and ranges from 0.0 to 0.3 in increments of 0.1. Each graph contains two curves. The dark black curve represents “fairtrade” chocolate, and the light gray curve represents “normal” chocolate, as indicated by the legend located on the right side of the graphs labeled “Chocolate”. In the “Inconspicuous” graph, the “fairtrade” curve begins at (1.01, 0.01), rises steeply in a concave-up manner, reaches a peak around (3.84, 0.33), and declines gradually with a decreasing slope, ending at (6.7, 0.02). The “normal” curve begins at (1.01, 0.06), rises smoothly in a concave-up manner to a lower peak near the A T S C I value of (3.25, 0.25), and then descends gradually, ending near (6.7, 0.04). A vertical gray dashed line is drawn at approximately 3.6 on the horizontal axis, and a black dashed line is drawn at 3.88, indicating the mean A T S C I positions for “normal” and “fairtrade” chocolate, respectively. In the “Conspicuous” graph, the “fairtrade” curve begins near (0.95, 0.04), rises gradually, reaches a peak at (3.95, 0.26), and declines symmetrically, ending close to (6.7, 0.04). The “normal” curve starts around (0.95, 0.04), rises sharply to a higher peak at (3.35, 0.36), and then decreases gradually, reaching near (6.7, 0.03). A vertical gray dashed line is drawn at 3.45 on the horizontal axis, and a black dashed line is drawn at 3.7 on the horizontal axis. Note: All numerical data values are approximated.

Partial relationship between ATSCI and chocolate kind, smoothed by conspicuousness; the vertical dashed lines show the arithmetic means

Close modal
Figure 5
A figure shows a questionnaire on Fairtrade chocolate and self-monitoring.The figure presents a questionnaire form titled “Chosen questions from the questionnaire related to the experiment”. At the top left, there is a rectangular logo with a blue and green design labeled “FAIRTRADE”. The form is divided into two main sections, “Filled-in by the researcher” and “Filled-in by the respondent”. Under “Filled-in by the researcher”, the first item is “Purchased chocolate”, with the options “a. Fairtrade chocolate” and “b. ordinary chocolate”. The second item is “Type of the experiment”, with the options “a. conspicuous” and “b. Inconspicuous”. Under “Filled-in by the respondent”, the first question is labeled “1.” and reads, “At which price ratio (normal or fair trade chocolate) would you prefer the normal chocolate over the Fairtrade chocolate (in case of the same or similar experiment as you do today)”. It includes multiple-choice options labeled “a) 5 or 10 C Z K”, “b) 10 or 20 C Z K”, “c) 20 or 40 C Z K”, “d) 50 or 100 C Z K”, “e) 100 or 200 C Z K”, “f) 150 or 300 C Z K”, and “g) I would always prefer the Fairtrade chocolate”. The second question is labeled “2.” and reads, “How much do you agree with the following statements? (1 - never true, 7 - always true)”. A series of behavioral and self-monitoring statements follow, each accompanied by a seven-point Likert scale numbered from “1” on the left to “7” on the right, represented horizontally. The first statement reads, “At parties I usually try to behave in a manner that makes me fit in”. The second statement reads, “When I am uncertain how to act in a social situation, I look to the behavior of others for cues”, which is noted as used reversed in data evaluation. The third statement reads, “I try to pay attention to the reactions of others to my behavior in order to avoid being out of place”. The fourth statement reads, “It is my feeling that if everyone else in a group behaves in a certain manner, this must be the proper way to behave”. The fifth statement reads, “In social situations, I have the ability to alter my behavior if I feel something else is called for”. The sixth statement reads, “I have trouble changing my behavior to suit different people and situations”, which is reversed. The seventh statement reads, “I have found that I can adjust my behavior to meet the requirements of any situation I find myself in”. Each statement includes a printed rating scale directly below it, numbered from “1” on the left to “7” on the right.

Partial relationship between ATSCI and chocolate kind, smoothed by conspicuousness; the vertical dashed lines show the arithmetic means

Figure 5
A figure shows a questionnaire on Fairtrade chocolate and self-monitoring.The figure presents a questionnaire form titled “Chosen questions from the questionnaire related to the experiment”. At the top left, there is a rectangular logo with a blue and green design labeled “FAIRTRADE”. The form is divided into two main sections, “Filled-in by the researcher” and “Filled-in by the respondent”. Under “Filled-in by the researcher”, the first item is “Purchased chocolate”, with the options “a. Fairtrade chocolate” and “b. ordinary chocolate”. The second item is “Type of the experiment”, with the options “a. conspicuous” and “b. Inconspicuous”. Under “Filled-in by the respondent”, the first question is labeled “1.” and reads, “At which price ratio (normal or fair trade chocolate) would you prefer the normal chocolate over the Fairtrade chocolate (in case of the same or similar experiment as you do today)”. It includes multiple-choice options labeled “a) 5 or 10 C Z K”, “b) 10 or 20 C Z K”, “c) 20 or 40 C Z K”, “d) 50 or 100 C Z K”, “e) 100 or 200 C Z K”, “f) 150 or 300 C Z K”, and “g) I would always prefer the Fairtrade chocolate”. The second question is labeled “2.” and reads, “How much do you agree with the following statements? (1 - never true, 7 - always true)”. A series of behavioral and self-monitoring statements follow, each accompanied by a seven-point Likert scale numbered from “1” on the left to “7” on the right, represented horizontally. The first statement reads, “At parties I usually try to behave in a manner that makes me fit in”. The second statement reads, “When I am uncertain how to act in a social situation, I look to the behavior of others for cues”, which is noted as used reversed in data evaluation. The third statement reads, “I try to pay attention to the reactions of others to my behavior in order to avoid being out of place”. The fourth statement reads, “It is my feeling that if everyone else in a group behaves in a certain manner, this must be the proper way to behave”. The fifth statement reads, “In social situations, I have the ability to alter my behavior if I feel something else is called for”. The sixth statement reads, “I have trouble changing my behavior to suit different people and situations”, which is reversed. The seventh statement reads, “I have found that I can adjust my behavior to meet the requirements of any situation I find myself in”. Each statement includes a printed rating scale directly below it, numbered from “1” on the left to “7” on the right.

Partial relationship between ATSCI and chocolate kind, smoothed by conspicuousness; the vertical dashed lines show the arithmetic means

Close modal
Table 1

List of logistic regression models

Data setResponse variable (Y)Explanatory variable(s)Assumed data-generating processLogit
Model 1All participantsChocolate (0 = regular, 1 = Fairtrade)Dummy for conspicuousness (I = 0, C = 1), CYi follows Bernoulli distribution, i = 1, 2, …, nβ0 + β1*C
Model 2All participantsChocolate (0 = regular, 1 = Fairtrade)C and self-monitoringYi follows Bernoulli distribution, i = 1, 2, …, nβ0 + β1*C + β2*self_mon + β3*C*self_mon
Model 3Only conspicuousChocolate (0 = regular, 1 = Fairtrade)Self-monitoringYi follows Bernoulli distribution, i = 1, 2, …, nβ0 + β1*self_mon
Model 4All participantsChocolate (0 = regular, 1 = Fairtrade)C and ATSCIYi follows Bernoulli distribution, i = 1, 2, …, nβ0 + β1*C + β2*ATSCI

Source(s): Authors’ own work

Table 2

List of theoretical assumptions for the validity of employed statistical inference tools

Statistical inference toolAssumptionDiscussion
Pearson's chi-squared testA random sample from the population of interestNot satisfied
Large sampleSatisfied
Logistic regression models: t-tests, confidence intervalsLogits as in Table 1 Unknown/uncertain

Source(s): Authors’ own work

Table 3

Conspicuousness-conditioned frequencies and relative frequencies of the chocolate kind

ChocolateInconspicuousConspicuous
CountRel. Freq.CountRel. Freq.
Fairtrade7869.03%6572.22%
Regular3530.97%2527.78%

Source(s): Authors’ own work

Table 4

Logistic regression model – Model 1

Model 1Estimated reg. Par.Estimated odds ratioStd. Errorz-valuePr (>|z|)
(Intercept)0.8014 0.20353.9398.19E−05
C (conspicuous)0.15421.16670.31110.4960.62
Model 195% confidence interval (lower and upper limits)
Estimated reg. Par.Estimated odds ratio
C (conspicuous)−0.45270.77050.63592.1609

Source(s): Authors’ own work

Table 5

Relative frequencies of the lowest price difference for changing the decision from Fairtrade chocolate to normal chocolate

Price differenceInconspicuousConspicuousTotalInconspicuous (cumulative)Conspicuous (cumulative)Total
5 CZK2.56%3.13%2.82%2.56%3.13%2.82%
10 CZK6.41%7.81%7.04%8.97%10.94%9.86%
20 CZK29.49%23.44%26.76%38.46%34.38%36.62%
50 CZK38.46%40.63%39.44%76.92%75.00%76.06%
100 CZK10.26%15.63%12.68%87.18%90.63%88.73%
150 CZK8.97%6.25%7.75%96.15%96.88%96.48%
never3.85%3.13%3.52%100.00%100.00%100.00%
 100.00%100.00%100.00%100.00%100.00%100.00%

Source(s): Authors’ own work

Table 6

Logistic regression model – Model 2 (and Model 3)

Model 2Estimated reg. ParEstimated odds ratioStd. Errorz-valuePr (>|z|)
(Intercept)−0.3782 0.9615−0.3930.694
C (conspicuous)1.8758 1.44271.3000.194
self_mon0.24561.27840.19961.2300.219
C:self_mon−0.3567 0.2925−1.2200.223
Model 2, Model 3Estimated reg. Par.Estimated odds ratio95% confidence interval (lower and upper limits)
Estimated reg. Par.Estimated odds ratio
 Inconspicuous group (Model 2)
Self-monitoring0.24561.2784−0.14340.64660.86641.9091
 Conspicuous group (Model 2 and Model 3)
Self-monitoring−0.11110.8948−0.54230.30390.58141.3551

Source(s): Authors’ own work

Table 7

Logistic regression model – Model 4

Model 4Estimated reg. Par.Estimated odds ratioStd. Errorz-valuePr (>|z|)
(Intercept)0.0211 0.54450.0390.969
C (conspicuous)0.1850 0.31350.5900.555
ATSCI0.20461.22700.13621.5020.133
Model 4Estimated reg. Par.Estimated odds ratio95% confidence interval (lower and upper limits)
Estimated reg. Par.Estimated odds ratio
ATSCI0.20461.2270−0.05910.47720.94261.6115

Source(s): Authors’ own work

Supplements

References

Aagerup
,
U.
and
Nilsson
,
J.
(
2016
), “
Green consumer behaviour: being good or seeming good?
”,
The Journal of Product and Brand Management
, Vol. 
25
No. 
3
, pp. 
274
-
284
, doi: .
Adnan
,
A.
,
Ahmad
,
A.
and
Khan
,
M.N.
(
2022
), “
Consumer lifestyles and ecological behaviour: a study of car buyers in India
”,
Business Strategy and the Environment
, Vol. 
32
No. 
4
, pp. 
1752
-
1764
, doi: .
Asmalovskij
,
A.
and
Sadílek
,
T.
(
2016
), “
Food quality perception in the Czech Republic: trial study results
”,
Ukranian food journal
, Vol. 
5
No. 
1
, pp. 
186
-
194
.
Attanasio
,
G.
,
Preghenella
,
N.
,
De Toni
,
A.F.
and
Battistella
,
C.
(
2021
), “
Stakeholder engagement in business models for sustainability: the stakeholder value flow model for sustainable development
”,
Business Strategy and the Environment
, Vol. 
31
No. 
3
, pp. 
860
-
874
, doi: .
Attiq
,
S.
and
Azam
,
R.i.
(
2015
), “
Attention to social comparison information and compulsive buying behaviour: an S-O-R analysis
”,
Journal of Behavioural Sciences
, Vol. 
25
No. 
1
, pp. 
39
-
58
.
Braun Kohlová
,
M.
and
Urban
,
J.
(
2020
), “
Buy green, gain prestige and social status
”,
Journal of Environmental Psychology
, Vol. 
69
, 101416, doi: .
Čábelková
,
I.
,
Smutka
,
L.
and
Strielkowski
,
W.
(
2021
), “
Public support for sustainable development and environmental policy: a case of the Czech Republic
”,
Sustainable Development
, Vol. 
30
No. 
1
, pp. 
110
-
126
, doi: .
Caniëls
,
M.C.
,
Lambrechts
,
W.
,
Platje
,
J.
,
Motylska-Kuźma
,
A.
and
Fortuński
,
B.
(
2021
), “
Impressing my friends: the role of social value in green purchasing attitude for youthful consumers
”,
Journal of Cleaner Production
, Vol. 
303
, 126993, doi: .
Costa Pinto
,
D.
,
Maurer Herter
,
M.
,
Rossi
,
P.
,
Meucci Nique
,
W.
and
Borges
,
A.
(
2019
), “
Recycling cooperation and buying status
”,
European Journal of Marketing
, Vol. 
53
No. 
5
, pp. 
944
-
971
, doi: .
Czech National Bank
(
2023
), “
Czech National Bank
”,
available at:
 https://www.cnb.cz/en (
accessed
 2 March 2023).
Del Prete
,
M.
and
Samoggia
,
A.
(
2020
), “
Chocolate consumption and purchasing behaviour review: research issues and insights for future research
”,
Sustainability
, Vol. 
12
No. 
14
, p.
5586
, doi: .
Essiz
,
O.
and
Mandrik
,
C.
(
2022
), “
Intergenerational influence on sustainable consumer attitudes and behaviours: roles of family communication and peer influence in environmental consumer socialization
”,
Psychology and Marketing
, Vol. 
39
No. 
1
, pp. 
5
-
26
, doi: .
Falcão
,
D.
and
Roseira
,
C.
(
2022
), “
Mapping the socially responsible consumption gap research: review and future research agenda
”,
International Journal of Consumer Studies
, Vol. 
46
No. 
5
, pp. 
1718
-
1760
, doi: .
Friedrichsen
,
J.
and
Engelmann
,
D.
(
2018
), “
Who cares about social image
”,
European Economic Review
, Vol. 
110
, pp. 
61
-
77
, doi: .
Gandhi
,
A.V.
(
2020
), “
Studying green consumer behaviour through multiple lenses in a developing country
”,
Smart and Sustainable Built Environment
, Vol. 
10
No. 
2
, pp. 
274
-
292
, doi: .
Ghorban Nejad
,
S.
and
Hansen
,
H.
(
2021
), “
Environmentally motivated travel reduction: the effects of availability, herding bias, and self-monitoring
”,
Sustainability
, Vol. 
13
No. 
2
, p.
691
, doi: .
Gifford
,
R.
and
Nilsson
,
A.
(
2014
), “
Personal and social factors that influence pro-environmental concern and behaviour: a review
”,
International Journal of Psychology
, Vol. 
49
No. 
3
, pp. 
141
-
157
, doi: .
Gomes
,
S.
,
Lopes
,
J.M.
and
Nogueira
,
S.
(
2023
), “
Willingness to pay more for green products: a critical challenge for Gen Z
”,
Journal of Cleaner Production
, Vol. 
390
, 136092, doi: .
Greenland
,
S.
(
2019
), “
Valid p-values behave exactly as they should: some misleading criticisms of p-values and their resolution with S-values
”,
The American Statistician
, Vol. 
73
No. 
1
, pp. 
106
-
114
, doi: .
Kossmann
,
E.
and
Gomez-Suarez
,
M.
(
2019
), “
Words-deeds gap for the purchase of Fairtrade products: a systematic literature review
”,
Frontiers in Psychology
, Vol. 
10
, 2705, doi: .
Laos-Espinoza
,
J.
,
Juaneda-Ayensa
,
E.
,
García-Milon
,
A.
and
Olarte-Pascual
,
C.
(
2024
), “
Why do you want an organic coffee? Self-care vs world-care: a new SOR model approach to explain organic product purchase intentions of Spanish consumers
”,
Fooy and Preference
, Vol. 
118
, 105203, doi: .
Lennox
,
R.D.
and
Wolfe
,
R.N.
(
1984
), “
Revision of the self-monitoring scale
”,
Journal of Personality and Social Psychology
, Vol. 
46
No. 
6
, pp. 
1349
-
1364
, doi: .
Lu
,
Y.
,
Wang
,
Z.
,
Yang
,
D.
and
Kakuda
,
N.
(
2021
), “
To be or not to be equal: the impact of pride on brands associated with dissociative out-groups
”,
The Journal of Product and Brand Management
, Vol. 
31
No. 
1
, pp. 
127
-
148
, doi: .
McShane
,
B.B.
,
Gal
,
D.
,
Gelman
,
A.
,
Robert
,
C.
and
Tackett
,
J.L.
(
2019
), “
Abandon statistical significance
”,
The American Statistician
, Vol. 
73
No. 
s1
, pp. 
235
-
245
, doi: .
Mehrabian
,
A.
and
Russell
,
J.A.
(
1974
),
An Approach to Environmental Psychology
,
MIT Press (MA)
.
O'Cass
,
A.
(
2000
), “
A psychometric evaluation of a revised version of the Lennox and Wolfe revised self-monitoring scale
”,
Psychology and Marketing
, Vol. 
17
No. 
5
, pp. 
397
-
419
, doi: .
Papista
,
E.
and
Dimitriadis
,
S.
(
2019
), “
Consumer – green brand relationships: revisiting benefits, relationship quality and outcomes
”,
The Journal of Product and Brand Management
, Vol. 
28
No. 
2
, pp. 
166
-
187
, doi: .
Papista
,
E.
,
Chrysochou
,
P.
,
Krystallis
,
A.
and
Dimitriadis
,
S.
(
2017
), “
Types of value and cost in consumer-green brands relationship and loyalty behaviour
”,
Journal of Consumer Behaviour
, Vol. 
17
No. 
1
, pp. 
e101
-
e113
, doi: .
Průša
,
P.
and
Sadílek
,
T.
(
2019
), “
Green consumer behaviour: the case of Czech consumers of generation Y
”,
Social Marketing Quarterly
, Vol. 
25
No. 
4
, pp. 
243
-
255
, doi: .
Sahin
,
O.
and
Nasir
,
S.
(
2021
), “
The effects of status consumption and conspicuous consumption on perceived symbolic status
”,
Journal of Marketing Theory and Practice
, Vol. 
30
No. 
1
, pp. 
68
-
85
, doi: .
Shao
,
S.
,
Hu
,
Z.
,
Cao
,
J.
,
Yang
,
L.
and
Guan
,
D.
(
2020
), “
Environmental regulation and enterprise innovation: a review
”,
Business Strategy and the Environment
, Vol. 
29
No. 
3
, pp. 
1465
-
1478
, doi: .
Siddiqui
,
S.A.
,
Karim
,
I.
,
Shahiya
,
C.
,
Shityakov
,
S.
,
Nugraha
,
W.S.
and
Kasza
,
G.
(
2024
), “
A critical review of consumer responsibility in promoting sustainable cocoa production
”,
Current Research in Food Science
, Vol. 
9
, 100818, doi: .
Snyder
,
M.
(
1974
), “
Self-monitoring of expressive behaviour
”,
Journal of Personality and Social Psychology
, Vol. 
30
No. 
4
, pp. 
526
-
537
, doi: .
Snyder
,
M.
and
Gangestad
,
S.
(
1986
), “
On the nature of self-monitoring: matters of assessment, matters of validity
”,
Journal of Personality and Social Psychology
, Vol. 
51
No. 
1
, pp. 
125
-
139
, doi: .
Tyson
,
A.
,
Kennedy
,
B.
and
Funk
,
C.
(
2021
), “
Gen Z, millennials stand out for climate change activism, social media engagement with issue
”,
Pew Research Center Science and Society
,
available at:
 https://www.pewresearch.org/science/2021/05/26/climate-and-generations-acknowledgments/ (
accessed
 1 March 2023).
Utama
,
A.P.
,
Sumarwan
,
U.
,
Suroso
,
A.I.
and
Najib
,
M.
(
2021
), “
Influences of product attributes and lifestyles on consumer behavior: a case study of coffee consumption in Indonesia
”,
Journal of Asian Finance Economics and Business
, Vol. 
8
No. 
5
, pp. 
939
-
950
.
Van der Wal
,
A.J.
,
Van Horen
,
F.
and
Grinstein
,
A.
(
2018
), “
Temporal myopia in sustainable behaviour under uncertainty
”,
International Journal of Research in Marketing
, Vol. 
35
No. 
3
, pp. 
378
-
393
, doi: .
Velcovská
,
Š.
and
Sadílek
,
T.
(
2014
), “
The system of the geographical indication – important component of the politics of the consumers' protection in European union
”,
Amfiteatru Economic
, Vol. 
16
No. 
35
, pp. 
228
-
242
.
Wenting
,
F.
,
Lijia
,
W.
and
Cuixin
,
G.
(
2022
), “
The influence of social crowding on consumers' preference for green products
”,
Frontiers in Psychology
, Vol. 
13
, 832869, doi: .
Yoon
,
H.J.
,
La Ferle
,
C.
and
Edwards
,
S.M.
(
2016
), “
A normative approach to motivating savings behaviour: the moderating effects of attention to social comparison information
”,
International Journal of Advertising
, Vol. 
35
No. 
5
, pp. 
799
-
822
, doi: .
Yue
,
B.
,
Sheng
,
G.
,
She
,
S.
and
Xu
,
J.
(
2020
), “
Impact of consumer environmental responsibility on green consumption behavior in China: the role of environmental concern and price sensitivity
”,
Sustainability
, Vol. 
12
No. 
5
, p.
2074
, doi: .
Zerbini
,
C.
,
Vergura
,
D.T.
and
Luceri
,
B.
(
2019
), “
How fair-trade claims and emotional empathy affect the consumer's propensity to buy fair chocolate?
”,
British Food Journal
, Vol. 
121
No. 
7
, pp. 
1605
-
1613
, doi: .
Zhang
,
B.
,
Fu
,
Z.
,
Huang
,
J.
,
Wang
,
J.
,
Xu
,
S.
and
Zhang
,
L.
(
2018
), “
Consumers' perceptions, purchase intention, and willingness to pay a premium price for safe vegetables: a case study of Beijing, China
”,
Journal of Cleaner Production
, Vol. 
197
, pp. 
1498
-
1507
, doi: .
Zheng
,
X.
,
Xu
,
J.
and
Shen
,
H.
(
2022
), “
To be respected or liked: the influence of social comparisons on consumer preference for competence- versus warmth-oriented products
”,
International Journal of Research in Marketing
, Vol. 
39
No. 
1
, pp. 
170
-
189
, doi: .
Zou
,
L.W.
and
Chan
,
R.Y.
(
2019
), “
Why and when do consumers perform green behaviours? An examination of regulatory focus and ethical ideology
”,
Journal of Business Research
, Vol. 
94
, pp. 
113
-
127
, doi: .
Zucchella
,
A.
and
Previtali
,
P.
(
2018
), “
Circular business models for sustainable development: a “waste is food” restorative ecosystem
”,
Business Strategy and the Environment
, Vol. 
28
No. 
2
, pp. 
274
-
285
, doi: .

Languages

or Create an Account

Close Modal
Close Modal