Skip to Main Content
Purpose

The use of perceptual and objective measures in information systems is an ongoing discussion in IS research, primarily due to different conceptions about objective measures. This research, therefore, empirically tests truly objective measures along with perceptual measures to gain a more comprehensive understanding of the role of perceptual and objective independent variables as predictors of user satisfaction and continuance intention.

Design/methodology/approach

This paper developed an integrated research model that examines perceptual and objective measures as predictors of satisfaction and continuance intention. The approach was then empirically tested with survey-based perceptual variables and corresponding objective variables in the context of a mobile network operator (n = 998). Specifically, we used serial mediation analysis with PROCESS to test our hypotheses.

Findings

The results showed that the different objective variables show insignificance as predictors of satisfaction and continuance intention, contrasting with previous research calling for objective measures.

Originality/value

Our results contribute to IS literature by indicating that perceptual measures are superior to objective measures in predictive relevance. Hence the “silent acceptance” of potential conceptual weaknesses is indeed justified by the results of this research.

Empiricism forms a cornerstone of Information Systems (IS) research, where frameworks and models rest on theoretical assumptions. One of the most prominent assumptions in IS research is individual assessments as a benchmark for the success of information systems. This success is strongly related to user satisfaction and continuance intention. Hence, in both research and industry, user satisfaction and continuance intention have been used as surrogates for IS effectiveness (Melone, 1990). Prior research has often focused on self-reported perceptual measures as independent and dependent variables accounting for constructs such as user satisfaction and system performance. However, research criticizing the reliance on perceptual measures has suggested that such measures do not always provide an acceptable surrogate for system effectiveness and performance (Goodhue et al., 2000).

In response to this criticism, researchers have examined how perceptual independent variables predict objectively measured dependent variables; however, researchers have made few attempts to understand the reverse specification, i.e. how objective independent variables influence common perceptual dependent variables. Instead, causes of the perceptual success of a system are commonly measured with a perceptual assessment of attitudes as independent variables, such as perceived ease of use or perceived usefulness (Davis, 1989). The potential conceptual problem that follows from using only perceptual measures is that the actual performance or success of a system does not always correspond with what users perceive, i.e. their evaluations of a system (Althuizen et al., 2012)., While previous research has found that objective and subjective measures could not be used interchangeably (Bommer et al., 1995), it remains an open empirical question as to whether objective performance can alter perceived performance. Answering this question is essential, as relying on objective versus perceptual measures can significantly influence the results of theory testing (Straub et al., 1995).

Despite the theoretical appeal of objective data, the present study recognizes its inherent complexities. While free from subjective biases, objective measures do not exist in a vacuum. Two critical issues emerge: (1) the difficulty in selecting appropriate objective metrics to reflect theoretical constructs accurately and (2) the inherent disconnect between objective metrics and user perceptions. For instance, technical metrics such as call failure rates in the context of a mobile network may inadequately capture the experiential impact on users, especially when isolated failures coincide with critical moments such as an emergency. Moreover, objective data may fail to account for the nuanced psychological processes influencing user behavior, such as expectation disconfirmation and loss aversion. As such, users might perceive even a network with high reliability as flawed if a single failure disrupts a significant event for them. Therefore, while objective data eliminates subjective bias, it may paradoxically risk missing critical experiential factors, thus diminishing its predictive value for user-related outcomes.

This research hence aims to answer the following question:

RQ.

What is the comparative predictive relevance of perceptual and objective measures in determining user satisfaction and continuance intention?

Theoretically, we address our research question by combining the Expectation-Confirmation Model and Two-Factor Theory to propose a research model that integrates both subjective and objective data. The construction of the use case allows us to collect self-reported values and objective performance data. In so doing, we draw on the case of a Mobile Network Operator (MNO). Then, we empirically test a model with perceptual measures and another with objective measures and then compare the results to derive implications for research and practice.

This paper consists of nine sections. After the introduction, we will discuss relevant theories to derive a research model and the hypotheses development in the third section of this paper. A research design section follows, in which we present the context of a mobile network operator as a case study. After that, we present the statistical results of our perceptual and objective approaches and summarize them before discussing them in the sixth section of this research. Subsequently, we present the limitations of this study along with future avenues for research. We conclude by deriving implications for both the theory and practice of IS and reflecting on our research approach’s relevance.

Individual perceptions, opinions, and attitudes form the basis of subjective measures. Information systems researchers frequently employ these measures to assess constructs, such as user satisfaction, acceptance, and attitudes towards technology. One can collect such perceptual measures using various data collection methods like surveys, interviews, and focus groups. However, one of the limitations of perceptual measures is their potential for bias and subjectivity. Subjective measures rely on participants’ self-reports, which may be influenced by social desirability bias, response bias, or other factors, leading to inaccurate data (Podsakoff et al., 2003). Users may for example exaggerate their satisfaction or skills to appear competent or avoid social disapproval (Tourangeau et al., 2012). As for information systems, an important limitation of subjective measures is also that users may have difficulty articulating their experiences, especially with complex systems or unconscious user behavior (Prasarnphanich et al., 2016). In more detail, tacit knowledge, implicit skills and understanding, can be difficult to articulate (Prasarnphanich et al., 2016). Users may also struggle to accurately recall past experiences with the system, leading to distorted self-reported data. In this context, previous research highlights the only moderate reliability of self-reported internet usage compared to objective usage logs (Scharkow, 2016). Additionally, users may interpret their experiences to confirm pre-existing beliefs about the system, leading to skewed results. As such, Ciriello and Loss (2023) discuss the paradoxical relationship between subjective acceptance ratings and actual perceptions. Their research identifies a cognitive bias as despite high acceptance ratings, individuals did not actually use the technology (Ciriello and Loss, 2023). These biases can distort the data, leading to potentially misleading conclusions about the phenomena being studied.

Moreover, subjective measures may be more challenging to validate and generalize to other contexts or populations (Petter et al., 2008). Minor changes in a survey or interview questions can lead to different interpretations and inconsistent responses across studies. Converse and Presser (1986) demonstrated how question phrasing can significantly impact survey results. Subjective measures need also to be culturally sensitive to avoid misinterpretations. For example, questions about user satisfaction may have different connotations across cultures. In this context, van de Vijver and Poortinga (1997) emphasized the importance of cultural adaptation in cross-cultural survey research.

Objective measures can be independent of these limitations such as personal interpretation or bias (Tallon and Kraemer, 2007). These measures provide a way to describe and account for the phenomenon being studied in an objective and quantifiable manner. One advantage of objective measures is their reliability and validity. Objective measures are often based on verifiable data, making them more reliable and less prone to errors or biases, which can lead to more robust research findings (Scott, 1995). Hence, objective measures of independent variables can strengthen causal inferences by reducing concerns about reverse causality or common method bias. Souza et al. (2022) found that truly objective measures such as mouse or eye tracking provided a more comprehensive understanding of users’ behavior and interactions with the application compared to the mere use of subjective measures. Also, other studies such as Kwak et al. (2022) rely on combining objective and subjective measures. Moreover, objective measures often allow for easier and more reliable longitudinal data collection, enabling researchers to track changes over time more effectively.

Despite the clear advantages of objective measures, some established literature considers objective measures impractical (Bommer et al., 1995). The practicality of objective measures is sometimes questioned due to the resources and effort required for their implementation. For example, collecting and analyzing objective data such as detailed usage logs, physiological responses, or machine-generated metrics can be resource-intensive and may not always be feasible for every research project. Therefore, existing literature stresses that there was is empirical support for their use instead of subjective measures (Bommer et al., 1995). However, the variation in support for objective measures can be attributed to the nature of the specific objective measure employed. Hence, it is utterly important to note that different definitions of objectivity in previous research can lead to divergent results. Furthermore, caution must be exercised when interpreting previous findings, as data considered objective may not always align with an accurate and unbiased objective representation. For example, Muckler and Seven (1992) considered objectivity as a “consensus of subjective opinion” and an external (human) observer’s report (Muckler and Seven, 1992, p. 444). Based on their definition of objective measures, they then claimed that “all measurement in science and technology is necessarily filled with subjective elements” (Muckler and Seven, 1992, p. 441). This view highlights the potential for subjective elements to infiltrate even those measures deemed objective, thus challenging the purity of objective measurement. Following from this discussion in the literature, there is a gap in prior theory around the definition of objectivity in combination with considering such variables and perceptual variables. Moreover, this ongoing debate and exploration into the appropriate use and definition of objective measures underscore the dynamic nature of research methodologies and the need for continual reassessment and refinement.

In the context of user satisfaction and continuance intention in IS theory, integrating objective and perceptual measures can provide a more comprehensive understanding of user behaviors and outcomes. The Expectation-Confirmation Model (ECM) (Oliver, 1980) explains how users form expectations before using a technology and how these expectations, along with their confirmation or disconfirmation, influence their satisfaction with the technology. The fundamental tenets of the ECM include the formation of expectations based on prior experience and the confirmation or disconfirmation of these expectations through the user’s experience with the technology (Bhattacherjee, 2001a, b; Oghuma et al., 2016; Venkatesh et al., 2011). The underlying expectation confirmation theory (ECT) states that customers’ formation of repurchase intention, and thus retention, follows a sequential process. The process starts with the initial expectation before a purchase of a product or service and then, after initial consumption, continues with the formation of perceptions about performance in comparison to the original expectation. By integrating perceptual and objective measures within the framework of the ECM, we can analyze the interplay between users’ expectations, their actual experiences, and their satisfaction levels, providing valuable insights into the factors that drive continued usage of information systems. The ECM elucidates how users form expectations before using an IS and how the confirmation or disconfirmation of these expectations influences their satisfaction. By considering the interplay between initial expectations, actual experiences, and subsequent perceptions of performance, the ECM provides a theoretical framework for understanding the relationship between user expectations and satisfaction levels.

Although Bhattacherjee’s post-acceptance perspective on ICT continuance is widely accepted (Bhattacherjee, 2001b; Bhattacherjee et al., 2012), previous research did not account for the possibility that customers can become dissatisfied with ICT. Following this stream of research, it is assumed that user satisfaction is the opposite of user dissatisfaction (Bhattacherjee, 2001b; Bhattacherjee et al., 2012). Contrastingly, other IS research suggests a positive-negative asymmetry effect, i.e. negative events will have a longer-lasting and more intense impact on satisfaction than positive events of the same type (Cheung and Lee, 2005). This positive-negative asymmetric effect is similar to the loss aversion component of prospect theory (Cheung and Lee, 2005; Kahneman and Tversky, 1979). According to prospect theory, the subjective weight of a potential loss is greater than that of possible gains (Kahneman and Tversky, 1979). Following Kahneman and Tversky, the reason for this bias is rooted in an affective context: “the aggravation that one experiences in losing a sum of money appears to be greater than the pleasure associated with gaining the same amount” (Kahneman and Tversky, 1979, p. 279). This idea has also been applied to information systems (Keil et al., 2000; Venkatesh and Goyal, 2010), including in decision support systems research (Looney and Hardin, 2020). It follows from the theory that the probability of a negative outcome increases as the prospect of loss increases. Following this logic, Venkatesh and Goyal (2010) argue that the negative effect on behavioral intention becomes stronger when dissonance intensifies. This linkage suggests that there are factors that contribute negatively to satisfaction and the users’ perceptions of an IS. Previous research considered inhibitors as individual-level beliefs promoting technology rejection rather than acceptance (Cenfetelli and Schwarz, 2011).

Two-Factor Theory (Herzberg, 1966) is a theory of motivation that posits that two types of factors influence motivation and satisfaction. Hygiene factors are basic requirements that must be met to avoid dissatisfaction, while motivators are factors that lead to satisfaction. In the context of an information system, actual performance can be seen as a hygiene factor because it is a basic requirement that must be met for users to have a satisfactory experience with the system. Users are likely to become dissatisfied and frustrated when an information system performs differently than expected. This dissatisfaction will likely persist until the system’s performance is improved to meet user expectations.

We integrate the Expectation-Confirmation Model and Two-Factor Theory (Chang, 2020) while developing our hypotheses to provide a more comprehensive understanding of user satisfaction and continuance intention. This approach allows us to simultaneously consider factors contributing to user satisfaction and inhibiting hygiene factors.

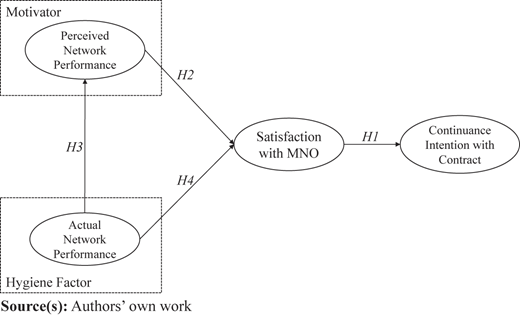
Figure 1 depicts the research model integrating Two-Factor Theory and the Expectation-Confirmation Model.

Customer satisfaction with MNOs has been studied before in different fields of research (Aksoy et al., 2013; Calvo-Porral et al., 2017; Hossain and Suchy, 2013). Satisfaction is an essential determinant of customer retention in the service industry (Zeithaml et al., 1996). Moreover, it is considered an essential determinant of the intention to make a repeated purchase (Liao et al., 2009) and achieving customer loyalty (Eggert and Ulaga, 2002). If customers have had positive experiences with their mobile provider, they will have higher customer satisfaction. Prior research has theorized that customer satisfaction can be classified into transaction-specific and general satisfaction (Yi, 1990).

Transaction-specific customer satisfaction refers to the concrete evaluation that customers give after a specific purchase experience, and overall satisfaction accounts for the customer evaluation of the brand, product, or service based on their experience with the respective one (Johnson and Fornell, 1991). Since a mobile phone contract is a communication tool, the concept of transaction-specific satisfaction is unsuitable in this research because transactional satisfaction follows immediately after the conclusion of the contract. This follows the argumentation of Fournier and Mick (1999) that the transaction-specific consideration of satisfaction is insufficient to analyze general customer satisfaction. Consequently, there is a demand to consider non-transactional satisfaction in the literature (Deng et al., 2010). This type of satisfaction is not linked to a specific transaction but measures continuous, overall customer satisfaction based on an ongoing relationship with the provider. Our previous line of argumentation suggests that ICT continuance intention is determined primarily by satisfaction with prior IT use. Hence, continuance intention is different from intentions to initially subscribe to an MNO offer (Gerpott and Thomas, 2014). More precisely, continuance intention is defined as an individual’s deliberate plan to continue using the product or service, in other words, not to terminate the use (Gerpott and Thomas, 2014). This is not directly observable and is measured by subjective introspection, in accordance with previous research (Gerpott and Thomas, 2014). Previous research found that satisfaction is the strongest predictor of continuance intention (Bhattacherjee, 2001b) and thus ultimately, customer loyalty. It follows that a high level of customer satisfaction can positively affect the tendency to remain a customer. In the context of this research, continuance intention refers thus to the intention to repurchase, i.e. not to terminate one’s contract.

Analogously, we hypothesize

H1.

Overall customer satisfaction is positively related to continuance intention.

Mobile network operators face high competition and must provide high-quality network performance (Bharati and Berg, 2005; Kemp, 2005; Yoo and Park, 2007). However, the perception of network performance, which is the degree of the difference between customer expectations and their experience, is even more critical (Zeithaml et al., 1996). These perceptions of performance can include reliability, tangibility, and responsiveness (Parasuraman et al., 1988). Evaluating perceived performance and how well it meets customer expectations determines customer satisfaction (Halilovic and Cicic, 2013). Customer satisfaction is “the summary psychological state resulting when the emotion surrounding disconfirmed expectations is coupled with the consumer’s prior feelings about the consumption experience” (Oliver, 1981, p. 27). Accordingly, in the context of MNOs, customer satisfaction is a customer’s evaluation of their experience with the service (Gerpott et al., 2001). Customer satisfaction, in turn, affects continuance intention, namely the likelihood of a customer to keep using a service, along with other variables such as perceived usefulness and loyalty incentives (Bhattacherjee, 2001b). In this line of argumentation, previous studies found that this perception of performance by a service operator is a predictor of satisfaction (Deng et al., 2010; Kassim and Abdullah, 2008). Analogously, we hypothesize

H2.

Perceived network performance is positively related to overall customer satisfaction.

Previous studies have investigated the relationship between actual and perceived performance of information systems. For example, in a study by Venkatesh and Davis (2000), the authors found that actual system performance directly and significantly impacted user perceptions of system quality. Similarly, a study by Delone and McLean (1992) found that system quality (i.e. actual performance) positively and significantly affected user satisfaction with information systems.

Moreover, research has shown that when users experience slow or unreliable system performance, their perceptions of the system’s overall quality and usability are negatively affected. For example, in a study by Seddon and Kiew (1996), the authors found that perceived system performance was a key predictor of user satisfaction with information systems and that users’ negative perceptions of system performance were associated with lower satisfaction levels.

Furthermore, recent research has explored the impact of perceived performance on user behavior, and the findings suggest that user behavior is significantly influenced by perceived system performance. For instance, in a study by van der Heijden (2003), the authors found that perceived system performance had a significant impact on user intention to use information systems and that users were more likely to continue using a system when they perceived it to be performing well. Recent research has continued to support the argument that actual performance significantly impacts an information system’s perceived performance. For example, a study by Kim (2010) found that actual system performance significantly impacted perceived usefulness, satisfaction, and intention to use an information system.

The functionality and availability of a mobile network is a hygiene factor because a working mobile network is taken for granted by users in developed countries. This assumption aligns with previous research, where technical quality has, for example, been identified as a hygiene factor in user experience design (Tuch and Hornbæk, 2015). Following this line of argumentation, good actual performance will not improve perceived performance, but poor performance can potentially lower perceived performance. A study by Paraskeva et al. (2017) found that users were more likely to be dissatisfied with an e-learning-system when it did not perform as expected. Therefore, while the availability and functionality of a network is a hygiene factor, poorer actual performance leads to lower perceptions of network performance and reduces customer satisfaction. We hence hypothesize

H3.

Poor actual network performance is positively related to low perceived network performance.

Continuous usage behavior and post-adoption loyalty are increasingly the focus of both research and organizations (Shaikh and Karjaluoto, 2015). Traditionally, perceptual measures such as brand image, reputation, the value of the offer, and switching costs were the center of attention. Though satisfied customers are theoretically more likely to remain loyal to an MNO, they may terminate their plan due to a better offer. Contrastingly, even unsatisfied customers may not choose to terminate their plan, for example, due to the effort going along with switching to a different provider. Moreover, the reputation of an MNO can potentially lead to lock-in effects or – if poor – to churns regardless of other factors. These aspects commonly showed good predictive relevance for satisfaction and continuance intention. This perceptual focus in explaining satisfaction and continuance intention is surprising against the background that marketing cannot influence actual technological performance. The latter should also play an essential role in customers’ satisfaction and continuance intention. The following analogy illustrates this argument: When you buy a car, the decisive factor for you is undoubtedly not only the image of the manufacturer, the cost-benefit ratio, and the like but also how well and reliably the car drives. Why should this be any different for information technology, such as subscribing to a particular MNO, where network performance is a decisive factor?

Customers tend to blame the lack of investment in mobile network infrastructure for connection issues, despite continuously growing expenditures in infrastructure (VATM, 2019). These connection issues include such problems as failed calls or whether there is a gap between the actual speed of a data connection that a user subscribed to and the speed the MNO provides. The reasons for these issues are multifaceted and include network coverage, network expansion, the nationwide availability of LTE networks, and malfunctions in transmitting infrastructures. Hence, the corporate management of MNOs tends to blame technology for high churn rates without clear evidence of a causal relationship between the actual performance of a network and customer satisfaction or continuance intention, respectively.

Buchwald et al. (2018) showed that hygiene factors such as system unreliability for self-tracking devices could negatively influence post-usage behavior. Drawing on the theoretical foundation of ECT and the Two-Factor Theory, actual network performance can cause dissatisfaction if the customer perceives it as inadequate. Conversely, actual network performance does not necessarily contribute to increased satisfaction if perceived as acceptable. In other words, because actual network performance is considered a hygiene factor, it can negatively contribute to satisfaction when performance is poor but not positively contribute to satisfaction when performance is good. Thus, in addition to asking users whether they perceive that their expectations have been met as done in the confirmation dimension of ECM, we use objective data provided by the MNO on network performance during the observation period. This allows us to isolate the technological component of satisfaction. Alongside, this approach addresses the ECM critique that the evaluation of expectations and perceived performance is inaccurate because expectations can change over time (Brown et al., 2008). Moreover, we reduce the issue of response bias, which is an issue in survey studies.

In line with our research question, we hypothesize

H4.

Poor actual network performance is positively related to low overall customer satisfaction with the MNO.

To analyze our research model, we draw on the case of a German mobile network operator whose core business and, thus, operational success relies on its technological infrastructure.

To contextualize our study, the type of phone contract we examined is a fixed-term agreement, typically lasting 12 or 24 months. These contracts generally include the cost of a mobile phone and a package for data, calls, and texting, effectively functioning as credit loans. This type of contract contrasts with SIM-only deals, which are also available and often renewable on a monthly basis, without the overhead of a credit check. We excluded SIM-only deals because a repurchase (continuation) decisions made every 24 months may be qualitatively different from those made every month. In contrast to SIM-only subscriptions, fixed-term contracts can be described as continuous contractual transactions, meaning that the user is bound to the service provider for the duration of the contract, and is expected to make regular payments throughout this period. This arrangement implies a long-term commitment from the user, which influences their satisfaction and continuance intention. The obligation to fulfill the contract terms can reduce churn rates, but it also places greater importance on the consistent performance of the service to maintain user satisfaction.

Therefore, once a customer is acquired, maintaining this relationship is of utmost importance to the economic success of an MNO because services are homogenous amongst operators with similar pricing models (Calvo-Porral et al., 2017; Gerpott et al., 2001). This especially applies to customers with fixed contracts due to the larger margin for an MNO. These contracts are usually pricier but offer benefits such as reduced prices for mobile devices. Despite the locked-in nature of fixed contracts and due to the intense competition, previous research found these switching costs had a surprisingly low influence on the switching intention (Calvo-Porral et al., 2017). In addition, despite being on a fixed contract, switching providers in Germany is relatively easy due to regulatory measures and consumer protection laws. For instance, users have the right to retain their phone numbers when switching providers, reducing the inconvenience associated with changing numbers. Additionally, the porting process is rather simple and is often completed within a few days. Fixed-term contracts may also include clauses that allow users to terminate the contract early under certain conditions, such as poor service quality or relocation to a different country. Consequently, objective network performance data becomes even more critical in understanding user satisfaction and continuance intention in markets with low switching barriers. Moreover, fixed-contract customers are difficult to regain after contract termination (Gerpott and Ahmadi, 2015). Because of their importance for the operational success of an MNO, fixed-term customers were at the center of previous research, for example, with regard to proactive churn management (Gerpott and Ahmadi, 2015; Gerpott and Meinert, 2018).

Therefore, because the performance of services can fluctuate and users have the option to switch providers easily, they may be more sensitive to any perceived performance failures. This heightened sensitivity means that ensuring consistently high network performance is essential for MNOs to maintain user satisfaction and to encourage long-term loyalty.

A questionnaire survey was used to collect the perceptual data. This method was chosen because it is an efficient means of collecting large amounts of information from large samples and follows a deductive research approach.

Three perceptual measures were included in this study: continuance intention with the contract, satisfaction with the MNO, and perceived network performance. All constructs were measured using multi-item, fully anchored, five-point Likert scales ranging from strongly disagree to strongly agree. Initial scale items were taken from previously validated measures in IS use or ECT literature and reworded to relate to the mobile network context. Translation and adaption of the instrument have been made using the forward-backward translation by several researchers to maintain the equivalence of the items. We followed the guidelines of Guillemin et al. (1993). Cultural adjustments were not necessary.

We adhered to recognized recommendations outlined in the existing literature to mitigate the possibility of common-method bias (CMB). As a proactive measure, we explicitly notified participants that their responses to the survey would be kept anonymous. We also implemented distinct scale anchors to assess each variable when feasible. Additionally, we observed that none of the correlations between variables exceeded 0.90, indicating a low likelihood of CMB influencing the findings (Gefen et al., 2011).

We conducted a pre-test among 100 individuals to ensure that all items were correctly developed and showed consistency. Following the pretest, in cooperation with a major German MNO, we sent out a text message with the invitation link to the mobile survey to randomly selected private customers of the MNO with fixed contracts featuring LTE technology. This also applied to the pre-test recruitment of participants. Users were only able to participate once in the survey. According to the MNO, the response rate was 3.2%, which is in line with previous surveys using an SMS link.

Customers were selected randomly by the MNO. 59.4% of the respondents were male, 39.6% female. The mean birth year was 1974.94, i.e. almost 1975, with an SD of 14 1/3 years. Age and gender were part of the survey (self-reported) and the data set obtained by the MNO (objective data). We eliminated all responses without matching data for these two variables to ensure the high quality of the data set. Hence to address the issue of common method bias, we chose an ex-ante approach. We included demographic variables in the questionnaire obtained from the MNO. This allowed us to examine possible response set biases. Subsequently, we obtained valid responses from n = 998 customers.

Long-Term Evolution (LTE) technology consists of two technical determinants for a successful connection: The first one is the default bearer which is automatically established when the connection is set up. It usually has no special quality of service requirements. If a special quality of service is required for a connection to a particular remote terminal, this can be guaranteed using a dedicated bearer. No additional IP address is assigned here, but only a special quality of service setting is applied to a specific data stream.

In addition to the questionnaire data used in the perceptual approach, we obtained data on actual network performance from the MNO for each respondent regarding calls and data connections. Data was collected by the MNO for up to 90 days before the survey until the individual date the survey was completed. In more detail, the variables dropped call rate, call setup failure rate, dedicated bearer failure rate, and default bearer failure rate were calculated by the MNO based on their network performance data. Dropped call rate was, for example, determined as the ratio of actual calls and the number of failures during these calls per customer. These variables were used for analysis because the MNO uses them internally to evaluate network quality regarding data and voice connections. The variables undergo separate assessments by the Mobile Network Operator (MNO) rather than being measured together as they pertain to distinct stages of connection components. It is important to clarify that the collected network performance data relate to each individual participant in the study. This approach ensures that the measured performance accurately reflects the user experience in specific locations, such as their homes and workplaces. Consequently, “poor performance that can potentially lead to lowered perceived performance” is directly tied to individual experience rather than the overall performance of the network. This acknowledges that users are primarily concerned with the network quality in the areas they frequently visit, and poor performance in these critical locations is likely to influence their overall satisfaction and continuance intention. The following Table 1 provides an overview of the employed objective variables.

Confirmatory factor analysis was conducted to investigate convergent and discriminant validity for each measure. The composite reliability statistics (CR) of the constructs exceeded the recommended threshold of 0.70 (Bagozzi and Yi, 1988; Fornell and Larcker, 1981), indicating a high degree of shared variance among the observed variables used as indicators of the latent constructs (Fornell and Larcker, 1981). Cronbach’s Reliabilities for all constructs were also above the recommended threshold of 0.70. Thus, all measures consistently indicated the internal consistency of the scales. Due to some high correlations among the independent variables, we test for multicollinearity. The presence of multicollinearity in the independent variables could lead to the use of redundant information in the model and, thus, to an inflated variance of predictors (Raykov and Marcoulides, 2006). The Variance Inflation Factor (VIF) is calculated for the independent variables. It is a tool to measure and quantify how much the variance of an estimated regression coefficient is inflated (Hair et al., 2010). There is an ongoing discussion in the literature on the critical value of the VIF. Hair et al. (2010) propose a critical value of 5, while other authors propose a less strict critical value of 10 (e.g. Franke, 2010). As shown in Table 2, all VIF values are below the stricter critical value of 5. Multicollinearity is, therefore, not a major problem here.

Discriminant validity assesses how much each measure used in the model differs from the others (Bagozzi et al., 1991). The extracted average variance (AVE) was used to test for the sufficient discriminant validity of the constructs. Each variable had an acceptable AVE value above 0.50 (Fornell and Larcker, 1981), indicating that more than half of the variance in the measure is explained by their corresponding measures rather than by errors (Hair et al., 2010). Furthermore, support for the discriminant validity of all constructs was determined by comparing the square root of the AVE with the correlations between constructs (Fornell and Larcker, 1981). The square roots of the AVE of all constructs were greater than the correlations between the constructs. Consequently, all measures exceeded the recommended convergent and discriminant validity threshold, as shown in Table 3.

We first test a model that includes only the perceptual variables to identify the effects of including the objective variables. After that, we re-test the model and include the objective measures. The analytical methodology outlined by Hayes (2013) was used to test the hypotheses of the perceptual and the objective approaches. In doing so, we estimated the direct effects between the independent and dependent variables and the indirect effects through the mediator variable. All path coefficients were calculated using regression analysis with the PROCESS v. 3.5 plug-in for SPSS developed by Hayes (2013). The advantage of this methodology is that it enables the isolation of each mediator’s indirect effect (van Jaarsveld et al., 2010). This procedure is superior to the alternative evaluations of mediating effects as it directly tests the indirect effect between the predictor and the criterion variables by the mediator via a bootstrapping procedure.

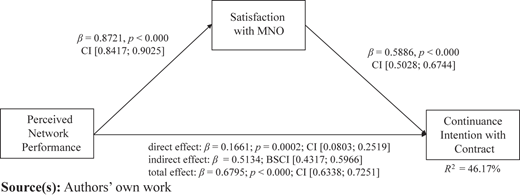
A simple mediation was performed to analyze whether perceived network performance predicts continuance intention and whether the direct path would be mediated by customer satisfaction with the MNO. A total effect of perceived network performance on continuance intention was observed. The overall model shows good predictive relevance with an R2 of 46.17%

As evident from the mediation analysis results displayed in Figure 2, H1 and H2 are fully supported by previous research in the field. The direct effect of perceived network performance on continuance intention is highly significant, as well as the indirect effect. The total effect of perceived network performance on continuance intention is 0.68.

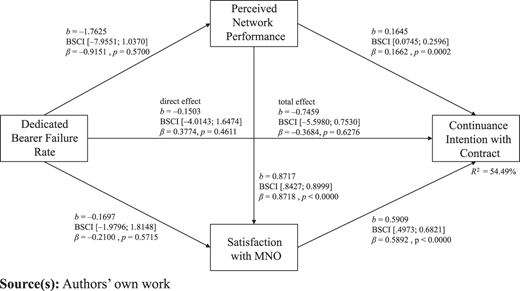
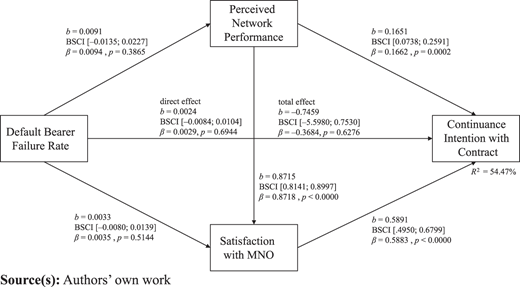
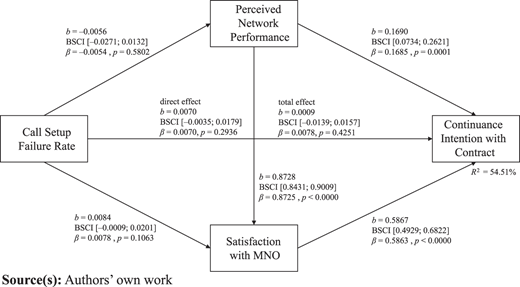
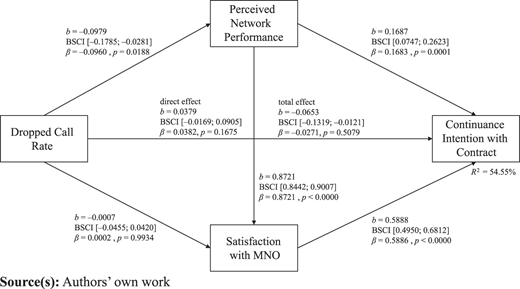
We employed serial mediation analysis, as Hayes (2013) proposed to analyze the model after the inclusion of the objective data. Serial mediation models allow researchers to analyze how the distinct mediator variables of a proposed model are connected. The advantage of this approach is that it allows researchers to isolate the indirect effect of each mediator methodically; this approach also makes it possible to study the serial indirect effects of multiple mediators (van Jaarsveld et al., 2010). In contrast to parallel mediation, serial mediation means that the mediators themselves are in a hierarchical causal relationship. In our case, this hierarchy follows the assumption that the technological features of a system are the cause of perceptual variables in line with our theoretical foundation. In the objective approach, H3 and H4 are tested in addition to the re-test of H1 and H2 with the objective data included in the model. In so doing, we evaluate four objective network performance measures as independent predictors: dedicated bearer failure rate, default bearer failure rate, call setup failure rate, and dropped call rate. Figure 3 shows the results for including the dedicated bearer failure rate. Figures A1, A2, and A3 in the  Appendix depict the other three objective performance indicators.

Including the objective data has not altered the support of H1 and H2. As in the perceptual model analysis, hypotheses H1 and H2 are fully supported in the objective approach. Customer satisfaction is positively related to continuance intention, and perceived network performance is positively related to overall customer satisfaction with the MNO.

All specific indirect effects sum up to the total indirect effect, which expresses the extent to which all mediators can explain the relationship between X and Y. As evident from the diagrams, all total effects of the objective IVs are insignificant. Hence, our hypotheses H3 and H4 are not supported. There is no positive relationship between poor actual network performance and low perceived network performance or low overall customer satisfaction, respectively.

Contrastingly, all perceptual variables show strong predictive relevance. R2 values of all models range from 54.47% to 54.55% showing moderate predictive accuracy (Henseler et al., 2009), caused by the significant perceptual paths. The absence of a direct effect of the objective measures suggests no mediated effect of the objective variables. Hence, there is no evidence for an association of objective data with satisfaction and continuance intention.

The underlying goal of this paper is to gain a more comprehensive understanding of the role of perceptual and objective independent variables as predictors of user satisfaction and continuance intention. To accomplish this goal, the paper developed an integrated research model that examines perceptual and objective measures as predictors of satisfaction and continuance intention.

We conducted five tests of our model, including one with perceptual variables only and four incorporating each of the four objective network performance measures. Our results revealed that the objective approach yielded predominantly insignificant results for the different objective variables as predictors of satisfaction and continuance intention. This contrasts with previous research advocating for the use of objective measures. These findings suggest that perceptual measures are superior to objective measures in terms of predictive relevance in information systems (IS) research. Consequently, including different objective measures did not enhance the model’s explanatory power. Therefore, our study statistically confirms the appropriateness of the perceptual focus in survey research within the IS discipline.

This study contributes to previous IS research by expanding knowledge on including objective data as a hygiene factor to reduce perceptual bias. Potential statistical biases remain nonetheless a methodological issue. Multi-item summated scales can reduce random measurement errors. However, the possibility of a systematic error remains (Ketokivi and Schroeder, 2004). In terms of construct reliability and validity, perceptual measures are usually satisfactory in IS research. To further reduce the risk of biased estimation of substantive parameters, Ketokivi and Schroeder (2004) additionally call for a detailed examination of informant bias and the related method variance when relying on perceptual measures. The informant bias considers that in survey research, informants have individual perceptions and estimates of a subject matter (Bagozzi et al., 1991). It refers to the systematic measurement error, which occurs due to different motives, limited information processing capacities, differences in perception, and divergent information levels of respondents (Huber and Power, 1985). This is usually not assessed in IS research where conventional methods cover the analysis of construct reliability and validity.

Moreover, this paper advances IS research to the extent that we have used truly objective data for measurement. The previous discussion in IS research has shown that the definition of objectivity of measured data is not consistent, and previous results may not be accurate due to these inconsistent definitions. Our measurements represent truly objective performance data that are free of any subjectivity. However, while objective data offers a sense of impartiality and precision, this study reveals that it can be insufficient when understanding complex human-centric phenomena such as user satisfaction and continuance intention. One fundamental limitation of objective data is selecting metrics that appropriately represent theoretical constructs. For example, network performance metrics such as dropped call rates may capture technical performance but fail to reflect users’ experiential weight on isolated critical failures. This points to a broader issue: objective data cannot contextualize user experiences within their unique situational or emotional frames. Hence, there may be an interpretive gap between objective performance and subjective user perception. Even a high-performing network can be perceived negatively if an isolated failure happens at a personally significant time, magnifying the emotional impact in ways that purely technical metrics cannot detect. Users are not passive observers of technology; psychological and situational factors influence their perceptions. According to Expectation-Confirmation Theory (Oliver, 1980) and Prospect Theory (Kahneman and Tversky, 1979), perceived shortfalls between anticipated and actual outcomes can intensify negative evaluations, even when performance metrics are objectively high. This phenomenon is particularly evident in cases where minor disruptions occur during high-stakes moments, disproportionately influencing user evaluations (Brown et al., 2008). By acknowledging these two core challenges—metric selection and the inherent disconnect from user-centric interpretation—our study offers critical insights into why objective metrics alone may not adequately capture or predict user satisfaction and continuance intention.

Next, Bommer et al. (1995) examined whether subjective and objective measures can be used interchangeably. However, our approach is to examine if the MNO can impact the subjective ratings with objectively measurable performance. Therefore, it broadens considerations of previous IS research.

Additionally, much of the previous research (Alexander and Wilkins, 1982; Bommer et al., 1995) focused on the context of employee performance rather than technology. Hence, variables that may impact personal relations are irrelevant in our context. Moreover, the measurement of objective network performance is completely unmediated by humans in our MNO context (Bommer et al., 1995; Weitz, 1978). In contrast to other prior studies on the distinction of subjective and objective measures, objectivity is not the “consensus of subjective opinion” (Muckler and Seven, 1992) nor an external (human) observer’s report (Muckler and Seven, 1992), but genuinely objective performance data. Therefore, it opposes Muckler and Seven (1992), claiming that “all measurement in science and technology is necessarily filled with subjective elements” and hence the distinction is irrelevant. Lastly, the underlying dataset includes a history of events over three months. Alexander and Wilkins (1982) noted that interaction history is essential and not considered in controlled experimental settings. Though this is not new, previous IS research has not sufficiently examined this using objective performance data. Therefore, we can contribute to this discussion against the background of our rich dataset.

The present study centers on a contractually enabled service, a mobile phone signal, which complicates our understanding of user satisfaction and continuance intention compared with product-based contexts. Unlike products such as cars, which are tangible and have clearly defined performance parameters, services such as mobile phone signals are intangible and their performance can be more variable and context-dependent. This distinction significantly impacts our findings: Firstly, user satisfaction with a service like a mobile phone signal is influenced by factors beyond the service itself, such as user location and network congestion, which can vary significantly over time and place. This variability necessitates a more dynamic approach to measuring satisfaction and continuance intention, as opposed to the relatively static assessment of product performance. Secondly, the expectations of a service differ from those of a product. Users typically expect a product to perform reliably once it is acquired, whereas a service is expected to maintain a certain level of performance over time, which is often influenced by external factors. This ongoing expectation makes the measurement of satisfaction and continuance intention for services more complex, as it must account for temporal fluctuations in performance and user experience. Lastly, the ease of switching providers at the time of the study adds another layer of complexity. Relatively low barriers to switching a mobile phone contract can make users more sensitive to performance issues, impacting their satisfaction and continuance decisions. This sensitivity underscores the importance of understanding how objectively measurable performance data can influence subjective user ratings in the service context.

Combining the results of the perceptual and objective approaches, this research places the human being at the center of attention. This human-centric approach emphasizes that people who always work with systems and technology support them. Still, it is not so much the technological components deciding system usage. The perception of whether a technology is suitable is more critical to overall satisfaction and continuance intention than its actual performance. This has several implications for IS practice. First, it suggests that when a particular IS fulfills the expectations of its users, no additional gains in IS satisfaction and continuance intention will be made by outperforming these expectations. Second, the decision of whether these expectations are met can be influenced not only by technological performance, but, more importantly, by user orientation and purpose orientation. An IS is not an end in itself. Thus, a mere technology-driven point of view is not suitable for organizations. User perceptions should be considered to ensure continued usage behavior.

From a practical standpoint, the implications of these findings extend to system design and user management. Relying exclusively on objective performance data may overlook subtle yet critical determinants of user satisfaction. Practitioners should implement dynamic feedback loops integrating real-time objective performance monitoring with direct user feedback mechanisms, such as sentiment analysis or targeted surveys. By doing so, IS managers can proactively address user dissatisfaction even when objective metrics appear optimal.

Another implication of this approach is the need for ongoing user support and training. Even if an information system is well-designed and meets user expectations during implementation, users’ needs and perceptions can change over time. Therefore, ongoing support and training can help to ensure continued usage and satisfaction with the system.

Our results should be interpreted considering the study’s limitations and associated future research implications. Ironically, the primary limitation of our research is the very problem we are addressing, i.e. the limitations of relying on perceptual measures. In terms of future research, new studies should investigate why objective performance data collected in the current study is not predictive of perceptual measures of performance, satisfaction, and continuance intention. For example, is there simply a disconnect between actual performance data and perceived performance, user satisfaction, and users’ intentions to continue using a particular technology? If so, what factors influence perceptions of performance, satisfaction, and continuous intention? Relatedly, as most prior studies have shown, our results reveal strong relationships between perceptual independent and dependent variables. What do these relationships reveal when viewed in light of the non-significant relationships between the objective and perceptual measures? Is objective data collection rendered obsolete by the use of perceptual measures? Or, are the strong relationships between perceptual independent and dependent variables merely an artefact of common method bias? No matter the explanation, this is a critical issue that IS researchers need to resolve, and future research should be designed to disentangle these complex relationships further. For example, mixed modeling approaches can facilitate the investigation of perceptual and actual dependent and independent variables and allow for repeated measures designs that incorporate time-varying covariates (Hardin et al., 2017). The second limitation is the use case we chose. While the objective predictors were insignificant in our specific case, this does not imply that this insignificance will also occur for other use cases. At the same time, this limitation is an essential direction for future research in which attempts should be made to include objectively measured variables as predictors in other application contexts. Another limitation is the absence of an objective dependent variable in our dataset, restricting our ability to compare the influence of subjective and objective independent variables on both types of dependent variables. This limitation constrains the depth of our analysis regarding the interplay between subjective perceptions and objective performance metrics. Future research should consider incorporating objective dependent variables to provide a more comprehensive understanding of these relationships. In more detail, the examination of the appropriateness and implications of using subjective independent variables to predict objective dependent variables is interesting to advance our understanding of their interplay and to enhance the robustness of our field’s methodologies. The fourth limitation lies in the evaluation method used. Serial mediation analysis is a linear procedure. The detection of non-linear effects, for example, by approaches to non-linear SEM or by using mixture models as proposed in the psychology literature (Brandt et al., 2015), is an exciting perspective for future research.

Our research examined the complex relationships between objective and subject network performance measures, MNO satisfaction, and contract continuance intention. While the significant relationships among the perceptual measures were consistent with prior research, actual network performance data from the MNO failed to predict any of the perceptual measures. Thus, users’ perceptions of network performance, satisfaction, and continuance intention do not appear to be based on the actual performance of the network (i.e. the objective, independent variables). These findings raise important questions about the relationships between objective and perceptual measures and whether relationships among perceptual measures are merely artefacts of perceptual bias.
Aksoy
,
L.
,
Buoye
,
A.
,
Aksoy
,
P.
,
Larivière
,
B.
and
Keiningham
,
T.L.
(
2013
), “
A cross-national investigation of the satisfaction and loyalty linkage for mobile telecommunications services across eight countries
”,
Journal of Interactive Marketing
, Vol. 
27
No. 
1
, pp. 
74
-
82
, doi: .
Alexander
,
E.R.
and
Wilkins
,
R.D.
(
1982
), “
Performance rating validity: the relationship of objective and subjective measures of performance
”,
Group and Organization Studies
, Vol. 
7
No. 
4
, pp. 
485
-
496
, doi: .
Althuizen
,
N.
,
Reichel
,
A.
and
Wierenga
,
B.
(
2012
), “
Help that is not recognized: harmful neglect of decision support systems
”,
Decision Support Systems
, Vol. 
54
No. 
1
, pp. 
719
-
728
, doi: .
Bagozzi
,
R.P.
and
Yi
,
Y.
(
1988
), “
On the evaluation of structural equation models
”,
Journal of the Academy of Marketing Science
, Vol. 
16
No. 
1
, pp. 
74
-
94
, doi: .
Bagozzi
,
R.P.
,
Yi
,
Y.
and
Phillips
,
L.W.
(
1991
), “
Assessing construct validity in organizational research
”,
Administrative Science Quarterly
, Vol. 
36
No. 
3
, p.
421
, doi: .
Bharati
,
P.
and
Berg
,
D.
(
2005
), “
Service quality from the other side: information systems management at Duquesne Light
”,
International Journal of Information Management
, Vol. 
25
No. 
4
, pp. 
367
-
380
, doi: .
Bhattacherjee
,
A.
(
2001a
), “
An empirical analysis of the antecedents of electronic commerce service continuance
”,
Decision Support Systems
, Vol. 
32
No. 
2
, pp. 
201
-
214
, doi: .
Bhattacherjee
,
A.
(
2001b
), “
Understanding information systems continuance: an expectation-confirmation model
”,
MIS Quarterly
, Vol. 
25
No. 
3
, p.
351
, doi: .
Bhattacherjee
,
A.
,
Limayem
,
M.
and
Cheung
,
C.M.K.
(
2012
), “
User switching of information technology: a theoretical synthesis and empirical test
”,
Information and Management
, Vol. 
49
Nos.
7-8
, pp. 
327
-
333
, doi: .
Bommer
,
W.H.
,
Johnson
,
J.
,
Rich
,
G.A.
,
Podsakoff
,
P.M.
and
MacKenzie
,
S.B.
(
1995
), “
On the interchangeability of objective and subjective measures of employee performance: a meta-analysis
”,
Personnel Psychology
, Vol. 
48
No. 
3
, pp. 
587
-
605
, doi: .
Brandt
,
H.
,
Umbach
,
N.
and
Kelava
,
A.
(
2015
), “
The standardization of linear and nonlinear effects in direct and indirect applications of structural equation mixture models for normal and nonnormal data
”,
Frontiers in Psychology
, Vol. 
6
, p.
1813
, doi: .
Brown
,
S.A.
,
Venkatesh
,
V.
,
Kuruzovich
,
J.
and
Massey
,
A.P.
(
2008
), “
Expectation confirmation: an examination of three competing models
”,
Organizational Behavior and Human Decision Processes
, Vol. 
105
No. 
1
, pp. 
52
-
66
, doi: .
Buchwald
,
A.
,
Letner
,
A.
,
Urbach
,
N.
and
Entreß-Fürsteneck
,
M.v.
(
2018
), “
Insights into personal ICT use: understanding continuance and discontinuance of wearable self-tracking devices
”,
ECIS 2018 Proceedings
.
Calvo-Porral
,
C.
,
Faíña-Medín
,
A.
and
Nieto-Mengotti
,
M.
(
2017
), “
Satisfaction and switching intention in mobile services: comparing lock-in and free contracts in the Spanish market
”, 
Telematics and Informatics
, Vol. 
34
No. 
5
, pp. 
717
-
729
, doi: .
Cenfetelli
,
R.T.
and
Schwarz
,
A.
(
2011
), “
Identifying and testing the inhibitors of technology usage intentions
”,
Information Systems Research
, Vol. 
22
No. 
4
, pp. 
808
-
823
, doi: .
Chang
,
Y.-W.
(
2020
), “
What drives organizations to switch to cloud ERP systems? The impacts of enablers and inhibitors
”,
Journal of Enterprise Information Management
, Vol. 
33
No. 
3
, pp. 
600
-
626
, doi: .
Cheung
,
C.M.K.
and
Lee
,
M.K.O.
(
2005
), “
The asymmetric effect of website attribute performance on satisfaction: an empirical study
”,
Proceedings of the 38th Annual Hawaii International Conference on System Sciences
,
IEEE
,
Big Island, Hawaii
,
03-06 Jan. 2005
,
175c
.
Chuah
,
S.H.-W.
,
Rauschnabel
,
P.A.
,
Marimuthu
,
M.
,
Thurasamy
,
R.
and
Nguyen
,
B.
(
2017
), “
Why do satisfied customers defect? A closer look at the simultaneous effects of switching barriers and inducements on customer loyalty
”,
Journal of Service Theory and Practice
, Vol. 
27
No. 
3
, pp. 
616
-
641
, doi: .
Ciriello
,
R.F.
and
Loss
,
S.
(
2023
), “
The yea-paradox: cognitive bias in technology acceptance surveys
”,
Information and Software Technology
, Vol. 
161
No. 
5
, 107253, doi: .
Converse
,
J.M.
and
Presser
,
S.
(
1986
),
Survey Questions: Handcrafting the Standardized Questionnaire: Survey Questions: Handcrafting the Standardized Questionnaire, Quantitative Applications in the Social Sciences, No. 07-001
,
SAGE Publications
,
Thousand Oaks, California
.
Davis
,
F.D.
(
1989
), “
Perceived usefulness, perceived ease of use, and user acceptance of information technology
”,
MIS Quarterly
, Vol. 
13
No. 
3
, p.
319
, doi: .
Delone
,
W.H.
and
McLean
,
E.R.
(
1992
), “
Information systems success: the quest for the dependent variable
”,
Information Systems Research
, Vol. 
3
No. 
1
, pp. 
60
-
95
, doi: .
Deng
,
Z.
,
Lu
,
Y.
,
Wei
,
K.K.
and
Zhang
,
J.
(
2010
), “
Understanding customer satisfaction and loyalty: an empirical study of mobile instant messages in China
”,
International Journal of Information Management
, Vol. 
30
No. 
4
, pp. 
289
-
300
, doi: .
Eggert
,
A.
and
Ulaga
,
W.
(
2002
), “
Customer perceived value: a substitute for satisfaction in business markets?
”,
Journal of Business and Industrial Marketing
, Vol. 
17
Nos.
2/3
, pp. 
107
-
118
, doi: .
Fornell
,
C.
and
Larcker
,
D.F.
(
1981
), “
Evaluating structural equation models with unobservable variables and measurement error
”,
Journal of Marketing Research
, Vol. 
18
No. 
1
, pp. 
39
-
50
, doi: .
Fournier
,
S.
and
Mick
,
D.G.
(
1999
), “
Rediscovering satisfaction
”,
Journal of Marketing
, Vol. 
63
No. 
4
, pp. 
5
-
23
, doi: .
Franke
,
G.R.
(
2010
), “Multicollinearity”, in
Sheth
,
J.
and
Malhotra
,
N.
(Eds),
Wiley International Encyclopedia of Marketing
,
John Wiley & Sons
,
Chichester
, Vol. 
34
, p.
227
, doi: .
Gefen
,
D.
,
Rigdon
,
E.E.
and
Straub
,
D.
(
2011
), “
Editor’s comments: an update and extension to SEM guidelines for administrative and social science research
”,
MIS Quarterly
, Vol. 
35
No. 
2
, pp. 
iii
-
xiv
, doi: .
Gerpott
,
T.J.
and
Ahmadi
,
N.
(
2015
), “
Regaining drifting mobile communication customers: predicting the odds of success of winback efforts with competing risks regression
”,
Expert Systems with Applications
, Vol. 
42
No. 
21
, pp. 
7917
-
7928
, doi: .
Gerpott
,
T.J.
and
Meinert
,
P.
(
2018
), “
Termination notice of mobile network operator customers after a tariff switch: an empirical study of postpaid subscribers in Germany
”,
Telecommunications Policy
, Vol. 
42
No. 
3
, pp. 
212
-
226
, doi: .
Gerpott
,
T.J.
and
Thomas
,
S.
(
2014
), “
Empirical research on mobile Internet usage: a meta-analysis of the literature
”,
Telecommunications Policy
, Vol. 
38
No. 
3
, pp. 
291
-
310
, doi: .
Gerpott
,
T.J.
,
Rams
,
W.
and
Schindler
,
A.
(
2001
), “
Customer retention, loyalty, and satisfaction in the German mobile cellular telecommunications market
”,
Telecommunications Policy
, Vol. 
25
No. 
4
, pp. 
249
-
269
, doi: .
Goodhue
,
D.L.
,
Klein
,
B.D.
and
March
,
S.T.
(
2000
), “
User evaluations of IS as surrogates for objective performance
”,
Information and Management
, Vol. 
38
No. 
2
, pp. 
87
-
101
, doi: .
Guillemin
,
F.
,
Bombardier
,
C.
and
Beaton
,
D.
(
1993
), “
Cross-cultural adaptation of health-related quality of life measures: literature review and proposed guidelines
”,
Journal of Clinical Epidemiology
, Vol. 
46
No. 
12
, pp. 
1417
-
1432
, doi: .
Hair
,
J.F.
,
Black
,
W.C.
,
Babin
,
B.J.
and
Anderson
,
R.E.
(
2010
),
Multivariate Data Analysis
, (7th ed.) ,
Prentice Hall
,
Upper Saddle River, New Jersey
.
Halilovic
,
S.
and
Cicic
,
M.
(
2013
), “
Antecedents of information systems user behaviour – extended expectation-confirmation model
”,
Behaviour and Information Technology
, Vol. 
32
No. 
4
, pp. 
359
-
370
, doi: .
Hardin
,
A.
,
Looney
,
C.A.
and
Moody
,
G.D.
(
2017
), “
Assessing the credibility of decisional guidance delivered by information systems
”,
Journal of Management Information Systems
, Vol. 
34
No. 
4
, pp. 
1143
-
1168
, doi: .
Hayes
,
A.F.
(
2013
),
Introduction to Mediation, Moderation, and Conditional Process Analysis: A Regression-Based Approach, Methodology in the Social Sciences
,
The Guilford Press
,
New York
.
Henseler
,
J.
,
Ringle
,
C.M.
and
Sinkovics
,
R.R.
(
2009
), “The use of partial least squares path modeling in international marketing”, in
Sinkovics
,
R.R.
and
Ghauri
,
P.N.
(Eds),
New Challenges to International Marketing, Advances in International Marketing
,
Emerald Group Publishing
, Vol. 
20
, pp. 
277
-
319
, doi: .
Herzberg
,
F.
(
1966
),
Work and the Nature of Man
,
Crowell
,
New York
.
Hossain
,
M.
and
Suchy
,
N.J.
(
2013
), “
Influence of customer satisfaction on loyalty: a study on mobile communication industry
”,
Journal of Social Sciences
, Vol. 
9
No. 
2
, pp. 
73
-
80
.
Huber
,
G.P.
and
Power
,
D.J.
(
1985
), “
Retrospective reports of strategic-level managers: guidelines for increasing their accuracy
”,
Strategic Management Journal
, Vol. 
6
No. 
2
, pp. 
171
-
180
, doi: .
Johnson
,
M.D.
and
Fornell
,
C.
(
1991
), “
A framework for comparing customer satisfaction across individuals and product categories
”,
Journal of Economic Psychology
, Vol. 
12
No. 
2
, pp. 
267
-
286
, doi: .
Kahneman
,
D.
and
Tversky
,
A.
(
1979
), “
Prospect theory: an analysis of decision under risk
”,
Econometrica
, Vol. 
47
No. 
2
, p.
263
, doi: .
Kassim
,
N.M.
and
Abdullah
,
N.A.
(
2008
), “
Customer loyalty in e-commerce settings: an empirical study
”,
Electronic Markets
, Vol. 
18
No. 
3
, pp. 
275
-
290
, doi: .
Keil
,
M.
,
Mann
,
J.
and
Rai
,
A.
(
2000
), “
Why software projects escalate: an empirical analysis and test of four theoretical models
”,
MIS Quarterly
, Vol. 
24
No. 
4
, p.
631
, doi: .
Kemp
,
A.H.
(
2005
), “
Getting what you paid for: quality of service and wireless connection to the internet
”,
International Journal of Information Management
, Vol. 
25
No. 
2
, pp. 
107
-
115
, doi: .
Ketokivi
,
M.A.
and
Schroeder
,
R.G.
(
2004
), “
Perceptual measures of performance: fact or fiction?
”,
Journal of Operations Management
, Vol. 
22
No. 
3
, pp. 
247
-
264
, doi: .
Kim
,
B.
(
2010
), “
An empirical investigation of mobile data service continuance: incorporating the theory of planned behavior into the expectation–confirmation model
”,
Expert Systems with Applications
, Vol. 
37
No. 
10
, pp. 
7033
-
7039
, doi: .
Kwak
,
D.-H.
,
Deng
,
S.
,
Kuem
,
J.
and
Kim
,
S.
(
2022
), “
How to achieve goals in digital games: an empirical test of a goal-oriented model in Pokémon GO
”,
Journal of the Association for Information Systems
, Vol. 
22
No. 
2
, pp. 
553
-
588
, doi: .
Liao
,
C.
,
Palvia
,
P.
and
Chen
,
J.-L.
(
2009
), “
Information technology adoption behavior life cycle: toward a Technology Continuance Theory (TCT)
”,
International Journal of Information Management
, Vol. 
29
No. 
4
, pp. 
309
-
320
, doi: .
Looney
,
C.A.
and
Hardin
,
A.M.
(
2020
), “
Beyond myopia: wealth accumulation mechanisms and evolving risk behaviors
”,
Decision
, Vol. 
7
No. 
2
, pp. 
163
-
181
, doi: .
Melone
,
N.P.
(
1990
), “
A theoretical assessment of the user-satisfaction construct in information systems research
”,
Management Science
, Vol. 
36
No. 
1
, pp. 
76
-
91
, doi: .
Muckler
,
F.A.
and
Seven
,
S.A.
(
1992
), “
Selecting performance measures: ‘objective’ versus ‘subjective’ measurement
”,
Human Factors: The Journal of the Human Factors and Ergonomics Society
, Vol. 
34
No. 
4
, pp. 
441
-
455
, doi: .
Oghuma
,
A.P.
,
Libaque-Saenz
,
C.F.
,
Wong
,
S.F.
and
Chang
,
Y.
(
2016
), “
An expectation-confirmation model of continuance intention to use mobile instant messaging
”,
Telematics and Informatics
, Vol. 
33
No. 
1
, pp. 
34
-
47
, doi: .
Oliver
,
R.L.
(
1980
), “
A cognitive model of the antecedents and consequences of satisfaction decisions
”,
Journal of Marketing Research
, Vol. 
17
No. 
4
, pp. 
460
-
469
, doi: .
Oliver
,
R.L.
(
1981
), “
Measurement and evaluation of satisfaction processes in retail settings
”,
Journal of Retailing
, Vol. 
57
No. 
3
, pp. 
25
-
48
.
Paraskeva
,
F.
,
Alexiou
,
A.
,
Mysirlaki
,
S.
,
Souki
,
A.M.
,
Panoutsos
,
S.
,
Gkemisi
,
S.
and
Boutsia
,
C.
(
2017
), “
Applying PBL and SRL to enhance learning strategies and collaboration in a blended learning environment
”,
Learning Technology for Education Challenges: 6th International Workshop, LTEC 2017
,
Springer International Publishing
,
Beijing
,
August 21-24, 2017
,
Proceedings 6
, pp. 
85
-
96
.
Parasuraman
,
A.
,
Zeithaml
,
V.A.
and
Berry
,
L.L.
(
1988
), “
Servqual: a multiple-item scale for measuring consumer perc
”,
Journal of Retailing
, Vol. 
64
No. 
1
, p.
12
.
Petter
,
S.
,
DeLone
,
W.
and
McLean
,
E.
(
2008
), “
Measuring information systems success: models, dimensions, measures, and interrelationships
”,
European Journal of Information Systems
, Vol. 
17
No. 
3
, pp. 
236
-
263
, doi: .
Podsakoff
,
P.M.
,
MacKenzie
,
S.B.
,
Lee
,
J.-Y.
and
Podsakoff
,
N.P.
(
2003
), “
Common method biases in behavioral research: a critical review of the literature and recommended remedies
”,
Journal of Applied Psychology
, Vol. 
88
No. 
5
, pp. 
879
-
903
, doi: .
Prasarnphanich
,
P.
,
Janz
,
B.D.
and
Patel
,
J.
(
2016
), “
Towards a better understanding of system analysts’ tacit knowledge
”,
Information Technology and People
, Vol. 
29
No. 
1
, pp. 
69
-
98
, doi: .
Raykov
,
T.
and
Marcoulides
,
G.A.
(
2006
), “
On multilevel model reliability estimation from the perspective of structural equation modeling
”,
Structural Equation Modeling: A Multidisciplinary Journal
, Vol. 
13
No. 
1
, pp. 
130
-
141
, doi: .
Scharkow
,
M.
(
2016
), “
The accuracy of self-reported internet use—a validation study using client log data
”,
Communication Methods and Measures
, Vol. 
10
No. 
1
, pp. 
13
-
27
, doi: .
Scott
,
J.E.
(
1995
), “
The measurement of information systems effectiveness: evaluating a measuring instrument
”,
ACM SIGMIS – Data Base: The DATABASE for Advances in Information Systems
, Vol. 
26
No. 
1
, pp. 
43
-
61
, doi: .
Seddon
,
P.
and
Kiew
,
M.-Y.
(
1996
), “
A partial test and development of Delone and Mclean’s model of IS success
”,
Australasian Journal of Information Systems
, Vol. 
4
No. 
1
, doi: .
Shaikh
,
A.A.
and
Karjaluoto
,
H.
(
2015
), “
Making the most of information technology and systems usage: a literature review, framework and future research agenda
”,
Computers in Human Behavior
, Vol. 
49
, pp. 
541
-
566
, doi: .
Souza
,
K.E.S.d.
,
Aviz
,
I.L.d.
,
Mello
,
H.D.d.
,
Figueiredo
,
K.
,
Vellasco
,
M.M.B.R.
,
Costa
,
F.A.R.
and
Seruffo
,
M.C.d.R.
(
2022
), “
An evaluation framework for user experience using eye tracking, mouse tracking, keyboard input, and artificial intelligence: a case study
”,
International Journal of Human–Computer Interaction
, Vol. 
38
No. 
7
, pp. 
646
-
660
, doi: .
Straub
,
D.
,
Limayem
,
M.
and
Karahanna-Evaristo
,
E.
(
1995
), “
Measuring system usage: implications for IS theory testing
”,
Management Science
, Vol. 
41
No. 
8
, pp. 
1328
-
1342
, doi: .
Tallon
,
P.P.
and
Kraemer
,
K.L.
(
2007
), “
Fact or fiction? A sensemaking perspective on the reality behind executives’ perceptions of IT business value
”,
Journal of Management Information Systems
, Vol. 
24
No. 
1
, pp. 
13
-
54
, doi: .
Tourangeau
,
R.
,
Rips
,
L.J.
and
Rasinski
,
K.
(
2012
),
The Psychology of Survey Response
,
Cambridge University Press
,
Cambridge and New York
.
Tuch
,
A.N.
and
Hornbæk
,
K.
(
2015
), “
Does Herzberg’s notion of hygienes and motivators apply to user experience?
”,
ACM Transactions on Computer-Human Interaction
, Vol. 
22
No. 
4
, pp. 
1
-
24
, doi: .
van de Vijver
,
F.J.R.
and
Poortinga
,
Y.H.
(
1997
), “
Towards an integrated analysis of bias in cross-cultural assessment
”,
European Journal of Psychological Assessment
, Vol. 
13
No. 
1
, pp. 
29
-
37
, doi: .
van der Heijden
,
H.
(
2003
), “
Factors influencing the usage of websites: the case of a generic portal in The Netherlands
”,
Information and Management
, Vol. 
40
No. 
6
, pp. 
541
-
549
, doi: .
van Jaarsveld
,
D.D.
,
Walker
,
D.D.
and
Skarlicki
,
D.P.
(
2010
), “
The role of job demands and emotional exhaustion in the relationship between customer and employee incivility
”,
Journal of Management
, Vol. 
36
No. 
6
, pp. 
1486
-
1504
, doi: .
VATM
(
2019
), “
21. TK-marktanalyse Deutschland 2019
”,
available at:
 https://www.vatm.de/wp-content/uploads/2019/10/VATM_TK-Marktstudie_2019_091019.pdf (
accessed
 28 November 2019).
Venkatesh
,
V.
and
Davis
,
F.D.
(
2000
), “
A theoretical extension of the technology acceptance model: four longitudinal field studies
”,
Management Science
, Vol. 
46
No. 
2
, pp. 
186
-
204
, doi: .
Venkatesh
and
Goyal
(
2010
), “
Expectation disconfirmation and technology adoption: polynomial modeling and response surface analysis
”,
MIS Quarterly
, Vol. 
34
No. 
2
, p.
281
, doi: .
Venkatesh
,
V.
,
Thong
,
J.Y.L.
,
Chan
,
F.K.Y.
,
Hu
,
P.J.-H.
and
Brown
,
S.A.
(
2011
), “
Extending the two-stage information systems continuance model: incorporating UTAUT predictors and the role of context
”,
Information Systems Journal
, Vol. 
21
No. 
6
, pp. 
527
-
555
, doi: .
Weitz
,
B.A.
(
1978
), “
Relationship between salesperson performance and understanding of customer decision making
”,
Journal of Marketing Research
, Vol. 
15
No. 
4
, pp. 
501
-
516
, doi: .
Yi
,
Y.
(
1990
), “
A critical review of consumer satisfaction
”,
Review of Marketing
, Vol. 
4
No. 
1
, pp. 
68
-
123
.
Yoo
,
D.K.
and
Park
,
J.A.
(
2007
), “
Perceived service quality
”,
International Journal of Quality and Reliability Management
, Vol. 
24
No. 
9
, pp. 
908
-
926
, doi: .
Zeithaml
,
V.A.
,
Berry
,
L.L.
and
Parasuraman
,
A.
(
1996
), “
The behavioral consequences of service quality
”,
Journal of Marketing
, Vol. 
60
No. 
2
, p.
31
, doi: .

Serial mediation results

Published by Emerald Publishing Limited. This article is published under the Creative Commons Attribution (CC BY 4.0) licence. Anyone may reproduce, distribute, translate and create derivative works of this article (for both commercial and non-commercial purposes), subject to full attribution to the original publication and authors. The full terms of this licence may be seen at http://creativecommons.org/licences/by/4.0/legalcode

Data & Figures

Figure 1
A diagram shows relationships between motivators, hygiene factors, and satisfaction with M N O.The diagram shows an oval labeled “Satisfaction with M N O.” An arrow labeled “H 1” extends from “Satisfaction with M N O” and points to an oval on the right labeled “Continuance Intention with Contract.” A rectangle labeled “Motivator” is on the top left, containing an oval labeled “Perceived Network Performance.” An arrow labeled “H 2” extends from “Perceived Network Performance” and leads to “Satisfaction with M N O.” A rectangle labeled “Hygiene Factor” is on the bottom left, containing an oval labeled “Actual Network Performance.” An arrow labeled “H 3” extends from “Actual Network Performance” and points to “Perceived Network Performance.” Another arrow labeled “H 4” extends from “Actual Network Performance” and points to “Satisfaction with M N O.”

Research model

Figure 1
A diagram shows relationships between motivators, hygiene factors, and satisfaction with M N O.The diagram shows an oval labeled “Satisfaction with M N O.” An arrow labeled “H 1” extends from “Satisfaction with M N O” and points to an oval on the right labeled “Continuance Intention with Contract.” A rectangle labeled “Motivator” is on the top left, containing an oval labeled “Perceived Network Performance.” An arrow labeled “H 2” extends from “Perceived Network Performance” and leads to “Satisfaction with M N O.” A rectangle labeled “Hygiene Factor” is on the bottom left, containing an oval labeled “Actual Network Performance.” An arrow labeled “H 3” extends from “Actual Network Performance” and points to “Perceived Network Performance.” Another arrow labeled “H 4” extends from “Actual Network Performance” and points to “Satisfaction with M N O.”

Research model

Close modal
Figure 2
A path diagram shows relationships between perceived network performance, M N O satisfaction, and contract intention.The diagram shows a rectangle at the top labeled “Satisfaction with M N O,” a rectangle on the bottom left labeled “Perceived Network Performance,” and a rectangle on the bottom right labeled “Continuance Intention with Contract.” “Perceived Network Performance” is connected to “Satisfaction with M N O” with a path coefficient of “Beta equals 0.8721. p less than 0.000,” and with a confidence interval of [0.8417; 0.9025]. “Satisfaction with M N O” is connected to “Continuance Intention with Contract” with a path coefficient of “Beta equals 0.5886 (p less than 0.000),” and with a confidence interval of [0.5028; 0.6744]. ”Perceived Network Performance” and “Continuance Intention with Contract” are connected through direct, indirect, and total effects: Direct effect: Beta equals 0.1661; p equals 0.0002; C I equals [0.0803; 0.2519]. Indirect effect: Beta equals 0.5134; B S C I equals [0.4317; 0.5966]. Total effect: Beta equals 0.6795; p greater than 0.000), C I equals [0.6338; 0.7251]. The R-squared value below “Continuance Intention with Contract” is 46.17 percent.

Results of mediation analysis

Figure 2
A path diagram shows relationships between perceived network performance, M N O satisfaction, and contract intention.The diagram shows a rectangle at the top labeled “Satisfaction with M N O,” a rectangle on the bottom left labeled “Perceived Network Performance,” and a rectangle on the bottom right labeled “Continuance Intention with Contract.” “Perceived Network Performance” is connected to “Satisfaction with M N O” with a path coefficient of “Beta equals 0.8721. p less than 0.000,” and with a confidence interval of [0.8417; 0.9025]. “Satisfaction with M N O” is connected to “Continuance Intention with Contract” with a path coefficient of “Beta equals 0.5886 (p less than 0.000),” and with a confidence interval of [0.5028; 0.6744]. ”Perceived Network Performance” and “Continuance Intention with Contract” are connected through direct, indirect, and total effects: Direct effect: Beta equals 0.1661; p equals 0.0002; C I equals [0.0803; 0.2519]. Indirect effect: Beta equals 0.5134; B S C I equals [0.4317; 0.5966]. Total effect: Beta equals 0.6795; p greater than 0.000), C I equals [0.6338; 0.7251]. The R-squared value below “Continuance Intention with Contract” is 46.17 percent.

Results of mediation analysis

Close modal
Figure 3
A path diagram shows relationships between failure rate, network performance, satisfaction, and contract intention.The diagram shows a path analysis model with four variables within rectangles: “Perceived Network Performance,” at the top, “Satisfaction with M N O,” at the bottom, “Dedicated Bearer Failure Rate,” on the left, and “Continuance Intention with Contract” on the right. The R-squared value below “Continuance Intention with Contract” is 54.49 percent. An arrow from “Dedicated Bearer Failure Rate” to “Perceived Network Performance” has a path coefficient of b equals negative 1.7625 (B S C I [negative 7.9551; 1.0370]), with beta equals negative 0.9151, p equals 0.5700. An arrow from “Dedicated Bearer Failure Rate” to “Satisfaction with M N O” has a path coefficient of b equals negative 0.1697 (B S C I [negative 1.9796; 1.8148]), with beta equals negative 0.2100, p equals 0.5715. An arrow from “Perceived Network Performance” to “Continuance Intention with Contract” has a path coefficient of b equals 0.1645 (B S C I [0.0745; 0.2596]), with beta equals 0.1662, p equals 0.0002. An arrow from “Satisfaction with M N O” to “Continuance Intention with Contract” has a path coefficient of b equals 0.5909 (B S C I [0.4973; 0.6821]), with beta equals 0.5892, p less than 0.0000. An arrow from “Perceived Network Performance” to “Satisfaction with M N O” has a path coefficient of b equals 0.8717 (B S C I [0.8427; 0.8999]), with beta equals 0.8718, p less than 0.0000. “Dedicated Bearer Failure Rate” and “Continuance Intention with Contract” are connected through direct and total effects: Direct effect: b equals negative 0.1503 (B S C I [negative 4.0143; 1.6474]), with beta equals 0.3774, p equals 0.4611. Total effect: b equals negative 0.7459 (B S C I [negative 5.5980; 0.7530]), with beta equals 0.3684, p equals 0.6276.

Results from serial mediation analysis for dedicated bearer failure rate (coefficients and model summary information)

Figure 3
A path diagram shows relationships between failure rate, network performance, satisfaction, and contract intention.The diagram shows a path analysis model with four variables within rectangles: “Perceived Network Performance,” at the top, “Satisfaction with M N O,” at the bottom, “Dedicated Bearer Failure Rate,” on the left, and “Continuance Intention with Contract” on the right. The R-squared value below “Continuance Intention with Contract” is 54.49 percent. An arrow from “Dedicated Bearer Failure Rate” to “Perceived Network Performance” has a path coefficient of b equals negative 1.7625 (B S C I [negative 7.9551; 1.0370]), with beta equals negative 0.9151, p equals 0.5700. An arrow from “Dedicated Bearer Failure Rate” to “Satisfaction with M N O” has a path coefficient of b equals negative 0.1697 (B S C I [negative 1.9796; 1.8148]), with beta equals negative 0.2100, p equals 0.5715. An arrow from “Perceived Network Performance” to “Continuance Intention with Contract” has a path coefficient of b equals 0.1645 (B S C I [0.0745; 0.2596]), with beta equals 0.1662, p equals 0.0002. An arrow from “Satisfaction with M N O” to “Continuance Intention with Contract” has a path coefficient of b equals 0.5909 (B S C I [0.4973; 0.6821]), with beta equals 0.5892, p less than 0.0000. An arrow from “Perceived Network Performance” to “Satisfaction with M N O” has a path coefficient of b equals 0.8717 (B S C I [0.8427; 0.8999]), with beta equals 0.8718, p less than 0.0000. “Dedicated Bearer Failure Rate” and “Continuance Intention with Contract” are connected through direct and total effects: Direct effect: b equals negative 0.1503 (B S C I [negative 4.0143; 1.6474]), with beta equals 0.3774, p equals 0.4611. Total effect: b equals negative 0.7459 (B S C I [negative 5.5980; 0.7530]), with beta equals 0.3684, p equals 0.6276.

Results from serial mediation analysis for dedicated bearer failure rate (coefficients and model summary information)

Close modal
Figure A1
A path diagram shows relationships between bearer failure rate, network performance, satisfaction, and contract intention.The diagram shows a path analysis model with four variables within rectangles: “Perceived Network Performance,” at the top, “Satisfaction with M N O,” at the bottom, “Dedicated Bearer Failure Rate,” on the left, and “Continuance Intention with Contract” on the right. The R-squared value below “Continuance Intention with Contract” is 54.47 percent. An arrow from “Dedicated Bearer Failure Rate” to “Perceived Network Performance” has a path coefficient of b equals 0.0091 (B S C I [negative 0.0135; 0.0227]), with beta equals negative 0.0094, p equals 0.3865. An arrow from “Dedicated Bearer Failure Rate” to “Satisfaction with M N O” has a path coefficient of b equals 0.0033 (B S C I [negative 0.0080; 0.0139]), with beta equals negative 0.0035, p equals 0.5144. An arrow from “Perceived Network Performance” to “Continuance Intention with Contract” has a path coefficient of b equals 0.1651 (B S C I [0.0738; 0.2591]), with beta equals 0.1662, p equals 0.0002. An arrow from “Satisfaction with M N O” to “Continuance Intention with Contract” has a path coefficient of b equals 0.5891 (B S C I [0.4950; 0.6799]), with beta equals 0.5883, p less than 0.0000. An arrow from “Perceived Network Performance” to “Satisfaction with M N O” has a path coefficient of b equals 0.8715 (B S C I [0.8141; 0.8997]), with beta equals 0.8718, p less than 0.0000. “Dedicated Bearer Failure Rate” and “Continuance Intention with Contract” are connected through direct and total effects: Direct effect: b equals 0.0024 (B S C I [negative 0.0084; 0.0104]), with beta equals 0.0029, p equals 0.6944. Total effect: b equals negative 0.7459 (B S C I [negative 5.5980; 0.7530]), with beta equals 0.3684, p equals 0.6276.

Results from serial mediation analysis for default bearer failure rate (coefficients and model summary information)

Figure A1
A path diagram shows relationships between bearer failure rate, network performance, satisfaction, and contract intention.The diagram shows a path analysis model with four variables within rectangles: “Perceived Network Performance,” at the top, “Satisfaction with M N O,” at the bottom, “Dedicated Bearer Failure Rate,” on the left, and “Continuance Intention with Contract” on the right. The R-squared value below “Continuance Intention with Contract” is 54.47 percent. An arrow from “Dedicated Bearer Failure Rate” to “Perceived Network Performance” has a path coefficient of b equals 0.0091 (B S C I [negative 0.0135; 0.0227]), with beta equals negative 0.0094, p equals 0.3865. An arrow from “Dedicated Bearer Failure Rate” to “Satisfaction with M N O” has a path coefficient of b equals 0.0033 (B S C I [negative 0.0080; 0.0139]), with beta equals negative 0.0035, p equals 0.5144. An arrow from “Perceived Network Performance” to “Continuance Intention with Contract” has a path coefficient of b equals 0.1651 (B S C I [0.0738; 0.2591]), with beta equals 0.1662, p equals 0.0002. An arrow from “Satisfaction with M N O” to “Continuance Intention with Contract” has a path coefficient of b equals 0.5891 (B S C I [0.4950; 0.6799]), with beta equals 0.5883, p less than 0.0000. An arrow from “Perceived Network Performance” to “Satisfaction with M N O” has a path coefficient of b equals 0.8715 (B S C I [0.8141; 0.8997]), with beta equals 0.8718, p less than 0.0000. “Dedicated Bearer Failure Rate” and “Continuance Intention with Contract” are connected through direct and total effects: Direct effect: b equals 0.0024 (B S C I [negative 0.0084; 0.0104]), with beta equals 0.0029, p equals 0.6944. Total effect: b equals negative 0.7459 (B S C I [negative 5.5980; 0.7530]), with beta equals 0.3684, p equals 0.6276.

Results from serial mediation analysis for default bearer failure rate (coefficients and model summary information)

Close modal
Figure A2
A path diagram shows relationships between call setup failure rate, performance, satisfaction, and contract intention.The diagram shows a path analysis model with four variables within rectangles: “Perceived Network Performance,” at the top, “Satisfaction with M N O,” at the bottom, “Call Setup Failure Rate,” on the left, and “Continuance Intention with Contract” on the right. The R-squared value below “Continuance Intention with Contract” is 54.51 percent. An arrow from “Call Setup Failure Rate” to “Perceived Network Performance” has a path coefficient of b equals negative 0.0056 (B S C I [negative 0.0271; 0.0132]), with beta equals negative 0.0054, p equals 0.5802. An arrow from “Call Setup Failure Rate” to “Satisfaction with M N O” has a path coefficient of b equals 0.0084 (B S C I [negative 0.0009; 0.0201]), with beta equals negative 0.0078, p equals 0.1063. An arrow from “Perceived Network Performance” to “Continuance Intention with Contract” has a path coefficient of b equals 0.1690 (B S C I [0.0734; 0.2621]), with beta equals 0.1685, p equals 0.0001. An arrow from “Satisfaction with M N O” to “Continuance Intention with Contract” has a path coefficient of b equals 0.5867 (B S C I [0.4929; 0.6822]), with beta equals 0.5863, p less than 0.0000. An arrow from “Perceived Network Performance” to “Satisfaction with M N O” has a path coefficient of b equals 0.8728 (B S C I [0.8431; 0.9009]), with beta equals 0.8725, p less than 0.0000. “Call Setup Failure Rate” and “Continuance Intention with Contract” are connected through direct and total effects: Direct effect: b equals 0.0070 (B S C I [negative 0.0035; 0.0179]), with beta equals 0.0070, p equals 0.2936. Total effect: b equals 0.0009 (B S C I [negative 0.0139; 0.0157]), with beta equals 0.0078, p equals 0.4251.

Results from serial mediation analysis for call setup failure rate (coefficients and model summary information)

Figure A2
A path diagram shows relationships between call setup failure rate, performance, satisfaction, and contract intention.The diagram shows a path analysis model with four variables within rectangles: “Perceived Network Performance,” at the top, “Satisfaction with M N O,” at the bottom, “Call Setup Failure Rate,” on the left, and “Continuance Intention with Contract” on the right. The R-squared value below “Continuance Intention with Contract” is 54.51 percent. An arrow from “Call Setup Failure Rate” to “Perceived Network Performance” has a path coefficient of b equals negative 0.0056 (B S C I [negative 0.0271; 0.0132]), with beta equals negative 0.0054, p equals 0.5802. An arrow from “Call Setup Failure Rate” to “Satisfaction with M N O” has a path coefficient of b equals 0.0084 (B S C I [negative 0.0009; 0.0201]), with beta equals negative 0.0078, p equals 0.1063. An arrow from “Perceived Network Performance” to “Continuance Intention with Contract” has a path coefficient of b equals 0.1690 (B S C I [0.0734; 0.2621]), with beta equals 0.1685, p equals 0.0001. An arrow from “Satisfaction with M N O” to “Continuance Intention with Contract” has a path coefficient of b equals 0.5867 (B S C I [0.4929; 0.6822]), with beta equals 0.5863, p less than 0.0000. An arrow from “Perceived Network Performance” to “Satisfaction with M N O” has a path coefficient of b equals 0.8728 (B S C I [0.8431; 0.9009]), with beta equals 0.8725, p less than 0.0000. “Call Setup Failure Rate” and “Continuance Intention with Contract” are connected through direct and total effects: Direct effect: b equals 0.0070 (B S C I [negative 0.0035; 0.0179]), with beta equals 0.0070, p equals 0.2936. Total effect: b equals 0.0009 (B S C I [negative 0.0139; 0.0157]), with beta equals 0.0078, p equals 0.4251.

Results from serial mediation analysis for call setup failure rate (coefficients and model summary information)

Close modal
Figure A3
A path diagram shows relationships between dropped call rate, performance, satisfaction, and contract intention.The diagram shows a path analysis model with four variables within rectangles: “Perceived Network Performance,” at the top, “Satisfaction with M N O,” at the bottom, “Dropped Call Rate,” on the left, and “Continuance Intention with Contract” on the right. The R-squared value below “Continuance Intention with Contract” is 54.55 percent. An arrow from “Dropped Call Rate” to “Perceived Network Performance” has a path coefficient of b equals negative 0.0979 (B S C I [negative 0.1785; negative 0.0281]), with beta equals negative 0.0960, p equals 0.0188. An arrow from “Dropped Call Rate” to “Satisfaction with M N O” has a path coefficient of b equals negative 0.0007 (B S C I [negative 0.0455; 0.0420]), with beta equals 0.0002, p equals 0.9934. An arrow from “Perceived Network Performance” to “Continuance Intention with Contract” has a path coefficient of b equals 0.1687 (B S C I [0.0747; 0.2623]), with beta equals 0.1683, p equals 0.0001. An arrow from “Satisfaction with M N O” to “Continuance Intention with Contract” has a path coefficient of b equals 0.5888 (B S C I [0.4950; 0.6812]), with beta equals 0.5886, p less than 0.0000. An arrow from “Perceived Network Performance” to “Satisfaction with M N O” has a path coefficient of b equals 0.8721 (B S C I [0.8442; 0.9007]), with beta equals 0.8721, p less than 0.0000. “Dropped Call Rate” and “Continuance Intention with Contract” are connected through direct and total effects: Direct effect: b equals 0.0379 (B S C I [negative 0.0169; 0.0905]), with beta equals 0.0382, p equals 0.1675. Total effect: b equals negative 0.0653 (B S C I [negative 0.0139; 0.0121]), with beta equals negative 0.0271, p equals 0.5079.

Results from serial mediation analysis for dropped call rate (coefficients and model summary information)

Figure A3
A path diagram shows relationships between dropped call rate, performance, satisfaction, and contract intention.The diagram shows a path analysis model with four variables within rectangles: “Perceived Network Performance,” at the top, “Satisfaction with M N O,” at the bottom, “Dropped Call Rate,” on the left, and “Continuance Intention with Contract” on the right. The R-squared value below “Continuance Intention with Contract” is 54.55 percent. An arrow from “Dropped Call Rate” to “Perceived Network Performance” has a path coefficient of b equals negative 0.0979 (B S C I [negative 0.1785; negative 0.0281]), with beta equals negative 0.0960, p equals 0.0188. An arrow from “Dropped Call Rate” to “Satisfaction with M N O” has a path coefficient of b equals negative 0.0007 (B S C I [negative 0.0455; 0.0420]), with beta equals 0.0002, p equals 0.9934. An arrow from “Perceived Network Performance” to “Continuance Intention with Contract” has a path coefficient of b equals 0.1687 (B S C I [0.0747; 0.2623]), with beta equals 0.1683, p equals 0.0001. An arrow from “Satisfaction with M N O” to “Continuance Intention with Contract” has a path coefficient of b equals 0.5888 (B S C I [0.4950; 0.6812]), with beta equals 0.5886, p less than 0.0000. An arrow from “Perceived Network Performance” to “Satisfaction with M N O” has a path coefficient of b equals 0.8721 (B S C I [0.8442; 0.9007]), with beta equals 0.8721, p less than 0.0000. “Dropped Call Rate” and “Continuance Intention with Contract” are connected through direct and total effects: Direct effect: b equals 0.0379 (B S C I [negative 0.0169; 0.0905]), with beta equals 0.0382, p equals 0.1675. Total effect: b equals negative 0.0653 (B S C I [negative 0.0139; 0.0121]), with beta equals negative 0.0271, p equals 0.5079.

Results from serial mediation analysis for dropped call rate (coefficients and model summary information)

Close modal
Table 1

Objective measures

NameDefinition
Default bearer failure rateRate of failed default bearer transactions relative to all default bearer transactions (this transaction type is used to establish a general LTE connection.)
Dedicated bearer failure rateRate of failed dedicated bearer transactions relative to all dedicated bearer transactions (this transaction is used to establish a specific tunnel for a specific LTE service.)
Call setup failure rateRate of unsuccessful voice calls relative to all attempted voice calls
Dropped call rateRate of dropped voice calls after connection relative to all connected voice calls

Source(s): Authors’ own work

Table 2

Descriptive statistics

MeanStandard deviationCronbach’s alphaComposite reliabilityVariance Inflation Factor (VIF)
Perceived network performance3.901.0990.9200.9313.038
Satisfaction with MNO3.941.1420.8970.9252.607
Continuance intention with contract3.771.3410.8620.923

Source(s): Authors’ own work

Table 3

Correlations and discriminant validity

Average variance extracted (AVE)Perceived network performanceSatisfactionContinuance intention
Perceived network performance0.6610.813  
Satisfaction with MNO0.7650.640**0.872 
Continuance intention with contract0.8780.601**0.767**0.937

Note(s): **Correlation is sig at 0.01; the diagonal shows the square root of AVE values

Source(s): Authors’ own work

Table A1

Questionnaire items

Construct nameNumber of itemsOriginItems
Continuance intention with contract3Bhattacherjee (2001a) I want to continue using my MNO rather than terminating my contract
  My intentions are to continue using my MNO rather than any alternative means
  If I could, I would like to discontinue use of my MNO.
Satisfaction with the MNO4Chuah et al. (2017) Overall, I am very satisfied with [MNO name] as a mobile operator
  [MNO name] always meets my expectations
  To date, [MNO name] has never disappointed me
  All in all, my experience with the [MNO name] network has been consistently positive
Perceived network performance7Bhattacherjee (2001a) In general, I am satisfied with the quality of the [MNO name] network
  When I need a mobile connection, it’s available
  I am satisfied with [MNO name] network coverage
  I am satisfied with the connection speed when using a mobile data connection
  I am satisfied with the voice quality of my mobile connection
  My mobile connection is sufficient to watch online videos
  I would recommend the [MNO name] mobile network to my friends

Source(s): Authors’ own work

Supplements

References

Aksoy
,
L.
,
Buoye
,
A.
,
Aksoy
,
P.
,
Larivière
,
B.
and
Keiningham
,
T.L.
(
2013
), “
A cross-national investigation of the satisfaction and loyalty linkage for mobile telecommunications services across eight countries
”,
Journal of Interactive Marketing
, Vol. 
27
No. 
1
, pp. 
74
-
82
, doi: .
Alexander
,
E.R.
and
Wilkins
,
R.D.
(
1982
), “
Performance rating validity: the relationship of objective and subjective measures of performance
”,
Group and Organization Studies
, Vol. 
7
No. 
4
, pp. 
485
-
496
, doi: .
Althuizen
,
N.
,
Reichel
,
A.
and
Wierenga
,
B.
(
2012
), “
Help that is not recognized: harmful neglect of decision support systems
”,
Decision Support Systems
, Vol. 
54
No. 
1
, pp. 
719
-
728
, doi: .
Bagozzi
,
R.P.
and
Yi
,
Y.
(
1988
), “
On the evaluation of structural equation models
”,
Journal of the Academy of Marketing Science
, Vol. 
16
No. 
1
, pp. 
74
-
94
, doi: .
Bagozzi
,
R.P.
,
Yi
,
Y.
and
Phillips
,
L.W.
(
1991
), “
Assessing construct validity in organizational research
”,
Administrative Science Quarterly
, Vol. 
36
No. 
3
, p.
421
, doi: .
Bharati
,
P.
and
Berg
,
D.
(
2005
), “
Service quality from the other side: information systems management at Duquesne Light
”,
International Journal of Information Management
, Vol. 
25
No. 
4
, pp. 
367
-
380
, doi: .
Bhattacherjee
,
A.
(
2001a
), “
An empirical analysis of the antecedents of electronic commerce service continuance
”,
Decision Support Systems
, Vol. 
32
No. 
2
, pp. 
201
-
214
, doi: .
Bhattacherjee
,
A.
(
2001b
), “
Understanding information systems continuance: an expectation-confirmation model
”,
MIS Quarterly
, Vol. 
25
No. 
3
, p.
351
, doi: .
Bhattacherjee
,
A.
,
Limayem
,
M.
and
Cheung
,
C.M.K.
(
2012
), “
User switching of information technology: a theoretical synthesis and empirical test
”,
Information and Management
, Vol. 
49
Nos.
7-8
, pp. 
327
-
333
, doi: .
Bommer
,
W.H.
,
Johnson
,
J.
,
Rich
,
G.A.
,
Podsakoff
,
P.M.
and
MacKenzie
,
S.B.
(
1995
), “
On the interchangeability of objective and subjective measures of employee performance: a meta-analysis
”,
Personnel Psychology
, Vol. 
48
No. 
3
, pp. 
587
-
605
, doi: .
Brandt
,
H.
,
Umbach
,
N.
and
Kelava
,
A.
(
2015
), “
The standardization of linear and nonlinear effects in direct and indirect applications of structural equation mixture models for normal and nonnormal data
”,
Frontiers in Psychology
, Vol. 
6
, p.
1813
, doi: .
Brown
,
S.A.
,
Venkatesh
,
V.
,
Kuruzovich
,
J.
and
Massey
,
A.P.
(
2008
), “
Expectation confirmation: an examination of three competing models
”,
Organizational Behavior and Human Decision Processes
, Vol. 
105
No. 
1
, pp. 
52
-
66
, doi: .
Buchwald
,
A.
,
Letner
,
A.
,
Urbach
,
N.
and
Entreß-Fürsteneck
,
M.v.
(
2018
), “
Insights into personal ICT use: understanding continuance and discontinuance of wearable self-tracking devices
”,
ECIS 2018 Proceedings
.
Calvo-Porral
,
C.
,
Faíña-Medín
,
A.
and
Nieto-Mengotti
,
M.
(
2017
), “
Satisfaction and switching intention in mobile services: comparing lock-in and free contracts in the Spanish market
”, 
Telematics and Informatics
, Vol. 
34
No. 
5
, pp. 
717
-
729
, doi: .
Cenfetelli
,
R.T.
and
Schwarz
,
A.
(
2011
), “
Identifying and testing the inhibitors of technology usage intentions
”,
Information Systems Research
, Vol. 
22
No. 
4
, pp. 
808
-
823
, doi: .
Chang
,
Y.-W.
(
2020
), “
What drives organizations to switch to cloud ERP systems? The impacts of enablers and inhibitors
”,
Journal of Enterprise Information Management
, Vol. 
33
No. 
3
, pp. 
600
-
626
, doi: .
Cheung
,
C.M.K.
and
Lee
,
M.K.O.
(
2005
), “
The asymmetric effect of website attribute performance on satisfaction: an empirical study
”,
Proceedings of the 38th Annual Hawaii International Conference on System Sciences
,
IEEE
,
Big Island, Hawaii
,
03-06 Jan. 2005
,
175c
.
Chuah
,
S.H.-W.
,
Rauschnabel
,
P.A.
,
Marimuthu
,
M.
,
Thurasamy
,
R.
and
Nguyen
,
B.
(
2017
), “
Why do satisfied customers defect? A closer look at the simultaneous effects of switching barriers and inducements on customer loyalty
”,
Journal of Service Theory and Practice
, Vol. 
27
No. 
3
, pp. 
616
-
641
, doi: .
Ciriello
,
R.F.
and
Loss
,
S.
(
2023
), “
The yea-paradox: cognitive bias in technology acceptance surveys
”,
Information and Software Technology
, Vol. 
161
No. 
5
, 107253, doi: .
Converse
,
J.M.
and
Presser
,
S.
(
1986
),
Survey Questions: Handcrafting the Standardized Questionnaire: Survey Questions: Handcrafting the Standardized Questionnaire, Quantitative Applications in the Social Sciences, No. 07-001
,
SAGE Publications
,
Thousand Oaks, California
.
Davis
,
F.D.
(
1989
), “
Perceived usefulness, perceived ease of use, and user acceptance of information technology
”,
MIS Quarterly
, Vol. 
13
No. 
3
, p.
319
, doi: .
Delone
,
W.H.
and
McLean
,
E.R.
(
1992
), “
Information systems success: the quest for the dependent variable
”,
Information Systems Research
, Vol. 
3
No. 
1
, pp. 
60
-
95
, doi: .
Deng
,
Z.
,
Lu
,
Y.
,
Wei
,
K.K.
and
Zhang
,
J.
(
2010
), “
Understanding customer satisfaction and loyalty: an empirical study of mobile instant messages in China
”,
International Journal of Information Management
, Vol. 
30
No. 
4
, pp. 
289
-
300
, doi: .
Eggert
,
A.
and
Ulaga
,
W.
(
2002
), “
Customer perceived value: a substitute for satisfaction in business markets?
”,
Journal of Business and Industrial Marketing
, Vol. 
17
Nos.
2/3
, pp. 
107
-
118
, doi: .
Fornell
,
C.
and
Larcker
,
D.F.
(
1981
), “
Evaluating structural equation models with unobservable variables and measurement error
”,
Journal of Marketing Research
, Vol. 
18
No. 
1
, pp. 
39
-
50
, doi: .
Fournier
,
S.
and
Mick
,
D.G.
(
1999
), “
Rediscovering satisfaction
”,
Journal of Marketing
, Vol. 
63
No. 
4
, pp. 
5
-
23
, doi: .
Franke
,
G.R.
(
2010
), “Multicollinearity”, in
Sheth
,
J.
and
Malhotra
,
N.
(Eds),
Wiley International Encyclopedia of Marketing
,
John Wiley & Sons
,
Chichester
, Vol. 
34
, p.
227
, doi: .
Gefen
,
D.
,
Rigdon
,
E.E.
and
Straub
,
D.
(
2011
), “
Editor’s comments: an update and extension to SEM guidelines for administrative and social science research
”,
MIS Quarterly
, Vol. 
35
No. 
2
, pp. 
iii
-
xiv
, doi: .
Gerpott
,
T.J.
and
Ahmadi
,
N.
(
2015
), “
Regaining drifting mobile communication customers: predicting the odds of success of winback efforts with competing risks regression
”,
Expert Systems with Applications
, Vol. 
42
No. 
21
, pp. 
7917
-
7928
, doi: .
Gerpott
,
T.J.
and
Meinert
,
P.
(
2018
), “
Termination notice of mobile network operator customers after a tariff switch: an empirical study of postpaid subscribers in Germany
”,
Telecommunications Policy
, Vol. 
42
No. 
3
, pp. 
212
-
226
, doi: .
Gerpott
,
T.J.
and
Thomas
,
S.
(
2014
), “
Empirical research on mobile Internet usage: a meta-analysis of the literature
”,
Telecommunications Policy
, Vol. 
38
No. 
3
, pp. 
291
-
310
, doi: .
Gerpott
,
T.J.
,
Rams
,
W.
and
Schindler
,
A.
(
2001
), “
Customer retention, loyalty, and satisfaction in the German mobile cellular telecommunications market
”,
Telecommunications Policy
, Vol. 
25
No. 
4
, pp. 
249
-
269
, doi: .
Goodhue
,
D.L.
,
Klein
,
B.D.
and
March
,
S.T.
(
2000
), “
User evaluations of IS as surrogates for objective performance
”,
Information and Management
, Vol. 
38
No. 
2
, pp. 
87
-
101
, doi: .
Guillemin
,
F.
,
Bombardier
,
C.
and
Beaton
,
D.
(
1993
), “
Cross-cultural adaptation of health-related quality of life measures: literature review and proposed guidelines
”,
Journal of Clinical Epidemiology
, Vol. 
46
No. 
12
, pp. 
1417
-
1432
, doi: .
Hair
,
J.F.
,
Black
,
W.C.
,
Babin
,
B.J.
and
Anderson
,
R.E.
(
2010
),
Multivariate Data Analysis
, (7th ed.) ,
Prentice Hall
,
Upper Saddle River, New Jersey
.
Halilovic
,
S.
and
Cicic
,
M.
(
2013
), “
Antecedents of information systems user behaviour – extended expectation-confirmation model
”,
Behaviour and Information Technology
, Vol. 
32
No. 
4
, pp. 
359
-
370
, doi: .
Hardin
,
A.
,
Looney
,
C.A.
and
Moody
,
G.D.
(
2017
), “
Assessing the credibility of decisional guidance delivered by information systems
”,
Journal of Management Information Systems
, Vol. 
34
No. 
4
, pp. 
1143
-
1168
, doi: .
Hayes
,
A.F.
(
2013
),
Introduction to Mediation, Moderation, and Conditional Process Analysis: A Regression-Based Approach, Methodology in the Social Sciences
,
The Guilford Press
,
New York
.
Henseler
,
J.
,
Ringle
,
C.M.
and
Sinkovics
,
R.R.
(
2009
), “The use of partial least squares path modeling in international marketing”, in
Sinkovics
,
R.R.
and
Ghauri
,
P.N.
(Eds),
New Challenges to International Marketing, Advances in International Marketing
,
Emerald Group Publishing
, Vol. 
20
, pp. 
277
-
319
, doi: .
Herzberg
,
F.
(
1966
),
Work and the Nature of Man
,
Crowell
,
New York
.
Hossain
,
M.
and
Suchy
,
N.J.
(
2013
), “
Influence of customer satisfaction on loyalty: a study on mobile communication industry
”,
Journal of Social Sciences
, Vol. 
9
No. 
2
, pp. 
73
-
80
.
Huber
,
G.P.
and
Power
,
D.J.
(
1985
), “
Retrospective reports of strategic-level managers: guidelines for increasing their accuracy
”,
Strategic Management Journal
, Vol. 
6
No. 
2
, pp. 
171
-
180
, doi: .
Johnson
,
M.D.
and
Fornell
,
C.
(
1991
), “
A framework for comparing customer satisfaction across individuals and product categories
”,
Journal of Economic Psychology
, Vol. 
12
No. 
2
, pp. 
267
-
286
, doi: .
Kahneman
,
D.
and
Tversky
,
A.
(
1979
), “
Prospect theory: an analysis of decision under risk
”,
Econometrica
, Vol. 
47
No. 
2
, p.
263
, doi: .
Kassim
,
N.M.
and
Abdullah
,
N.A.
(
2008
), “
Customer loyalty in e-commerce settings: an empirical study
”,
Electronic Markets
, Vol. 
18
No. 
3
, pp. 
275
-
290
, doi: .
Keil
,
M.
,
Mann
,
J.
and
Rai
,
A.
(
2000
), “
Why software projects escalate: an empirical analysis and test of four theoretical models
”,
MIS Quarterly
, Vol. 
24
No. 
4
, p.
631
, doi: .
Kemp
,
A.H.
(
2005
), “
Getting what you paid for: quality of service and wireless connection to the internet
”,
International Journal of Information Management
, Vol. 
25
No. 
2
, pp. 
107
-
115
, doi: .
Ketokivi
,
M.A.
and
Schroeder
,
R.G.
(
2004
), “
Perceptual measures of performance: fact or fiction?
”,
Journal of Operations Management
, Vol. 
22
No. 
3
, pp. 
247
-
264
, doi: .
Kim
,
B.
(
2010
), “
An empirical investigation of mobile data service continuance: incorporating the theory of planned behavior into the expectation–confirmation model
”,
Expert Systems with Applications
, Vol. 
37
No. 
10
, pp. 
7033
-
7039
, doi: .
Kwak
,
D.-H.
,
Deng
,
S.
,
Kuem
,
J.
and
Kim
,
S.
(
2022
), “
How to achieve goals in digital games: an empirical test of a goal-oriented model in Pokémon GO
”,
Journal of the Association for Information Systems
, Vol. 
22
No. 
2
, pp. 
553
-
588
, doi: .
Liao
,
C.
,
Palvia
,
P.
and
Chen
,
J.-L.
(
2009
), “
Information technology adoption behavior life cycle: toward a Technology Continuance Theory (TCT)
”,
International Journal of Information Management
, Vol. 
29
No. 
4
, pp. 
309
-
320
, doi: .
Looney
,
C.A.
and
Hardin
,
A.M.
(
2020
), “
Beyond myopia: wealth accumulation mechanisms and evolving risk behaviors
”,
Decision
, Vol. 
7
No. 
2
, pp. 
163
-
181
, doi: .
Melone
,
N.P.
(
1990
), “
A theoretical assessment of the user-satisfaction construct in information systems research
”,
Management Science
, Vol. 
36
No. 
1
, pp. 
76
-
91
, doi: .
Muckler
,
F.A.
and
Seven
,
S.A.
(
1992
), “
Selecting performance measures: ‘objective’ versus ‘subjective’ measurement
”,
Human Factors: The Journal of the Human Factors and Ergonomics Society
, Vol. 
34
No. 
4
, pp. 
441
-
455
, doi: .
Oghuma
,
A.P.
,
Libaque-Saenz
,
C.F.
,
Wong
,
S.F.
and
Chang
,
Y.
(
2016
), “
An expectation-confirmation model of continuance intention to use mobile instant messaging
”,
Telematics and Informatics
, Vol. 
33
No. 
1
, pp. 
34
-
47
, doi: .
Oliver
,
R.L.
(
1980
), “
A cognitive model of the antecedents and consequences of satisfaction decisions
”,
Journal of Marketing Research
, Vol. 
17
No. 
4
, pp. 
460
-
469
, doi: .
Oliver
,
R.L.
(
1981
), “
Measurement and evaluation of satisfaction processes in retail settings
”,
Journal of Retailing
, Vol. 
57
No. 
3
, pp. 
25
-
48
.
Paraskeva
,
F.
,
Alexiou
,
A.
,
Mysirlaki
,
S.
,
Souki
,
A.M.
,
Panoutsos
,
S.
,
Gkemisi
,
S.
and
Boutsia
,
C.
(
2017
), “
Applying PBL and SRL to enhance learning strategies and collaboration in a blended learning environment
”,
Learning Technology for Education Challenges: 6th International Workshop, LTEC 2017
,
Springer International Publishing
,
Beijing
,
August 21-24, 2017
,
Proceedings 6
, pp. 
85
-
96
.
Parasuraman
,
A.
,
Zeithaml
,
V.A.
and
Berry
,
L.L.
(
1988
), “
Servqual: a multiple-item scale for measuring consumer perc
”,
Journal of Retailing
, Vol. 
64
No. 
1
, p.
12
.
Petter
,
S.
,
DeLone
,
W.
and
McLean
,
E.
(
2008
), “
Measuring information systems success: models, dimensions, measures, and interrelationships
”,
European Journal of Information Systems
, Vol. 
17
No. 
3
, pp. 
236
-
263
, doi: .
Podsakoff
,
P.M.
,
MacKenzie
,
S.B.
,
Lee
,
J.-Y.
and
Podsakoff
,
N.P.
(
2003
), “
Common method biases in behavioral research: a critical review of the literature and recommended remedies
”,
Journal of Applied Psychology
, Vol. 
88
No. 
5
, pp. 
879
-
903
, doi: .
Prasarnphanich
,
P.
,
Janz
,
B.D.
and
Patel
,
J.
(
2016
), “
Towards a better understanding of system analysts’ tacit knowledge
”,
Information Technology and People
, Vol. 
29
No. 
1
, pp. 
69
-
98
, doi: .
Raykov
,
T.
and
Marcoulides
,
G.A.
(
2006
), “
On multilevel model reliability estimation from the perspective of structural equation modeling
”,
Structural Equation Modeling: A Multidisciplinary Journal
, Vol. 
13
No. 
1
, pp. 
130
-
141
, doi: .
Scharkow
,
M.
(
2016
), “
The accuracy of self-reported internet use—a validation study using client log data
”,
Communication Methods and Measures
, Vol. 
10
No. 
1
, pp. 
13
-
27
, doi: .
Scott
,
J.E.
(
1995
), “
The measurement of information systems effectiveness: evaluating a measuring instrument
”,
ACM SIGMIS – Data Base: The DATABASE for Advances in Information Systems
, Vol. 
26
No. 
1
, pp. 
43
-
61
, doi: .
Seddon
,
P.
and
Kiew
,
M.-Y.
(
1996
), “
A partial test and development of Delone and Mclean’s model of IS success
”,
Australasian Journal of Information Systems
, Vol. 
4
No. 
1
, doi: .
Shaikh
,
A.A.
and
Karjaluoto
,
H.
(
2015
), “
Making the most of information technology and systems usage: a literature review, framework and future research agenda
”,
Computers in Human Behavior
, Vol. 
49
, pp. 
541
-
566
, doi: .
Souza
,
K.E.S.d.
,
Aviz
,
I.L.d.
,
Mello
,
H.D.d.
,
Figueiredo
,
K.
,
Vellasco
,
M.M.B.R.
,
Costa
,
F.A.R.
and
Seruffo
,
M.C.d.R.
(
2022
), “
An evaluation framework for user experience using eye tracking, mouse tracking, keyboard input, and artificial intelligence: a case study
”,
International Journal of Human–Computer Interaction
, Vol. 
38
No. 
7
, pp. 
646
-
660
, doi: .
Straub
,
D.
,
Limayem
,
M.
and
Karahanna-Evaristo
,
E.
(
1995
), “
Measuring system usage: implications for IS theory testing
”,
Management Science
, Vol. 
41
No. 
8
, pp. 
1328
-
1342
, doi: .
Tallon
,
P.P.
and
Kraemer
,
K.L.
(
2007
), “
Fact or fiction? A sensemaking perspective on the reality behind executives’ perceptions of IT business value
”,
Journal of Management Information Systems
, Vol. 
24
No. 
1
, pp. 
13
-
54
, doi: .
Tourangeau
,
R.
,
Rips
,
L.J.
and
Rasinski
,
K.
(
2012
),
The Psychology of Survey Response
,
Cambridge University Press
,
Cambridge and New York
.
Tuch
,
A.N.
and
Hornbæk
,
K.
(
2015
), “
Does Herzberg’s notion of hygienes and motivators apply to user experience?
”,
ACM Transactions on Computer-Human Interaction
, Vol. 
22
No. 
4
, pp. 
1
-
24
, doi: .
van de Vijver
,
F.J.R.
and
Poortinga
,
Y.H.
(
1997
), “
Towards an integrated analysis of bias in cross-cultural assessment
”,
European Journal of Psychological Assessment
, Vol. 
13
No. 
1
, pp. 
29
-
37
, doi: .
van der Heijden
,
H.
(
2003
), “
Factors influencing the usage of websites: the case of a generic portal in The Netherlands
”,
Information and Management
, Vol. 
40
No. 
6
, pp. 
541
-
549
, doi: .
van Jaarsveld
,
D.D.
,
Walker
,
D.D.
and
Skarlicki
,
D.P.
(
2010
), “
The role of job demands and emotional exhaustion in the relationship between customer and employee incivility
”,
Journal of Management
, Vol. 
36
No. 
6
, pp. 
1486
-
1504
, doi: .
VATM
(
2019
), “
21. TK-marktanalyse Deutschland 2019
”,
available at:
 https://www.vatm.de/wp-content/uploads/2019/10/VATM_TK-Marktstudie_2019_091019.pdf (
accessed
 28 November 2019).
Venkatesh
,
V.
and
Davis
,
F.D.
(
2000
), “
A theoretical extension of the technology acceptance model: four longitudinal field studies
”,
Management Science
, Vol. 
46
No. 
2
, pp. 
186
-
204
, doi: .
Venkatesh
and
Goyal
(
2010
), “
Expectation disconfirmation and technology adoption: polynomial modeling and response surface analysis
”,
MIS Quarterly
, Vol. 
34
No. 
2
, p.
281
, doi: .
Venkatesh
,
V.
,
Thong
,
J.Y.L.
,
Chan
,
F.K.Y.
,
Hu
,
P.J.-H.
and
Brown
,
S.A.
(
2011
), “
Extending the two-stage information systems continuance model: incorporating UTAUT predictors and the role of context
”,
Information Systems Journal
, Vol. 
21
No. 
6
, pp. 
527
-
555
, doi: .
Weitz
,
B.A.
(
1978
), “
Relationship between salesperson performance and understanding of customer decision making
”,
Journal of Marketing Research
, Vol. 
15
No. 
4
, pp. 
501
-
516
, doi: .
Yi
,
Y.
(
1990
), “
A critical review of consumer satisfaction
”,
Review of Marketing
, Vol. 
4
No. 
1
, pp. 
68
-
123
.
Yoo
,
D.K.
and
Park
,
J.A.
(
2007
), “
Perceived service quality
”,
International Journal of Quality and Reliability Management
, Vol. 
24
No. 
9
, pp. 
908
-
926
, doi: .
Zeithaml
,
V.A.
,
Berry
,
L.L.
and
Parasuraman
,
A.
(
1996
), “
The behavioral consequences of service quality
”,
Journal of Marketing
, Vol. 
60
No. 
2
, p.
31
, doi: .

Languages

or Create an Account

Close Modal
Close Modal