


This paper examines the liquidity of SA REITs and their relationship to the Black Economic Empowerment (BEE) score. Firm liquidity has long been an area of research interest. In South Africa, all REITs are required to share a substantial percentage of their revenue towards BEE; thus, this directly affects their liquidity. The paper adopts the BEE score for all SA REITs to measure their compliance levels and the link to a REIT liquidity.
Thirty-three REITs from 2013 until 2024 are adopted. To capture the different dimensions of a securitised REIT, more than one liquidity measure is used. We use four proxies to calculate REIT liquidity we then use ordinary least squares models and fixed effects for analysis.
The study finds that the BEE has a positive association with an SA REIT liquidity, implying that REITs that comply with BEE policy are likely to have improved liquidity.
Complying with government policy has been linked with firms’ good financial standing. Highly compliant REITs wanting to maintain their liquidity levels should consider the influence of the macro-economic factors, particularly the adverse relationships that negatively affect REIT liquidity, such as employment levels.
This is the first study to probe the BEE and REIT liquidity in the South African context.
1. Introduction
Real estate investment trusts (REITs) have been in existence for six decades and research has increased significantly over the past two decades (Brounen and De Koning, 2012; Devine et al., 2024; Feng et al., 2011; Letdin et al., 2019). REITs have demonstrated substantial growth globally from just over USD 200 million in the mid-1960s to USD 8.7 billion in 1990 and recently to USD 2.5 trillion in 2023. Europe has experienced notable growth since 2020 and India’s REIT market has more than doubled since 2020 (FTSE Russell, 2024). REITs are vital components of the economy, investors’ portfolios and local communities. Much of REITs’ research in respect of performance has been rich (Feng et al., 2011).
A review by Yun (2009) identified liquidity as an effective way to measure whether a company was meeting its obligations, because a company with high liquidity can pay its bills on time and in full. Fang et al. (2009) further argue that liquidity increases the information content of market prices and performance-sensitive managerial compensation. Marcato and Ward (2007), along with Downs et al. (2025), report that REITs are required to distribute a significant portion of their earning in various countries, which impact liquidity. In most developed nations, this requirement is prevalent; in the US, REITs are mandated to distribute at least 90% of their earnings. Similar regulations apply in European countries such as the UK, Germany, France, the Netherlands and Spain. Asian countries including Singapore, Malaysia, India and Japan; as well as Australia in Oceania, also have REIT regulations (Ghosh and Petrova, 2021). REITs tend to hold considerably less cash than other public firms (Hardin et al., 2009).
Research on firms’ liquidity remains the significant area of research (Chung et al., 2011; Gupta, 2022; Pigou, 1936; Zhao et al., 2023). Marzuki and Newel (2021) found REITs to be a seamless tool to measure liquidity. Similarly, Marcato and Ward (2007) focussed on the Americas, demonstrating that REITs are a suitable for studying firm liquidity, supporting Clayton and MacKinnon (2000), who reached similar conclusion in their study on the Americas. In an emerging economy, Niskanen (2020) was also viewed REITs as an effective method for analysing firm liquidity. REITs’ liquidity has been associated with holding cash (Downs and Zhu, 2022), greater investment activity (Brockman and Chung, 2003; Cheung et al., 2023; DiBartolomeo and Gatchev, 2021) macro-economic factors and asset structure (Downs and Zhu, 2022).
In the context of Africa, South Africa stands out as the key market with rapidly growing REIT sector. As the main representative of REITs on the continent, South Africa has experienced remarkable growth since the first REIT was listed in 2013. As of 2025, there are 33 listed REITs on the Johannesburg Stock Exchange (JSE), with a total market capitalisation of approximately R455billion – roughly USD 27 billion. This growth reflects increasing investor confidence and more sophisticated regulatory environment aimed at fostering transparency and market stability.
A distinctive feature of the South African REIT (SA REIT) market is the integration of Black Economic Empowerment (BEE) policy, which mandates that REIT allocate at least 70% of their earnings towards the BEE initiatives (DTI, 2023), which may impact REITs’ liquidity. The policy aims to redress historical inequalities, this requirement potentially impacts the liquidity of REITs, both positively and negatively, by influencing cash reserves, investment allocations and disclosure practises. The South African (SA) landscape is subject to comprehensive disclosure regulations, which aim to improve transparency, corporate governance (CG) and investor confidence (Ntim and Soobaroyen, 2013). These policies are designed to ensure that firms, including REITs, adhere to high standards of financial reporting and accountability, ultimately supporting market liquidity. Despite the critical importance of BEE and disclosure policies, academic research on their specific impact on REIT liquidity remain limited, especially within the SA context. To bridge this knowledge gap, this study aims to investigate the relationship between BEE scores and liquidity levels of listed REITs in South Africa. Specifically, the study seeks to answer the questions: What is the relationship between BEE scores and liquidity levels of listed REITs in SA?
In SA, the government has made the BEE the central component of achieving economic transformation. Southhall (2004) noted that the African National Congress (ANC) has keen interests in implementing this policy for their political agenda. After assuming power in 1994, the then new democratic government introduced the BEE to re-address the economic and social unrest created by apartheid. The policy initially had seven principles – (1 Management control, (2) Ownership, (3) Preferential procurement, (4) Skills development, (5) Employment equity, (6) Enterprise development and (7) Residual (Ntim et al., 2012). Southhall (2004) explained that the first two BEE principles emphasise ensuring the inclusion of Black owners and that the majority of the top executive members should be Black. The second and third principles focus on ensuring the development and improvement of Black people’s lives. Unlike previous literature in the SA context, this study developed the BEE score for each listed REIT firm and this is measured with the firm’s liquidity. Recently, Apergis and Dastidar (2024) linked liquidity to specific contexts and policies applicable in a country and found that this can influence the firm’s liquidity.
There is ample evidence on disclosure policies and non-REIT firms. With the ever-growing importance of disclosure studies in developing nations, existing empirical studies concentrate on developed countries; for instance, El Ghoul et al. (2011) focused on the US context and Tuan et al. (2019) and Yi et al. (2020) focused on Vietnam and China, respectively. There is level of importance conferred to compliance with disclosure policies and the financial well-being of an organisation Hu et al., 2012; Rashid et al., 2010; Rennings et al., 2003). There is evidence globally on REITs and liquidity, although studies in emerging economy contexts are very limited (Morri and Baccarin, 2016). Sartorius and Botha (2008), Ntim et al. (2012), Ntim and Soobaroyen (2013) and Van der Merwe and Ferreira (2014) considered some of the seven BEE principles which could have more influence than others. Jefferis and Okeahalam (2000), Ntim and Soobaroven (2013) and Thomas (2017) proved a positive association with the JSE listed corporations’ performance with BEE principles, with a noteworthy positive association with companies’ performance. Ntim and Soobaroyen (2013) proved a positive connection concerning compliant companies.
This study contributes to literature in various ways. For the first time, we examine the link between REIT liquidity and BEE. There is not significant work conducted in South Africa on REITs and the BEE; the exceptions are studies by Akinsomi et al. (2016) on REIT performance and Ajayi and Akinsomi (2023) on secondary equity offerings (SEOs) and the BEE, but with a lack of evidence on REITs and liquidity, even though liquidity has been deemed as an effective way to measure whether a company was meeting its obligations, as reported by Yun (2009). REITs have been in existence in South Africa since 2013. This study, for the first time, provides evidence of a decade-long dataset to ascertain the impact of BEE on SA REIT liquidity. This is imperative because REITs allocate a substantial amount of their revenue to BEE. In general, the key contribution of this paper is with regards to SA REIT liquidity and the BEE. Second, we apply the agency cost theory, as, when a firm has free cashflow, then conflicts of interest may arise between its shareholders and management. Liquidity has been deemed to mitigate agency problems (Yun, 2009). According to Ntim et al. (2012), to mitigate agency problems, companies should comply with BEE. The nature of the BEE initiatives suggests that there is significant wealth and monetary implications for shareholders in SA firms following the implementation of the BEE; for example, according to Ntim and Soobaroyen (2013), the additional income as a result of the BEE may be invested in social themes. Liquidity measures the financial standing of a firm and this measure is considered important (Zhao et al., 2023).
Third, there is a growing interest in REITs futures as a form of REIT trading that enhances liquidity in developed nations (Ahn et al., 2025; Lee et al., 2014, 2022). In the USA, the results on adopting REITs futures trading led to the decision on whether to increase liquidity or decrease speculative demand (Ahn et al., 2025), while in Europe, Lee et al. (2022) ascertained that futures trading leads to the stabilisation of REITs. However, there are limited studies in emerging economies and no studies on this in Africa. In SA, REITs investors trade using futures contracts; however, this type of trading is not yet established as is the case in developed nations (JSE, 2025). We know that there is a link between volatility and futures markets (Lee et al., 2014) and this paper contributes to the volatility aspect, as the main contribution is with regards to the link between liquidity ratio and BEE policy. Fourth, we proxy that property type affects REIT liquidity (Danielsen and Harrison, 2007); in addition, property type of SA REIT informs us that liquidity does influence REITs, as these are highly segmented. Macro-economic variables influence firms’ liquidity (Downs and Zhu, 2022; Wang et al., 2022) – for instance, changes in consumer price index (CPI) can either adversely or positively influence liquidity.
This paper focuses on the SA context to examine the key factors influencing BEE score and SA REIT liquidity. Furthermore, variables like control for companies audited by the Big 5 auditing firms in South Africa as well as macro-economic variables are included in the study. The BEE as an affirmative action is included, however, it has not been studied intensively to date. Even though Ntim and Soobaroyen (2013) considered the BEE and HIV/AIDS, this has not been applied in the context of the SA REIT. The SA CG framework required all JSE-listed corporations to improve their strategic framework performance and adhere to disclosure practices. The most recent version of CG placed more emphasis on the need for all corporations to comply (Moloi et al., 2024). More work is required on the impact that BEE practices have on listed corporations as called for by Ntim et al. (2012). Ntim et al. (2012) further argued that more work is also required on the impact of BEE practices on firms’ financial standing.
The present study closes the gap in the literature with regards to considering all seven principles and the scores of each listed SA REIT firm. REITs in South Africa spend substantial amounts of their revenue towards BEE so liquidity becomes an area of concern, which, to the best of our knowledge, no study has addressed. Some studies on BEE and REITs, including Akinsomi et al. (2016), provide evidence of the impact of SA REITs on the BEE and performance and Ajayi and Akinsomi (2023) show evidence for the impact on SEOs, but evidence in firms’ liquidity is lacking. Second the study closes the gap in the literature on agency cost with regards to BEE and REITs. Third, we control for property type; fourth, we adopt macro-economic variables that include CPI, interest rates, GDP and employment levels. For instance, CPI is a measure of inflation, when inflation goes up the overall market liquidity like trading volume also goes up and vice versa. Fifth, we control for the COVID-19 dummy and volatility.
This study aims to investigate our primary hypothesis (H1) posits that there is a positive correlation between the BEE score and the liquidity of SA REITs. Specifically, we seek to establish a positive relationship between the BEE score and the liquidity of SA REITs, with the goal of contributing to the existing body of knowledge on this topic.
1.1 SA REITs
The SA REIT is the prominent real estate investment in an emerging market like SA, which is the only nation with substantial representation in the African region on the FTSE/EPRA NAREIT (WFE, 2018). Foreign and local investors require more studies on SA REITs (Carstens and Freybote, 2018). On average, SA REITs have around 30% of their investments offshore and approximately 30%–40% of their earnings come from outside South Africa (JSE, 2019). In addition, REITs are important to investors globally, as nearly 40 countries have REITs with a market capitalisation of approximately USD 1.7 trillion in 2020. In 2021, this was slightly lower, at USD 1.6 trillion, but rose again and on 1 February 2023 it went up to USD 2.5 trillion (FTSE Russell, 2024). Market capitalisation determines the value of a company that is traded on the stock market (Bauer et al., 2004). SA REITs now encompass 5.8% of the Johannesburg Stock Exchange JSE. The SA REITs market was liquid as of January 2023 and the market capitalisation of 33 listed REITs as of 1 February 2023 was R549. 22 billion (JSE, 2020).
Table 1, below, shows the top five highest performing REITs by market capitalisation and their BEE compliance level. Fortress income fund increased its market capitalisation by over 50% in 2024 compared to 2023. Other REITs have witnessed pronounced increase in market capital; however, growth points dropped slightly in 2014 compared to 2023 (Simply Wall Street, 2024). A REIT that has different sectors is basically diversified. The last column in Table 1 shows the BEE-level contributors, where 8 is the least contributing or non-compliant REIT and 1 is the highest contributor or most compliant.
Top five REITs by market capitalisation
| REITs | Focus | Size of portfolio (in Rands) | Size of portfolio (in US Dollars) | BEE compliance level |
|---|---|---|---|---|
| Growthpoint-Property-Fund | Diversified | R43,390 bn | $25 bn | 1 |
| Redefine Properties Ltd | Diversified: without residential | R32,620 bn | $1.919 bn | 1 |
| Resilient-Property-Income Fund | Retail | R19,800 bn | $1.164 bn | 7 |
| ForttressIncomeFundLtd | Diversified | R23,590 bn | $1,387 bn | 4 |
| Vukile-Property-Fund | Diversified: without residential | R16,769 bn | $986 m | 3 |
Source(s): Wall Street Journal (2023, 2024); Centre for Affordable Housing Finance in Africa, (2017); Real-estate investment trust (website), (2023)
South Africa’s unique BEE context introduced after the apartheid regime was intended to re-address disequilibrium issues; this was investigated by Esser and Dekker (2008). BEE-compliant companies are compelled to have a social conscience (Van der Merwe and Ferreira, 2014). Some studies on the BEE include that by Ntim and Soobaroyen (2013) on the BEE compliance and firm’s performance. Other studies, including Ntim et al. (2012), focused on the BEE principles and the importance of achieving the required BEE score which may influence the firm’s performance. Van der Merwe and Ferreira (2014) studied the importance of complying with the BEE and there were other similar studies by Jefferis and Okeahalam (2000) and Sartorius and Botha (2008).
The BEE score card in South Africa is important as an essential component of any industry. The higher the BEE ranking of a firm, the more likely it is that the firm will benefit from various opportunities (Sibeta, 2013). Firm liquidity has been associated with good financial standing (Fang et al., 2009). Hence, REITs are ranked by market capitalisation, as shown in Table 1, above. Table 2, below, shows the seven BEE principles of the top five REITs. The second column shows the maximum score that the firm has obtained per principle and the remaining columns show each of the top five SA REITs and their BEE scores per principle.
BEE principles score of top five REITs
| Criteria | Maximum score | Forttress | Growth point | Redefine | Resilient | Vukile |
|---|---|---|---|---|---|---|
| Ownership | 30 | 15.26 | 20.13 | 31 | 19.30 | 26 |
| Management control | 9 | 4 | 5.69 | 7 | 3.48 | 4.33 |
| Employment equity | 13 | 2.51 | 6.84 | 7.35 | 23.37 | 4.48 |
| Skills development | 19 | 14.75 | 18.47 | 17.76 | 0 | 17.31 |
| Enterprise development | 5 | 38.97 | 42.16 | 35.69 | 23.37 | 31.34 |
| Socio-economic development | 2 | 2 | 2 | 2 | 1.31 | 2 |
| Economic development | 5 | 5 | 5 | 5 | 0 | 4 |
| Overall result | 117 | 83.49 | 100 | 105.80 | 47.47 | 90.46 |
Source(s): BEE certificates (2023).
1.2 Black economic empowerment (BEE)
After the 1994 elections in SA, many policies were introduced to re-address the inequalities of apartheid with the number of appeals that resurfaced; however, it was only after the stock market crash in 1998 that the BEE was first introduced (DTI, 2023; Sartorius and Botha, 2008). BEE compliance is associated with increase of ownership of wealth on the JSE (Sartorious and Botha, 2008; Southall, 2004). Since 1994, investors have been convinced that disclosure and adhering to BEE principles has a positive impact on stock performance (Ntim et al., 2012).
1.3 BEE and SA-listed firms
After a cost and benefit analysis is carried out on each of the principles, each company then considers all the BEE principles. As at 2015, BEE deals to the value of R350 billion were concluded by the top 100 companies on the JSE; also in addition, deals to the value of R50 billion were concluded by private corporations. As a result, the SA GDP has been transferred to 20% of the country’s population since 2000 (Business Day, 2018).
Sartorious and Botha (2008) mentioned in their study that it is essential for companies to follow advice on integrating BEE into their strategic frameworks in order to improve the company’s performance. The authors also asserted that a company that complies with BEE principles will assist in achieving South Africa’s economic goals. The BEE policy encourages companies to use the criteria on selecting a BEE partner, shown in Table 3, below. This table sets out a checklist for selecting a board of directors’ member or any candidate in top-level management if they are a suitable BEE partner as this a requirement for BEE principles 1 and 2. In addition, private equity has proved popular for BEE equity ownership transaction (Ntim et al., 2012).
Checklist for evaluating the suitability of a BEE partner
| Checklist | Variables |
|---|---|
| 1. Degree of investment | Industry charter, competitors and compliance with other BEE factors |
| 2. Motives for BEE deal | Social interest, political networks and upsurge market share |
| 3. Appropriateness of BEE partner | Internal versus external, management skills, funds and political networks |
| 4. Source of funding | Third party finance, loans and own finance |
Source(s): Sartorious and Botha (2008)
The present study documents the relationship between the BEE and SA REIT liquidity. The result further highlights that SA REITs that comply with BEE principles are likely to have a strong financial standing. The study sample includes 33 SA REITs; however, only the SA REITs that comply with the BEE are included in the tests.
The remainder of this paper is organised as follows. First, the related literature is reviewed. Next, the data and model to test SA REIT liquidity and the BEE are shown. The data and the empirical results are then discussed and, finally, conclusions are provided.
2. Literature review
2.1 Theories
There are many theories that have been investigated widely for disclosure studies. These include the agency, resource dependency, legitimacy and instrumental theories.
For the present paper, the focus is on SA REITs and the BEE influence on REIT liquidity and market capitalisation (El Ghoul et al., 2011). Companies with pronounced disclosure practices are associated with improved liquidity. The most popular theory is the agency theory, introduced by Berle and Means (1932) to understand the relationship between agents and principals. Then, in 1976, Jensen and Meckling determined how to mitigate agency problems by separating ownership and control of shareholders and corporate executives.
These conflicts of interest were later formalised by Jensen and Meckling in their principal–agent theory or model which was introduced in their seminal 1976 paper. Georgen and Renneboog (2006) named the two types of agency problems – perquisites and empire building. Perquisites (perks) also are benefits offered to the manager. These benefits increase the managers “remuneration costs but are financed by the shareholders. They come in various forms; for example, the use of a company car, exquisite private offices, and CEO mansions, all funded by shareholders. In addition, managers can also give jobs to family members instead of the most qualified candidate—this is also known as nepotism (Georgen and Renneboog, 2006). Yermack (2006) found that CEOs that used private jets underperform by 4% compared to CEOs who do not utilise private jets, and they also found a correlation between personal use of private jets and membership of long-distance golf clubs (Cheng and Firth, 2005). This implies that managers take projects that support self-interest. According to Fang et al. (2009), this may adversely affect firms” liquidity if managers take on these projects. All listed firms on JSE are required to comply with BEE; same applies to REITs (Ntim et al., 2012). Managers can engage in nepotism when reporting on BEE pillars, serving personal interest instead of the organisation The second BEE principle, employment equity, requires that the firm has Black females, people with disabilities and those from disadvantaged groups. Family members can be hired over competent candidates. Liquidity is known to measure the company’s financial standing (Yun, 2009).
Jensen (1986) identified the second agency problem known as empire building, also known as the free cash flow problem. Shareholders are more concerned about pursuing growth rather than value maximisation.
Cashflow that remains after an investment is known as free cashflow. When a firm has free cashflow, then conflicts of interest may arise between shareholders and management. Liquidity has been deemed to mitigate agency problems (Yun, 2009). The present study investigates SA’s BEE policy. Managers may pursue their own growth instead of that of the organisation, not spending additional funds on BEE initiatives but on themselves. According to Ntim et al. (2012), to mitigate agency problems, companies should comply with BEE.
The second theory, the resource dependency theory, considers that those corporations that profess to have disclosure policies in place can increase their performance by acquiring competitive advantage (Ntim et al., 2012). According to Apergies et al. (2014), liquidity was linked to firm performance and to context-specific policies that are applicable in a country. The present study considers BEE policy that is applicable in South Africa to determine whether this policy influences SA REIT liquidity.
The third theory, which is the legitimacy theory, suggests that a corporation’s will is legitimised if its value system is unswerving and aligns with the greater social system (Ntim et al., 2012). The BEE was enacted to re-address social ills and disequilibrium in the society and organisations (Southall, 2004). The present study unpacks BEE and SA REIT liquidity to determine whether there is a relation.
The last theory, instrumental stakeholder theory, suggests that disclosure is used as an instrument by corporations to achieve the informational needs (Ntim et al., 2012). This theory is applicable to SA REITs, as they require information on how to improve their compliance level and improve their BEE score. This paper seeks to discover the relation between SA REIT liquidity and the BEE.
3. Empirical evidence
3.1 Liquidity and REITs
3.1.1 REIT liquidity and pricing
This part of the review considers various contributions of liquidity and REITs. First, holding more cash increases REIT stock liquidity, according to Downs and Zhu (2022). They found a positive relationship between property market liquidity and REIT stock liquidity. This relationship is stronger for REITs with lower growth opportunities, less information advantage and greater financial constraints. This kind of evidence is not from South Africa or the African context, as the markets are different. The SA REIT has a great representation in the African context with 33 REITs (JSE, 2020). Moreover, there is evidence on liquidity and REIT costs; this was investigated by Clayton and Mackinnon (2000) who resolved that increased liquidity indicates better stock pricing and they also found a link with REIT liquidity and the company’s reduced costs. According to DiBartolomeo and Gatchev (2021), the pricing of REITs tends to increase relative to the broader stock market, while Amihud et al. (2006) posted that liquidity has major effects on the pricing of firms’ stocks and bonds and on investors’ returns for holding them. The association of the REIT and stock pricing on the SA REIT has not been studied and there is limited evidence on SA REIT and liquidity.
3.1.2 REIT liquidity and investment
There is further evidence in liquidity studies whereby liquidity has been associated with enhanced REIT investment activity and investors are attracted to firms with better liquidity, as confirmed by Brockman and Chung (2003). Additionally, Brockman and Chung (2003) determined that firm liquidity is significantly affected by investor dividend payouts. However, this kind of evidence is silent in the SA context literature. Most of these studies are in developed economies. According DiBartolomeo and Gatchev (2021), the REIT liquidity and investment findings provide support for the notion that investors view dividend payouts as a source of enhanced liquidity and, further, that REITs, as a security class with relatively high regulatory mandated payout requirements, provide investors with an important benefit in the form of reduced liquidity risk. Furthermore, Cheung et al. (2023) emphasised that investors are subject to cognitive biases; they also argued that there are several key issues with liquidity management that can be managed through efficient investment in the future.
3.1.3 REIT liquidity and macro-economic factors
Liquidity has also been linked to macro-economic factors. According to Downs and Zhu (2022), managers can actively influence stock liquidity through asset structure and macro-economic factors. In their study, macro-economic factors seemed to influence REIT liquidity significantly. Moreover, Wang et al. (2022) found that (1) REIT liquidity is influenced by changes in macro-economic factors; (2) macro-economic effects are different across phases of the business cycle and (3) funding liquidity is significantly positively related to REIT market liquidity. This evidence on REIT liquidity and macro-economic factors is silent in the SA context, although macro-economic factors are deemed to affect the liquidity of a firm. The present study adopts the macro-economic variables in the tests. More studies were conducted outside the African context on REIT liquidity and macro-economic factors and Hoesli et al. (2017) found that economic factors affect the buying and selling activity. Demirci et al. (2023) determined that the amount of unencumbered assets is an important determinant of selling activity and cost of borrowing. They also emphasised that the impact on selling activity and loan spreads is less pronounced for financially healthy REITs.
3.1.4 REIT liquidity and daily closing bid spread
Liquidity has been associated with daily closing bid spread of REITs. There is evidence in the literature by Cannon and Cole (2011) that liquidity is used to measure readily available daily returns data rather than market microstructure. Blau et al. (2015) adopted daily average bid–ask spreads (BASPR) and found that these were higher for REITs than for non-REITs. More evidence on this was reported by Soyeh and Wiley (2019), that the variability of BASPRs is larger for REITs than for non-REITs and that the skewness of REIT BASPR has not only increased across time but has also increased at a greater rate than the skewness of non-REIT spreads. This kind of evidence is silent in the SA context on REITs.
This review has discussed various elements that may influence a REIT’s liquidity; these include stock liquidity, enhanced investment, macro-economic factors and daily bid spread. According to Apergies et al. (2014) liquidity was linked with country-specific policies. The policy of interest for this paper is the BEE.
3.1.5 Liquidity and future markets
There is some evidence from developed nations with more established REITs sector. This includes a study by Lee et al. (2014) which proved that future markets improve REIT liquidity provision in Europe. Another study by Lee et al. (2022) found that policymakers should encourage listed real estate futures. Recently, Ahn et al. (2025) reported that the decision should be between increasing liquidity or decrease speculative demand in future US markets. This study looks at the impact that a policy like BEE has on REITs’ liquidity. In SA, JSE offers investors the chance to trade REITs using future contracts, but this model of trading is not as established as in the USA and some countries in Europe (JSE, 2025).
3.2 BEE, policies and REITs and liquidity
3.2.1 SA BEE policy
South Africa’s listed firms are compelled to comply with BEE policy; their noncompliance is punishable and this could affect their financial standing (Ntim and Soobaroyen, 2013; Southall, 2004) – this applies to REITs as well. There is a lack of evidence on localised policies and REITs’ liquidity. The SA’s unique BEE policy has not been studied in this context. Sartorius and Botha (2008) attested that corporations have participated in the BEE because of the supposed notion that compliance is related to profit making. Thomas (2017) opined that BEE compliance will improve SA’s economy and will improve financial standing.
Nguyen and Muniandy (2021) determined that listed firms with more female or Black directors on corporate boards are associated with a higher level of stock liquidity. Ntim et al. (2012) reported that Black and female boards influence firm performance.
BEE compliance is significant in South Africa and it has been linked to firm performance. As the BEE is associated with firm profitability and good social standing, the BEE has also been linked with the companies’ worth determined by the stock market. (e.g. Esser and Dekker, 2008; Ntim and Soobaroyen, 2013; Padia and Yasseen, 2011; Sartorius and Botha, 2008; Seate et al., 2016; Thomas, 2017; Van der Merwe and Ferreira, 2014), The SA framework compelled all corporates to consider the interests of other stakeholders; this report also emphasised that companies should comply with the BEE as one of the most important policies to re-address inequalities (DTI, 2023; Ntim and Soobaroyen, 2013; Southall, 2004). Thus, all corporations have to disclose their BEE (DTI, 2023). South Africa government-owned corporations are more likely to comply with BEE disclosure as they continue to seek government support and to have access to added support such as deals, which can enhance performance (De Villiers and Van Staden, 2006). Improved BEE disclosure is also associated with government tenure (Eng and Mak, 2003; Ntim et al., 2012).
In contrast to other literature, Ntim (2013) attested that including people of colour amongst board-level executive directors has become less significant in motivating corporate culture. Independence and diversity unswervingly affect corporate resolutions. Coleman (2008) stated that board activity impacts profits negatively, although length of CEO tenure in office improves profitability. Furthermore, the size of and how often the meetings are held also increases profitability.
Seate et al. (2016) findings from their correlation analysis proved that there was a relationship between BEE principles and firms’ strong financial standing, while Van der Merwe and Ferreira (2014) showed a positive relationship between management elements of BEE and the organisation’s part earnings. Prior studies focussed on the accounting and finance that enhance the understanding and effect of BEE submission through the execution of general score cards. Padia and Yassen’s (2011) cross-sectional study showed that SA companies strongly care about the strategy variables of mission, objectives and goals compared to Dutch listed firms. Thomas (2017) asserted that BEE principles will serve to advance the economy, as there is a relationship with compliance to BEE principles and better performance of the JSE listed firms. Jefferis and Okeahalam (2000) had similar sentiments for their cross-sectional study that policy compliance, such as BEE in South Africa, proved to have a positive link with listed companies’ performance. Ntim et al. (2012) attested that companies that have successful land investment structures with government were BEE-compliant. According to an extension of the Security of Tenure Act 62 of 1997, land tenure is associated with the acquisition and development of land for government. This land can be secured through leases also known as government tenure.
3.3 Other government policies and liquidity
A significant body of literature lays emphasis on firm compliance with government policies and performance, which shows a positive relationship globally. A cross-sectional European study by Rennings et al. (2003) found that policy compliance has a positive association with stock performance, whereas some variables in their study proved to have a significant influence on average monthly stock return. Hu et al. (2012) reported that administrative strategy makers should consider evaluating the cost and receivables of accounting-based rules. However, a study conducted in Bangladesh, Rashid et al. (2010) found that political policies have a positive effect on company performance and that informal attributes such as cultural, demographic, connectedness and so forth have an adverse effect on company performance.
Earlier, Weber (2014) was of the view that accountability and compliance with government policies have a positive association with stock performance. Additionally, Chang et al. (2015) found that company performance was related to whether the firm was state owned or not, with similar results to Weber (2014). In a different context, Pelayo-Maciel et al. (2017) was certain that foreign direct investment in a Mexican stock market has an ambiguous relationship with performance and this was related to compliance with government policies in a study by Chen and Lai (2013), where investors were certain of informal reclassification introduced by the government in China Taiwan. They found that the influence of performance on government policies.
3.4 REITs’ liquidity and BEE policy
Currently, there is evidence with regards to SA REIT literature on BEE. These studies include a study on BEE and SA REIT performance by Akinsomi et al. (2016). Another study by Ajayi and Akinsomi (2023) focused on SEOs. However, this evidence has not studied liquidity and REITs. As mentioned above, firms’ liquidity measures the firms’ good financial standing, according to Ntim et al. (2012) and Yun (2009). It is imperative that this kind of study is pursued to close this gap in the literature. Firms’ liquidity improves when a new REIT is introduced (Clayton and MacKinnon, 2000; Marcato and Ward, 2007).
4. Literature gap
As the present study investigates BEE and SA REIT liquidity, the literature review also looked at evidence on SA BEE policy. Much of the BEE literature was on companies by Thomas (2017) who reported that compliance with BEE will improve the SA economy; moreover, studies by Seate et al. (2016) on BEE and firm performance reported the same. Other studies – for example, Ntim and Soobaroyen (2013) – investigated listed firms and not SA REITs. Furthermore, Jefferis and Okeahalm (2000) undertook a cross-sectional study and found a link between performance and the BEE. The present study is cross-sectional; it is also unique in a sense that it investigates the BEE and liquidity, which has not been studied in the SA context. Companies with pronounced disclosure practices are associated with improved liquidity.
In the SA context, there is evidence on SA REITs and the BEE. One study was conducted in 2016 by Akinsomi on BEE and performance and another in 2013 by Ajayi and Akinsomi on SEOs and BEE, but neither studied liquidity. It is known that there is international evidence that firms’ liquidity improves when a new REIT is introduced (Clayton and MacKinnon, 2000; Marcato and Ward, 2007).
Furthermore, macro-economic factors have been linked to REIT liquidity. Studies in this regard include Downs and Zhu (2022) and Wang et al. (2022). These emphasised the importance of studying macro-economic factors for REIT liquidity to improve a REIT’s financial standing and preparation in the case that the economy fell into recession. Other evidence on macro-economic factors includes Hoesli et al. (2017) and Demirci et al. (2023). The present study adopts macro-economic variables like gross domestic product, interest rates, CPI and employment levels and tests these with SA REIT liquidity. This kind of study is silent in the SA context.
5. Hypothesis formulation
When a firm has free cashflow, then conflicts of interest may arise between its shareholders and management. Liquidity has been deemed to mitigate agency problems (Yun, 2009). According to Ntim et al. (2012), to mitigate agency problems, companies should comply with the BEE. The nature of the BEE initiatives suggests that there is significant wealth and monetary implications for shareholders in SA firms since implementing the BEE. According to Ntim and Soobaroyen (2013), the additional income as a result of the BEE may be invested in social themes. The present study investigates SA’s BEE policy: According to Ntim et al. (2012), to mitigate agency problems, companies should comply with the BEE.
According to Downs and Zhu (2022), REITs’ liquidity has been associated with holding cash. Moreover, greater investment activity has been associated with firm liquidity by Brockman and Chung (2003), DiBartolomeo and Gatchev (2021) and Cheung et al. (2023). Furthermore, macro-economic factors also influence the firm’s liquidity, as confirmed by Downs and Zhu (2022) and Wang et al. (2022). Globally there is evidence on policies and a REIT liquidity by Morri and Baccarin (2016). In SA, there is some evidence on BEE policy from the studies of Nguyen and Muniandy (2021), Ntim and Soobaroyen (2013), Seate et al. (2016) and many more. On REIT and the BEE, there is evidence from Akinsomi et al. (2016) on REIT performance and Ajayi and Akinsomi (2023) on SEOs, but there is a lack of evidence on REITs and liquidity. More work is required on the impact of BEE practices on firms’ financial standing as called for by Ntim et al. (2012).
From the above literature the following hypothesis can be formulated.
There is a positive association between BEE principles and liquidity of SA REIT.
This literature review has assessed various aspects of liquidity globally. Primarily, there is evidence on the pricing of REIT stock from the works of DiBartolomeo and Gatchev (2021), Downs and Zhu (2022) and Clayton and Mackinnon (2000) although These studies were conducted outside the African context and not in SA. These studies emphasised how to improve the pricing of a REIT and this kind of knowledge is required in SA literature. Moreover, evidence on REIT liquidity and investment was discussed. Brockman and Chung (2003) argued that liquidity enhances investment activity; on the other hand, Cheung et al. (2023) argued that liquidity management may influence future investment. Liquidity has been deemed important in the literature (Fang et al., 2009), but these kinds of studies are not available in the African context in general and in South Africa in particular. This highlights that more studies on the SA REIT are timely and important (Carstens and Freboyte, 2018).
The literature review also proved the importance of macro-economic factors and how these can influence a REIT’s liquidity. Evidence in this regard was discussed from the studies of Dermirci et al. (2023), Downs and Zhu (2022), Hoesli et al. (2017) and Wang et al. (2022). The present study adopts the macro-economic factors to address this gap in the literature in the SA context.
Finally, the importance and influence of policies on the financial good standing of firms has been evidenced. Liquidity has been labelled as one of the ways to measure good financial standing of firms. Compliance with the SA BEE policy may improve firms’ performance and financial standing, as evidenced in the study by Ntim and Soobaroyen (2013). In general, government policies have been linked with stock performance, as reported by Rennings et al. (2003) and Chen and Lai (2013). There is, however, a lack of evidence on whether liquidity was used as a test. Companies with pronounced disclosure practices are associated with improved liquidity.
6. Methodology
The study investigates the BEE and firm liquidity of SA REITs listed on the JSE. The datasets are sourced from the companies’ BEE certificates to measure BEE compliance and financial data are sourced from Bloomberg between 2013 and 2024.
The sample is drawn from 33 SA REITs listed on the JSE as of the end of December 2024 to observe the relationship between the BEE and SA REIT liquidity. The BEE data are taken from each firm’s BEE compliance certificates for each year to retrieve the company’s BEE score. Financial data are taken from Data Stream and Bloomberg.
6.1 Model specification
Equation (1) tests Hypothesis 1, where LIQ is the respective liquidity measure (logTURN, logRVOL, BASPR and logLIQ); BEE Score represents all seven BEE principles and scoring for each firm, the big 5 auditing firms and all REITs cross listed. is a factor of firm-level variables such as total assets; Debt ratio means debt equity ratio and firms that are audited by the Big 5 auditing firms in South Africa and cross-listing represents REITs that are also listed in other exchanges other than the JSE. captures REIT property types and the COVID-19 dummy variable. The results from this model are presented in Table 9.
Equation (1) tests Hypothesis 1. Table 4, below, offers further explanation of the variables.
Hypothesis
| Hypothesis | Independent variable | Dependent variable | Control variables | Expected relationship |
|---|---|---|---|---|
| H1 | BEE score | Liquidity ratio | Firm size, macro factors, property type | Positive |
Source(s): Authors’ own work
6.2 Identification of key variables
6.2.1 BEE
Consistent with past studies, first, the seven BEE principles were used (Ntim et al., 2012). To test the compliance of each SA REIT’s BEE, certificates are collected from 2013 until 2022. Each certificate shows all seven principles and score level to measure compliance with each principle. The certificates are verified by the Broad Based Black Economic Empowerment (B-BBEE) Act No. 53 of 2003. The BEE measure employed in this current study is represented by the following to measure the BEE score:
where measures BEE principle’s score and is the independent variables consisting of (1) BLK-OWN; (2) Management Control (MNGCO); (3) Employment Equity (EE); (4) Skills Development (SKILDEV); (5) Enterprise & Supplier Development (E&SDEV) and (6) Socio Economic Development (SOCDEV). Table 4, above, shows the detailed explanation of the BEE score variables.
6.2.2 Liquidity and other variables
The measure of liquidity employed here is like previous studies (Brounen et al., 2009; Cannon and Cole, 2011; Marcato and Ward, 2007). Here, four proxies are used to measure REIT-level liquidity. Owing to the absence or lack of data outside the bid spread, the liquidity measure will be classified as activity measure (i.e. revenue) which will reflect the extent of trading friction (i.e. bid–ask spread) reflecting the price concessions for immediacy. The increase in activity measure increases liquidity; however, the increase in friction measures reduces it (Bertin et al., 2005).
The study uses share turnover and trading volume as two activity measures in line with Brounen et al. (2009). The yearly share turnover is defined as the trading volume of shares divided by outstanding shares in line with previous studies (Brounen et al., 2009; Huang et al., 2011; Wang et al., 2022). In line with Cannon and Cole (2011), the yearly trading volume is explained as the monthly closing price multiplied by yearly share trading volume. In this current study’s analysis, the logs of both variables (LogVol and LogTURN) are utilised and the data are sourced from the Bloomberg database.
The resistance measurement of liquidity is measured by using the BASPR and Amihud’s (2002) liquidity measure that signifies the price impact measure (Cannon and Cole, 2011; Wang et al., 2022). The BASPR mirrors the cost of liquidity (Bertin et al., 2005; Brounen et al., 2009), while the Amihud (2002) liquidity measure reflects sensitivity of prices to changes in trading volume (depth dimension; Amihud, 2002; Brounen et al., 2009). The measures are intertwined with past work measures (Bertin et al., 2005; Brounen et al., 2009; Cannon and Cole, 2011; Huang et al., 2011; Wang et al., 2022).
Annual liquidity data are obtained from the Bloomberg database. Then, the yearly average BASPR is calculated and seven observations with adverse BASPRs are eliminated, which is in line with past studies (Anand and Subrahmanyam, 2009; Cashman et al., 2016).
The liquidity measure is defined as the total yearly firm-level revenue divided by the yearly trading volume and has been found to correlate highly with microstructure liquidity measures (Amihud, 2002). The larger the liquidity measure, the less the trading liquidity of a firm’s shares (Huang et al., 2011; Wang et al., 2022).
represents covariates (such as Total assets, Debt ratio, Audited by the Big 5, cross-listing, property type and COVID-19 dummy); is constant or intercept; are the vectors of explanatory variables; i is individual firm; t is the time variable; and is the error term.
Cross-listing: This is measured on foreign stock markets’ liquidity (Black et al., 2006; Ntim et al., 2013). A positive relationship with BEE Score is hypothesised. It will take the value of 1 if a REIT is cross-listed on foreign stock and 0 otherwise.
Big 5: Corporations audited by one of the Big 5 firms are reputable (De Angelo, 1981). It will take the value of 1 if the firm is audited by the Big 5 audit firms in South Africa and 0 otherwise.
Debt ratio: This is the ratio of debt to equity.
In accordance with the methodology employed by Lee et al. (2014), the researchers utilised a system of dummy variables or indicator variables, to categorise and analyse the data. Specifically, a distinct dummy variable was assigned to each property type, including retail, office and industrial, whereby a value of 1 was attributed to REITs that primarily invest in the corresponding property type and a value of 0 was assigned otherwise. Notably, the SA context reveals a distinct absence of REITs specialising exclusively in office properties, whereas REITs focussing on industrial and retail properties are present, alongside diversified REITs that incorporate multiple property types, including office (JSE, 122,025). The property type variable is operationalised as the percentage of the firm’s book value portfolio holdings allocated to a specific property type sector category (Danielsen and Harrison, 2007). Consequently, REITs with multiple sectors are classified as diversified.
6.3 Robustness test
For robustness test we conduct the random effects and feasible generalised least squares, represented by Equation (2) below, this equation incorporates the macro-economic variables, represented by ; it includes CPI, prime interest rates, employment levels and GDP (gross domestic product) growth. The results of Equation (2) are presented in Table 11 and 12.
7. Presentation of results
7.1 Introduction
This empirical study utilises a robust analytical framework, combining ordinary least squares (OLS) with random effects to dissect the complex relationships between key variables. To further fortify our findings, we complement our analysis with the feasible generalised least squares (FGLS) approach, ensuring a comprehensive and reliable examination. Notably, our model design thoughtfully incorporates instrumental variables, effectively addressing endogeneity concerns and thereby bolstering the integrity of our results. Our study delves into the nexus between BEE status and firm liquidity within a carefully curated sample of SA REITs, spanning the period from 2013 to 2024. To quantitatively assess firm liquidity, we employ a liquidity ratio, calculated as the ratio of total assets to total liabilities [1].
We conduct various analyses to ascertain the integrity of our datasets, following Zyphur and Oswald (2015). A Bayesian model assisted in estimating both linear and non-linear dynamic systems which helped to estimate the probability of the hypothesis being correct (Haug, 2012). In Bayesian estimation, probabilities are interpreted as degrees of belief. When you state that there is a 95% credible interval for a parameter, you are saying that, based on your prior beliefs and the observed data, you are 95% confident that the true parameter value falls within that range. Figure 1, below, shows the trace plot of {Liquity:_cons} which demonstrates good mixing. The autocorrelation dies off quickly. The posterior distribution of {Liquidity:_cons} resembles the normal distribution, as is expected for the specified likelihood and prior distributions. There is no reason to suspect non-convergence. See the full estimation results in annexure I.
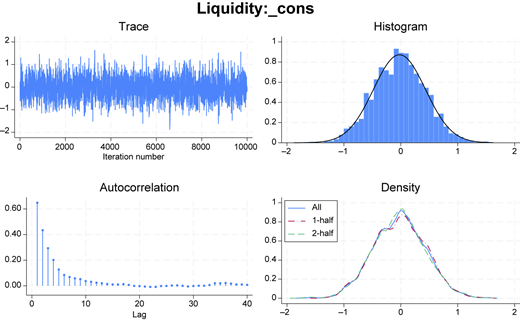
To control for volatility in the model, we conduct autoregressive conditional heteroskedasticity (ARCH) as shown in Figure 1 (see annexure II; Hamilton and Susmel, 1994). This is carried out for the variables that could have changed over time and have been influenced by past error terms.
In the next paragraph, the study presents descriptive statistics, correlation statistics, variance inflation factor and results of the analysis.
7.2 Descriptive statistics
Table 5 presents the descriptive statistics of the key variables. The continuous variables include liquidity ratio, market size to book value, interest rate, gross domestic product (GDP), employment, CPI, total assets, debt/equity ratio and property type.
Variable table
| Variable | What the variable represents | Type of variable | How it is measured |
|---|---|---|---|
| BEE | BEE compliance by SA REIT. The BEE scorecard of each classification of REITs between 2013 and 2022 Level 1: 100 points and above—135% Compliance _ Level 2: 85 to 99.99 points—125% Compliance _ Level 3: 75 to 84.99 points—110% Compliance _ Level 4: 65 to 74.99 points—100% Compliance _ Level 5: 55 to 64.99–80% Compliance _ Level 6: 45 to 54.99–60% Compliance _ Level 7: 40 to 44.99–50% Compliance _ Level 8: below 40–0% Compliance | Independent | The BEE certificates are obtained from individual SA REITs from 2013 until 2022. The certificates show the compliance of each firm on all BEE principles by obtaining a score |
| Liquidity (LIQ) | SA REIT Liquidity measure | Dependent | The illiquidity measure is defined as the total yearly firm-level revenue divided by the yearly trading volume and has been found to correlate highly with microstructure liquidity measures |
| Constant or intercept | |||
| Yit | Is a factor of macro-economic CPI, GDP, interest rate, employment levels | Covariates | These are directly obtained from Datastream and Quantec |
| Xit | Total Assets, Big 5 firms, cross-listing | Total Assets – directly obtained from Bloomberg and logged; Big 5; 1 is allotted for representation and 0 otherwise; Cross-listing; 1 is allotted for representation and 0 otherwise. 1 is allotted for property type, whether diversified 1 = yes and 0 = no, industrial 1 = yes and 0 = no and retail, 1 = yes and 0 = no. | |
| Zit | Property types, COVID-19 dummy |
Source(s): Authors’ own work
Categorical variables are cross-listed and whether a firm is being audited by any of the Big 5 auditing firms. The average of liquidity ratio is −0.212 with a minimum of −0.54 and a maximum of 0.18. In addition, the average of market to book value is −1.88, the minimum is 0.03 and maximum is 12.01.
7.3 Unit root test
The study used two balanced panel conventional unit root tests; Levin–Lin–Chu (LLC) and Breitung unit-root tests presented, in Table 6, below.
Descriptive statistics
| Variable | Obs | Mean | Std. Dev | Min | Max |
|---|---|---|---|---|---|
| Liquidity ratio | 176 | −0.026 | 0.284 | −1.696 | 1.788 |
| (BSCR) BEE score | 192 | 4.102 | 0.26 | 3.382 | 4.443 |
| Total asset (log) | 176 | 0.034 | 0.408 | −3.554 | 2.596 |
| Debt/Equity ratio | 176 | −0.032 | 0.971 | −8.559 | 2.079 |
| CPI | 176 | 0.053 | 0.012 | 0.032 | 0.068 |
| Interest rate | 176 | −0.009 | 0.425 | −0.6 | 0.9 |
| GDP (log) | 176 | 0.043 | 0.008 | 0.033 | 0.057 |
| Big 5 audit firms | 192 | 0.562 | 0.497 | 0 | 1 |
| Cross-listing | 192 | 0.625 | 0.485 | 0 | 1 |
| Property type | |||||
| Industrial REIT | 192 | 0.062 | 0.243 | 0 | 1 |
| Retail REIT | 192 | 0.125 | 0.332 | 0 | 1 |
| Diversified REIT | 192 | 0.812 | 0.391 | 0 | 1 |
| COVID-19 dummy | 192 | 0.25 | 0.434 | 0 | 1 |
Note(s): CPI denotes Consumer Price Index; GDP denote Gross Domestic Product
Source(s): Authors’ own work
Table 6 presents the unit root test at the level and first difference for the stationarity of key variables using the Levin et al. (2002) and Breitung (2005) unit-root tests. At the level of some variables, they are not statistically significant. This implies that they are not stationary at the level. However, the variables are statistically significant at first difference using Levin et al. (2002). We see that the results are consistent with the Breitung unit-root test. The study assumed that the majority of variables are stationary at first difference. Furthermore, the study investigates whether there is a correlation in the model.
7.4 Correlation analysis
Table 7 presents the pairwise correlations for the model. Liquidity ratio and BEE (r = 0.17) are positively correlated. Liquidity ratio and total asset (r = 0.02) are positively correlated. Liquidity and cross-listing (r = −0.02) are likely to have a positive correlation. Liquidity and first Big 5 audit forms (r = −0.04) are likely to have a negative correlation.
Unit root test: Levin–Lin Chu and Breitung
| Variables | LLC unit-root test | Breitung unit-root | ||
|---|---|---|---|---|
| At level | 1st difference | At level | 1st difference | |
| Liquidity | −3.128*** | −9.813*** | 0.184 | −4.217*** |
| (BSCR)BEE score | −10.694*** | −19.357*** | −4.883*** | −8.349*** |
| Total asset | −7.155*** | −6.968*** | 1.878 | −4.975*** |
| Debt/equity ratio | −1.10 E+02*** | −64.195*** | 1.958 | −5.497*** |
| Unemployment | −4.127 | −8.037*** | 0.659 | −4.671*** |
| Consumer price index | −6.729 | −2.852*** | 2.865*** | −3.846*** |
| Interest rate | −7.062 | 0.975*** | −7.935*** | −8.134*** |
| Repo rate | −8.889*** | −9.075*** | −2.359*** | −3.730*** |
| Treasury bill | −11.002*** | −8.703*** | −2.552*** | −2.125** |
Note(s): The test statistics of the Levin–Lin–Chu (LLC) unit-root test are shown as Adjusted t* and are reported. The trend was included. *, **, *** implies series stationary significant levels at 10%, 5% and 1%, respectively. The test statistics of the Breitung unit-root test are shown. The trend was included. LLC and Breitung unit-root tests apply to unbalanced panel data
Source(s): Authors’ own work
7.5 Variance inflation factor
Table 8 presents the variance inflation factor to ascertain the true position of correlation analysis.
Pairwise correlation
| Variables | (1) | (2) | (3) | (4) | (5) | (6) | (7) |
|---|---|---|---|---|---|---|---|
| (1) Liquidity | 1.000 | ||||||
| (2) (BSCR) BEE score | 0.172* | 1.000 | |||||
| (0.023) | |||||||
| (3) Total asset | 0.016 | 0.048 | 1.000 | ||||
| (0.831) | (0.523) | ||||||
| (4) Debt/equity ratio | 0.024 | 0.014 | 0.100 | 1.000 | |||
| (0.748) | (0.855) | (0.187) | |||||
| (5) Big 5 audit firms | −0.043 | −0.275* | −0.029 | 0.118 | 1.000 | ||
| (0.567) | (0.000) | (0.703) | (0.119) | ||||
| (6) Cross-listing | 0.049 | 0.130* | −0.125* | −0.123 | 0.098 | 1.000 | |
| (0.522) | (0.073) | (0.099) | (0.103) | (0.178) | |||
| (7) Property types | −0.026 | 0.006 | 0.222* | 0.077 | −0.070 | −0.220* | 1.000 |
| (0.730) | (0.930) | (0.003) | (0.308) | (0.335) | (0.002) |
Note(s): **p < 0.01, **p < 0.05, *p < 0.1
Source(s): Authors’ own work
The study investigates whether multicollinearity in the model is possible, which is an issue if the rule of thumb is not satisfied. The rule of thumb says that VIF must not exceed 5 or 10 (Murray et al., 2012). However, all the variables have a VIF that is less than 5 (see Table 9).
7.6 Estimation of liquidity ratio and BEE
Table 10 Column (1) observed a positive relationship between BEE status and liquidity ratios resonates with existing scholarly contributions. For instance, Nguyen and Muniandy (2021) unearthed a comparable dynamic in their investigation of non-listed companies, focussing on the decisive roles of female and Black directors. Similarly, Ntim and Soobaroyen (2013) probed the interconnections between BEE compliance and the performance of SA corporations. While their study diverged from the current analysis in terms of scope and methodology, omitting pivotal facets of BEE implementation and its impact on firm performance, it echoes the significance of BEE in shaping corporate liquidity. This underscores the vital role of BEE in enhancing firm liquidity, which is especially pertinent in the SA context, where economic transformation and demand for greater inclusivity and diversity in the corporate world are pressing concerns. The BEE policy has been instrumental in promoting economic transformation.
Liquidity and BEE (OLS)
| Variables | (1) | (2) | (3) |
|---|---|---|---|
| Liquidity ratio | Liquidity ratio | Liquidity ratio | |
| (BSCR) BEE | 0.175* | 0.175* | 0.186** |
| (0.0891) | (0.0894) | (0.0823) | |
| Total asset | 0.0172 | 0.00291 | 0.0123 |
| (0.0558) | (0.0555) | (0.0541) | |
| Debt/equity ratio | 0.00985 | 0.0150 | 0.00818 |
| Consumer price index (CPI) | −1.961* | −1.956* | |
| (1.043) | (1.030) | ||
| Interest rate | −0.624* | −0.622* | |
| (0.324) | (0.321) | ||
| Big 5 audit firms | −0.00441 | −0.00533 | |
| (0.0469) | (0.0471) | ||
| Cross-listing | 0.0212 | 0.0217 | |
| (0.0473) | (0.0475) | ||
| Industrial properties | 0.0118 | 0.0177 | |
| Retail properties | (0.112) | (0.113) | |
| Diversified properties | −0.0163 | −0.0107 | |
| (0.0948) | (0.0952) | ||
| Year dummy 2013_2024 | Yes | Yes | Yes |
| Constant | 8.211* | −0.753* | 8.142* |
| (4.777) | (0.383) | (4.717) | |
| Observations | 176 | 176 | 176 |
| R-squared | 0.083 | 0.061 | 0.080 |
Note(s): Standard errors in parentheses: ***p < 0.01, **p < 0.05, *p < 0.1; The reference year is 2013; by 5 big firm and cross-listing because they are categorical variables; with added time effect (year dummy) to ensure that the estimated model is not biased by omitted variables.
Source(s): Authors’ work
The analysis yields a notable inverse correlation between the CPI, interest rates and liquidity ratio, substantiating previous research findings (Wang et al., 2022). Consistent with this, Downs and Zhu (2022) demonstrate that macro-economic variables exert a profound influence on stock liquidity. While CPI primarily serves as an inflation metric, its indirect implications on liquidity and credit risk are noteworthy, particularly in the context of informing macro-economic policy decisions and influencing bond prices (Downs et al., 2025).
Notably, as evident in Table 10, Column (2), a significant positive correlation emerges between BEE and the liquidity ratio. To delve deeper into this relationship, we examined a model that isolated macro-economic variables, excluding REIT variables, as shown in Column (3). The results confirm that even in this scenario, a significant positive correlation between BEE and the liquidity ratio persists.
7.7 Estimation of liquidity ratio and BEE
Table 11 presents that BEE has a significant positive impact on liquidity ratio and BEE. In Table 11, Column (3), the BEE has a significant positive relationship with liquidity ratio using the fixed effect (FE) estimator. Gross domestic product has a positive relationship with liquidity ratio. Wang et al. (2022) reported that changes in macro-economic factors influence REIT liquidity, while Dermirci et al. (2023) stated that it is also possible that liquidity can have an adverse relationship with some of the macro-economic factors. CPI has a significantly negative relationship with liquidity, whereas interest rates have a negative relationship with liquidity. The relationship between BEE and liquidity ratio is profound, as indicated by the findings in Table 11. Notably, Column (3) reveals that BEE has a substantial positive impact on liquidity ratio when utilising the FE estimator. This suggests that BEE plays a significant role in enhancing firm liquidity.
Liquidity ratio and BEE (Random Effects)
| Variables | (1) | (2) | (3) |
|---|---|---|---|
| 1 | 2 | 3 | |
| Liquidity ratio | Liquidity ratio | Liquidity ratio | |
| (BSCR) BEE score | 0.175* | 0.175* | 0.184** |
| (0.0992) | (0.0990) | (0.0843) | |
| Total assets | 0.0177 | 0.00340 | 0.0150 |
| (0.0557) | (0.0554) | (0.0552) | |
| Debt/equity ratio | 0.0102 | 0.0154 | 0.00803 |
| (0.0242) | (0.0241) | (0.0235) | |
| CPI | −1.961* | −1.963* | |
| (1.036) | (1.036) | ||
| Interest rate | −0.623* | −0.624* | |
| (0.322) | (0.322) | ||
| Big 5 audit firms | −0.00452 | −0.00544 | |
| (0.0522) | (0.0522) | ||
| Cross-listing | 0.0214 | 0.0218 | |
| (0.0525) | (0.0525) | ||
| Industrial REIT | |||
| Retail REIT | 0.0120 | 0.0178 | 0.00169 |
| (0.125) | (0.125) | (0.108) | |
| Diversified REIT | −0.0162 | −0.0107 | −0.0230 |
| (0.105) | (0.105) | (0.0915) | |
| Year dummy | Yes | Yes | Yes |
| COVID-19 dummy | |||
| Constant | 8.211* | −0.753* | 8.204* |
| (4.748) | (0.424) | (4.747) | |
| Observations | 176 | 176 | 176 |
| Number of coycode | 16 | 16 | 16 |
| sigma_u | 0.0440 | 0.0429 | 0.0113 |
| sigma_e | 0.286 | 0.288 | 0.286 |
| rho | 0.0232 | 0.0218 | 0.00157 |
Note(s): Standard errors in parentheses: ***p < 0.01, **p < 0.05, *p < 0.1
Source(s): Authors’ own work
Interestingly, GDP also exhibits a positive correlation with liquidity ratio, aligning with existing research, such as Wang’s study on REIT liquidity. However, it is also possible for liquidity to be adversely affected by certain macro-economic factors, as highlighted by Dermirci (2023).
Furthermore, our analysis reveals that CPI has a significantly negative relationship with liquidity, indicating that higher CPI values are associated with lower liquidity. Similarly, interest rates display a negative relationship with liquidity, suggesting that higher interest rates can lead to reduced liquidity.
7.8 Estimation of liquidity ratio and BEE robustness test
Our analysis of the impact of BEE on liquidity ratio is presented in Table 12, Column (1), where we employ feasible generalised least squares to address heteroskedasticity in the panel data. Similarly, Table 12, Column (1) presents the results of our investigation into the impact of BEE on liquidity ratio using the same estimation technique. Notably, our findings indicate that BEE has a significant and positive impact on liquidity ratio. It is also worth noting that changes in macro-economic factors can influence liquidity (Glascock and Lu-Andrews, 2014), whereas employment is found to have a significant negative impact on liquidity ratio.
Liquidity and BEE (feasible generalised least squares)
| Variables | (1) | (2) | (3) |
|---|---|---|---|
| 1 | 2 | 3 | |
| Liquidity ratio | Liquidity ratio | Liquidity ratio | |
| (BSCR) BEE Score | 0.172** | 0.175** | 0.181** |
| (0.0849) | (0.0846) | (0.0802) | |
| Total assets | 0.0166 | 0.0173 | 0.0142 |
| (0.0532) | (0.0530) | (0.0531) | |
| Debt/equity ratio | 0.0112 | 0.00985 | 0.00922 |
| (0.0229) | (0.0229) | (0.0225) | |
| Big 5 audit firms | −0.00513 | −0.00441 | |
| (0.0447) | (0.0446) | ||
| Cross-listing | 0.0219 | 0.0212 | |
| (0.0451) | (0.0449) | ||
| Industrial REIT | |||
| Retail REIT | 0.0131 | 0.0118 | 0.00287 |
| Diversified REIT | −0.0155 | −0.0163 | −0.0222 |
| (0.0904) | (0.0901) | (0.0872) | |
| Year dummy | Yes | Yes | Yes |
| Interest rate | 0.0190 | 0.0196 | |
| (0.103) | (0.103) | ||
| Employment | 0.0849 | 0.0853 | |
| (0.504) | (0.504) | ||
| GDP | −3.035 (23.20) | ||
| CPI | −3.440 | −3.219 | |
| COVID-19 dummy | 0.000778 | 0.00111 | 0.0240 |
| (0.0806) | (0.0960) | (0.0807) | |
| Constant | −1.013 | −0.785** | −1.035 |
| (1.782) | (0.369) | (1.778) | |
| Observations | 176 | 176 | 176 |
| Number of coycode | 16 | 16 | 16 |
Note(s): Standard errors in parentheses: ***p < 0.01, **p < 0.05, *p < 0.1
Source(s): Authors’ own work
We also found that interest rates have an insignificant positive impact on liquidity ratio, while unemployment has an insignificant negative impact on liquidity ratio.
To further investigate the relationship between BEE and liquidity ratio, we conducted additional tests. In Column (2), we excluded macro-economic variables and found that BEE still has a significant positive impact on liquidity ratio. Similarly, in Column (3), where we excluded firm-level variables, the results revealed that BEE continues to have a significant positive impact on liquidity ratio.
8. Conclusion
This study examines the relationship between the BEE and the liquidity of SA’s firms, using a sample of publicly listed equity REITs. Given that SA REITs allocate significant revenue towards BEE initiatives, understanding how BEE compliance influences their liquidity is vital. The focus is on REITs because they operate in parallel markets, raise funds in the capital market and they invest in the property market in a portfolio context, making them ideal for examining the interplay between BEE and REIT liquidity. While prior research by Akinsomi et al. (2016) and Ajayi and Akinsomi (2023), explored BEE’s impact on firm performance and SOEs, respectively, none specifically addressed REIT liquidity. This study fills the gap by establishing, for the first time, a link between BEE compliance and REIT liquidity using balanced panel data, thus controlling for unobserved, time-invariant factors.
REITs provides a unique empirical setting for examining the implications of BEE initiatives. Specifically, the inherent characteristics of REITs, which typically exhibit limited free cash flow, serve to mitigate agency problems. Notably, the BEE phenomenon implies that shareholders of SA firms may reap both financial and monetary benefits, as compliance with BEE regulations may positively influence board and management efficacy. This, in turn, can have a direct and significant impact on a firm’s profitability, with a potential percentage of additional profits being reinvested in various social projects. Consequently, the BEE initiative can be seen as a vital catalyst for driving sustainable economic growth and social development in SA, while fostering a culture of inclusivity and diversity within the corporate landscape, thereby promoting a more equitable distribution of wealth and opportunities.
This study utilised robustness test, employing a feasible generalised least squares approach, to estimate the liquidity of REITs and the impact of BEE policies. Building on existing literature, including the works of Rennings et al. (2003) and Rashid et al. (2010), which investigated the effects of government policies on REITs, this research fills a significant knowledge gap by examining the specific mechanisms driving the positive relationship between BEE policies and the liquidity of SA REITs. To achieve this, the study leveraged the SA BEE score variable, derived from the BEE certificates of the companies in question. These certificates provide a comprehensive evaluation of each REIT’s performance across seven key principles, ultimately informing the calculation of their overall BEE score. The findings of this study have significant implications for policymakers, investors and stakeholders in the SA REIT market, as they demonstrate the positive correlation between effective BEE implementation and increased liquidity in the REIT market.
The SA BEE score variable is extracted from the company’s BEE certificates. These display the scoring of each REIT on all seven principles which are then used to measure BEE score.
The perennial issue of agency problems, where shareholders' interests in growth and value maximisation may diverge (Jensen, 1986), is addressed in this study. Consistent with the findings of Down and Zhu (2022), our research reveals a substantial correlation between a firm’s liquidity levels and its commitment to value maximisation. By strategically allocating resources to optimise liquidity, firms can effectively mitigate the agency problem, thereby enhancing their overall value proposition and aligning shareholder interests with those of the organisation.
Further examination of the relationship between property type and REIT liquidity is warranted, particularly considering the impact of BEE on liquidity, an area previously explored by Danielsen and Harrison (2007). Given that each property type can exert a distinct influence on REIT liquidity, a more in-depth analysis of individual property types could provide a valuable contribution to the existing body of literature.
SA REITs that are cross listed on other exchanges are likely to exert a significant influence on the liquidity of the overall SA REIT market. Similarly, those SA REITs audited by the Big 5 auditing firms in South Africa also tend to experience enhanced liquidity.
Macro-economic variables also play a significant role in influencing REIT liquidity. For instance, a higher CPI is often indicative of rising inflation, which in turn can impact overall market liquidity. Our findings support this notion, revealing a negative correlation between CPI and SA REIT liquidity as inflation increases. Furthermore, interest rate hikes, which raise the cost of debt, also have a negative effect on liquidity. This outcome has significant implications for both investors and policymakers.
It is worth noting that futures contracts have been shown to improve a firm’s liquidity, as found by Ahn et al. (2025). Although the SA futures contracts trading market is not yet as mature as those in developed nations, it is expected that futures contracts will continue to play a crucial role in improving liquidity, as suggested by Downs et al. (2025).
This study empirically establishes a significant and positive correlation between the scores of all BEE principles and the liquidity of SA REITs. Consequently, our hypothesis (H1) is substantiated. These findings are consistent with prior research, such as Rennings et al. (2003) and Chen and Lai (2013), which demonstrated that government policies exert an influence on REIT liquidity, albeit with limited exploration within the SA context. Notably, extant SA studies on BEE and REITs, have not examined liquidity, thereby underscoring the original contribution of this research to the existing literature. Moreover, the study’s outcome has significant implications for policymakers, REIT managers and stakeholders interested in the advancement of BEE initiatives as they can now make more informed decisions about implementing BEE policies and their impact on liquidity in the SA REIT market, which is a critical component of the country’s economic growth and development. The empirical evidence presented in this research provides a foundation for future studies that can further investigate the relationships between BEE initiatives, liquidity and the overall performance of SA REITs, ultimately informing actionable strategies that foster sustainable economic growth, alleviate the socio-economic disparities that persist in South Africa and promote a more inclusive and economically equitable society, where the benefits of economic empowerment are shared by all citizens, regardless of their racial or socio-economic background.
The empirical evidence suggests a significant positive correlation between BEE compliance and liquidity in the SA REIT sector. This finding has profound implications for policymakers and investors, as it underscores the potential benefits of BEE compliance in enhancing firm profitability (Sibeta, 2013). Moreover, adhering to BEE requirements can grant firms access to a broader range of opportunities that may not be available to non-compliant entities (Seate et al., 2016). Theoretical literature has also established a positive relationship between a firm’s liquidity and its overall financial health (Fang et al., 2009). Consequently, it is reasonable to infer that SA REITs that comply with BEE requirements are likely to exhibit superior liquidity profiles compared to their non-compliant counterparts. SA REITs are likely to seize better investment opportunities, as evidenced by Cheung et al. (2023).
The top 5 REITs by market capitalisation have consistently demonstrated higher BEE scores. A significant milestone was achieved since the introduction of BEE, with the top 100 firms listed on the JSE, including REITs, having concluded over R350 billion in deals (Business Day, 2018). Our comprehensive model incorporates various factors that influence liquidity, including retail, industrial and diversified REITs (Danielsen and Harrison, 2007). In a competitive market environment, REITs can capitalise on lucrative investment opportunities in alternative areas and property types, prompting managers to recalibrate the firm’s investment profile by adjusting the mortgage-to-equity ratio (Danielsen and Harrison, 2007). Notably, the SA REIT retail and industrial sectors are more vulnerable to liquidity fluctuations. To further enhance market efficiency and liquidity, it is worth considering the link between improved information flow and futures market trading in SA, as highlighted by Ahn’s 2025 research. Considering these findings, investors and policymakers are encouraged to explore the potential of futures market trading to unlock new opportunities.T.
This investigation focussed exclusively on SA REITs that adhere to BEE regulations, thereby excluding non-compliant entities from the analysis. To further elucidate the dynamics between BEE compliance and firm liquidity, future research endeavours could explore the relationship between non-compliant firms and their liquidity profiles. Moreover, a comparative analysis examining the differences between BEE-compliant and non-compliant SA REITs could provide insights into the impact of BEE compliance on firm liquidity and potentially guide policymakers in refining regulatory frameworks to promote more equitable and sustainable business practices within the SA real estate sector. Such a study could also examine the potential trade-offs between BEE compliance and firm liquidity, including the possible effects of BEE compliance on firm value, investor confidence and overall market performance.
Note
However, the variables have some omitted value or data points, and we employed interpolation (or extrapolation) to populate the data point for panel analysis.
The supplementary material for this article can be found online.

