

Effective business and investment climate can lead to a higher rate of investment, profits and improved productivity, through the creation of an institutional environment, where the state provides high-quality public goods. This study aims to explore the impact of the business–investment climate on firm performance in a sample of six countries in the Middle East and North Africa (MENA) region and Turkey. Furthermore, we extend our analysis to explore the impact of business–investment climate on the resource misallocation in Egypt and Turkey.
The study used fixed effects models to investigate the relationship between the business and investment climate, expressed by the obstacles in state–business relations- and the firm performance, which is measured by the firm's value-added, the labour productivity and the total factor productivity To reduce the endogeneity coming from possible reverse causality and the perceptions about the business climate, an instrumental variables (IV) approach applying the two-stage least squares (2SLS) method was followed. The empirical analysis relies on data derived from the World Bank Enterprise Surveys.
Based on estimates, the obstacles in business climate may reduce the firm performance measures by 15–40%. These findings indicate the importance of quality in the business climate and how the improvement in its efficiency can have a very considerable positive impact on firms' performance and thus on the overall economic growth of a country.
This is the first study exploring the impact of business–investment climate on various measures of the firm performance and the resource misallocation in a large sample of countries in the MENA region.
1. Introduction
An effective business and investment environment is crucial and is seen as a key determinant of economic growth, development and structural transformation in low-income countries (Hausmann, 2014). The mechanism and channels through which business climate can boost and support economic growth are several. Political stability, anti-corruption, investment incentives, robust trade and healthy macroeconomic policy can minimize uncertainties in investors' planning, and by achieving this, they can raise the investment rates. Creating an institutional environment where the state provides a high quality of public goods, including anti-bureaucracy and anti-corruption strategies, can lead to higher investment rates. Quality of public goods also includes infrastructure, such as electricity and transportation, and the availability of an educated workforce.
This study attempts to investigate the impact of business and investment climate on the economic performance of firms in a sample of countries in the Middle East and North Africa (MENA) region. In this case, we define business and investment climate as the institutional, policy and regulatory environment in which firms operate. If an economy is characterized by political instability, if the government's provision or regulation of infrastructure and financial services is inefficient, if the local government is highly bureaucratic and corrupt, then returns on potential investments will be low and uncertain, and accumulation and growth will be limited. Returns and accumulation, on the other hand, should be high in developing economies producing a healthy governance environment and an efficient business and investment climate (Dollar et al., 2005).
Therefore, the aim is to explore the role of business–investment climate expressed by various indicators on firm performance. These indicators include policies that attempt to minimize political instability and eliminate corruption; incentives through lower taxes; supply and quality of public goods, such as electricity and transportation; efficiency in the financial services and access to land and credit; labour and custom regulations. Sen and Velde (2009) argue that an effective business–investment climate may contribute to industrial development and firm growth by two opposite forces. First, the states may not address market failures because they can be captured by elites or are unlikely to have perfect information. Second, markets may fail to achieve the optimal allocation of resources, such as education and innovation.
Thus, we argue that business climate can be an effective underlying factor of economic growth for firms. It may provide a more optimal allocation of resources in an economy, including increased efficiency of the state and its involvement in removing obstacles and supporting the private sector activities, increasing in this way the firm performance and growth. The motivation of this study for focusing on the business climate as an additional factor of economic performance is twofold. First, there is long-standing literature in political economy and political science providing evidence that business and investment climate can enhance growth and economic performance (Amsden, 1989; Fajnzylber et al., 2009; Sen and Velde, 2009; Qureshi and Te Velde, 2013). Second, we attempt to explore and evaluate the impact of business and investment climate index on firm performance in various countries of the MENA region using detailed micro-level data and an instrumental variables (IV) approach.
Public sector investments and employment cannot be relied on solely to boost growth and create much-needed jobs, especially for the region's young population. However, public authorities can play an equally important role by fostering a business climate that encourages private sector development. A motivation for exploring the role of the business climate and its obstacles in the MENA region countries is that roughly 65% of the population is under 35 years old, and the youth unemployment is over 25% (Dimova et al., 2016). Thus, by exploring the impact of business climate obstacles on the firm performance, and investigating the effect on job creation in future studies, we can identify and understand the dynamics of those obstacles.
To the best of our knowledge, this is the first study exploring the role of business and investment climate and its obstacles in the performance of firms in a large sample of MENA region countries. Moreover, it is one of the few studies attempting to establish a causal inference and to explore the relationship between business obstacles and resource misallocation in Egypt and Turkey. The findings support the argument that an effective business and investment climate can boost a firm's performance. In particular, major obstacles to the business environment have on average a significant negative effect on value-added, labour productivity and TFP ranging between 15 and 40%.
The paper is organized as follows: In section 2, we briefly present the earlier studies on the relationship between business climate and firm performance. In section 3, we describe the methodological framework and the data employed in the empirical analysis. In section 4, we report the results, and in section 5, we discuss the main concluding remarks of the study.
2. Literature review
The literature has emphasized the role of good governance on economic development, including among others the political freedom and stability, lack of corruption and rule of law. Sen and Velde (2009) argue that besides institutional factors, the business and investment climate plays a significant role in determining economic growth disparities. According to the economic theory and previous studies, an effective business and investment climate can have a positive effect on economic growth and performance by increasing both the rate and productivity of investment (Rodrik et al., 2004; Qureshi and Te Velde, 2013). The effective business climate is associated with the establishment of institutional environments that the state provides a higher quality of public goods, including effective public administration, lack of corruption and infrastructure, such as Internet provision and water and electricity supply without interruptions. Overall, at the macro level, a healthy and good business–investment climate is associated with good governance and institutions, and their importance is well-documented in promoting growth (Knack and Keefer, 1995; Mauro, 1995; Rodrik et al., 2004).
Following the evidence of macro-level studies, a growing body of literature has attempted to investigate the growth–institutions nexus at the micro-level. Beck et al. (2005) used firm-level data for 54 countries to explore the impact of legal, financial and corruption issues on firms' growth rates and their findings show that these factors limit and reduce firms' growth and the impact is stronger for the small firms. Scarpetta et al. (2002) found that stringent product market regulations and high hiring and firing costs in Organisation for Economic Co-operation and Development (OECD) countries have significant adverse effects on industrial productivity. Furthermore, their results show that strict regulations on entrepreneurial activity discourage the entry of new small firms. The study by Fajnzylber et al. (2009) provides evidence that state intervention and support contribute to the firm growth. More specifically, Fajnzylber et al. (2009) used data for Mexican firms and they evaluated the impact of government support, identifying treatment effects of credit, training and tax payments on the likelihood of firm survival, profits and growth.
Apart from access to finance, political instability, corruption and tax administration, infrastructure is also a major component of the quality in the business and investment climate. More specifically, Dollar et al. (2005) used firm-level data in developing countries to explore the relationship between investment climate and firm performance, where the former is proxied by the days required to get a telephone line, sales lost to power outages and time spent dealing with government bureaucracy. They found that the factor returns, indicated by wages and rates of profit, are higher when the investment climate is better. Therefore, these characteristics contribute to the construction of a better business and investment climate by coordinating issues and failures in the market, reducing political instability and establishing a check and balance mechanism for public policies such as expenditures and taxes.
The study most related to ours is the report by Schiffbauer et al. (2015), where the authors found that political instability, corruption and inadequate electricity supply are negatively related to firm performance. However, their empirical analysis is limited to evidence provided by descriptive statistics. Furthermore, they do not explore the relationship between business climate obstacles and resource misallocation, as we do in Egypt and Turkey. There are few recent studies exploring the role of business and investment climate in the MENA region countries (EBRD et al., 2016; Brown and Earle, 2017; Hosny, 2017; Karahasan and Bilgel, 2020; Ozdamar et al., 2020). For instance, Karahasan and Bilgel (2020) using a causal mediation analysis explored the role of access to finance in eight MENA region countries and Turkey over the period 2013–2015, and they found obstacles related to access to finance reduce firm performance by about 2.3–4.4%. Firm performance in their study is measured by various indicators, including labour productivity growth, returns on sales and returns on assets among others. Similarly, Brown and Earle (2017) explored the impact of access to Small Business Administration (SBA) loans on firms' employment growth in the USA in 1987–2012. The findings highlight the importance of access to finance and credit, suggesting that $1 million of loans raises job creation in the recipient firms. In particular, during the first three post-loan years, the firms have created on average 3.5 jobs for every million dollars of loans, and between 5 and 7 jobs at five years following the loan receipt.
Various studies have explored the role of governments and financial institutions in firm performance (Christmann and Taylor, 2001a, b, 2002; Hosny, 2017; Arayssi et al., 2019; Ozdamar et al., 2020; Abdo and Fakih, 2022). For instance, Abdo and Fakih (2022) argue that the legal form plays a significant role in the firm performance, and they demonstrate that companies with open and closed shareholding and those with a limited partnership perform better than the sole proprietorship firms in terms of annual sales and annual productivity growth rates. Arayssi et al. (2019) extended their analysis to consider the causal impact of the Arab Spring and government institutions on the finance–growth nexus. Their findings demonstrate that political instability has a negative impact on growth, and while a well-functioning financial system is a necessary condition it is not a sufficient condition to increase growth. Therefore, governments and policies should focus on the improvement of a country's legal system and the efficiency of institutions' operation, freedom of expression and citizen's participation in selecting government and to ensure the persistence of those policies over an extended period.
Hosny (2017), using data on about 6,000 firms in eight countries of the MENA region, derived from the European Bank for Reconstruction and Development (EBRD) and World Bank over the period 2009–2012, explored the impact of political instability on firm performance. The author measured the firm performance as the employment growth and firms' sales and found a negative effect of the political instability in firm performance. Similarly, Ozdamar et al. (2020) explored the impact of several obstacles in business and investment climate on a firm's performance, in Egypt and Turkey, measured by job creation and destruction. The findings show that access to finance and political instability are two major obstacles in the business and investment climate, while other important obstacles found were quality of the electricity supply and corruption in Egypt, and completion from the informal sector and high tax rates were the other two major obstacles in the business climate of Turkey.
However, this study aims to explore the impact of an aggregate index, comprising various obstacles in the business and investment climate, on the performance of firms in six countries of the MENA region and Turkey. Furthermore, we aim to perform a cross-country analysis and investigate the impact of major individual obstacles, such as access to finance and credit, corruption, political stability, electricity supply and tax rates among others.
3. Methodology and data
3.1 Methodology
For our empirical work we estimate the following regression:
FP denotes the firm performance, for firm i, in industry s, in state-area j and time t; BICI indicates the measures of business–investment climate discussed later and X is a vector of standard control variables. Set μs controls for fixed-industry or sector effects, set lj denotes the location-area fixed effects and θt is the time-fixed effects in the case we use more than one wave, while ε is the error term. We use three variables as proxies to firm performance; the value-added, which is defined as the sales minus the costs purchased from other firms-businesses; labour productivity and TFP. The region-area effects in regression (1) may capture geographical and cultural characteristics, such as weather and climatic differences, infrastructure properties, whether the area is coastal or landlocked and other unobserved characteristics. The time effects are included to capture time national level shocks, including weather shocks, oil prices and financial crises and other macroeconomic shocks that may affect the outcome of interest.
However, the business–investment climate index may be endogenous to firm growth. The three main courses of endogeneity include omitted-variable bias, reverse causality, self-statement and perception about the obstacles. For example, some managers may report complaints even though they are not obstacles, or some inefficient firms may overstate the constraints that they actually face (Beck et al., 2005; Aterido et al., 2011). Therefore, the business–investment climate index (BICI) may be endogenous because of measurement error due to perception, or because of possible reverse causality between BICI and the outcomes of interest explored in the study. On the one hand, a good BICI may have a positive impact on firm performance, while on the other hand, more profitable and productive industries may be able to organize themselves better and bring out a more effective BICI.
For the endogeneity issue, we implement the Two-Stage Least Squares (2SLS) method and we use two sets of instrumental variables for the BICI. The first set consists of variables that attempt to solve for the bias derived from the perception about the obstacles and they shift the focus from the self-reported statements towards contextual factors. The first variable is completed by the interviewer and the question is “It is my perception that the responses to the questions regarding opinions and perceptions are”, and the possible answers include (a) Truthful, (b) Somewhat Truthful and (c) Not truthful. The second variable answers the question “This questionnaire was completed in” and the possible answers include (a) One visit in face-to-face interview with one person, (b) One visit in face-to-face interview with different managers/staff and (c) Several visits. Our suggestion of using these two categorical variables lies in the argument that they are correlated with the perceptions of the business climate and cannot directly affect the outcomes of interest, while they may also account for the perception bias. Even though the business climate can have an impact on a firm's performance, the perception of the interviewer cannot affect them, but it can be correlated with the reliability of the individual response.
Cojocaru (2012) has ranked each household's well-being using the interviewer's judgment and perception as an instrumental variable, and the results are consistent. The interviewer's influence on the respondent's replying behaviour is reflected in the first instrument. Although the respondent's honesty is what determines the quality of the data, the interviewer's ability to create a trusting environment that allows for that is equally important. The second variable is related to the respondent's response, and it may serve as a potential instrumental variable since the perception of obstacles in the state–business relations and the business climate may vary depending on whether the questions are answered by the same or a different person across multiple visits. In particular, by interviewing different managers and staff members, we can reduce the perception bias derived from one person, while their answers cannot affect the firm performance outcomes.
The second set of instrumental variables includes the industry-location averages of the following: The percentage of the firms paying for security; the percentage of firms inspected by tax officials over the last 12 months; the number of inspections; percentage of firms facing competition from the informal sector; percentage of firms with loan-credit; percentage of firms experiencing losses due to theft and vandalism; percentage of firms where a gift-payment was requested; the percentage of the firms whose financial statements were checked and certified by an external auditor; percentage of firms formally registered when they started the operations and the industry concentration based on sales.
The reasoning underlying the validity of the last set of instruments is that industry-location-year average levels are dependent on industry and location characteristics, such as dependence on government services industries, industries' access to land, infrastructure and underlying technologies. This identification allows for a correlation between those averages and business–investment climate, but should, however, be uncorrelated with unobservables that are potentially correlated with the firm performance measures we explore (Collins et al., 2009). For instance, the time spent for tax officials and meetings with bureaucrats could depict the degree of control that those bureaucrats exert on the firm (Svensson, 2003), while the other instruments show the degree of dependence on government services. In particular, the industry-location effect may capture the shifts in electricity supply from various sources available, such as hydroelectric power and natural gas availability, and state-level rainfall and weather conditions.
An individual firm level perception about the business and investment climate will depend not only on the characteristics of that particular firm but also on characteristics specific to the location and industry in which it operates. At the industry and location level, such as those located in the capital, industrial zones or close to political centres and banking institutions, the level of rewards, obstacles, inspection by tax officials and engagement with bureaucrats, will depend on the accountability and transparency of the political system. As specific sectors may be more dependent on public procurement, other industries can be strategically more important, thus this variation is not driven by firm characteristics, but by factors determined by these industry-location characteristics (Angrist and Krueger, 2001). The last outcomes we explore refer to resource misallocation. Due to word limitations, we present more details about the methodology and the results in the supplementary material.
Since we use more than one instrumental variable for one endogenous variable, we prefer the 2SLS method. Furthermore, based on the identification strategy, other frameworks to infer causality, such as the difference-in-differences (DID), the regression discontinuity design (RDD) and propensity score matching (PSM), cannot be implemented. The main reason is that we do not evaluate a policy, and there is no treated and control group. Also, we do not have a shock that has created an exogenous variation in the business and investment climate, and there is no legislative change that could have been used for randomization (Angrist and Krueger, 2001). Furthermore, our empirical strategy does not identify any randomized control trial as we employ observational data from firm surveys. Thus, we use the 2SLS to create an exogenous variation in the endogenous variable of the business and investment climate.
3.2 Data
The analysis relies on data derived from the WBES [1]. We will explore the following countries: Egypt, Jordan, Iraq, Morocco, Tunisia, Turkey and Yemen. The period examined is 2006–2016, and it varies by country. For Egypt, we consider the panel data survey in 2008, 2013 and 2016, for Turkey we obtain the panel data survey over the period 2008–2013, and for Yemen the panel survey in 2010 and 2013. For Jordan, we use the cross-sectional survey in 2006 and 2013, for Morocco the surveys in years 2007 and 2013. We derived the data for Tunisia from the cross-sectional survey in 2013, and for Iraq, we use the cross-sectional survey in 2011.
The core questionnaire contains questions answered by the business owners and high ranked managers providing information about the business environment. More specifically, the questions refer to evaluations about the severity of obstacles that firms face. The interviewers ask firms to rank 15 components of the business environment, indicating which one presents the largest obstacle and to rank them on a scale of 0 (no obstacle) to 4 (severe obstacle).
In Table 1 we report the descriptive statistics for all the countries explored in the study, including the BICI and the control variables. The summary statistics do not reveal any important information except for the female ownership that is rather low, especially in Iraq at 6.9%, followed by Jordan at 9%, Yemen at 11%, Morocco at 13% and Egypt at 16%. It is remarkable to say that the percentage of female firm ownership is much higher in Tunisia at 36% followed by 31% in Turkey. The differences in the proportions of female firm ownership are attributed to various factors, including obstacles for women to own a firm or being partners because of their gender, which are linked to social norms and values. Furthermore, countries characterized by a large informal sector that does not allow women to own firms in the formal sector recorded in the WBES is another explanation of the differences in the firm female ownership. Female ownership is also lower in countries where they face more constraints in access to finance and credit. Capital availability is more restricted for women business owners in countries where they are considered as less educated about financial growth strategies and where they face challenges to finance their company due to lack of a business track record (Youness, 2007; OECD/ILO/CAWTAR, 2020). Furthermore, women entrepreneurs tend to have a lower socio-economic profile than their male counterparts and are more likely to have fewer resources to start a business (OECD, 2017), which varies in each country of our sample.
Summary statistics of the variables employed in the analysis
| Egypt | Mean | Standard deviation | Minimum | Maximum |
|---|---|---|---|---|
| Logarithm of value added | 14.635 | 2.237 | 3.912 | 23.927 |
| Labour productivity | 11.3629 | 1.553 | 1.609 | 19.847 |
| Logarithm of TFP | 2.6933 | 1.763 | −3.3539 | 12.681 |
| BICI index | −3.67e-10 | 0.8988 | −1.508 | 2.543 |
| Logarithm of firm size | 3.623 | 1.455 | 0 | 9.9522 |
| Young firm | 0.1367 | 0.3436 | 0 | 1 |
| Is one of the owners female? | 0.1607 | 0.3673 | 0 | 1 |
| Manager's years of experience | 18.489 | 12.041 | 1 | 61 |
| International quality assurance qualification | 0.2307 | 0.4213 | 0 | 1 |
| Is the firm part of another establishment? | 0.1797 | 0.3840 | 0 | 1 |
| Jordan | ||||
| Logarithm of value added | 12.717 | 2.414 | 2.0794 | 19.942 |
| Labour productivity | 9.5536 | 2.404 | −1.727 | 16.060 |
| Logarithm of TFP | 1.4768 | 1.467 | −7.698 | 10.013 |
| BICI index | −3.45e-10 | 0.9029 | −1.471 | 2.544 |
| Logarithm of firm size | 3.482 | 1.474 | 0.6931 | 9.047 |
| Young firm | 0.2286 | 0.4201 | 0 | 1 |
| Is one of the owners female? | 0.0902 | 0.2866 | 0 | 1 |
| Manager's years of experience | 17.381 | 11.011 | 1 | 60 |
| International quality assurance qualification | 0.1938 | 0.3955 | 0 | 1 |
| Is the firm part of another establishment? | 0.4823 | 0.4999 | 0 | 1 |
| Iraq | ||||
| Logarithm of value added | 19.094 | 1.157 | 15.123 | 23.102 |
| Logarithm of labour productivity | 17.112 | 1.047 | 13.163 | 20.654 |
| Logarithm of TFP | 0.0513 | 0.6817 | −2.0481 | 2.771 |
| BICI index | −4.72e-10 | 0.9412 | −1.928 | 2.035 |
| Logarithm of firm size | 2.305 | 0.7515 | 0 | 5.459 |
| Young firm | 0.2204 | 0.4148 | 0 | 1 |
| Is one of the owners female? | 0.0689 | 0.2535 | 0 | 1 |
| Manager's years of experience | 12.308 | 8.065 | 1 | 60 |
| International quality assurance qualification | 0.0241 | 0.1537 | 0 | 1 |
| Is the firm part of another establishment? | 0.0621 | 0.2416 | 0 | 1 |
| Morocco | ||||
| Logarithm of value added | 15.969 | 2.001 | 8.464 | 22.762 |
| Labour productivity | 12.739 | 1.594 | 6.897 | 19.336 |
| Logarithm of TFP | 5.573 | 1.367 | 1.761 | 14.570 |
| BICI index | 4.06e-10 | 0.9304 | −1.445 | 1.928 |
| Logarithm of firm size | 3.884 | 1.334 | 0 | 8.724 |
| Young firm | 0.0816 | 0.2739 | 0 | 1 |
| Is one of the owners female? | 0.1292 | 0.3356 | 0 | 1 |
| Manager's years of experience | 21.957 | 11.277 | 1 | 64 |
| International quality assurance qualification | 0.2063 | 0.4048 | 0 | 1 |
| Is the firm part of another establishment? | 0.4052 | 0.4911 | 0 | 1 |
| Tunisia | ||||
| Logarithm of value added | 14.257 | 1.676 | 8.294 | 19.920 |
| Logarithm of labour productivity | 10.736 | 1.445 | 7.340 | 14.976 |
| Logarithm of TFP | 4.086 | 1.273 | 0.687 | 10.166 |
| BICI index | −1.34e-09 | 0.8914 | −1.170 | 3.057 |
| Logarithm of firm size | 3.5692 | 1.380 | 0 | 7.766 |
| Young firm | 0.0813 | 0.2736 | 1 | 1 |
| Is one of the owners female? | 0.3675 | 0.4826 | 0 | 1 |
| Manager's years of experience | 25.611 | 11.499 | 1 | 61 |
| International quality assurance qualification | 0.2432 | 0.4294 | 0 | 1 |
| Is the firm part of another establishment? | 0.8817 | 0.3231 | 0 | 1 |
| Turkey | Mean | Standard deviation | Minimum | Maximum |
|---|---|---|---|---|
| Logarithm of value added | 12.168 | 4.828 | 0 | 23.025 |
| Logarithm of labour productivity | 7.737 | 4.8696 | −2.944 | 14.853 |
| Logarithm of TFP | 5.272 | 1.654 | −4.558 | 14.479 |
| BICI index | −1.56e-09 | 0.9378 | −1.354 | 2.664 |
| Logarithm of firm size | 3.6130 | 1.447 | 0 | 9.944 |
| Young firm | 0.1133 | 0.3170 | 1 | 1 |
| Is one of the owners female? | 0.3188 | 0.4660 | 0 | 1 |
| Manager's years of experience | 23.125 | 11.976 | 1 | 55 |
| International quality assurance qualification | 0.4623 | 0.4969 | 0 | 1 |
| Is the firm part of another establishment? | 0.1506 | 0.3244 | 0 | 1 |
| Yemen | ||||
| Logarithm of value added | 16.952 | 2.774 | 2.197 | 26.871 |
| Logarithm of labour productivity | 14.519 | 1.926 | 7.4437 | 23.346 |
| Logarithm of TFP | 4.8257 | 1.942 | −0.4352 | 10.416 |
| BICI index | 1.53e-09 | 0.8880 | −2.383 | 1.953 |
| Logarithm of firm size | 2.816 | 1.298 | 0.6931 | 8.517 |
| Young firm | 0.0718 | 0.2584 | 1 | 1 |
| Is one of the owners female? | 0.1092 | 0.3121 | 0 | 1 |
| Manager's years of experience | 19.193 | 9.810 | 1 | 63 |
| International quality assurance qualification | 0.1440 | 0.3513 | 0 | 1 |
| Is the firm part of another establishment? | 0.3963 | 0.4894 | 0 | 1 |
The value-added and TFP are rather similar among the countries explored. Based on the data availability and earlier studies, labour productivity is defined as the sales over the number of employees (Schiffbauer et al., 2015). This index is high in countries, such as Egypt, Iraq and Yemen, and much lower in Turkey and Jordan, because the former countries probably face lower labour costs and wages, which are usually a significant part of the total costs, and therefore increase the value of sales. About the business environment, we created an aggregate index of business–investment climate considering all the obstacles presented in Figures 1–7 derived by the predicted values of the principal component analysis. We report the relevant summary statistics in Table 1.
In Table 2 we present the proportions of the answers to the questions of the first set of the instruments. We should notice that in Tunisia the second instrumental variable, about the frequency of the interview completion is missing, so we will use only the first variable as an instrument in the regression analysis, along with the second set of instruments we discussed earlier. A shred of initial evidence comes from the correlation between the instrument variables and the outcomes of interest, which is insignificant, while their correlation with the business and investment climate index is statistically significant at the 1% level in the majority.
Proportions for the instrument variables
| Egypt | Truthful | Somewhat truthful | Not truthful |
| Responses to the questions regarding opinions and perceptions are | 42.54 | 52.46 | 5.00 |
| One visit in face-to-face interview with one person | One visit in face-to-face interview with different managers/staff | Several visits | |
| This questionnaire was completed in | 91.14 | 6.92 | 1.94 |
| Jordan | Truthful | Somewhat truthful | Not truthful |
| Responses to the questions regarding opinions and perceptions are | 44.14 | 48.33 | 7.53 |
| One visit in face-to-face interview with one person | One visit in face-to-face interview with different managers/staff | Several visits | |
| This questionnaire was completed in | 86.85 | 13.15 | 0 |
| Iraq | Truthful | Somewhat truthful | Not truthful |
| Responses to the questions regarding opinions and perceptions are | 43.12 | 48.68 | 8.20 |
| One visit in face-to-face interview with one person | One visit in face-to-face interview with different managers/staff | Several visits | |
| This questionnaire was completed in | 80.42 | 11.78 | 7.80 |
| Morocco | Truthful | Somewhat truthful | Not truthful |
| Responses to the questions regarding opinions and perceptions are | 67.08 | 30.18 | 2.74 |
| One visit in face-to-face interview with one person | One visit in face-to-face interview with different managers/staff | Several visits | |
| This questionnaire was completed in | 18.45 | 20.03 | 61.52 |
| Tunisia | Truthful | Somewhat truthful | Not truthful |
| Responses to the questions regarding opinions and perceptions are | 76.35 | 23.31 | 0.34 |
| Turkey | Truthful | Somewhat truthful | Not truthful |
| Responses to the questions regarding opinions and perceptions are | 75.48 | 22.80 | 1.72 |
| One visit in face-to-face interview with one person | One visit in face-to-face interview with different managers/staff | Several visits | |
| This questionnaire was completed in | 93.11 | 6.57 | 0.32 |
| Yemen | Truthful | Somewhat truthful | Not truthful |
| Responses to the questions regarding opinions and perceptions are | 45.78 | 49.76 | 4.46 |
| One visit in face-to-face interview with one person | One visit in face-to-face interview with different managers/staff | Several visits | |
| This questionnaire was completed in | 87.00 | 9.44 | 3.56 |
4. Empirical results
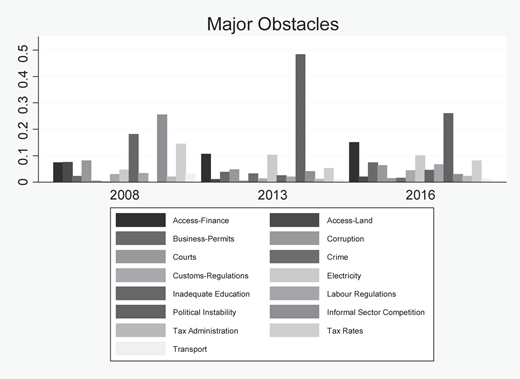
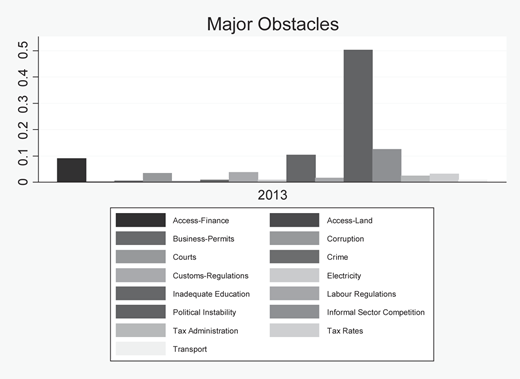
The first step of our analysis involves a visual presentation of the major obstacles to the business climate in the countries we explore. In particular, the answers reply to the following question: “Biggest obstacle affecting the operation of this establishment”. In Figure 1, we illustrate the major obstacles in Egypt. Even though access to finance is reduced by 25% in 2008 to 12% in 2013, it is still considered one of the seven major obstacles. Moreover, we see that corruption was low in 2008 at 2% but increased at 5% in 2013. The most significant obstacle in 2013 was political instability, most probably due to the facts followed by the Arab Spring while in 2008, the specific obstacle was low, and in 2016 is reduced at 28%. We observe a significant reduction from 2008 to 2013 and 2016 for the competition from the informal sector and the inadequate education of the workforce. Corruption, even though is low, is quite consistent and stable. Other two major obstacles include the electricity and tax rates, according to the frequency of the responses, while obstacles in business licenses and permits increased from 2% in 2008 to 9% in 2016.
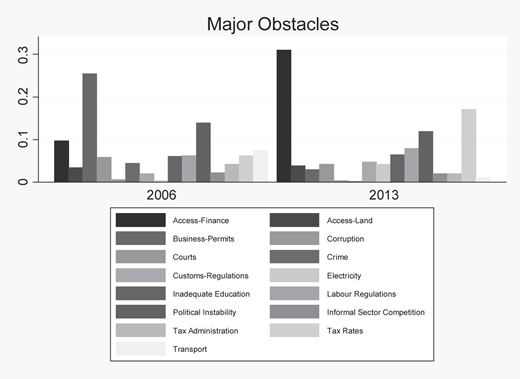
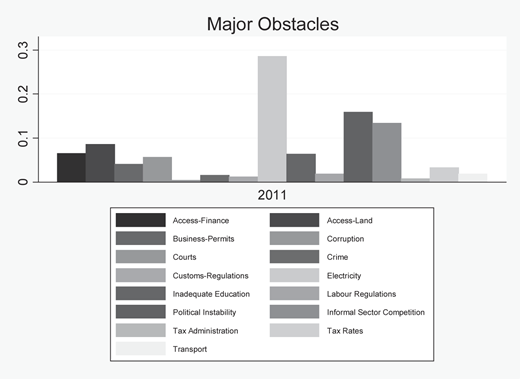
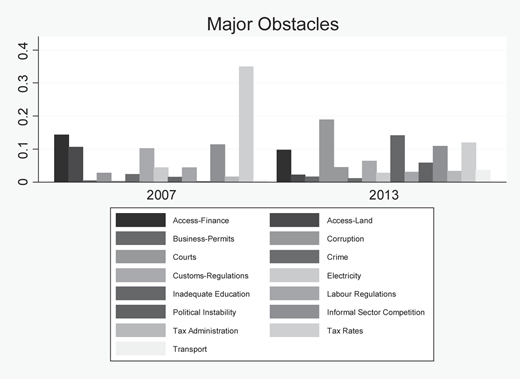
In the case of Jordan and based on Figure 2, we observe numerous obstacles. Business permits and transportation were the first and the fourth-highest major obstacles in 2006, and in 2013 are recorded as two of the least important. In Figure 3, we present the obstacles in Iraq, where access to finance, corruption, electricity and political instability, respectively at 7, 6, 29 and 16%, are major obstacles, as they are in the majority of the countries we explore. Competition from the informal sector and access to land are other critical obstacles. In Figure 4, we illustrate the principal obstacles in Morocco. We observe that tax rates are the major obstacle at 27%, followed by access to finance, practices from the informal sector and corruption at 12.5, 11 and 9%, respectively. In Figure 5, we observe that most of the respondents in Tunisia state that political instability is the major obstacle at 50%, followed by competition from the informal sector at 12%, inadequate education of the workforce at 10.50 and access to finance at 9%.
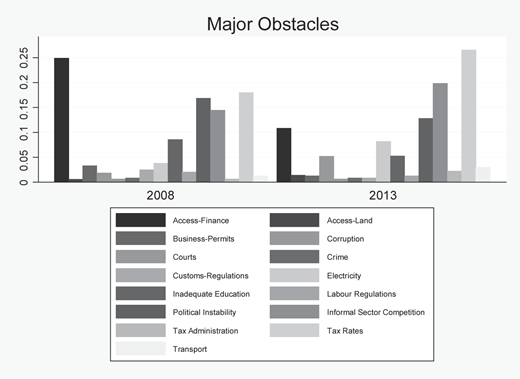
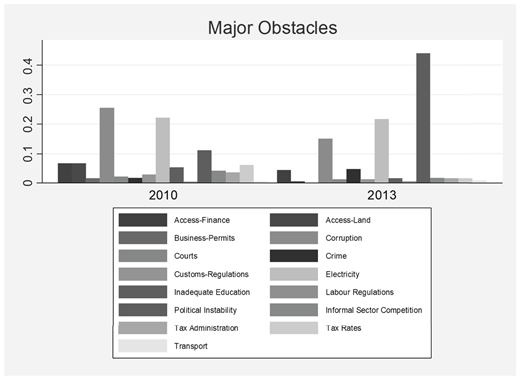
In Figure 6, we report the major obstacles in Turkey, and we observe significant changes across time. For instance, in 2008, 25% stated the access to finance and credit as one of the most critical obstacles followed by a decline at 11% in 2013. Tax rates as a major obstacle increased from 19 to 26% over the same period. The rest of the major obstacles, including the political instability, electricity and competition from the informal sector, remained almost the same over the period we examine. In Figure 7, the four major obstacles in Yemen are access to finance at 6%, corruption and electricity at 21% on average, and the most critical obstacle is political instability on average 26%. We observe the latter increased considerably from 12% in 2010 to 44% in 2013.
In Table 3 we present the OLS and 2SLS regression results for the major obstacles in the business climate in Egypt. Our aim, as we do in the case of Turkey, is to include the whole sample that refers to the cross-sectional sample, and not only the panel sample, since the latter limits the number of firms. We use the survey sample weights and strata provided by the WBES. However, the data for Yemen include only the panel structure. We observe that the set of instruments employed passes the endogeneity tests, and in particular the Hansen J statistic. Also, we conclude the instruments are correlated with the endogenous BICI according to the weak instrument test.
OLS and 2SLS regressions for business and investment climate in Egypt
| Panel A: OLS | DV: Logarithm of value added | DV: Labour productivity | DV: Logarithm of TFP | Panel B: IV | DV: Logarithm of value added | DV: Labour productivity | DV: Logarithm of TFP |
|---|---|---|---|---|---|---|---|
| Business climate | −0.1452*** (0.0665) | −0.1511** (0.0229) | −0.1072** (0.0491) | Business climate | −0.3260** (0.1351) | −0.3730** (0.1571) | −0.1953* (0.0995) |
| Logarithm of firm size | 0.9626*** (0.0292) | 0.0191 (0.0312) | 0.0975*** (0.0309) | Logarithm of firm size | 0.9491*** (0.0400) | 0.0221 (0.0347) | 0.1013*** (0.0359) |
| Young firms | 0.0501 (0.0796) | 0.2875** (0.1325) | 0.0335 (0.0478) | Young firms | 0.0441 (0.0834) | 0.2602** (0.1266) | 0.0429 (0.0375) |
| Is one of the owners female? (Yes) | 0.0448 (0.0780) | 0.1369 (0.1042) | 0.0207 (0.0959) | Is one of the owners female? (Yes) | 0.0489 (0.0634) | 0.1127 (0.1158) | 0.0199 (0.0825) |
| Manager's years of experience | 0.0024 (0.0021) | 0.0011 (0.0033) | 0.0023 (0.0030) | Manager's years of experience | 0.0017 (0.0032) | 0.0020 (0.0036) | 0.0017 (0.0033) |
| International quality assurance qualification (Yes) | 0.3822*** (0.0934) | 0.4906*** (0.0994) | 0.0676 (0.0989) | International quality assurance qualification (Yes) | 0.4231*** (0.1136) | 0.5214*** (0.1093) | 0.1757 (0.1153) |
| Is the firm part of another establishment? (Yes) | 0.2095** (0.0880) | 0.2156*** (0.0914) | 0.0524 (0.0872) | Is the firm part of another establishment? (Yes) | 0.1921** (0.0811) | 0.2142** (0.0972) | 0.1853 (0.1149) |
| Firm status (public owned) | −0.0021 (0.0045) | −0.0005 (0.0042) | −0.0010 (0.0050) | Firm status (public owned) | −0.0034 (0.0060) | −0.0005 (0.0040) | −0.0008 (0.0047) |
| No. observations | 3,142 | 3,082 | 2,222 | No. observations | 2,833 | 2,814 | 1,951 |
| R-square | 0.6704 | 0.3212 | 0.6490 | Centered R-Square | 0.6217 | 0.1837 | 0.4105 |
| Weak identification test | 12.605 [0.0002] | 15.302 [0.000] | 14.738 [0.000] | ||||
| Hansen J statistic | 5.303 [0.2910] | 3.695 [0.4823] | 9.286 [0.1976] |
Note(s): Standard errors within brackets, p-values within the square brackets, ***, ** and * indicate significance respectively at the 1, 5 and 10% level. The period of analysis is 2008–2016
We find a negative impact of the obstacles in the business climate on the firm performance, while the effect becomes larger when we apply the 2SLS. According to the 2SLS estimates and the marginal effects, value-added and labour productivity decrease by 32 and 37% respectively, while TFP is lower by 19%. While we do not explain the possible impact of other firm characteristics, such as the firm size and age, the manager's experience, the location and regional development, we explore the causal impact of business climate using the marginal effects controlling for other characteristics. We observe that large firms present higher values of TFP and value-added, while the estimated coefficient on the labour productivity regression is insignificant. Regarding young firms, which are defined as the firms established less than 6 years ago from the interview date, present higher labour productivity, but the significance vanishes when we consider the value-added or the TFP as the outcomes. The gender of the ownership and whether the largest percentage of shares is owned by the public are insignificant determinants of the firm performance. On the other hand, we see that firms, accredited with an international certification of quality assurance-control and whether are part of another establishment, are more likely to report higher values of value-added and labour productivity.
In Table 4, we present the regression results for Jordan, and we observe that obstacles in the business climate have a significant and negative impact on value-added and TFP at 21 and 19%, respectively. The results show that larger firms present higher values of value-added, but the significance vanishes when we consider the TFP and labour productivity. The remaining estimated coefficients are insignificant except for the international qualification of quality assurance, which has a positive impact on TFP, while firms with female owners present lower performance.
OLS and 2SLS regressions for business and investment climate in Jordan
| Panel A: OLS | DV: Logarithm of value added | DV: Labour productivity | DV: Logarithm of TFP | Panel B: IV | DV: Logarithm of value added | DV: Labour productivity | DV: Logarithm of TFP |
|---|---|---|---|---|---|---|---|
| Business climate | −0.1644* (0.0930) | −0.1015 (0.1327) | −0.1428* (0.7331) | Business climate | −0.2111* (0.4211) | −0.2610 (0.4848) | −0.1902* (0.1081) |
| Logarithm of firm size | 0.9904*** (0.0829) | −0.0221 (0.0979) | 0.0409 (0.1058) | Logarithm of firm size | 0.9676*** (0.0950) | −0.0339 (0.1178) | 0.0522 (0.0799) |
| Young firms | 0.1316 (0.2225) | 0.0567 (0.2960) | 0.1084 (0.0883) | Young firms | 0.1203 (0.2282) | 0.0237 (0.2997) | 0.0985 (0.1055) |
| Is one of the owners female? (Yes) | −0.7475*** (0.2613) | −1.2679*** (0.2993) | −1.3926*** (0.3285) | Is one of the owners female? (Yes) | −0.8461*** (0.2705) | −1.4402*** (0.3060) | −1.5531*** (0.3422) |
| Manager's years of experience | 0.0121 (0.0097) | 0.0056 (0.0102) | 0.0118 (0.0109) | Manager's years of experience | 0.0095 (0.0091) | 0.0067 (0.0107) | 0.0129 (0.0113) |
| International quality assurance qualification (Yes) | 0.1885 (0.2508) | 0.2040 (0.2902) | 0.4190* (0.2274) | International quality assurance qualification (Yes) | 0.1506 (0.2608) | 0.1855 (0.2894) | 0.4237* (0.2220) |
| Is the firm part of another establishment? (Yes) | 0.2616 (0.3141) | 0.1878 (0.3640) | −0.3227 0.3832) | Is the firm part of another establishment? (Yes) | 0.1710 (0.3472) | 0.3124 (0.4316) | −0.3838 (0.4221) |
| Firm status (public owned) | 0.0042 (0.0159) | −0.0028 (0.0187) | −0.0169 (0.0140) | Firm status (public owned) | 0.0053 (0.0160) | −0.0022 (0.0182) | −0.0188 (0.0144) |
| No. observations | 404 | 401 | 358 | No. observations | 386 | 381 | 343 |
| R-square | 0.4904 | 0.1122 | 0.1518 | Centered R-Square | 0.4849 | 0.1157 | 0.1568 |
| Weak identification test | 15.219 [0.0006] | 13.957 [0.0012] | 16.119 0.0001] | ||||
| Hansen J statistic | 7.881 [0.4452] | 6.448 [0.5838] | 12.255 [0.1139] |
Note(s): Standard errors within brackets, p-values within the square brackets, *** and * indicate significance respectively at the 1 and 10% level. The period of analysis is 2006–2013
In Table 5, we report our OLS and 2SLS estimates for the obstacles in the business climate in Iraq, associated with a decrease in value-added by 22% and a decrease of labour productivity and TFP at 16 and 15%, respectively. A remarkable finding in Table 5 is that firm size is positively correlated with value-added but negatively associated with labour productivity and TFP. This finding indicates that value-added may not serve as the best indicator for measuring firm performance. Hence, smaller firms may use the labour inputs more efficiently, such as skilled employees, lower input costs, while large firms can achieve a higher sales volume because of economies of scale, market share and other characteristics.
OLS and 2SLS regressions for business and investment climate in Iraq
| Panel A: OLS | DV: Logarithm of value added | DV: Labour productivity | DV: Logarithm of TFP | Panel B: IV | DV: Logarithm of value added | DV: Labour productivity | DV: Logarithm of TFP |
|---|---|---|---|---|---|---|---|
| Business climate | −0.1558*** (0.0505) | −0.1097* (0.0562) | −0.0926** (0.0452) | Business climate | −0.2232** (0.1045) | −0.1609* (0.0914) | −0.1497* (0.0834) |
| Logarithm of firm size | 0.5207*** (0.1058) | −0.5703*** (0.0823) | −0.1609** (0.0795) | Logarithm of firm size | 0.4853*** (0.0888) | −0.5279*** (0.0765) | −0.2008** (0.0777) |
| Young firms | 0.1765 (0.1524) | 0.0640 (0.1222) | 0.0187 (0.1189) | Young firms | 0.1979 (0.1718) | 0.0935 (0.1186) | 0.0256 (0.1017) |
| Is one of the owners female? (Yes) | 0.3684* (0.1960) | 0.3154* (0.1668) | 0.1585 (0.1107) | Is one of the owners female? (Yes) | 0.4097* (0.2154) | 0.2995* (0.1574) | 0.1455 (0.1280) |
| Manager's years of experience | 0.0207*** (0.0075) | 0.0156** (0.0072) | −0.0053 (0.0070) | Manager's years of experience | 0.0197** (0.0080) | 0.0222*** (0.0068) | 0.0031 (0.0069) |
| International quality assurance qualification (Yes) | 0.0169 (0.3548) | 0.3056 (0.2561) | 0.1921 (0.2603) | International quality assurance qualification (Yes) | 0.0204 (0.3515) | 0.3467 (0.2477) | 0.2186 (0.2751) |
| Is the firm part of another establishment? (Yes) | −0.1402 (0.2173) | −0.4912** (0.2459) | −0.2021 (0.2346) | Is the firm part of another establishment? (Yes) | 0.1749 (0.2521) | −0.3938* (0.2249) | −0.1899 (0.2263) |
| Firm status (public owned) | 0.0162 (0.0111) | 0.0039 (0.0071) | 0.0022 (0.0087) | Firm status (public owned) | 0.0151 (0.0112) | 0.0032 (0.0080) | 0.0028 (0.0080) |
| No. observations | 692 | 439 | 404 | No. observations | 658 | 421 | 386 |
| R-square | 0.8048 | 0.5799 | 0.3105 | Centered R-Square | 0.3684 | 0.4824 | 0.1496 |
| Weak identification test | 15.338 [0.000] | 15.211 [0.000] | 16.033 [0.000] | ||||
| Hansen J statistic | 7.990 [0.3353] | 7.176 [0.3960] | 7.791 [0.3736] |
Note(s): Standard errors within brackets, p-values within the square brackets, ***, ** and * indicate significance respectively at the 1, 5 and 10% level. The period of analysis is 2011
In Tables 6 and 7, we present the estimated results for the obstacles in the business climate in Morocco and Tunisia, respectively. In the case of Morocco, we find significant effects of the obstacles in business climate on value-added at 39% and TFP at 23%. In Tunisia, we find a negative and significant effect on value-added and TFP at 24 and 11%, respectively. As in the case of Iraq, we observe that the firm size is positively correlated with the value-added but has a negative relationship with both labour productivity and TFP. This may indicate that the state and public local authorities in these countries favour these firms by providing more subsidies, access to financial markets and other benefits, allowing them to keep sales and value-added at higher levels, compared to the small-medium firms. However, this does not imply that this also improves their productivity.
OLS and 2SLS regressions for business and investment climate in Morocco
| Panel A: OLS | DV: Logarithm of value added | DV: Labour productivity | DV: Logarithm of TFP | Panel B: IV | DV: Logarithm of value added | DV: Labour productivity | DV: Logarithm of TFP |
|---|---|---|---|---|---|---|---|
| Business climate | −0.2252** (0.1032) | −0.1426 (0.2416) | −0.1215** (0.0538) | Business climate | −0.3944** (0.1755) | −0.3029 (0.2830) | −0.2318** (0.0082) |
| Logarithm of firm size | 0.6919*** (0.1193) | −0.0407 (0.1007) | −0.1472* (0.0777) | Logarithm of firm size | 0.6945*** (0.1090) | −0.0746 (0.1309) | −0.1679** (0.0710) |
| Young firms | 0.1414 (0.1971) | 0.6027 (0.7735) | 0.1855 (0.2916) | Young firms | 0.1391 (0.2035) | 0.4329 (0.7310) | 0.2428 (0.3130) |
| Is one of the owners female? (Yes) | 1.1250*** (0.3509) | 1.0245** (0.4219) | 0.6741*** (0.2459) | Is one of the owners female? (Yes) | 1.1135*** (0.3246) | 0.9519** (0.3927) | 0.5806** (0.2722) |
| Manager's years of experience | 0.0068 (0.0120) | 0.0023 (0.0137) | 0.0015 (0.0081) | Manager's years of experience | 0.0069 (0.0109) | 0.0036 (0.0124) | 0.0018 (0.0097) |
| International quality assurance qualification (Yes) | 0.7022** (0.3268) | 0.6230* (0.3717) | 0.4128* (0.2130) | International quality assurance qualification (Yes) | 0.7043** (0.2955) | 0.6225* (0.3555) | 0.3881* (0.2064) |
| Is the firm part of another establishment? (Yes) | 0.2010 (0.3655) | −0.2783 (0.4295) | 0.1451 (0.2666) | Is the firm part of another establishment? (Yes) | 0.1774 (0.3403) | −0.3210 (0.4022) | 0.1029 (0.2912) |
| Firm status (public owned) | 0.0255 (0.0713) | 0.0306 (0.0822) | 0.0118 (0.0849) | 0.0234 (0.0655) | 0.0234 (0.0655) | 0.0129 (0.0733) | |
| No. observations | 541 | 528 | 302 | No. observations | 532 | 523 | 282 |
| R-square | 0.5030 | 0.2355 | 0.1999 | Centered R-Square | 0.5028 | 0.2241 | 0.1982 |
| Weak identification test | 13.139 [0.0004] | 16.103 [0.000] | 13.560 [0.0003] | ||||
| Hansen J statistic | 10.315 [0.1579] | 16.128 [0.0085] | 0.380 [0.9990] |
Note(s): Standard errors within brackets, p-values within the square brackets, ***, ** and * indicate significance respectively at the 1, 5 and 10% level. The period of analysis is 2007–2013
OLS and 2SLS regressions for business and investment climate in Tunisia
| Panel A: OLS | DV: Logarithm of value added | DV: Labour productivity | DV: Logarithm of TFP | Panel B: IV | DV: Logarithm of value added | DV: Labour productivity | DV: Logarithm of TFP |
|---|---|---|---|---|---|---|---|
| Business climate | −0.1553** (0.0775) | −0.1356 (0.1061) | −0.0337** (0.0142) | Business climate | −0.2348** (0.1102) | −0.2405 (0.1820) | −0.1095** (0.0473) |
| Logarithm of firm size | 0.7963*** (0.0519) | −0.3452*** (0.0772) | −0.3012*** (0.1128) | Logarithm of firm size | 0.7756*** (0.0528) | −0.3135*** (0.0836) | −0.2549** (0.1102) |
| Young firms | 0.3137 (0.2181) | 0.1371 (0.2996) | 0.2776 (0.3632) | Young firms | 0.1095 (0.2209) | 0.2302 (0.3600) | 0.3002 (0.3473) |
| Is one of the owners female? (Yes) | −0.1083 (0.1254) | 0.1031 (0.1817) | 0.2429 (0.2336) | Is one of the owners female? (Yes) | −0.1092 (0.1252) | 0.1056 (0.1965) | 0.2392 (0.2098) |
| Manager's years of experience | 0.0045 (0.0056) | −0.0064 (0.0092) | 0.0305*** (0.0162) | Manager's years of experience | 0.0036 (0.0056) | −0.0070 (0.0096) | 0.0347** (0.0150) |
| International quality assurance qualification (Yes) | 0.5755*** (0.1460) | 0.9365*** (0.2795) | 0.6566** (0.2879) | International quality assurance qualification (Yes) | 0.5426*** (0.1446) | 1.0938*** (0.2176) | 0.7241** (0.3189) |
| Is the firm part of another establishment? (Yes) | −0.1056 (0.1880) | −0.1616 (0.2670) | −0.3192 (0.3386) | Is the firm part of another establishment? (Yes) | −0.0934 (0.1834) | −0.2269 (0.2007) | −0.3866 (0.4339) |
| Firm status (public owned) | 0.0058 (0.0100) | −0.2084*** (0.0751) | 0.0055 (0.0321) | Firm status (public owned) | 0.0055 (0.0098) | −0.1882** (0.0860) | 0.0097 (0.0309) |
| No. observations | 391 | 301 | 172 | No. observations | 391 | 312 | 175 |
| R-square | 0.7123 | 0.6471 | 0.7453 | Centered R-Square | 0.5915 | 0.2397 | 0.1275 |
| Weak identification test | 18.158 [0.000] | 18.985 [0.000] | 9.030 [0.0014] | ||||
| Hansen J statistic | 4.686 [0.2336] | 5.009 [0.1711] | 5.987 [0.3220] |
Note(s): Standard errors within brackets, p-values within the square brackets, *** and ** indicate significance respectively at the 1 and 5% level. The period of analysis is 2013
In Table 8, we report the estimates for the major obstacles to business and investment climate in Turkey. Based on the results, we observe that the overall index of obstacles in business and investment climate in Turkey reduce the value-added and labour productivity by 17% and TFP by 12%. The effect becomes significantly higher based on the 2SLS and Panel B of Table 8, where the reduction reaches 27 and 25% respectively for value-added and labour productivity and 18% for the TFP. Firm size and young firms seem to be positively correlated with firm performance. Also, firms whose ownership consists of at least one female, have acquired an international certification of quality control and are part of another establishment, report higher value-added.
OLS and 2SLS regressions for business and investment climate in Turkey
| Panel A: OLS | DV: Logarithm of value added | DV: Labour productivity | DV: Logarithm of TFP | Panel B: IV | DV: Logarithm of value added | DV: Labour productivity | DV: Logarithm of TFP |
|---|---|---|---|---|---|---|---|
| Business climate | −0.1704*** (0.0511) | −0.1673* (0.0854) | −0.1232* (0.0663) | Business climate | −0.2732** (0.1214) | −0.2566* (0.1353) | −0.1854* (0.1038) |
| Logarithm of firm size | 0.8377*** (0.0880) | 0.1275 (0.0859) | 0.3910*** (0.0564) | Logarithm of firm size | 0.6839** (0.2881) | 0.1651 (0.2169) | 0.3655*** (0.0829) |
| Young firms | 0.1990 (0.3357) | 0.0712* (0.0368) | 0.5573** (0.2167) | Young firms | 0.2373 (0.4445) | 0.0692* (0.0363) | 0.5843** (0.2736) |
| Is one of the owners female? (Yes) | 0.3101* (0.1681) | 0.1834 (0.2425) | 0.1497 (0.1324) | Is one of the owners female? (Yes) | 0.2859* (0.1528) | 0.2149 (0.2263) | 0.1129 (0.1502) |
| Manager's years of experience | 0.0133 (0.0088) | 0.0162 (0.0104) | 0.0027 (0.0054) | Manager's years of experience | 0.0187 (0.0133) | 0.0165 (0.0212) | 0.0036 (0.0068) |
| International quality assurance qualification (Yes) | 0.1866* (0.1044) | 0.1294 (0.2561) | 0.2074 (0.1435) | International quality assurance qualification (Yes) | 0.2225* (0.1276) | 0.1569 (0.2244) | 0.1872 (0.1312) |
| Is the firm part of another establishment? (Yes) | 0.8496*** (0.2887) | 0.6110* (0.3396) | 0.1351 (0.1795) | Is the firm part of another establishment? (Yes) | 0.8172** (0.3910) | 0.6003* (0.3133) | 0.1394 (0.1937) |
| Firm status (public owned) | −0.0020 (0.0025) | 0.0211 (0.0286) | 0.1081*** (0.0103) | Firm status (reference manufacturing) | −0.0039 (0.0045) | 0.0228 (0.0315) | 0.1044*** (0.0292) |
| No. observations | 2,013 | 1,744 | 1,097 | No. observations | 1,871 | 1,615 | 946 |
| R-square | 0.3077 | 0.1840 | 0.2772 | Centered R-Square | 0.2202 | 0.1522 | 0.2514 |
| Weak identification test | 21.654 [0.000] | 15.678 [0.000] | 12.232 [0.0002] | ||||
| Hansen J statistic | 13.274 [0.1506] | 18.034 [0.0889] | 9.984 [0.3517] |
Note(s): Standard errors within brackets, p-values within the square brackets, ***, ** and * indicate significance respectively at the 1, 5 and 10% level. The period of analysis is 2008–2013
In Table 9, we find that the obstacles in Yemen are significantly and negatively related to labour productivity and TFP at 24 and 34%, respectively. Large firms, as well as firms that are part of another establishment, and accredited with an international certification of quality, control present higher performance levels.
OLS and 2SLS regressions for business and investment climate in Yemen
| Panel A: OLS | DV: Logarithm of value added | DV: Labour productivity | DV: Logarithm of TFP | Panel B: IV | DV: Logarithm of value added | DV: Labour productivity | DV: Logarithm of TFP |
|---|---|---|---|---|---|---|---|
| Business climate | −0.1955 (0.1318) | −0.1572* (0.0874) | −0.1389** (0.0662) | Business climate | −0.3374 (0.4045) | −0.2436** (0.1006) | −0.3450* (0.1859) |
| Logarithm of firm size | 1.2263*** (0.1101) | 0.4227* (0.2267) | 0.8125*** (0.2130) | Logarithm of firm size | 1.3199*** (0.1379) | 0.4666** (0.1903) | 0.7190** (0.3303) |
| Young firms | 0.5936 (0.4030) | 0.2386 (0.3006) | 0.5513 (0.9584) | Young firms | 0.6141 (0.4843) | 0.2148 (0.3466) | 0.5818 (0.8035) |
| Is one of the owners female? (Yes) | 0.3670 (0.3829) | 0.0280 (0.1082) | 0.5457 (0.6335) | Is one of the owners female? (Yes) | 0.4401 (0.3857) | 0.0324 (0.0788) | 0.4386 (0.5380) |
| Manager's years of experience | 0.0155 (0.0099) | −0.0025 (0.0086) | −0.0190 (0.0151) | Manager's years of experience | 0.0157 (0.097) | 0.0043 (0.0137) | −0.0151 (0.0183) |
| International quality assurance qualification (Yes) | 0.8994** (0.3509) | 0.3819 (0.3155) | 1.8180** (0.7207) | International quality assurance qualification (Yes) | 0.8178** (0.3559) | 0.3247 (0.2555) | 1.5600** (0.7494) |
| Is the firm part of another establishment? (Yes) | 0.4898** (0.2267) | 0.5929** (0.2421) | 0.4149 (0.4737) | Is the firm part of another establishment? (Yes) | 0.5688** (0.2359) | 0.6985** (0.3287) | 0.3931 (0.3522) |
| Firm status (public owned) | −0.0027 (0.0158) | 0.0047 (0.0181) | 0.0520 (0.0394) | Firm status (reference manufacturing) | −0.0025 (0.0164) | 0.0094 (0.0171) | 0.0493 (0.0452) |
| No. observations | 521 | 505 | 261 | No. observations | 521 | 502 | 248 |
| R-square | 0.5119 | 0.4997 | 0.5872 | Centered R-Square | 0.4961 | 0.3223 | 0.3556 |
| Weak identification test | 21.901 [0.000] | 9.881 [0.0091] | 18.947 [0.0027] | ||||
| Hansen J statistic | 6.375 [0.5928] | 10.758 [0.2273] | 11.040 [0.1905] |
Note(s): Standard errors within brackets, p-values within the square brackets, ***, ** and * indicate significance respectively at the 1, 5 and 10% level. The period of analysis is 2010–2013
In Table 10, we implement a cross-section country analysis. The main aim is to investigate the obstacles in BICI individually by pooling all the firms across the seven countries we explore and identifying the most important ones. The estimates derived from both OLS and 2SLS show that political instability followed by corruption and obstacles in access to finance and credit have the largest negative impact on the firm performance. Other major obstacles are the poor quality of the electricity supply, delays and obstacles in business licensing and permits, inadequately educated workforce and labour regulations. We should notice that even though tax rates were found to be a significant obstacle in Turkey, according to Figure 6, and up to some degree in Jordan and Egypt, overall they have a lower adverse effect on the firm performance, according to the remaining figures. The last part of the analysis refers to the misallocation using the covariance of the sales share and employment share based on the estimated TFP we employed in the earlier estimates. However, because of word limits, we present and discuss the results in the supplementary material.
Individual obstacles in BIC pooling firms in 7 countries
| Panel A: OLS | DV: Logarithm of value added | DV: Labour productivity | DV: Logarithm of TFP | Panel B: IV | DV: Logarithm of value added | DV: Labour productivity | DV: Logarithm of TFP |
|---|---|---|---|---|---|---|---|
| Business climate- access to finance and credit | −0.1484** (0.0624) | −0.1011*** (0.0264) | −0.0244* (0.0138) | Business climate- access to finance | −0.1822** (0.0841) | −0.3282* (0.1739) | −0.1382* (0.0734) |
| No. observations | 7,952 | 7,761 | 7,252 | No. observations | 7,894 | 7,555 | 7,084 |
| R-square | 0.3292 | 0.2683 | 0.0435 | Centered R-Square | 0.1843 | 0.0830 | 0.0227 |
| Weak identification test | 13.142 [0.000] | 10.800 [0.000] | 12.164 [0.000] | ||||
| Hansen J statistic | 12.443 [0.6131] | 23.490 [0.2012] | 20.022 [0.3192] | ||||
| Business climate- access to land | −0.0717*** (0.0244) | −0.0386 (0.0311) | −0.0169 (0.0155) | Business climate- access to land | −0.1007** (0.0316) | −0.1323 (0.3582) | −0.0578 (0.0831) |
| No. observations | 7,864 | 7,743 | 7,226 | No. observations | 7,720 | 7,533 | 7,031 |
| R-square | 0.3309 | 0.2680 | 0.0381 | Centered R-Square | 0.1800 | 0.0892 | 0.0264 |
| Weak identification test | 15.88 [0.000] | 6.525 [0.0042] | 8.965 [0.000] | ||||
| Hansen J statistic | 17.580 [0.2490] | 24.417 [0.1807] | 25.053 [0.1688] | ||||
| Business climate- business licensing and permits | −0.1059** (0.0227) | −0.1132** (0.0265) | −0.0581 (0.0452) | Business climate- business licensing and permits | −0.1416* (0.0774) | −0.1858*** (0.0288) | −0.1293 (0.1084) |
| No. observations | 7,924 | 7,816 | 7,488 | No. observations | 7,771 | 7,601 | 7,223 |
| R-square | 0.3241 | 0.2563 | 0.0426 | Centered R-Square | 0.1821 | 0.0537 | 0.0192 |
| Weak identification test | 10.425 [0.000] | 9.881 [0.000] | 9.234 [0.000] | ||||
| Hansen J statistic | 12.578 [0.6033] | 18.583 [0.3908] | 18.120 [0.4169] | ||||
| Business climate- corruption | −0.2082** (0.0213) | −0.2040** (0.0242) | −0.0235** (0.0121) | Business climate- corruption | −0.5254*** (0.1459) | 0.5678*** (0.1736) | −0.1168* (0.0643) |
| No. observations | 7,982 | 7,849 | 7,521 | No. observations | 7,793 | 7,637 | 7,259 |
| R-square | 0.5119 | 0.2647 | 0.0427 | Centered R-Square | 0.1623 | 0.1059 | 0.0328 |
| Weak identification test | 17.092 [0.000] | 11.934 [0.000] | 18.767 [0.000] | ||||
| Hansen J statistic | 19.411 [0.2479] | 22.953 [0.2149] | 19.086 [0.2642] | ||||
| Business climate- electricity | −0.1595*** (0.0220) | −0.0797*** (0.0260) | −0.0115 (0.0136) | Business climate- electricity | −0.1871** (0.0882) | −0.2196** (0.0959) | −0.1101*** (0.0183) |
| No. observations | 7,991 | 7,822 | 7,539 | No. observations | 7,787 | 7,615 | 7,264 |
| R-square | 0.3297 | 0.2618 | 0.0412 | Centered R-Square | 0.1792 | 0.0695 | 0.0345 |
| Weak identification test | 16.268 [0.000] | 16.602 [0.000] | 15.705 [0.000] | ||||
| Hansen J statistic | 24.738 [0.1845] | 24.887 [0.1718] | 21.135 [0.2733] |
| Panel A: OLS | DV: Logarithm of value added | DV Labour productivity | DV: Logarithm of TFP | Panel B: IV | DV: Logarithm of value added | DV: Labour productivity | DV: Logarithm of TFP |
|---|---|---|---|---|---|---|---|
| Business climate- inadequate education | −0.1343** (0.0217) | −0.0716*** (0.0259) | −0.0286** (0.0137) | Business climate- inadequate education | −0.1938* (0.1104) | −0.1786** (0.0862) | −0.0962* (0.0495) |
| No. observations | 7,984 | 7,802 | 7,584 | No. observations | 7,751 | 7,594 | 7,292 |
| R-square | 0.3229 | 0.2554 | 0.0427 | Centered R-Square | 0.1620 | 0.0113 | 0.0111 |
| Weak identification test | 7.444 [0.0025] | 7.726 [0.0022] | 6.835 [0.0035] | ||||
| Hansen J statistic | 19.221 [0.3573] | 17.264 [0.4687] | 16.620 [0.5105] | ||||
| Business climate- labour regulations | −0.1184*** (0.0222) | −0.0530** (0.0258) | −0.0205 (0.0139) | Business climate- labour regulations | −0.1660* (0.0903) | −0.2142*** (0.0269) | −0.1497 (0.1194) |
| No. observations | 7,957 | 7,807 | 7,532 | No. observations | 7,729 | 7,598 | 7,275 |
| R-square | 0.3214 | 0.2545 | 0.0426 | Centered R-Square | 0.1877 | 0.0344 | 0.0211 |
| Weak identification test | 11.430 [0.000] | 10.759 [0.000] | 10.505 [0.000] | ||||
| Hansen J statistic | 28.207 [0.1298] | 24.354 [0.1821] | 23.251 [0.2071] | ||||
| Business climate- political instability | −0.3152*** (0.0284) | −0.2835*** (0.0336) | −0.0416** (0.0181) | Business climate- political instability | −0.6485*** (0.1372) | −0.7732*** (0.1606) | −0.3450* (0.1859) |
| No. observations | 7,979 | 7,722 | 7,236 | No. observations | 7,736 | 7,492 | 7,024 |
| R-square | 0.3372 | 0.2712 | 0.0423 | Centered R-Square | 0.1881 | 0.0601 | 0.0331 |
| Weak identification test | 23.164 [0.000] | 23.125 [0.000] | 18.794 [0.000] | ||||
| Hansen J statistic | 14.001 [0.5986] | 20.224 [0.3104] | 17.355 [0.4629] | ||||
| Business climate- competition from the informal sector | −0.0444** (0.0221) | −0.0484* (0.0256) | −0.0289 (0.0240) | Business climate- competition from the informal sector | −0.0502* (0.0272) | −0.1463 (0.1183) | −0.1019 (0.0840) |
| No. observations | 7,986 | 7,726 | 7,434 | No. observations | 7,782 | 7,503 | 7,182 |
| R-square | 0.3327 | 0.2755 | 0.0428 | Centered R-Square | 0.1917 | 0.0940 | 0.0232 |
| Weak identification test | 18.728 [0.000] | 17.391 [0.000] | 16.370 [0.000] | ||||
| Hansen J statistic | 22.499 [0.2277] | 18.360 [0.4032] | 20.717 [0.2896] | ||||
| Business climate- tax rates | −0.0418* (0.0230) | −0.0294 (0.0261) | −0.0480*** (0.0131) | Business climate- tax rates | −0.1344 (0.0847) | −0.5091** (0.2540) | −0.0576** (0.0271) |
| No. observations | 7,960 | 7,835 | 7,571 | No. observations | 7,755 | 7,575 | 7,290 |
| R-square | 0.3223 | 0.2571 | 0.0433 | Centered R-Square | 0.1842 | 0.0602 | 0.0294 |
| Weak identification test | 12.464 [0.000] | 11.749 [0.000] | 12.746 [0.000] | ||||
| Hansen J statistic | 17.346 [0.4635] | 22.180 [0.2374] | 19.778 [0.3303] |
Note(s): Standard errors within brackets, p-values within the square brackets, ***, ** and * indicate significance respectively at the 1, 5 and 10% level
Overall, the results are consistent with the findings from previous studies (Amsden, 1989; Fajnzylber et al., 2009; Sen and Velde, 2009; Qureshi and Te Velde, 2013; Hosny, 2017; Arayssi et al., 2019; Karahasan and Bilgel, 2020; Ozdamar et al., 2020; Abdo and Fakih, 2022). Our results show that the obstacles in business and investment climate can negatively affect the firm performance, which is also found in the previous studies. In particular, Hosny (2017), Arayssi et al. (2019) and Ozdamar et al. (2020) show that political stability is a significant determinant of firm performance, while Karahasan and Bilgel (2020) found obstacles related to access to finance reduce firm performance by 2.3–4.4% in eight MENA region countries and Turkey. These findings confirm the results of our study where we employ an index of business and investment climate that includes various obstacles, such as access to finance, political instability, corruption and electricity infrastructure among others.
About the firm characteristics, our findings are consistent with the studies by Ozdamar et al. (2020) and Abdo and Fakih (2022) that found female ownership, exporting activities, international certification of quality assurance and if are part of another establishment, are positively related to firm performance in MENA region countries and Turkey. Similarly, our results confirm the findings by Sen and Velde (2009), who found that institutional quality measured by the rule of law, executive constraints, the degree of corruption and the quality of the bureaucracy are significant determinants of economic growth in 19 sub-Saharan African countries. Furthermore, their results show countries that have improved the quality of state–business relations and reduced the obstacles in the business and investment climate have experienced higher economic growth.
5. Discussion and conclusion
Using data from the World Bank Enterprise Surveys from 2006 to 2016, this study examined the effect of obstacles in business and investment climate and the challenges associated with them, on the firm performance in Turkey and a sample of MENA countries. It is critical to conduct further research, evaluate the effectiveness of the business climate and introduce related policies and reforms. The findings have various policy implications in designing programmes aimed at reducing the obstacles in state–business relations and investment climate and promoting firm performance, productivity and job creation. The results show that firm performance is hindered, not only by firm characteristics and firm entry barriers, which are proxied by the firm age and size in our estimates but also by the costs, challenges and obstacles in the investment climate, including corruption, political instability, electricity supply and tax rates. Therefore, policies could include programmes that reduce the corruption and steps required to register and operate a business. Furthermore, the main findings may offer useful insights, as the state and policymakers in these countries should provide security and political stability, and fight corruption, especially in regions that were the most affected, reducing inequalities in unemployment and wealth.
Policies should provide a reliable electricity and transportation infrastructure, access to finance, especially for the young and small firms, and incentives in terms of favourable tax credit schemes to firms that are highly productive, such as those employing high-skilled workers and technological advances, and firms that use energy-efficient resources. Diversification requires increased access to capital, hence, the governments in MENA countries should take initiatives to improve access to finance and credit, allowing small-medium enterprises (SMEs) to obtain credit using collateral instead of traditional fixed assets.
The results show that obstacles in the business and investment climate are associated with substantial resources reallocation from more productive to less productive firms, which may further lead to significant losses in productivity and value-added. Obstacles such as corruption, tax rates, political instability, poor electricity and transportation network may result in a greater share of firms becoming informal or remaining informal or semi-informal, implying that the state will be unable to collect taxes that can be further used to invest in infrastructure and basic but important inputs of development, such as the health care and education system. Long-standing structural issues that stifle development and prevent economic diversification must be urgently addressed. Policies should overcome structural constraints, increase public investment performance, step up efforts to improve education and health outcomes and strengthen governance, transparency and anti-corruption efforts.
Another important aspect is the frequency of the WBES and their consolidation with the Ease of Doing Business (EODB) report that will allow the analysis to account for both micro-level and country-level factors. The Ease of Doing Business measures comprise 41 indicators and higher values imply better regulatory performance and the ease for doing measures reflect important factors such as the length of firm start-up procedures and the cost of doing business (Fonseca et al., 2001). In our empirical analysis, we have considered firm-level characteristics, and their role on the firm performance, such as firm size and age and information about the ownership. Nevertheless, there are also important unobserved factors at the country-level that may serve as confounders affecting both the business and investment climate functions and the firm performance outcomes. More specifically, the doing-business report comprises two aggregate measures: the ease of doing business ranking that compares the differences and performance between economics, and the ease of doing business score, which compares economies in terms of regulatory best practices, displaying the absolute distance between the best regulatory performance scores on each Doing Business metric.
Along with the WEBS and EODB consolidation, we recommend the methodology employed in this study in future research applications implementing a structural review of successful business climate interventions and related challenges in low and middle-income countries, which can be used as a guide for economic policymaking. Even though this can be a challenging task, it needs to be done in order to comprehend how reforms and related industrial policies may work best.
However, our study is not without major drawbacks. In particular, even though we have attempted to reduce the endogeneity issue by implementing the 2SLS method, our sample of study and the datasets used rely on repeated cross-sectional surveys and not on panel data. This may reduce the problem of attrition and non-response; however, the data sets do not allow us to follow the same firms across the time and to investigate the dynamics of business climate on their performance. The second limitation is that 2SLS can identify only a local average treatment effect (LATE). The third limitation is that the sample of firms is rather low, compared with other firm surveys. Also, the WBES include only firms operating in the manufacturing and services sectors but not in the agriculture sector. However, the main reason for using the WBES lies in the information recorded about the perception in business and investment climate and the obstacles in state-business relations, which is the main objective of this study. Fourth, we have included a set of potential factors, but other unobserved determinants of firm performance are not included. While we have attempted to investigate the importance of major obstacles individually in a pool of countries, future research studies may further explore the role of each obstacle separately and their impact on firm performance employing firm-level data for each country. Thus, another limitation is that we have aggregated in a business and investment climate index, the obstacles in state–business relations. This implies that we have not investigated or disentangled the impact of each obstacle that may provide insights into policymaking.
The authors thank the editor and two anonymous reviewers for their valuable suggestions and constructive comments that greatly contributed to the improvement of the quality of this paper. Any remaining errors or omissions remain the responsibility of the authors.
This paper was presented at the Workshop on “Structural Change, Resource Misallocation and Growth Dynamics in the MENA Region” at Luxor, Egypt, on 28 February-1 March 2018, funded and organised by ERF. The authors thank the participants of the workshop, as well as Dr Jorge Rodriguez Meza, Program Manager of the Enterprise Analysis Unit at World Bank and Dr David Francis analyst at the Enterprise Analysis Unit for their valuable comments.
Funding: The authors gratefully acknowledge financial support from the Economic Research Forum (ERF) and the grant received under the “Structural Change, Resource Misallocation and Growth Dynamics in the MENA Region” programme call. We would like to notice that an earlier version published as a discussion working paper from the funded institution the Economic Research Forum (ERF), which is acknowledged in the manuscript and it is available at http://erf.org.eg/publications/the-nexus-between-business-investment-climate-and-firm-performance-in-the-middle-east-and-north-africa-mena-region. This study is an update of the working paper.
Note
Enterprise Surveys (http://www.enterprisesurveys.org), The World Bank.
References
Further reading
Supplementary Material
This article’s supplementary material is available online.
