The New Bridgewater Bridge project is the largest transport infrastructure project in Tasmania’s history, which involves the construction of a new bridge over the River Derwent, and other associated road infrastructures. As part of the project requirements, a minimum of three sacrificial test piles with a minimum diameter of 1500 mm (concrete outer diameter) at representative locations were designed and constructed to verify the new River Derwent Bridge pile foundation design using Osterberg cell (O-Cell) test method. This paper discusses the basis of design, geotechnical issues, and challenges encountered in design and construction of test piles; then reviews testing performance and presents the interpretation of test data; and some interesting engineering recommendations and conclusions that have been used to expedite the approval for the installation of production piles. With this paper, the authors wish to provide some meaningful technical insights for future design and construction of similar deep foundations.
Notation
- AHD
Australian height datum
- as, bs
constants
- EA
equivalent sectional stiffness of pile
- Ev
vertical Young’s modulus of mass
- fs
shaft skin friction
- j
mass factor to discontinuity spacing in the rock mass
- M
slope gradient of Chin’s plot (Chin, 1970)
- Mr
ratio between deformation modulus and unconfined compressive strength of rock substance
- N60
corrected SPTN values
- P
test load
- Rd,ug
design ultimate geotechnical strength of pile
- su
undrained shear strength
- α
reduction factor for ultimate shaft skin friction of ‘fine grained soils’
- β
reduction factor for ultimate shaft skin friction of ‘granular soils’
- △
pile displacement
- ϕg
geotechnical strength reduction factor
Introduction
The New Bridgewater Bridge (NBB) project is the largest transport infrastructure project in Tasmania’s history which involves the construction of a new bridge over the River Derwent, new road interchanges, an underpass, a new single-span overpass and other associated road infrastructures. The new bridge with 22 spans over the River Derwent is being constructed to replace the existing River Derwent causeway at the time of preparing this paper. The existing causeway consists of a causeway embankment (built in the first half of the 1800s) and a steel-truss vertical lift bridge (built in the 1940s).
As part of project requirements, a minimum three sacrificial test piles with a minimum diameter of 1500 mm (concrete outer diameter (OD)) at representative locations were initially proposed and constructed to verify the new River Derwent Bridge pile foundation design using Osterberg cell (O-Cell) test method. Due to uncertain results obtained from one of the initially proposed test piles located near Pier 8 Right Pile (P8R), an additional test pile located ≈10 m northeast of Pier 9 Right (P9R) was then proposed. The O-Cell test is a specialised pile load test method used to evaluate the axial capacity of deep foundations, such as bored piles. Instead of applying load from the pile head, this test uses a hydraulic jack system embedded within the pile to generate forces in two directions (upward and downward).
Pile load testing using O-Cell is not something new to the design and construction of bridge deep foundations; however, such O-Cell tests have not been often reported in Australia. This is likely due to the high cost and time demand of the test, which requires the design and construction of a test pile, followed by validation of the test results. Therefore, typically only large-scale projects with sufficient budget and time can afford to perform such expensive and difficult testing. Pile load tests using O-Cell was successfully undertaken in Gateway Upgrade project in Brisbane (Day et al., 2009), which was one of the earliest if not the first O-Cell pile load tests performed in Australia at that time. This paper commences with a summary of the overall new bridge layout and foundation as well as geological conditions along the new bridge alignment, then discusses the basis of design, geotechnical issues, and challenges encountered in the design and construction of test piles; subsequently reviews testing performance and perform interpretation of test data; and finally presents some interesting engineering recommendations and conclusions that have been used to accelerate approval of installation of production piles. With this paper, the authors wish to provide some meaningful technical insights for the future design and construction of similar deep foundations.
New Bridgewater Bridge layout and foundation
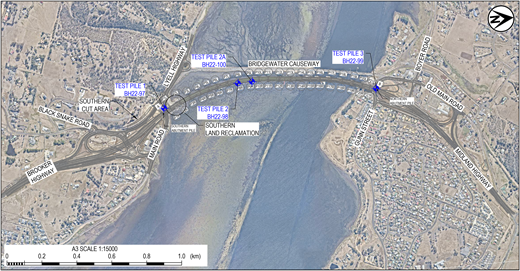
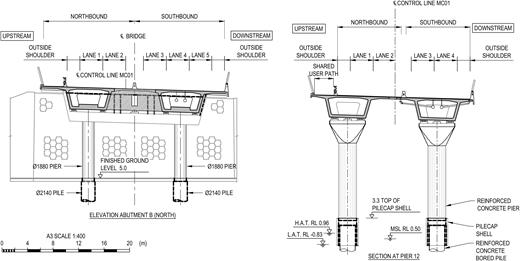
The NBB is ≈1.28 km long spanning the River Derwent from the Main Road/Brooker Highway on the southern side to Gunn Street on the northern side. Figure 1 presents the proposed alignment and test pile locations of the NBB. Figure 2 presents a typical arrangement of the abutment and pier.
The new bridge comprises a total of 21 bridge piers and 2 abutment piers with each span varying from ≈44 to 64 m in length. The total width of the bridge deck ranges from 25.0 to 29.2 m with a maximum of five traffic lanes. A precast single-cell box girder structure supporting each carriageway is supported on a 2.8 m dia. single pier connected to a mono bored pile socketed into very variably weathered rock with the following sizes: (1) Abutment Pier A (South) and Pier B (North) – 2100 mm dia. concrete bored piles and (2) Piers 1 to 21 – 2380 mm dia. concrete bored piles. Both box girder structures will be stitched together along the road centre alignment once the bridge structure is completed. The centre to centre spacing of the piles within each individual pier is ≈14 m. Within the River Derwent, two distinct areas are noted. The southern portion, along which the existing causeway stretches, is largely shallow mudflats. While the northern portion, where the existing Bridgewater steel bridge spans, is a deeper channel (as apparent in Figure 1).
Foundation piles supporting the bridge superstructures are required to be designed to meet both ultimate limit state (ULS) and serviceability limit state (SLS) conditions described in AS5100.3-2017 (Council of Standards Australia, 2017), AS2159-2009 (Council of Standards Australia, 2009), and the project scope and technical requirements (PSTR) (Department of State Growth, Tasmania, 2021). The pile lengths and rock socket conditions vary depending upon the locations of the abutment and pier, underlying ground conditions and loading conditions. The length of foundation piles below the top of the pile varies from 12.5 m with the deepest pile length being 86.5 m. The maximum axial loads vary from 16.05 MN to 32.50 MN under SLS conditions and from 21.50 MN to 44.20 MN under ULS conditions, respectively. This paper focused on the test piles whereas the design and construction details of the new bridge production piles will be presented in a separate paper(s) to be published in the future.
Geological settings and overview of ground conditions
The River Derwent channel bed, along which the Bridgewater bridge predominantly comprised of recently deposited (Holocene) estuarine muds, of silts/clay layers with potential thin layers of sandy horizons (in the channel and/or on tidal mudflats), extending up to 30 m below the ground level, especially near the South Abutment. Below the estuarine sediments, ice age (quaternary) sediments overlie (only partially as suggested by historical site investigation data) the existing bedrock, and predominantly comprise dense to very dense coarse-grained materials (gravels and cobbles). These deposits can extend up to 10 m or more below the overlying soft silts/clays.
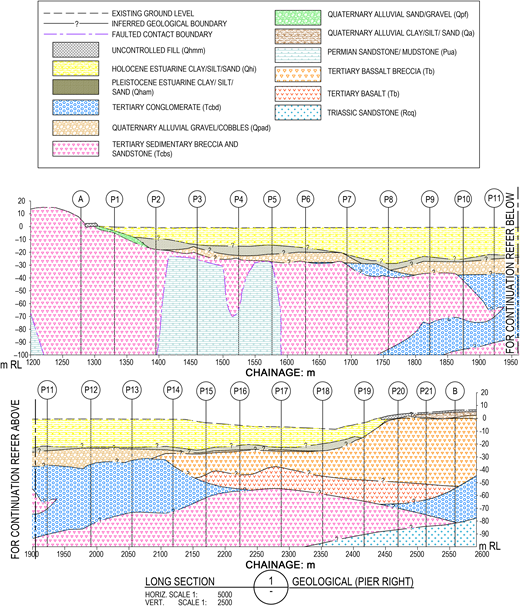
Tertiary Age bedrock deposits comprise four main units including basalt breccia and basalt flows on the north riverbank and extending under the navigation channel, highly weathered conglomerates (‘cemented gravels’) in buried channels in the riverbed and on the southern approaches in the area of Black Snake Rivulet. Low strength landslide breccia is identified on the south riverbank within the Granton Fault zone. Sedimentary bedrock is expected at varying depths, between 5 and 30 m, with Triassic rocks expected to be competent for rock sockets and end-bearing piles. Triassic sedimentary rocks consist of sandstones, mudstones, and breccias predominantly varying from very low to low rock strength and varying degrees of weathering and jointing. A fault zone (the Granton Fault) runs oblique to the bridge alignment and is likely to underlie the southern approach, southern abutment, and extend into the river channel. The Tertiary landslide breccia is currently interpreted to be sitting within this zone. A simplified illustration of the subsurface geology and bridge foundations is shown on Figure 3.
Design basis of test piles
As discussed above, a total of three and an additional one sacrificial test piles with a diameter of 1500 mm (concrete OD) have been designed and installed at representative locations for the new River Derwent Bridge. Each test pile was instrumented and subjected to a single-level bi-directional O-Cell test. The O-Cell test aims to inform pile responses under axial load application. The responses include pile deformation behaviour under the applied incremental loading for the characterisation of pile side shear strength (i.e., shaft skin friction) and end bearing. The construction method employed for the test piles would also inform the appropriate installation parameters, such as casing driving depth, shaft roughness, base cleanliness, and concrete quality.
As part of the project requirements, the test piles were designed based on the PSTR (i.e., Appendix 25 – Requirements for Structures) (Department of State Growth, Tasmania, 2021), Part 3 of AS5100.3-2017 (i.e., Foundation and Soil-Supporting Structures of Bridge Design) (Council of Standards Australia, 2017), and AS2159-2009 (i.e., Piling – Design and Installation) (Council of Standards Australia, 2009). In addition to the minimum number of test piles requested, the contract PSTR 25.5.1 (vi) specified the following additional key technical requirements for River Derwent test piles as presented in Table 1.
Design of test piles
Test pile locations and design assumptions
Due to site access constraints at the early stage of the piling programme, there were not many options that could be considered in planning test pile locations. One viable option was to divide NBB bridge alignment into three groups geographically and geologically and assign one test pile for each group. Table 2 below summarises the proposed test pile locations along the bridge alignment. The proposed test pile locations have also been marked up on Figure 1 for a better understanding.
A deep borehole was drilled to ≈20 m below the proposed test pile toe level at each test pile location with continuous soil samples and rock core samples taken and selected for laboratory tests, along with in situ tests performed at representative depths using pressure metre apparatus. The following key assumptions were considered during the design of the O-Cell test piles in addition to the key technical requirements presented in Table 1, that is, (1) for Test Pile #2A, a localised reaming between RL – 77.90 m and RL – 80.50 m, forming 1620 mm OD to be carried out to allow for an improved concrete flow within the O-Cell section as a lesson learnt from Test Pile #2 where questionable results were obtained potentially due to ineffective concrete flow within the lower O-Cell section and (2) the construction method of the test piles to be representative of the permanent production piles which include sacrificial steel casing (with an internal diameter (ID) of 1500 mm) driven to the top of rock, drilling of weathered and fractured rocks, replication of base cleaning method, socket, and base inspection and finally reinforcement cage installation and concrete placement.
Total test pile loads and test pile toe levels
The nominated total test loads as per PSTR (i.e., 50% acting upward and 50% acting downward) presented in Table 3 were scaled down to reflect a smaller 1.5 m test pile diameter to ensure adequate mobilisation of the side shear and end bearing of the rock socket for each representative group of production piles as presented in Table 2. Test pile toe levels presented in Table 4 were final as-built levels that were developed based on the following considerations/limitations: (1) the range of pile lengths for representative group of production piles; (2) the range of ground conditions at representative group of production pile locations; (3) a greater anticipated ultimate geotechnical strength than the nominated test load to meet PSTR test load requirements; (4) a reduction factor of 80% to be applied to end bearing capacity estimation to allow for potentially inadequate base cleanliness during installation; (5) a reduction factor of 80% applied to the estimated upper shaft resistance to reflect the tensile behaviour due to upward pile movement above O-Cells; (6) for Test Pile #1 and #3, the maximum drilling depth was limited to ≈RL – 75 m AHD by a piling rig that was available at an early construction stage; (7) for Test Pile #2 and #2A, a maximum drilling depth to ≈RL – 87 m AHD achievable by a larger piling rig that was available at a later construction stage; and (8) an early termination of drilling at Test Pile #2A location due to slow drilling advancement in a localised section of high strength conglomerate unit and limited time window available for pouring concrete prior to 2023 Christmas break.
Design process and approach
Test pile design was developed based on following design process and design approach which are the same adopted for design of production piles.
Development of ground model and derivation of strength profile at each test pile location based on review and interpretations of respective borehole logs, pressuremetre test data, rock core samples, and laboratory test results by highly experienced designers. A holistic approach with an overall view and consideration of global rock mass behaviour for rock strength and stiffness assessment rather than directly and indiscriminately applying factual logs and test data without adequately examining and eliminating unreliable data.
Research and selection of adequate methods for deriving shaft skin friction and end bearing resistance of soils and rocks.
The α method with a reduction factor of α as per Figures 16–14 of Bowles (1997) was adopted for deriving ultimate shaft skin friction of ‘fine grained soils’.
The β method with reduction factor of β as per Section of 16-9.3 of Bowles (1997) was adopted for deriving ultimate shaft skin friction of ‘granular soils’.
The equation of asUCSbs (MPa) as per Zhang (1999) was adopted for deriving ultimate shaft skin friction for ‘rocks’, where as = 0.2–0.3; bs = 0.5; and UCS is ‘uniaxial compressive strength’ of rock. Note that the value as is dependent upon socket roughness and may be higher than the range proposed (i.e., 0.22–0.67). A conservative assumption of 0.20–0.30 was adopted for this design to take into consideration of potential softening effects attributed to stress relaxation over a relatively long period of time when the support to the shaft was significantly reduced during shaft excavation before concrete pouring can take place. In addition, as part of the design strategy, conservative values were adopted to allow the departure from the requirement of shaft roughness physical validation during construction, given the difficulty of shaft inspection under polymer fluid.
A conservative equation of 4.8 UCS0.5 was adopted to assess the ultimate end bearing pressure for highly weathered or better, rock units. This equation was simplified based on Zhang and Einstein (1998) to account for potential softening effects that may occur below the pile toe.
Research and selection of adequate methods for deriving Young’s modulus of soils and rocks.
The equation of j MrUCS (MPa) as per Tomlinson (2001) was adopted to assess the vertical rock mass modulus of rock; where j is the mass factor related to discontinuity spacing in the rock mass; Mr is the ratio between deformation modulus and UCS of rock, which is dependent upon the rock type and origin.
An empirical relationship of 200 su (kPa) was adopted to assess vertical mass Young’s modulus of fine-grained soils, where su is an undrained shear strength. However, this formula should not be used and was not used for soils loaded beyond the pre-consolidation pressure.
Empirical relationships of 1.0 N60 (MPa) and 1.6 N60 (MPa) were adopted to assess vertical mass Young’s modulus of coarse-grained soils for loose to medium dense soils and dense to very dense soils, respectively, where N60 is corrected SPT-N value.
Position of O-Cell for each test pile was assessed based on additional site investigation data obtained at each test pile location and assigned based on a balance achieved between the sum of estimated upward design ultimate geotechnical strength including self-weight of the pile (i.e., upward shaft skin friction plus self-weight of pile) and the sum of estimated downward design ultimate geotechnical strength excluding self-weight of the pile (i.e., downward shaft skin friction plus base resistance minus self-weight of pile).
It shall be noted that the O-Cell position of Test Pile #2A was initially assessed and assigned based on the geotechnical conditions encountered in BH22-100, and the O-Cell was then fabricated accordingly. However, the design of Test Pile #2A had to be re-visited with consideration of weaker rocks encountered within the upper section of the test pile during Test Pile #2A excavation and early termination of drilling at Test Pile #2A due to slow drilling within the lower section of the test pile. Due to the time constraint, the contractor and designer jointly decided to maintain the original O-Cell position despite changes in ground conditions and pile toe. However, this decision led to an imbalance in the test setup, where the potential upward side shear resistance became less than the combined downward side shear and base resistance. In addition, it was also noted that the final O-Cell level was affected by a slight floating of the reinforcement cage during the concrete placement. As a result of this resistance imbalance, the test could not fully mobilise the ultimate capacity of the lower pile section because the upper section reached its ultimate capacity first during loading process. A summary of the as-built test pile toe levels, test loads, the estimated geotechnical resistances and the position of the single-level O-Cells are presented in Table 4.
Grade 55 MPa concrete and grade 500 N reinforcement were adopted consistent with the concrete specification for permanent piles. In the reinforcement design, a ULS load factor of 1.1 was applied to avoid premature structural failure during testing. Hence the test pile was designed to resist 55 MN ULS axial compression at the O-Cell location and decreased linearly to zero at the two ends. Additional vertical reinforcement was specified for the portion near the O-Cell to provide adequate axial capacity.
O-Cell and instrumentation
Five ϕ 510 mm × 381 mm thick O-Cell units were proposed with a total combined capacity greater than 50 MN in each direction. Individual O-Cell was then welded to two ϕ 1295 mm × 50 mm thick mild steel plates (i.e., one at the top of O-Cells and another one at the bottom) at equal spacing to transfer load from O-Cells to the test pile in both upward and downward directions.
Four numbers of traditional telltale casings (13 mm dia.) and rod extensometers extending from the top of the upper plate to the pile head were used to measure the pile compression above the O-Cells assembly. Four numbers of 225 mm stroke linear vibrating wire displacement transducers (LVWDTs) were fixed between the top and bottom steel bearing plates of the O-Cell assembly to directly measure the O-Cell expansion. The LVWDTs were fitted with expansion sleeves to allow for upward and downward movements. Two numbers of traditional telltale casing (13 mm dia.) and rod extensometers fixed at the pile toe were used to measure the pile toe displacement. The readings from vibrating wire strain gauges were used to make an assessment of the load distribution along the pile above and below the O-Cell assembly. Four number of equidistant strain gauges were fixed at each nominated specified level. The elevations of strain gauges were proposed at levels where there is a change in material strength and/or geological unit, as well as the steel casing toe level.
Test pile installation
This section describes a few key aspects of test pile installation. Conventional rotary drilling method using BG45 rig was adopted in test pile shaft excavation identical to the method adopted for installation of production piles. Prior to pile drilling, a 25 mm thick steel casing with ϕ 1620 mm OD and inward casing shoe was installed in very soft to firm estuarine deposits (i.e., silt/silty clay/sand) and medium dense to very dense sandy gravel/gravelly cobble through driving and drilling process to prevent the shaft from potential cave-in and collapse. Steel casing was halted ≈1–2 m into rock.
Biodegradable polymer was used as drilling support fluid. Based on the ground conditions encountered, polymer stabilisation method was selected to mitigate the risk of bore collapse within extremely weathered tertiary breccia, conglomerate, and sedimentary siltstone/sandstone/mudstone. The effect of drilling support fluid on the pile side friction has been subjected to various debates in the piling industry due to the reputation of traditional bentonite fluid. Various studies conducted suggest that the use of polymer has very little impact on the pile side friction as compared with bentonite fluid (Brown, 2002; Lam et al., 2015).
During drilling, the arisings were inspected by an experienced geotechnical site engineer and were compared with relevant borehole logs and the design assumptions. Where required, the geotechnical designer promptly revisit the pile design. If any significant and obvious discrepancies were noted, a remediation strategy and action was developed and communicated to the site crew. Adjustments were implemented based on site observations include the pile ultimate geotechnical strength.
Upon completion of pile drilling, shaft area profile evaluator (SHAPE) testing was performed to assess the eccentricity and verticality of the newly excavated shaft. SHAPE is an electronic device used to measure sidewall distances for drilled foundations under fluid. The system generates ultrasonic pulses transmitted through the drilling medium and measures the reflection time from the sidewall. Based on a measured wave speed in the drilling medium, the system calculates the distance from each sensor to the sidewall. After SHAPE testing, the initial cleaning was performed firstly using a clean bucket and subsequently using an agitator pump. During the pumping, an inspection of polymer fluid circulation into a tank was carried out. Pumping terminated once the polymer fluid return was deemed satisfactory by the site crew based on the on-site polymer fluid test results, observations of colour, and fine content from the returned fluid. After pumping, shaft quantitative inspection device (SQUID) was used to assess the pile base cleanliness. SQUID is an electronic device used to measures force and displacement through debris and bearing layer at the base of a drilled foundation. The system provides quantitative assessments from displacement and penetrometer pressure measurements. Immediately after SQUID testing, the base was also verified using weighted sounding tape as another method to estimate the thickness of any sediments remained at the pile base. The results from both the SQUID testing and the weighted sounding tape dipping were found to be comparable for all test piles. Based on the SHAPE testing, SQUID testing and dipping results, all test pile shafts met the specifications in terms of verticality (i.e., <1%) and base cleanliness (i.e., <10–20 mm). However, the SQUID testing was not performed for installation of production piles to reduce unsupported time to the open shaft. Only weighted sounding tape was then used as a tool to dip and check thickness of sediment at the base for all production piles.
O-Cell testing, field measurements, and test data
O-Cell load test commenced a minimum of 21 days after concreting for each test pile with concrete strength of cube samples tested at the 7th day, 14th day, and 20th or 21st day, respectively, to confirm the design strength of 55 MPa can be achieved. Pile integrity was validated for the upper part of each test pile using low-strain pile integrity testing (PIT) method without any anomalies detected. Due to the limitation of the PIT method, additional pile integrity testing was also carried out using cross-hole sonic logging method to validate pile integrity for the full length of each test pile.
A specific O-Cell loading programme with acceptance criteria in accordance with Table A1 of AS2159-2009 and Table 8.4.3.1 of AS2159 was developed for each test pile. The test load was applied incrementally at equal magnitude and rate in both upward and downward directions using hydraulic jacking system. A test normally lasted over a long period of time due to many loading stages (i.e., three cycles for Test Pile #1, #2, and #3 and two cycles for Test Pile #2A) and steps. The test would only cease if the displacement exceeded the O-Cell expansion limit (i.e., 225 mm for the units used in this project site) and/or if the test reached a failure point (i.e., typically occurred when the hydraulic jacking system as unable to sustain the applied load as a constant over a required duration). Under this programme, pile performances under 50% of design serviceability load and 50% of design action effect (i.e., ultimate structural load), respectively, plus self-weight of upper section of test pile were examined and validated against design for both upward and downward directions. For some of test piles, 100% design serviceability load and 100% of design action effect were applied to both directions to replace 50% conservatively. It was always the designer’s desire to achieve a final test load that would exceed the required test load as per project requirements and the estimated ultimate geotechnical strength of the test pile as well.
All field measurements were taken automatically at 60 s intervals during testing. Pile top displacement was monitored using a pair of automated digital survey levels from an average distance of 7.5 m stationed at the existing ground for Test Piles #1 and #3 and at floating barge for Test Piles #2 and #2A (noted the tide movement was taken separately and later used to correct the pile top movement), respectively. As discussed above, the upper compression and the pile toe displacement were measured using 6 mm dia. telltale rods positioned inside six pre-installed casings and monitored by six corresponding LVWDTs attached to the top of the pile, respectively, that is, four for the upper compression and another two for pile toe displacement. Expansion of the O-Cell assembly was measured using the four LVWDTs attached to the two steel plates.
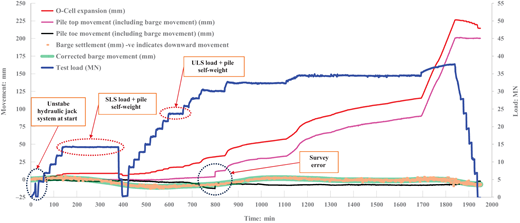
Due to limited space, this paper presents and discusses only a portion of the test results. Figure 4 presents typical raw test data collected from Test Pile #2A. Based on the data, the maximum tested load of 37.73 MN was found to exceed the nominated test load of 30.375 MN, and the estimated ultimate geotechnical strengths of 30.250 MN (upward, including pile self-weight) and 36.688 MN (downward, excluding pile self-weight), respectively. The O-Cell expansions for all test piles were recorded less than 10 mm under SLS loading and less than 20 mm under ULS loading, respectively, except for Test Pile #2, where an expansion of 13.6 mm was recorded under SLS loading. The O-Cell expansion represents the combined upper pile movement (upward) and the lower pile movement (downward) at O-Cell level where the test load is applied. This implies satisfactory performance of all test piles with the measured O-Cell expansions matching well with the design predictions. Tables 5 and 6 presents key test results for each test pile. The data presented, leads to the following findings: (1) Test Pile #2 was unable to meet PSTR requirements due to the reasons outlined in Section 5. Based on the rest results presented in Figure 4 and Tables 5 and 6, Test Piles #1, #3, and #2A were successfully completed, meeting project specifications and design expectations for ultimate geotechnical strength and load–settlement performance.
Test data interpretation
Due to limited space, this section presents interpretation on shaft skin friction, end bearing capacity, and load-settlement performance for Test Pile #2A only. As described in the previous Section 5, Test Pile #2A was embedded into a sequence of estuarine clay/silt, quaternary alluvial gravel/cobbles, tertiary sedimentary breccia, siltstone, and sandstone, and finally socketed into tertiary conglomerate with steel casing terminated at ≈43 m in depth below the existing seabed level. Tables 7 and 8 present summaries of geotechnical models and associated design parameters for the upper pile (i.e., the section above the O-Cell) and the lower pile (i.e., the section below the O-Cell), respectively.
The geotechnical models and associated design parameters as presented in Tables 7 and 8 were assessed and developed based on borehole logs of BH22-100, pile drilling records, laboratory, and in situ test results. Laboratory and in situ test results included point load index test results, UCS results and pressuremetre test results. Based on Tables 7 and 8, the ground conditions at the test pile location were found to be representative of those for production piles from Pier 6 to Pier 13 (refer to Tables 7 and 8). Within the socketed depth of the test pile, the encountered weak rocks of tertiary sedimentary breccia and sandstone were found to be extremely weathered to highly weathered with very low to low strength as well as mixed with soil like mixtures. The encountered tertiary conglomerate was found to be highly weathered to slightly weathered with low to high, to very high strength. It is particularly meaningful to install and perform a test pile successfully within both tertiary sedimentary breccia and tertiary conglomerate. This is because there has been very little information related to shaft skin frictions for both tertiary sedimentary breccia and tertiary conglomerate in available published references. Furthermore, this test pile has also validated the frictions of estuarine clay/silt, quaternary alluvial gravel/cobbles, and extremely weathered, clay like breccia against steel casing. The impact on shaft skin friction of the extremely weathered, clay like breccia with and without steel casing was assessed using measured strains from specifically installed strain gauges.
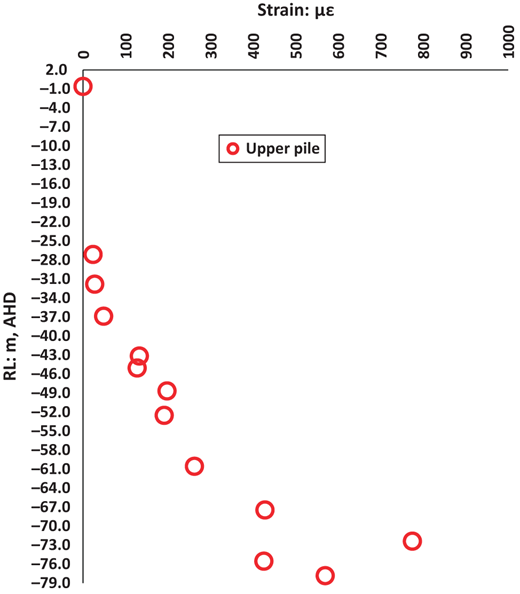
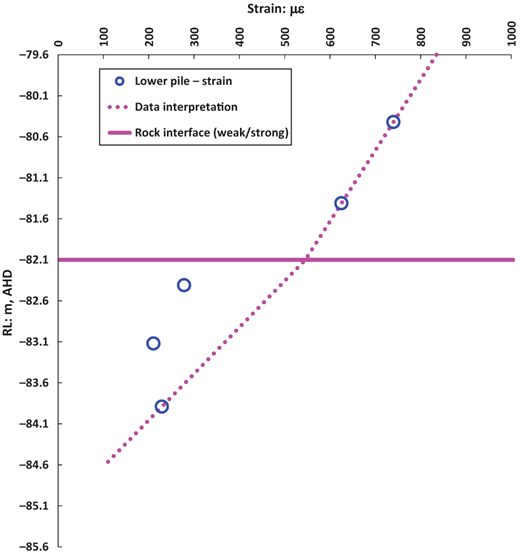
Strain gauges were installed at seventeen different levels with four gauges at each level to capture changes in ground conditions, sectional variations, presence of O-Cell, and casing installation. The measured strains under maximum sustained tested loads of 34.51 and 37.73 MN were plotted in Figure 5 (upper pile) and Figure 6 (lower pile), respectively. The term ‘sustained tested load’ denotes a constant load maintained until the rate of pile movement is less than 0.5 mm per 15 min, commencing 5 min after any load increment applied, but in no case less than the minimum specified holding time as per AS2159.
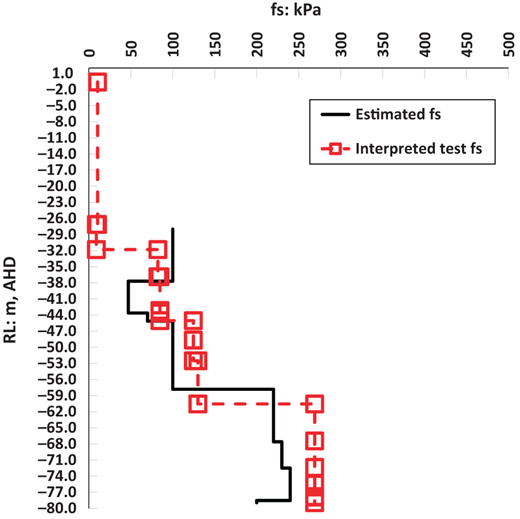
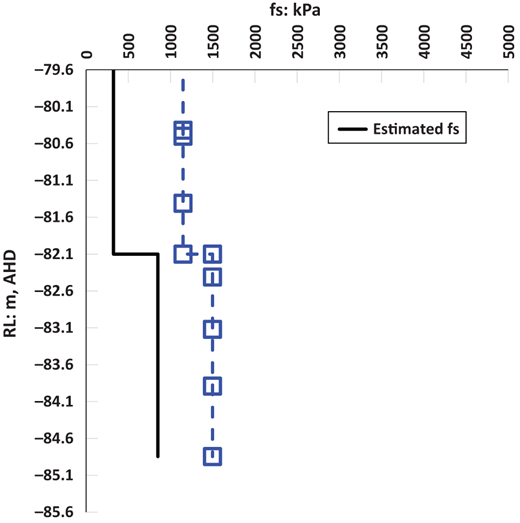
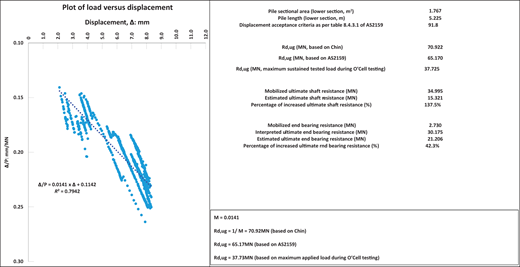
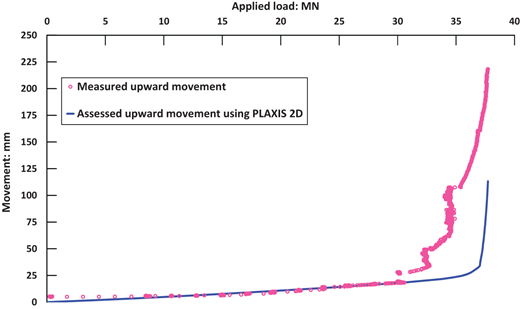
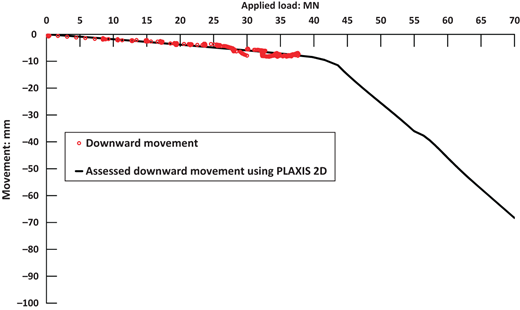
The data presented in Figures 5 and 6 was used to interpret shaft skin frictions which were presented in Figures 7 and 8. Figure 9 presents assessment results of load–settlement using Chin’s method, from which ultimate end bearing pressure for Test Pile #2A was derived, given insufficient downward load to induce lower pile failure. Figure 10 (upper pile) and Figure 11 (lower pile) present comparisons between the measured load-settlement plots and the design estimates using Finite Element Software PLAXIS.
From Figures 5 and 6, the measured average strains are found to decrease generally with the length of the upper pile and the lower pile which reflect decreases in the upward loading and the downward loading taken up by mobilised shaft resistances, respectively. It is noted abnormal strains were recorded at certain levels where the strains increased with the length rather than decreased. There are many factors that might have caused abnormal readings from respective gauges such as local concrete quality and strength, and so on.
In interpreting shaft skin frictions using measured strains, several factors were considered: the pile’s equivalent sectional stiffness (EA), concrete compressive strength, additional stiffness from steel casing, localised widened sectional area due to reaming effect, and the load–displacement of pile. A trial-and-error approach was adopted to assess and inform the most probable shaft friction distributions that accurately reflected the natural ground conditions.
From Figures 7 and 8, the interpreted shaft skin frictions are found to be generally greater than the estimated values. However, within quaternary alluvial gravels/cobbles, the interpreted shaft skin frictions ranging from 9 kPa to 84 kPa are lower than the estimated shaft friction of 100 kPa. The reduction was likely attributed to the steel casing installation (drive/drill cycle), where drilling disturbance caused gravels/cobbles to fall off, reducing effective contact areas. In the completely to extremely weathered breccia (clay like) with consistency ranging from stiff to hard (with the presence of localised medium strength breccia rock and drilling core loss sections), no significant impact from steel casing installation was observed.
The layer immediately below the completely weathered breccia (clay like) consists of thick clay (very stiff to hard) with core loss sections and localised highly weathered sandstone (medium strength). The shaft resistance was interpreted to be 124–130 kPa, slightly higher than the estimated value of 100 kPa.
Immediately above the O-Cell, a thick layer of extremely to highly weathered, very low to low strength (with localised medium strength) sandstone exhibited an interpreted shaft friction of 269 kPa, slightly higher than the estimated value of 240 kPa.
The above observations imply that the anticipated softening effect on weak layers caused by less supported shaft conditions (i.e., supported only by polymer fluid), stress relaxation, and potential disturbance from frequent drilling and cleaning operations over a period longer than 6–7 days before concrete pouring was less severe than expected.
The shaft skin frictions within highly weathered, low strength conglomerate layer and slightly weathered, high to very high strength conglomerate layer below the O-Cell level were interpreted to be 1148 and 1498 kPa, respectively. These results exceeded the estimated values by 253% and 76% for the same weak and strong conglomerates, respectively. This implies that the back calculated shaft friction resistance coefficient as values could be as high as 0.774 and 0.333 for the weak and strong conglomerate layers, respectively. Notably, the as value of 0.774 is higher than the published range of 0.200–0.670, indicating an exceptional shaft roughness within the weak conglomerate layer. The exceptional shaft roughness could be attributed to the presence of ‘multiple fingers’ of concrete filling gaps and joints in the weak conglomerate mass after drilling. As for the as value of 0.333 for the strong conglomerate mass encountered, while lower, is still reasonable from geotechnical design perspective considering stress relaxation effects.
The end bearing pressure was assessed to be 1930 kPa under a small toe movement of 1.2 mm based on the mobilised shaft resistances and the maximum sustained tested loads of 37.73 MN. Noted this interpreted pressure is significantly lower than the anticipated value, likely due to insufficient load to fully mobilise the end bearing stress in the lower pile (i.e., a much higher end bearing resistance can be expected when subjected to a higher end bearing stress). In addition, ≈10 mm of sediments detected at the pile base by a sounding tape prior to concrete pouring may have created a soft toe, requiring greater toe movement to mobilise more end bearing resistance.
For the above reason, an alternative assessment of the ultimate geotechnical strength based on the test pile results has been carried out using Chin F.K. method for the lower pile. The Chin F.K. extrapolation is a commonly used method to estimate the ultimate capacity of piles from the results of a load test without having to load the pile to failure. The method is based on the results of an experimental study of the shear–deformation characteristics obtained from shear box and triaxial tests and from tests carried out with model piles in both the field and in the laboratory. The tests show that the load–deformation relationship is hyperbolic, and a plot of Δ/P against an abscissa of Δ – where P is the load corresponding to a deformation Δ – is linear. The inverse slope of this line curve therefore gives the ultimate value of P (refer to Figure 9). Based on Figure 9, the interpretated design ultimate geotechnical strength was estimated to be 65.17 MN, considering acceptable displacement limitation per AS 2159. Based on Figures 8 and 9, the likely maximum end bearing resistance (pressure) from test data can be re-interpreted as 21.34 MPa with a maximum acceptable downward toe movement of 92 mm, that is, (65.17 MN − 37.73 MN + 2.73 MN)/(π − (1.5 m)2/4)/0.8, where 2.73 MN is the mobilised end bearing resistance (force) as interpreted based on the maximum sustained tested loads of 37.73 MN; 0.8 is the reduction factor for accounting 80% of partial base cleanliness. This re-interpreted end bearing resistance of 21.34 MPa was found closely matching the theoretical prediction of 21.47 MPa for strong conglomerate with a UCS of 20 MPa using a formula of 4.8 UCS0.5 as discussed within Section 5 of this paper. In the design of the test pile, a lower value of 15 MPa was adopted then with consideration of potential softening effect to occur at the pile toe base attributed to excavation-induced stress relaxation effect.
Assessment of the raw test data was carried out and a comparison of load-settlement curves against design estimate using Finite Element Software PLAXIS (i.e., 2D symmetrical modelling) were made and presented in Figures 10 and 11. For test pile concrete, the Young’s Modulus is about 32 GPa estimated based on concrete cube strength data, the poison ratio of concrete is 0.15, and the unit weight is 25 kN/m3. The process involved adjusting interface reduction factor values to match the estimated skin friction values, checking end bearing pressures from the PLAXIS model against the measured values interpreted using Chin F.K. method, checking computed displacement plot against the measured values from the test and adjusting Young’s Modulus values and interface factors for rock socket materials. The iterative process of adjusting parameters in the PLAXIS 2D model continued until the results aligned with all three measured outcomes. Based on the comparison made between the measured and the estimated load-settlement curves, the actual global rock mass stiffness was observed to be greater than typical expectations. However, these variations remained within the assessed sensitivity range of 50%–200% of the design estimated values. The following observations could be made as presented in Table 9 based on the assessment results.
In addition, the interpreted average shaft frictions from test piles were significantly greater than the estimated values for both Test Pile #1 and Test Pile #3. These findings will be the subject of a separate publication. Table 10 presents a summary of observations made from design, installation, and test of test piles and associated test results.
Discussions/recommendations
During the design, installation, and testing of tree plus one test piles, there were a number of engineering issues and challenges encountered.
The installation of production piles in the river was planned through three sequential temporary accesses, that is, temporary bridge access from the northern shoreline to Pier 19 to Pier 15 was completed first, then reclaimed land access from Pier 3 to Pier 1 to the southern shoreline completed subsequently and finally connected barge access from Pier 15 to Pier 3. Due to this sequential construction, it was not feasible to install and test three test piles prior to commencement of production piles. Instead, the alignment was divided into three groups, each with a nominated test pile (refer to Table 2). With such arrangement, production piles within southern reclaimed land access and northern temporary bridge access can be installed without delays from the test pile located in the middle of the river.
The following key points and lessons learnt:
A departure was obtained to avoid validating shaft roughness ‘pile by pile’ by using conservative shaft friction resistance coefficient as values for rocks. This approach proved successful based on test results and best project outcomes.
Polymer support fluid effectively addressed the challenge of potential instability and/or collapse in deep, large diameter pile shaft, excavated in clay like materials and extremely to highly weathered, very low to low strength rocks. This method was successful even when excavated shafts remained unsupported for relatively long periods including significantly exceeded the maximum nominated time limit for onshore piles as per AS 2159.
Risks associated with extremely variable ground conditions and potential designer inexperience could often result in an unexpected assessment and prediction that may over-estimate the ultimate geotechnical strength and, therefore, lead to incorrect O-Cell position. To mitigate such risks, the authors implemented a stringent process where highly qualified and experienced designers reviewed all rock cores, laboratory and in situ test results.
Structural design has a tendency to minimise concrete cover in O-Cell test piles (due to its primary function to take vertical load only). This tendency posed risks of inappropriate shaft contact particularly near the O-Cell position leading constraint concrete flow that could potentially cause sediments to be trapped under the O-Cell plate (Ref. Issued encountered in the Test Pile #2). A thicker concrete cover should be considered in the design of the O-Cell test pile in the future.
The successful installation and testing of a pile within tertiary sedimentary breccia and tertiary conglomerate on this project provided valuable, previously scarce published information on shaft frictions for these materials. The test pile has also validated friction values of various soil types against steel casing and assessed the impact of extremely weathered, breccia, and residual soils on shaft friction with and without steel casing.
The design approaches, assumptions, and processes as well as the construction execution procedure were validated by the test results.
For future projects, allowance for a longer Kelly bar, a greater individual O-Cell capacity and a greater O-Cell expansion limit would greatly increase flexibility in test pile design and potentially improve project outcomes.
Acknowledgements
The authors wish to thank Department of State Growth (DSG), Tasmania and McConnell Dowell (MCD) for permission to publish this paper. The authors also wish to thank DSG, MCD, Tony Gee, Fugro, and many individuals for both the corporate and the individual contributions to successfully deliver this project in one way or another. The views expressed in this paper are those of the authors.