


The border closure and lockdowns due to Covid-19 pandemic resulted in partial closure of many industrial and commercial complexes, halted the performance of key strategic sectors such as logistics and supply chains, and thus disrupted the global value chains and the economy. The authors argue, however, that the pursuit of survival has driven companies to innovate and use digitization to overcome the negative consequences of the pandemic. More specifically, in this paper the authors aim to assess the success and challenges faced by companies in digitization policy design, adoption and implementation and their effects on firms’ operation, outputs and customer base during Covid-19.
Sixty-one samples of the companies surveyed between 10 January and 30 April 2021 were analyzed, using the Krushkal–Wallis test and Independent-Samples Mann–Whitney U test to identify the relationships between variables including operation, overall output, customer base, digitization policy, technology use and implementation costs of new technologies.
Results revealed a positive impact of digitization on the operation and overall outputs, while no effect was observed on the customer base. Analysis also showed that only 1.8% of companies were able to fully implement digitization, and that the cost of technology prevented most companies from using emerging technology or implementing their digitization policy.
While the research has practical implications, it is not without flaws. For instance, the outcome of technology varies as per geographic area and people. The study was conducted in the Sultanate of Oman, a developing country in the Middle East region; therefore, it is difficult to generalize the outcomes suited to developed countries. The developed countries usually have a population quite used to the advanced technologies so some of the issues raised in the study might not work in the logistics and supply chain sectors of the developed countries. Such countries need separate studies.
The findings will have implications for both supply chain companies as well as the technology providers. The supply chain companies will invest in technology infrastructure and add technology as an important component in their business models. The technology providers will consider the costs of implementation and adoption issues of technology in the supply chain companies.
To the best of authors' knowledge, no work has been produced on logistics and supply chain companies considering the technological sustainability during the time of Covid-19. The study will improve understanding of the digitization policy design, adoption and implementation and their effects on logistics and supply chain companies’ performance.
1. Introduction
The effect of Covid-19 has been widely felt across all economic sectors. Governments have taken numerous strict measures to control the negative impact of the pandemic, but restrictions on travel and frequent lockdowns have caused disruptions in the logistics and supply chain sector. Negative effects of the pandemic on this sector included the disruption in the operations and management of the global supply chain system, shortage or late delivery of products and services, and demand-supply mismatch (Jomthanachai et al., 2022; Moosavi et al., 2022; Schleper et al., 2021; Sathyanarayana et al., 2020). The severity of the crisis is clear in the drop of the overall operations of the sector by 94.3% in the early phase of the pandemic (Nordhagen et al., 2021; Singh et al., 2021), and reduction in companies’ revenue due to inability to make timely deliveries (Siddiqui, 2020).
However, there have been some positive changes taking place during Covid-19, most notably the evolutions in organizational internal policies and upsurge in digitization and information and communication technology (ICT) usage (Orlando et al., 2022; Sombultawee et al., 2022). Operationally, the logistics and supply chain companies in Sweden, Poland and Germany developed and adopted the policies of innovative solutions during Covid-19 (Klein et al., 2022). Lange and Grafelmann (2022) argued that digital technologies boosted efficiency and enabled maritime logistics companies operational during the Covid-19. Kuteyi and Winkler (2022) also underscored the advantages of digital technology for increased responsiveness, efficacy and transparency in logistics, particularly in remote regions such as sub-Saharan Africa. Indeed, the advantages of the pandemic can be seen in the adoption and expansion of digitalization in the workplace (Pujawan and Bah, 2022; Amankwah-Amoah et al., 2021) and reshaping consumer behavior, with many consumers concentrating more on online purchase and services than ever (Jaravel and O’Connell, 2020).
The level of digitalization in companies varies according to the size, the bigger the higher (Lange and Grafelmann, 2022). Modgil et al. (2021) investigated the capabilities of artificial intelligence (AI) in handling logistics and supply chain in terms of visibility, risk, sourcing and distribution during the crisis. Transparency, fast delivery, customized solutions, reduced interruption and dynamic setup were all cited as benefits. Spieske and Birkel (2021) conducted a systematic literature review with 62 articles on industry 4.0 technology and concluded the need for statistical studies on sustainable logistics and supply chain by integration of technologies such as big data and AI. Ivanov (2021) argued that the potential of technology in logistics and supply chain during this pandemic has not been sufficiently examined and underscored the need for big data analytics, AI and real-time monitoring systems that help organizations in early recovery. His study, however, is conceptual in nature and requires empirical study in industrial settings. Nabipour and Ülkü (2021) stated the necessity for empirical studies on ICT use in diverse geographical contexts and proposed China, India, the United States and the Middle East. However, the enabling technologies in the supply chain remain unexplored.
Considering the above arguments and developments, this study attempts to examine whether Covid-19 has stimulated the digitization policy and facilitated technology integration in the logistics and supply chain sector. While Covid-19 being considered as a hurdle for business, we argue that the pandemic has been a catalyst for advancing digital transformation in strategic sectors such as logistics and supply chain, while exploring the types of technology used before and during Covid-19. Our aim is also to examine the effect of digitization policy and actual use of technology on the companies’ operations, overall output and customer base during Covid-19; then, we assess the effect of costs on companies’ decision to implement new technology.
While attempting to address these broader objectives, we also seek to answer the following research question: How has the digitization policy design and actual implementation affected the logistics and supply chain sector during the time of Covid-19? The study has quantitatively analyzed the data collected from 61 companies operating in the logistics and supply chain sector in the Sultanate of Oman. The findings of this examination will help researchers, practitioners and policymakers to understand and formulate appropriate strategies to enhance technology implementation and adopt the most appropriate business model to help logistics and supply chain companies in their postpandemic recovery. The experience of Oman will help other developing countries.
2. Literature review
There is a wealth of literature on the impact of Covid-19 on various sectors. Covid-19 caused sudden changes in demand and supply due to the disruption in the logistics and supply chain sector (Govindan et al., 2020; Ivanov and Dolgui, 2020; Puddister and Small, 2020; Ting et al., 2020; Vaccaro et al., 2020; Webster, 2020). However, the focus is now on the means and methods of recovery. The digitalization of logistics and supply chain is helpful in minimizing the overall impact of Covid-19 (Ivanov and Dolgui, 2021; Queiroz et al., 2020). Ivanov (2021) proposed a framework for logistics and supply chain recovery from Covid-19 with three important dimensions: management, organization and technology. Big data analytics, AI, track and trace systems, blockchain technology, digital platforms and collaborative supplier portals are the emerging technologies that proved useful during the pandemic. Nah and Siau (2020) discussed the scope of digital supply chain, data analytics, AI, machine learning, robotics, digital commerce and Internet of Things (IoT) as a business strategy to overcome the effects of the Covid-19 pandemic. Companies have realized that innovation is key to the development and survival of business (European Institute of Innovation and Technology, 2020).
2.1 Logistics and supply chain companies’ operations and digitization
The quality and performance of the logistics and supply chain sector depend on the type of policies that govern the sector and the type of advanced technology adopted that improves the efficiency of the operating systems (Navavongsathian et al., 2020). Belhad et al. (2021) applied such argument in the airline supply chains’ short- and long-term responses using the survey data from 145 companies during Covid-19. They discovered that the airline industry was more concerned with redefining operations to ensure airport and flight business continuity besides recognizing the value of big data analytics in providing real-time insights on diverse supply chain processes.
Large-scale data in the supply chain are used in tracking the flow of goods and materials (Kaur and Singh, 2021; Birkel and Hartmann, 2020; Ivanov et al., 2019). The scope of big data analytics in supply chain risk management was highlighted empirically: the area includes risk assessment, response planning and reactive real-time control (Dubey et al., 2021; Ivanov and Dolgui, 2020). Big data analytics includes the complete process of data gathering to finally present results for decision-making (Er Kara et al., 2021; Ivanov et al., 2019) such as in finding suitable transportation routes during disruptions (Er Kara et al., 2021). Brintrup et al. (2020) support this when they claim AI and big data can predict supply chain disruption and help in finding solutions through analyzing the collected data from tracking and sensor technologies in real time.
2.2 Logistics and supply chain companies’ outputs and digitization
Covid-19 has provided businesses with chances to be creative in reworking existing products and developing new digital products and services. A few companies moved towards the implementation of technologies leading to the digitization of logistics and trade (Valdés Figueroa and Pérez, 2020). Queiroz et al. (2020) conducted a structured literature review on pandemic and logistics and observed that resource optimization and distribution were the main areas of concern around the world. Chen et al. (2020) found that technology helped in maintaining inventory levels and backup plans. Technology further improves existing strategic techniques, processes and changes the business models to gain advantages (Kim et al., 2019; Saebi et al., 2019). ICT in logistics and supply chain could track and measure temperature and pressure (Er Kara et al., 2021).
2.3 Logistics and supply chain companies’ customer base and digitization
On the customer side of business, Bytyçi et al. (2021) distributed surveys to 1,250 people in Kosovo, North Macedonia and Albania. They were endeavoring to understand customers’ behavior due to the Covid-19 lockdown; the results showed changes in buying behavior, with consumers shifting to online purchases. Akpan et al. (2020) explored the relevant technologies and evaluated software platforms in the business context, discovering that technology not only enabled the formation of social businesses, customer relationship, management and the introduction of new communication channels, but also aided the reduction of business costs. Sharma et al. (2020a, b) analyzed the literature on supply chain and Covid-19 in India. They observed that logistics and supply chain companies in India do not use ICT and most of the companies follow the traditional approach of trucking, loading, unloading and material handling.
After investigating the challenges of adopting AI-ML in the Indian agricultural supply chain and its impact on risk mitigation, Nayal et al. (2021) showed a positive relationship between AI and supply chain. Choi (2020) presented the idea of integrating technology in the logistics sectors in the form of mobile service operation (MSO). He suggested that the government should ensure different kinds of schemes such as fixed-cost-subsidy (FCS), operations-cost-subsidy (OCS) and safety-technology-support (STS) for MSO.
3. Research method
The study used a quantitative approach for this cross-sectional study to assess the effect of digitization policy and technology integration on logistics and supply chain companies in the context of the Sultanate of Oman during Covid-19. The primary data were collected through a survey questionnaire completed by 61 companies operating in the logistics and supply chain sector in the Sultanate of Oman. While explaining the impact of digitization and technology adaptation on companies’ operations, overall output and customer base, several models were used. For instance, Krushkal–Wallis test and Independent-Samples Mann–Whitney U test. These tests helped in identifying the relationships between variables including operation, overall output, customer base, digitization policy, technology use and implementation costs of new technologies. These tests are appropriate when comparing the values before and after the occurrence of events.
3.1 Statistical tests
To respond effectively to the main research question, we applied statistical tests. The data was not normally distributed therefore nonparametric test such as Independent-Samples Mann–Whitney U test (Mann and Whitney, 1947), and Independent-Krushkal–Wallis test (Kruskal and Wallis, 1952) was chosen.
Kolmogorov–Smirnov test: To test the normality of the population distribution, Kolmogorov–Smirnov was applied to ascertain whether to use parametric or nonparametric tests. The test was proposed by Massey in 1951 (Massey, 1951). The formula for Kolmogorov–Smirnov test is:
where represents cumulative distribution of the sampled distribution under testing. It should be continuous distribution. The null hypothesis is accepted, if the p-value of the Kolmogorov–Smirnov test statistic, D is greater than 0.05, or 0.001
Independent-Samples Mann–Whitney U test: It is the replacement of the two-sample t-test when the population distribution is not normal. It assumes that the two populations have the same median, i.e. the difference between them is zero. The statistic U of Mann–Whitney U test is calculated as
where, n is the sample size for each group.
Kruskal-Wallis test: The Kruskal and Wallis test is a replacement of the Mann–Whitney U test when there are more than two groups in the population distribution. The hypothesis in the Kruskal-Wallis test assumes that the mean ranks of the groups are the same.
The statistic H of Kruskal and Wallis test is calculated as
where N denotes the sample size; is the sample size in the ith group; and is the sum of the ranks in the ith group.
3.2 Survey design
The literature review was used to identify several factors and indicators in designing the survey questionnaire for primary data collection. For instance, participants’ characteristics, technology policy, technology use and role of technology during Covid-19, as well as the impact of technology on operation, overall output and customer base during Covid-19. The participants’ interpretation of the survey’s questions and substance, the average time needed to complete the entire survey and its limitations were all tested in a pilot study. Using the results of the pilot study, the authors were able to make several changes based on participant suggestions. To reach a larger audience and ensure that no pertinent companies were left out, the questionnaire was created in both English and Arabic. The questions were designed on a 05 (five) point Likert scale and measured as nominal, ordinal and scale (see survey questionnaire in Appendix).
3.3 Survey distribution and data collection
Both online and offline mode was used to distribute the survey. The collection of data took place between 10 January and 30 April 2021. The online mode was done by sending the Google form link of the survey to the participants. The offline mode included visits to companies, meeting with chief executive officer (CEO), directors, managers and company executives and briefing them on the purpose and objectives of the study. They were assured of confidentiality and data privacy. After they signed the consent form then only data were collected. We restricted our fieldwork to the industrial cities and free economic zones in the Sultanate of Oman due to the regular lockdowns.
3.4 Data analysis
The collected data were cleaned for missing and incomplete values to establish the relationships between various variables and constraints. Only 70 of the 75 companies that were contacted to participate in the survey gave their consent. After review, cleaning the data of missing and incomplete values, and deleting incorrect responses, sixty-one valid survey data items out of the original 70 were acquired from respondents and analyzed using IBM SPSS 26.0. Either companies that did not react were closed or the management gave an explanation, citing various factors such as time restrictions, a heavy workload, etc. Table 1 shows the characteristics of participants.
Characteristics of participants
| N | % | N | % | ||
|---|---|---|---|---|---|
| Male/Female | Number of employees | ||||
| Female | 6 | 10% | 50 and below | 42 | 69% |
| Male | 55 | 90% | 51 to 100 | 9 | 15% |
| Total | 61 | 100.0% | 101 to 150 | 5 | 8% |
| Omani/Non-Omani | 151–200 | 0 | 0% | ||
| 201 to 250 | 3 | 5% | |||
| Non-Omani | 20 | 33.0% | Above 250 | 2 | 3% |
| Omani | 41 | 67.0% | Total | 61 | 100.0% |
| Total | 61 | 100.0% | Head office location | ||
| Positions/employment | Muscat | 44 | 72% | ||
| Al Dhahira | 2 | 3% | |||
| Director/CEO | 37 | 61% | Al Batinah South | 4 | 7% |
| HR Manager | 5 | 8% | Al Batinah North | 8 | 13% |
| Logistic Manager | 10 | 16% | Al Wusta | 2 | 3% |
| Operational Manager | 9 | 15% | Al Sharqiya North | 1 | 2% |
| Total | 61 | 100.0% | Total | 61 | 100.0% |
Source(s): Authors own work
Table 2 shows the descriptive statistics of the variables used. The variables are the mean, median, standard deviation, variance and kurtosis. The maximum variance of 58.839 was observed with the variable, “the type of technology used in the companies before/during Covid-19.” While the least variance corresponds to the “implementation costs of technology.” The standard deviation corresponds to the variables “future plan to use tracking technology” and “future plan to use big data analytic technologies” are 1.731 and 1.66. They do not differ significantly.
Descriptive statistics of the variables used
| Factors | Descriptive statistics | 95% confidence interval for mean (LB, UB) | ||||
|---|---|---|---|---|---|---|
| Mean | Median | Standard deviation | Variance | Kurtosis | ||
| Digitization policy before Covid-19 | 1.21 | 1.00 | 1.051 | 1.104 | −0.702 | (0.94, 1.48) |
| Digitization policy during Covid-19 | 1.23 | 1.00 | 1.131 | 1.28 | −0.903 | (0.94, 1.52) |
| Type of technology used in the companies before/during Covid-19 | 14.62 | 17.00 | 7.671 | 58.839 | −1.307 | (12.66, 16.59) |
| Technology use on the companies operations during Covid-19 | 0.69 | 0.00 | 0.957 | 0.951 | 3.296 | (0.44, 0.94) |
| Effects of technology use on the companies overall outputs during Covid-19 | 0.74 | 0.00 | 1.031 | 1.063 | 2.81 | (0.47, 1.00) |
| Implementation costs of technology | 0.75 | 1.00 | 0.75 | 0.555 | −1.064 | (0.56, 0.94) |
| Future plan to use tracking technology | 4.07 | 0.00 | 1.731 | 2.996 | 0.381 | (3.62, 4.51) |
| Future plan to use big data analytic technologies | 3.90 | 4.00 | 1.660 | 2.757 | 0.863 | (3.48, 4.33) |
Source(s): Authors own work
4. Analysis and findings
The surveyed sample comprises 90% males and 10% females: Omanis account for 67% and non-Omanis for 33% of the sampled data. The participants were mainly Directors/CEOs, human resources (HR) managers, logistic managers and operational managers. The policy of digitization in the selected companies during Covid-19 was as follows: below 25% was 34.4%, 25 to 49% was 26.2%, 50 to 74% was 23.0%, 75 to under 100% was 14.8%, 100% was 1.6%. The technology/ICT implementation cost, as mentioned by respondents, is very expensive (42%), expensive (39%) and affordable (18%). Forty six percent used online platforms in businesses during Covid-19 while 54% did not. The normality of the data was checked by applying the Kolmogorov-Smirnov test. Table 3 shows the Kolmogorov-Smirnov test for normality.
Kolmogorov-Smirnov test for normality
| Factors | Kolmogorov-Smirnov test score |
|---|---|
| Customer base | D(61) = 0.205, p < 0.001 |
| Operation | D(61) = 0.301, p < 0.001 |
| Overall output | D(61) = 0.304, p < 0.001 |
| Goods tracking technology | D(61) = 0.190, p < 0.001 |
| Digitization policy | D(61) = 0.206, p < 0.001 |
| Technology use | D(61) = 0.361, p < 0.001 |
| Cost of implementing | D(61) = 0.270, p < 0.001 |
Source(s): Authors own work
4.1 Technology use in logistics and supply chain before and during Covid-19
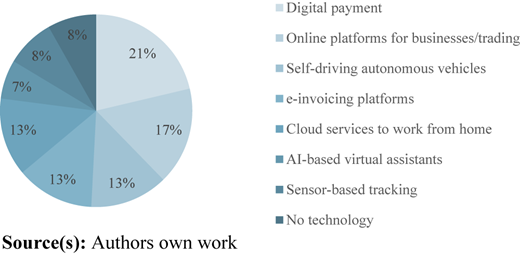
The highest percentage of technology use corresponds to digital payment (21%), followed by online platforms for businesses/trading (16%), e-invoicing platforms (13%) and 8% did not use any modern technology. It is to be noted that companies used some kinds of emerging technologies such as self-driving autonomous vehicles (13%), cloud services to work from home (13%), AI-based virtual assistants (7%) and sensor-based tracking systems (8%). Figure 1 shows the technology used by companies operating in the logistics and supply chain sector.
When inquired about specific areas where the companies implemented/used technology, it was found that the main areas were automated HR, automated finance and automated operation. About 20.7% of the companies used combined automated HR, automated finance and automated operation before Covid-19, while 32.8% used these during the pandemic. Figures 2 and 3 show the technology implementation area in the companies before and during Covid-19.
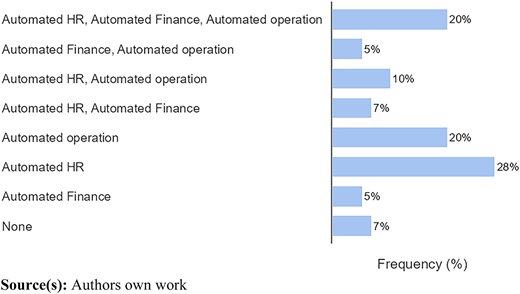
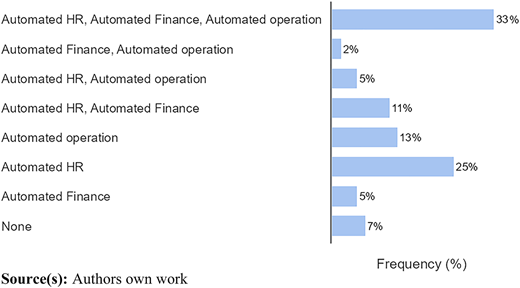
Table 4 shows the correlation matrix of technology implementation before and during Covid-19. A strong and significant correlation exists.
Correlation matrix of technology implementation before and during Covid-19
| Variables under investigation | Correlation coefficients | Technology use before Covid-19 | Technology use during Covid-19 |
|---|---|---|---|
| Technology use before Covid-19 | Pearson’s r | – | |
| Spearman’s rho | – | ||
| Technology use during Covid-19 | Pearson’s r | 0.753*** | – |
| Spearman’s rho | 0.785*** | – |
Note(s): *p < 0.05, **p < 0.01, ***p < 0.001
Source(s): Authors own work
4.2 Impact of digitization policy on companies’ operations, output and customer base during Covid-19
Five levels of digitization policy were framed in the questionnaire. They were digitization policy in the company below 25%; 25% to 49%; 50 to 74%; 75 to less than 100%; and 100%.
4.2.1 Effects of digitization policy on companies’ operations during Covid-19
Krushkal–Wallis test was used to examine the effects of digitization policy on operation during the pandemic. The test showed that different levels of digital policy significantly affected the operation of companies H(4) = 13.539, p = 0.009. What the test also revealed was a noticeable difference (p < 0.05) between the mean ranks of at least one pair of groups. All five pairs of groups were subjected to Dunn’s pairwise testing. There was substantial evidence (p < 0.05, adjusted using Bonferroni correction) of a difference between the groups who had below 25% – 50 to 74%; below 25% – 75 to less than 100%; 25 to 49% – 50 to 74%; and 25 to 49% – 75 to less than 100%. There was no evidence between the other pairs. Table 5 shows pairwise comparison of digitization policy of companies in the operational area.
Pairwise comparison of digitization policy of companies in the operational area
| Sample 1-sample 2 | Test statistic | Std. error | Std. test statistic | Sig | Adj. Sig.a |
|---|---|---|---|---|---|
| Below 25% – 25 to 49% | −0.138 | 5.290 | −0.026 | 0.979 | 1.000 |
| Below 25% – 50 to 74% | −13.250 | 5.500 | −2.409 | 0.016 | 0.160 |
| Below 25% – 75 to less than 100% | −15.468 | 6.351 | −2.436 | 0.015 | 0.149 |
| Below 25% – Full (100%) | −30.357 | 16.316 | −1.861 | 0.063 | 0.628 |
| 25 to 4% – 50 to 74% | −13.112 | 5.834 | −2.248 | 0.025 | 0.246 |
| 25–49% – 75 to less than 100% | −15.330 | 6.642 | −2.308 | 0.021 | 0.210 |
| 25–49% – Full (100%) | −30.219 | 16.432 | −1.839 | 0.066 | 0.659 |
| 50–74% – 75 to less than 100% | −2.218 | 6.811 | −0.326 | 0.745 | 1.000 |
| 50–74% – Full (100%) | −17.107 | 16.501 | −1.037 | 0.300 | 1.000 |
| 75 to less than 100% – Full (100%) | −14.889 | 16.803 | −0.886 | 0.376 | 1.000 |
Note(s): Each row tests the null hypothesis that the Sample 1 and Sample 2 distributions are the same
Asymptotic significances (2-sided tests) are displayed. The significance level is 0.050
a. Significance values have been adjusted by the Bonferroni correction for multiple tests
Source(s): Authors own work
Figure 4 shows the density plot of digitization policy of companies during Covid-19 and its impact on the operational area. Higher impact on operation was observed when the digitization policy was 50 to 74%.
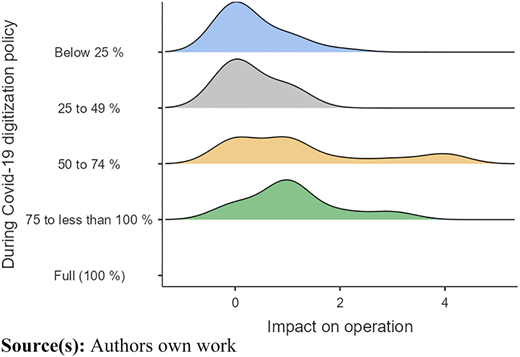
Density plot of digitization policy of companies during Covid-19 and its impact on the operational area
Density plot of digitization policy of companies during Covid-19 and its impact on the operational area
4.2.2 Effects of digitization policy on companies’ overall output during Covid-19
The Krushkal–Wallis test gave evidence that different levels of digital policy strongly affected companies’ overall output H(4) = 11.337, p = 0.023. It was also revealed that there was a significant difference (p < 0.05) between the mean ranks of at least one pair of groups. The five pairs of groups were then subjected to Dunn’s pairwise testing. There was strong evidence (p < 0.05, adjusted using Bonferroni correction) of a difference between the groups who had below 25% – 25 to 49%; below 25% – 75 to less than 100%; below 25% – 50 to 74%; below 25% – Full (100%). There was no evidence between the other pairs. Table 6 shows pairwise comparison of digitization policy of companies and overall output.
Pairwise comparison of digitization policy of companies and overall output
| Sample 1-sample 2 | Test statistic | Std. error | Std. test statistic | Sig | Adj. sig.a |
|---|---|---|---|---|---|
| Below 25% – 25 to 49% | −10.376 | 5.320 | −1.950 | 0.051 | 0.511 |
| Below 25% – 75 to less than 100% | −12.206 | 6.387 | −1.911 | 0.056 | 0.560 |
| Below 25% – 50 to 74% | −15.488 | 5.531 | −2.800 | 0.005 | 0.051 |
| Below 25% – Full (100%) | −31.595 | 16.409 | −1.925 | 0.054 | 0.542 |
| 25 to 49% – 75 to less than 100% | −1.830 | 6.680 | −0.274 | 0.784 | 1.000 |
| 25 to 49% – 50 to 74% | −5.112 | 5.867 | −0.871 | 0.384 | 1.000 |
| 25 to 49% – Full (100%) | −21.219 | 16.525 | −1.284 | 0.199 | 1.000 |
| 75 to less than 100% – 50 to 74% | 3.282 | 6.850 | 0.479 | 0.632 | 1.000 |
| 75 to less than 100% – Full (100%) | −19.389 | 16.899 | −1.147 | 0.251 | 1.000 |
| 50 to 74% – Full (100%) | −16.107 | 16.594 | −0.971 | 0.332 | 1.000 |
Note(s): Each row tests the null hypothesis that the Sample 1 and Sample 2 distributions are the same
Asymptotic significances (2-sided tests) are displayed. The significance level is 0.050
aSignificance values have been adjusted by the Bonferroni correction for multiple tests
Source(s): Authors own work
Figure 5 shows the density plot of digitization policy of companies during Covid-19 and its impact on the overall output. Higher impact was observed for 50–74% digitization policy as compared to 75% to less than 100%
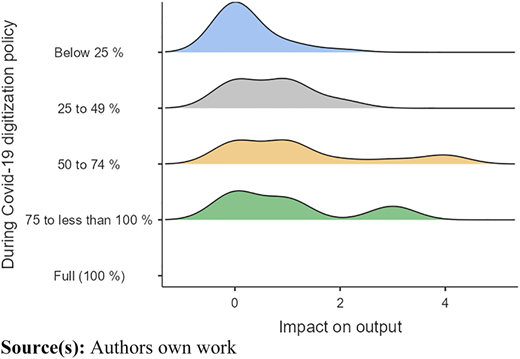
Density plot of digitization policy of companies during Covid-19 and its impact on the overall output
Density plot of digitization policy of companies during Covid-19 and its impact on the overall output
4.2.3 Effects of digitization policy on companies’ customer base during Covid-19
The Krushkal–Wallis test was used to study the differences on consumer base according to the different levels of digital policy. The test showed that different levels of digital policy did not significantly affect the consumer base H(4) = 3.581, p = 0.466. No major difference was found among the five categories of participants (below 25%; 25 to 49%; 50 to 74%; 75 to less than 100%; and 100%).
Figure 6 shows the density plot of digitization policy of companies during Covid-19 and its impact on the customer base. Higher impact was observed for 50 to 74% digitization policy as compared to 75% to less than 100%
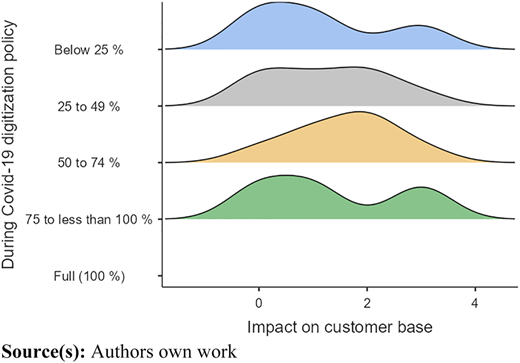
Density plot of digitization policy of companies during Covid-19 and its impact on the customer base
Density plot of digitization policy of companies during Covid-19 and its impact on the customer base
4.3 Impact of actual use of technology on companies’ operations, output and customer base during Covid-19
The dependent variables are operation, overall output and customer base measured on a continuous scale. The independent variable is actual use of technology, which is categorical in nature with two groups: technology use: Yes; technology use: No. The distribution of independent groups is not the same, hence mean rank is used.
4.3.1 Effect of technology use on companies’ operations during Covid-19
The mean rank of companies’ operation was compared in different groups of technology use. A Mann–Whitney U test revealed a significant difference (U = 721, p = 0.00) of use of technology during Covid-19. The effect size was calculated as Z/N1/2 = 0.54, where Z = 4.183 and N = 61. The 4.183 value (Cohen’s classification, 0.1 (small effect), 0.3 (moderate effect), 0.5 (large effect)) shows a moderate effect of technology use on operation. Figure 7 shows these differences.
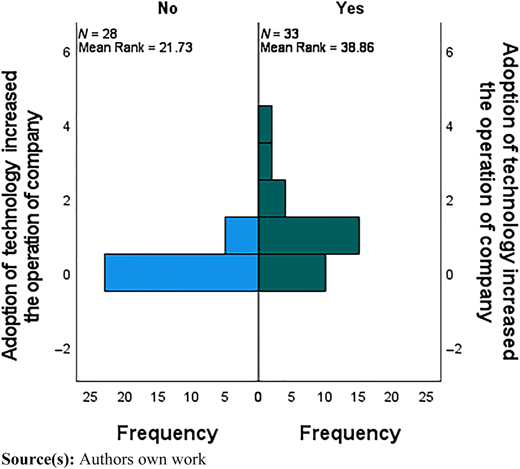
Differences in the mean ranks of companies’ operation because of technology use during Covid-19
Differences in the mean ranks of companies’ operation because of technology use during Covid-19
4.3.2 Effects of technology use on companies’ overall output during Covid-19
A Mann–Whitney U test revealed a noticeable difference (U = 715, p = 0.00) of companies’ overall output in groups of technology use during Covid-19. The effect size was calculated as Z/N1/2 = 0.52, where Z = 4.055 and N = 61. The 4.055 value (Cohen’s classification, 0.1 (small effect), 0.3 (moderate effect), 0.5 (large effect)) shows moderate effect of technology use on overall output, as seen below in Figure 8.
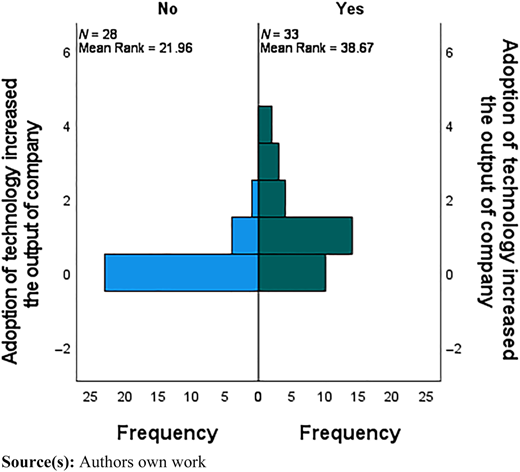
Differences in the mean ranks of companies’ overall output because of technology use during Covid-19
Differences in the mean ranks of companies’ overall output because of technology use during Covid-19
4.3.3 Effects of technology use on companies’ customer base during Covid-19
We used a Mann–Whitney U test, which revealed a significant difference (U = 439, p = 0.730) of companies’ customer base compared across groups of technology use during Covid-19. The effect size was calculated as Z/N1/2 = 0.04, where Z = 0.345 and N = 61. The 0.04 value (Cohen’s classification, 0.1 (small effect), 0.3 (moderate effect), 0.5 (large effect)) indicates only a negligible effect. Figure 9 shows these insignificant differences in the mean ranks of companies’ customer base as a result of technology use during Covid-19.
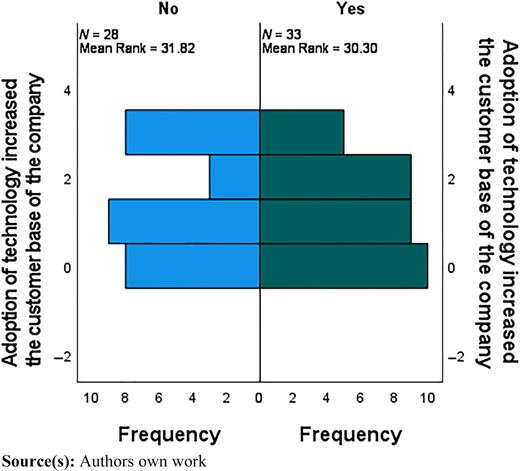
Differences in the mean ranks of companies’ customer base because of technology use during Covid-19
Differences in the mean ranks of companies’ customer base because of technology use during Covid-19
4.3.4 Regression coefficients of technology use and effects on companies’ operations, overall output and customer base during Covid-19
Regression analysis was conducted between technology use and effects on companies’ operations, overall output and customer base during Covid-19. In operation, 48.6% variation, output 47.1% variation and 5.38% variation in the customer base were seen as a results of technology use during the Covid-19 time. Table 7 and 8 show the regression results.
Regression model fit measures
| Model | R | R2 |
|---|---|---|
| Impact on operation and actual use of technology during Covid-19 | 0.486 | 0.236 |
| Impact on overall output and actual use of technology during Covid-19 | 0.471 | 0.222 |
| Impact on customer base and actual use of technology during Covid-19 | 0.0538 | 0.00290 |
Source(s): Authors own work
Regression model coefficients affect operation, output and customer base
| Predictor | Estimate | SE | t | p |
|---|---|---|---|---|
| Model coefficients – impact on operation | ||||
| Intercept a | 0.179 | 0.162 | 1.10 | 0.276 |
| During Covid-19 actual use of technology | ||||
| Yes – No | 0.943 | 0.221 | 4.27 | <0.001 |
| Model coefficients – Impact on output | ||||
| Intercept a | 0.214 | 0.173 | 1.24 | 0.221 |
| During Covid-19 actual use of technology | ||||
| Yes – No | 0.968 | 0.236 | 4.11 | <0.001 |
| Model coefficients – Impact on customer base | ||||
| Intercept a | 1.393 | 0.213 | 6.527 | <0.001 |
| During Covid-19 use of technology | ||||
| Yes – No | −0.120 | 0.290 | −0.414 | 0.680 |
Note(s): a Represents reference level
Source(s): Authors own work
4.4 Influence of costs on technology use by logistics and supply chain companies
The dependent variables are planning to use goods tracking technology and big data analytics. The independent variable is implementation cost of technology: very expensive, expensive and affordable.
4.4.1 Influence of costs on the decision to use goods tracking technology in future
The Krushkal–Wallis test was used to examine these differences. The results showed that different levels of cost significantly affect plans to use goods tracking technology: H(2) = 10.128, p = 0.006. The test also revealed that there was a significant difference (p < 0.05) between the mean ranks of at least one pair of groups. The three pairs of groups were subjected to Dunn’s pairwise testing, which showed strong evidence (p < 0.05, adjusted using Bonferroni correction) of a difference between the groups expensive-affordable and very expensive-affordable. There was no evidence of differences between the other pairs. Table 9 shows pairwise comparisons of technology cost for goods tracking technology.
Pairwise comparisons of technology cost for goods tracking technology
| Sample 1-sample 2 | Test statistic | Std. error | Std. test statistic | Sig | Adj. sig.a |
|---|---|---|---|---|---|
| Expensive-Very Expensive | 0.486 | 4.905 | 0.099 | 0.921 | 1.000 |
| Expensive-Affordable | −18.608 | 6.309 | −2.949 | 0.003 | 0.010 |
| Very Expensive-Affordable | −18.122 | 6.232 | −2.908 | 0.004 | 0.011 |
Note(s): Each row tests the null hypothesis that the Sample 1 and Sample 2 distributions are the same
Asymptotic significances (2-sided tests) are displayed. The significance level is 0.050
aSignificance values have been adjusted by the Bonferroni correction for multiple tests
Source(s): Authors own work
Figure 10 shows the density plot of cost of technology and willingness of companies to use real time tracking technology in future. Higher cost is not deterring the companies to use real time tracking technology. It may be that they consider it as an essential part of their system.
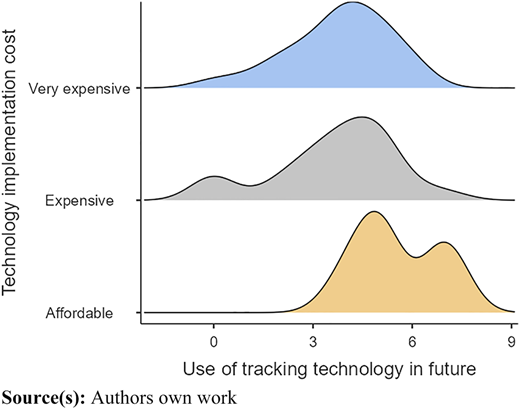
Density plot of cost of technology and willingness of companies to use real time tracking technology in future
Density plot of cost of technology and willingness of companies to use real time tracking technology in future
4.4.2 Influence of costs on the decision to use big data analytics technology in future
The Krushkal–Wallis test showed that different levels of cost significantly affect the plan to use big data analytics H(2) = 10.177, p = 0.006. In addition, the test revealed that there was a noteworthy difference (p < 0.05) between the mean ranks of at least one pair of groups. All three pairs of groups were also subjected to Dunn’s pairwise testing; this demonstrated strong evidence (p < 0.05, adjusted using Bonferroni correction) of a difference between the groups expensive-affordable and very expensive-affordable. There was no evidence of this between the other pairs. Table 10 shows pairwise comparisons of technology cost for big data.
Pairwise comparisons of technology cost for big data
| Sample 1-sample 2 | Test statistic | Std. error | Std. test statistic | Sig | Adj. sig.a |
|---|---|---|---|---|---|
| Expensive-Very Expensive | 4.396 | 4.797 | 0.916 | 0.360 | 1.000 |
| Expensive-Affordable | −19.532 | 6.171 | −3.165 | 0.002 | 0.005 |
| Very Expensive-Affordable | −15.136 | 6.096 | −2.483 | 0.013 | 0.039 |
Note(s): Each row tests the null hypothesis that the Sample 1 and Sample 2 distributions are the same
Asymptotic significances (2-sided tests) are displayed. The significance level is 0.050
aSignificance values have been adjusted by the Bonferroni correction for multiple tests
Source(s): Authors own work
Figure 11 shows the density plot of cost of technology and willingness of companies to use big data technology in future. Higher cost is deterring the companies from using big data technology. It may be that they consider it as a non-essential part of their system.
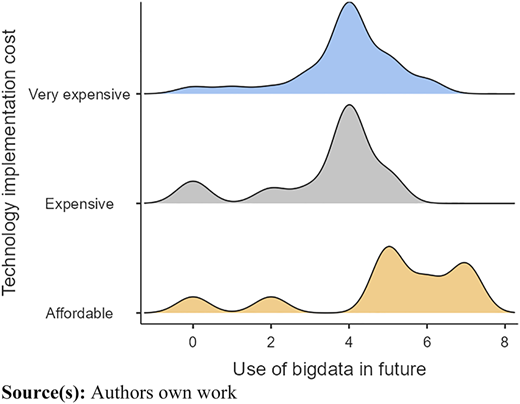
Density plot of cost of technology and willingness of companies to use big data technology in future
Density plot of cost of technology and willingness of companies to use big data technology in future
4.4.3 Regression coefficients of technology costs and effects on companies’ willingness to use real time tracking technology and big data in future
Regression analysis was conducted between technology costs and effects on companies’ willingness to use real time tracking technology and big data in future. In real time tracking, 21% variation and 33.8% variation in the big data was seen as a results of technology costs. Table 11 and 12 show the regression results.
Regression model fit measures
| Model | R | R2 |
|---|---|---|
| Technology implementation cost impact on the use of real time tracking technology in future | 0.210 | 0.0440 |
| Technology implementation cost impact on the use of big data in future | 0.338 | 0.114 |
Source(s): Authors own work
Regression model coefficients technology costs effect on real time tracking technology and big data use in future
| Predictor | Estimate | SE | t | p |
|---|---|---|---|---|
| Model coefficients – impact on real time tracking | ||||
| Intercept a | 1.500 | 0.118 | 12.68 | <0.001 |
| Technology implementation cost | ||||
| Expensive – Very expensive | 0.208 | 0.171 | 1.22 | 0.227 |
| Affordable – Very expensive | 0.318 | 0.217 | 1.47 | 0.148 |
| Model coefficients – Use of big data in future | ||||
| Intercept a | 3.885 | 0.312 | 12.46 | <0.001 |
| Technology implementation cost | ||||
| Expensive – Very expensive | −0.468 | 0.450 | −1.04 | 0.303 |
| Affordable – Very expensive | 1.115 | 0.572 | 1.95 | 0.056 |
Source(s): Authors own work
5. Discussions
Although technological transformation is required in logistics and supply chain businesses for ensuring competition and handling future crises, a limited number of businesses have undergone this transformation, despite substantial economic benefits. Our study attempted to understand empirically the impact of technology policy and implementation on operation, overall output and customer base in the logistics and supply chain sector during Covid-19 taking a case study in Oman.
Our analysis found that technology was used in logistics and supply chain before and during Covid-19, with the main usage being digital payment (21%), online platforms for businesses/trading (16%), e-invoicing platforms (13%), self-driving autonomous vehicles (13%), cloud services to work from home (13%), AI-based virtual assistants (7%) and sensor-based tracking systems (8%). The higher usage of online payment and platforms is due to the reasons of convenience. Apart from health reasons, consumers preferred an online system due to convenience and time saving (Puttaiah et al., 2020).
As far as companies are concerned, they mainly applied technology to HR, finance and operation. Overall, the combined implementation of automated HR, automated finance and automated operation received a higher percentage (32.8%) of attention in companies during Covid-19 as compared to (27.2%) before. The higher percentage of automation in operation is because during Covid-19 the governments asked the companies to take all necessary precautions including lowering number of employees in a shift and work from home.
Covid-19 has exposed weak areas of the traditional supply chain system, thus many organizations switched to online during this period according to Queiroz et al. (2020) and Ye et al. (2022). The companies surveyed used tracking technology for monitoring real time status (30%) and providing accurate information to customers (26%). They preferred to use AI or machine learning in demand patterns analysis (43%) and production (21%) in future. This finding is consistent with the expectations of researchers such as Naz et al. (2022) and Keshta et al. (2020), who reported a big push towards technology during Covid-19.
Moreover, our analysis revealed that the mean ranks of companies’ operation, overall output and customer base remained the same across the levels of digitization policy during Covid-19. Each company has different levels of digitization policies (below 25%, 25% to 49%, 50 to 74%, 75 to less than 100% and 100%) depending upon resources and policy makers. One positive outcome of the pandemic is in the form of business digitization (Pujawan and Bah, 2022; Sharma, 2020). The independent-samples Kruskal-Wallis test found that the companies’ operation and overall output were affected due to different levels of digitization policy, while no effect was observed on the customer base (increase/decrease). The reasons might be fewer businesses and willingness of customers to purchase, whether online or offline. So, the finding is consistent with the suggestions of Belhadi et al. (2021), Ivanov et al. (2019) and Nandi et al. (2021), who stated that logistics and supply chain companies can enhance their operations by using technology.
Furthermore, it was investigated if the distribution of companies’ operation, overall output and customer base remained the same across groups of technology implementation during Covid-19, and what impact this had. The independent-samples Mann–Whitney U test revealed that these companies’ operations and overall output were affected because of different levels of technology use, while no effect was observed on the customer base. There is clear evidence of the impact of technology on operation and outcomes and Chamola et al. (2020) reinforce that technology has been effective during the pandemic. Ultimately, technology is an enabler and contributor to operation, overall output and long-term sustainability in logistics and supply chain. This finding is consistent with the expectations of researchers such as Naz et al. (2022), who investigated the AI scope in supply chain risk mitigation through a systematic literature review of 162 articles published in the Scopus database. They found that the Industry 4.0 enabled technologies can play an important role in continuity of operation during disruption. Our finding that companies need to adapt to remain competitive is also consistent with that of Sarwani and Husain (2021), who asserted that technology is the main component of Industry 4.0.
There was a correlation between technology use/implementation and digitization policy with Spearman’s rho (r = 0.439, p < 0.001, N = 61) unveiling a moderate positive correlation, varying in the same direction, but of small value. There are numerous barriers to digital transformation, including firm characteristics, a lack of competent individuals, insufficient technological abilities, infrastructure a lack of technology road plans, and ecosystems. Additionally, digital transformation is much more than simply policy development; companies need to explore their finances and invest in its implementation. The surveyed companies plan to use goods tracking technology and big data analytics in future for monitoring real-time status, track product location, provide accurate information to customers, production, waste management and demand patterns analysis. When asked about tracking technology use, 30% plan to use it for monitoring real time status, 26% for providing accurate information to customers and 13% for both monitoring real time status and tracking product location. 43% of these companies preferred to use AI or machine learning in demand patterns analysis and 21% in production.
Additionally, it was inquired if the mean ranks of plans to use goods tracking technology and big data analytics remained the same across levels/categories of implementation cost of emerging technologies. The Independent-Samples Kruskal-Wallis test found a significant difference in the levels, althoughexpensive and very-expensive pairs were statistically insignificant for both big data analytics and goods tracking technology. It is important to understand the cost constraints of technology in the supply chain (Birkel and Hartmann, 2020) and that long-term strategy requires investment in digital solutions (Sombultawee et al., 2022; Hald and Coslugeanu, 2021). Digitization in supply chain requires restructuring of finances (Deaton and Deaton, 2020); however, once implemented technology such as AI has the advantages of low-cost analysis, processing and higher product outcomes.
In summary, the study has addressed the research question, “To examine the effect of digitization policy and actual use of technology on the companies’ operations, overall output and customer base during Covid-19. Analysis revealed that just 1.8% of businesses were able to completely implement digitization, and that most businesses were unable to use emerging technologies or carry out their digitization policies due to the high cost of technology. Table 13 shows the summary of the research findings.
Summary of the research findings
| S.N | Variables under investigation | Positive/Negative/Not significant |
|---|---|---|
| 1 | Impact of digitization on the operation of logistics and supply chain companies during Covid-19 | Positive |
| 2 | Impact of digitization on the overall outputs of logistics and supply chain companies during Covid-19 | Positive |
| 3 | Impact of digitization on the customer base of logistics and supply chain companies during Covid-19 | Not significant |
Source(s): Authors own work
6. Conclusion
Covid-19 has presented learning opportunities in the logistics and supply chain sector, where we can understand and explain the relationship between technology policy, actual implementation and effects on operations, outcomes and customer base. Our study found that, except for a few, a large percentage of logistics and supply chain companies continue to use technology. The technology use in HR, finance and operations increased by 13% during Covid-19 as compared to before. Online services such as digital payments, queries and invoicing remained on top, with AI, big data and cloud computing proving to be emerging trends. Moreover, the operation and overall output of companies saw positive changes due to digitization policy and technology adoption. There was no change in the number of customers, which might be for various reasons including a tendency to save money in a crisis. Additionally, although a moderate positive correlation exists between digitization policy and actual adoption of technology during Covid-19, there are significant differences in companies.
6.1 Managerial implications
The findings have serious implications for companies that facilitate and support the use of technology, for real-time monitoring, data privacy, integrity and transparency, to help in minimizing future shocks. Adapting to the dynamic and uncertain environment of a pandemic, meeting the expectations of customers and continuing operations, all need proper analysis of data for risks predictions, as explained by Ivanov (2021). It is possible that not all companies were able to implement the policy designed due to several factors such as infrastructure and finance. Logistics and supply chain companies failed to take up technology due to limited resources and no formal planning. Ultimately, the cost constraints of implementing the emerging technologies such as big data analytics were obvious. The surveyed companies plan to use goods tracking technology and big data analytics in future, provided it is affordable. Companies should adopt advanced business models and accelerate digitalization, use of automation and scaling-up for remote working. Company executives should invest in the telecommunications infrastructure to provide a better service in terms of network and Internet connectivity, along with providing their employees with the latest information and technology devices, software, and tools to increase their work productivity. Company executives should also develop plans and position themselves regarding the cost of implementing certain technologies. They can also develop multiple scenarios for triggering innovative and technological means to conduct their operations, accelerating the production process and investing in industry 4.0 technologies.
6.2 Limitation and future research direction
While the research has practical implications, it is not without flaws. For instance, the outcome of technology varies as per geographic area and people. The study was conducted in the Sultanate of Oman, a developing country in the Middle East region; therefore, it is difficult to generalize the outcomes suited to developed countries. The developed countries usually have a population quite used to the advanced technologies so some of the issues raised in the study might not work in the logistics and supply chain sectors of the developed countries. Such countries need separate studies. However, the replication of the study to the Gulf Cooperation Countries and to some extent other Arab countries is possible, since they have similar social and technological infrastructure with small variations. Nevertheless, the study has covered changes in operation, outcome, and customer base because of technology policy and adoption. We suggest further research in this area to cover other variables such as human resources and finance. For instance, the success and challenges faced by companies in digitization policy design, adoption and implementation and their effects on firms’ human resources and finance during Covid-19. Along with it similar studies could be conducted in the other Gulf Cooperation Countries and compared their responses and usage of the technology during Covid-19.
The paper received financial support from the Ministry of Higher Education, Scientific Research and Innovation, Oman. Grant No: RC/COVID-DVC/HURC/20/01.
Declaration of Competing Interest: The authors declare that they have no known competing financial interests or personal relationships that could have appeared to influence the work reported in this paper.
References
Appendix
Survey questionnaire used in the study
| S.N | Demographic information | Options/Values |
|---|---|---|
| 1 | Gender? | Male and Female |
| 2 | Nationality | Omani/Non-Omani |
| 3 | Position in the company? | Director, CEO, General Manager, HR Manager, Manager Finance, Operation, Employee and Others |
| 4 | Number of employees? | 50 and below, 51 to 100, 101 to 150, 151–200, 201 to 250, Above 250 |
| 5 | Head office location | Muscat, Al Dhahira, Al Batinah South, Al Batinah North, Al Wusta, Al Sharqiya North |
| Specific Questions | ||
| 1 | Your company’s balance sheet BEFORE Covid-19? | Positive, Negative |
| 2 | Your company’s balance sheet DURING Covid-19? | Positive, Negative |
| 3 | The operational capacity of your company BEFORE Covid-19? | Below 25%, 25 to 49 %, 50 to 74%, 75 to less than 100%, 100% |
| 4 | The operational capacity of your company DURING Covid-19? | Below 25%, 25 to 49%, 50 to 74%, 75 to less than 100%, 100% |
| 5 | The area of technological implementation in your company BEFORE Covid-19? | Automated HR, Automated finance, Automated operation, None |
| 6 | The area of technological implementation in your company DURING Covid-19? | Automated HR, Automated finance, Automated operation, None |
| 7 | Which of the technology you used BEFORE or DURING Covid-19? | Digital payment, online platforms for businesses/trading, e-invoicing platforms, self-driving autonomous vehicles, cloud services to work from home, AI-based virtual assistants, sensor-based tracking systems, and did not use any modern technology |
| 8 | Which of the technology you are planning to use in Future? | Digital payment, Drone/UAV for delivery, Self-driving autonomous vehicles, AI-based virtual assistants, Sensor-based tracking, e-invoicing platforms, online platforms for businesses/trading |
| Effects of digitization policy on the companies’ operations, overall output and customer base during Covid-19 | ||
| 10 | Your company’s digitization policy BEFORE Covid-19? | Below 25%, 25 to 49%, 50 to 74%, 75 to less than 100%, 100% |
| 11 | Your company’s digitization policy DURING Covid-19? | Below 25%, 25 to 49%, 50 to 74%, 75 to less than 100%, 100% |
| 12 | The company’s digitization policy DURING Covid-19 increased the company’s’ operation? | Below 25%, 25 to 49%, 50 to 74%, 75 to less than 100%, 100% |
| 13 | The company’s digitization policy DURING Covid-19 increased the overall company’s outputs? | Below 25%, 25 to 49%, 50 to 74%, 75 to less than 100%, 100% |
| 14 | The company’s digitization policy DURING Covid-19 increased the overall company’s customer base | Below 25%, 25 to 49%, 50 to 74%, 75 to less than 100%, 100% |
| Impact of actual use or adoption of technology on the companies’ operations, overall output and customer base during Covid-19 | ||
| 15 | The adoption of NEW technology DURING Covid-19 increased the company’s’ operation? | Below 25%, 25 to 49%, 50 to 74%, 75 to less than 100%, 100% |
| 16 | The adoption of NEW technology DURING Covid-19 increased the overall company’s outputs? | Below 25%, 25 to 49%, 50 to 74%, 75 to less than 100%, 100% |
| 17 | The adoption of online platforms businesses/trading increased the overall company’s customer base? | Below 25%, 25 to 49%, 50 to 74%, 75 to less than 100%, 100% |
| Influence of costs on technology use by logistics and supply chain companies | ||
| 18 | The cost of adopting NEW technology? | Very expensive, Expensive, Affordable, Cheap |
| 19 | Do you plan to use big data analytics technology in future? | Yes, No |
| 20 | Your recommendations for long term logistics and supply chain strategy? | |
Source(s): Authors own work

