Early-stage building design optimisation research often addresses environmental impact and cost separately, despite their interdependence. Many studies apply optimisation algorithms or machine learning models to minimise either carbon emissions or material cost – but rarely both within a unified framework. This fragmented approach risks suboptimal trade-offs, where cost-efficient designs may overlook carbon impacts and vice versa. To address this gap, this study conducts a systematic literature review to examine patterns, differences and shared practices in current research. It then proposes an integrative framework for building performance optimisation that accommodates diverse cost and environmental objectives, offering clear guidance for future studies.
About 18 peer-reviewed articles (2013–2023) were identified through Scopus and Web of Science and screened using PRISMA. A dialectical systems thinking lens guided analysis across concept, methodology and value dimensions. Nine key variables were extracted in content analysis, informing the development of a step-by-step integrative framework for life cycle performance optimisation that aligns design choices with cost and environmental objectives.
Most studies rely on NSGA-II, MOPSO and occasionally ANN, GPR and ELM to co-optimise life-cycle cost and carbon, often excluding other performance metrics. Tools like jEPlus + EA and MOBO lack BIM integration. This study introduces a nine-step framework linking methods, standards and tools to guide future optimisation research and practice.
This study offers a novel nine-step framework that synthesises fragmented optimisation practices in early-stage building design, linking concepts, methods and values. It provides a reproducible roadmap for balancing cost and carbon, guiding future research and supporting informed design decisions.
1. Introduction
Global awareness of buildings' environmental impacts has risen sharply with mandatory efficiency standards in major economies and national climate targets for 2050 (Amasyali and El-Gohary, 2018; Antipova et al., 2014). In response, companies increasingly pursue competitive advantage by reducing both carbon footprint and cost, there by intertwining sustainability with economic objectives (Palomares-Rodríguez et al., 2017). Such dual focus underscores technological competitiveness and environmental responsibility, making co-optimisation central to corporate strategy across sectors. This is especially critical in construction industry, which remains the largest GHG-emitting sector globally (IEA, 2019). Reflecting these priorities, recent studies highlight a steady growth of research on balancing building cost and environmental impact in building design, with co-optimisation emerging as a central theme (Sajid et al., 2024; Swarnakar and Khalfan, 2024).
National regulations and building codes initially focused primarily on minimising operational energy through efficient designs for heating, cooling, ventilation, and lighting (Almhafdy and Alsehail, 2023; Chen and Lai, 2025). However, attention has increasingly shifted towards embodied impacts associated with material production, transport, and installation (Dixit et al., 2010, 2012). Although mitigating embodied carbon often involves selecting low-impact materials, studies report that this can raise overall project costs by 20%–30% (Ross et al., 2007). Consequently, simultaneous assessment of environmental and economic factors has become crucial for informed decision-making. To address this need, researchers have increasingly employed integrated life cycle assessment (LCA) and life cycle costing (LCC) methods to jointly evaluate sustainability and cost objectives (Contarini and Meijer, 2015; Eisazadeh et al., 2025; Rodriguez et al., 2019; Kamari et al., 2022) In this paper, life cycle performance assessment refers to the combined assessment of life cycle cost (LCC) and life cycle assessment (LCA), unless otherwise stated.
Optimising trade-offs between building cost and environmental impact during architectural design requires evaluating parameters such as geometry (orientation, aspect ratio), spatial layouts (room arrangements), envelope elements (walls, roofs), and building services (HVAC, lighting). Traditional “white-box” frameworks which rely on single computational models, often require detailed input and expert knowledge (Hammad et al., 2019; Schwartz et al., 2021a; Touloupaki and Theodosiou, 2017; Venkatraj and Dixit, 2022). To streamline workflows, visual programming plugins (e.g., Grasshopper, Ladybug and Honeybee) have been widely adopted. While effective for operational energy analysis, their capacity to capture carbon emissions and cost implications remains limited (Amasyali and El-Gohary, 2018; Li et al., 2020).
Recent advances in computational power, particularly through efficient graphics processing units (GPUs), have accelerated the adoption of data-driven methods (Brown et al., 2020; Chen and Tan, 2017; Jain et al., 2014). Techniques such as optimisation algorithms, machine learning, and surrogate models are increasingly applied to predict building life cycle performance (Seyedzadeh et al., 2019; Singaravel et al., 2018). While training these models requires substantial computational resources, they enable efficient and accurate predictions with minimal inputs during design (Liu et al., 2020).
Although research into optimisation algorithms and machine learning for building performance assessment has grown significantly, most studies continue to emphasise operational energy, while giving limited attention to carbon emissions and cost analysis (Hong et al., 2020; Kubwimana and Najafi, 2023; Naganathan et al., 2016). Given this gap, there is an urgent need for a systematic review that consolidates prior work into a structured framework to guide future research on integrated life cycle performance optimisation. This review specifically focuses on studies jointly addressing cost and carbon emissions, thereby offering a holistic understanding of combined environmental and economic life-cycle objectives.
The aim of this paper is to systematically review literature on building performance optimisation, with particular focus on studies that simultaneously optimise cost and carbon emissions using optimisation algorithms and machine learning models. The goal is to propose an integrated framework that future researchers and practitioners can adopt to optimise these critical life-cycle objectives jointly.
This research addresses the following questions:
What is the role of optimisation algorithms and machine learning models in building life-cycle performance optimisation?
How can these methods be effectively applied to optimise life-cycle performance?
What practical value do optimisation algorithms and machine learning models offer for enhancing cost and carbon efficiency in architectural design? To tackle these research questions, the paper addresses the following objectives:
To collect and systematically analyse papers published over the past decade that have investigated building cost and carbon emission optimisation, using the PRISMA method.
To apply dialectical systems thinking for a detailed content analysis of each selected paper across three dimensions: concept, methodology, and practical value.
To extract key variables representing similarities across papers, aiding in the development of the proposed framework.
To develop an integrated framework for optimising life cycle performance that synthesises insights from the reviewed literature
Although prior studies often address environmental and economic dimensions separately, a significant gap remains in their integration. By simultaneously considering carbon emissions and life-cycle cost (LCC), this research bridges these two critical domains, supporting informed decision-making during the design phase. The novelty of this study lies in its systematic consolidation of fragmented literature and the proposition of a comprehensive integrated framework to guide the co-optimisation of cost and carbon emissions in architectural design.
2. Research background and methodology
Several reviews have evaluated data-driven and optimisation methods in sustainable building design. Baduge et al. (2022) showed that machine-learning models can accurately predict material properties, enabling more cost-effective and eco-friendly material choices. Evins (2013) provided one of the earliest comprehensive surveys of computational optimisation, primarily genetic algorithms, applied to façade form, daylighting, solar technologies, and retrofits. That review showed that approximately 60% of studies focused on minimising energy use, often incorporating cost metrics such as construction, operational, and life-cycle costs. However, given the rapid advances in computational power over the past decade, there is a need to re-examine optimisation objectives beyond operational energy, particularly those addressing LCC and LCA trade-offs.
Recent research has started to address this gap by integrating life-cycle cost and carbon considerations. For example, Markowska et al. (2022) highlighted the potential of machine learning to enhance the accuracy of life-cycle costing, while Xue et al. (2022) combined artificial neural networks with multi-objective optimisation to produce Pareto-optimal trade-offs between lifecycle cost and CO2 emissions. Other studies have applied multi-objective optimisation to diverse building applications, including residential envelope design (Fesanghary et al., 2012), energy retrofits (Antipova et al., 2014), insulation and thermal comfort (Carreras et al., 2015), and façade refurbishment (Schwartz et al., 2016), demonstrating simultaneous cost–carbon optimisation. Despite these advances, a recent critical review (Zhou et al., 2023) noted that fundamental design variables such as floor count, aspect ratio, floor area, and wall finishes remain relatively underexplored.
However, when viewed across the broader literature, studies that truly integrate both LCC and LCA remain scarce. The vast majority of prior work has either prioritised operational energy or treated cost and carbon in isolation, with only a handful of recent papers attempting genuine co-optimisation. This imbalance represents a critical deficiency in the field, given that cost–carbon trade-offs are central to sustainable decision-making during design.
Taken together, these advances and gaps highlight the need for an integrated perspective. To address this, the present review applies a dialectical systems-thinking (DST) framework to examine how optimisation algorithms and machine-learning approaches have been conceptualised, implemented, and evaluated in building performance studies.
2.1 A dialectical system thinking framework
This review adopts dialectical systems-thinking (DST) as its theoretical foundation for examining how optimisation algorithms and machine-learning methods are applied to building life-cycle performance. As a branch of general systems theory, DST provides a structured way of understanding complex systems by identifying and integrating multiple, often conflicting perspectives into a coherent whole (Pan and Ning, 2014). It emphasises that design, environmental, and cost factors interact as interdependent elements of a single system, where trade-offs and contradictions must be addressed rather than ignored. By framing life-cycle performance as a “dialectical system”, a network of essential, interrelated viewpoints, DST ensures that no critical perspective is overlooked (Pan et al., 2018; Pan and Ning, 2015).
DST is operationalised through a four-fold schema—ontology, epistemology, methodology, and axiology— that has been applied across diverse areas of sustainable construction research including studies of sustainable buildings (Pan and Ning, 2015), system boundaries of life cycle carbon emissions (Pan et al., 2018), off-site technologies in construction (Pan, 2011), and BIM-LCA integration (Teng et al., 2022). Fourfold thinking separates ontology, defining the phenomena; epistemology, explaining how knowledge about them is gained; methodology, specifying the analytical tools; and axiology, setting the practical value criteria for interpretation. This review merges ontology and epistemology as the “concept” lens, with studies analysed through the three dimensions of concept, methodology, and practical value for systematic comparison.
3. Data gathering and analysis process
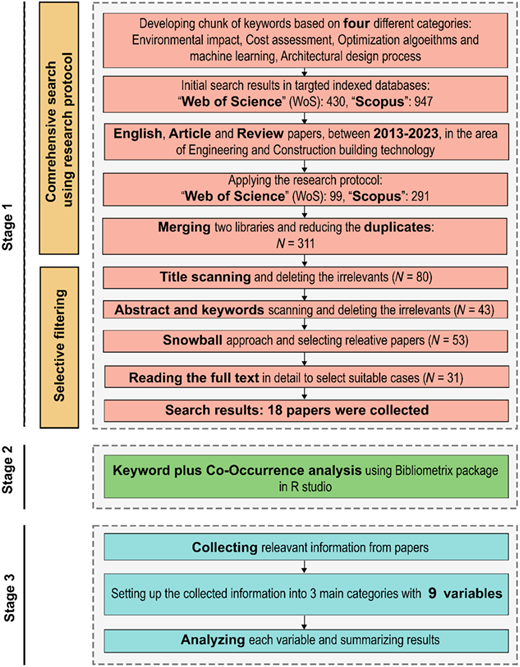
To collect and analyse the papers, this study proposes the following three-stage process: keyword search and case selection, Scientometric analysis, and content analysis. This process is aligned with the general structure of a systematic literature review, which comprises a three stage of planning, conducting and reporting (Hon et al., 2022). First, a research protocol was developed to have transparent, unbiased and detailed plan for conducting the review, and to ensure the reproducibility of the results. Second, scientometric analysis was conducted in R studio using Bibliometrix package to visualise the state of research in the field. Finally, the content analysis revealed the dialectics within concept, methodology and practical value dimensions throughout the selected studies. Figure 1 illustrates the details.
3.1 Database and search terms
To identify relevant keywords for this research and select suitable databases, an initial search was conducted using Google Scholar. The preliminary results indicated that most related papers were indexed in Scopus and Web of Science (WoS). Consequently, these two databases were chosen for further searches using relevant keyword combinations. Related keyword combinations were developed by combining terms from four different categories:
The first category belongs to environmental assessment which contains keywords such as (“Sustainability assessment*” OR “Embodied Carbon emission*” OR “Life cycle assessment*” OR “LCA”). The second category concerns cost assessment and includes (“construction material* Cost*” OR “Life cycle cost assessment*” OR “LCC” OR “cost estimat*”). Next is the keywords related to optimisation and ML methods which contains keywords like (“Machine learning” OR “Artificial neural network*” OR “AI” OR “ANN”).
To limit the search process to “architectural design process”-the scope of research- and not “Infrastructure”, “Bridge design”, “Asset management”, and “Concrete mixture”, the above-mentioned keywords were compiled with a fourth series of keywords related to architecture design process such as (“building design*” OR “building design process” OR “building construction*”). It should be mentioned that asterisk “*” was used to search for all the variations of keywords. To check the full list of keywords, see Supplementary_material_appendix_1.
3.2 Inclusion criteria and selection process
Three inclusion criteria were employed to select papers for further analysis. First, following the systematic literature review conducted by Hon et al. (2022), the language of publication was set to English and only papers published in academic journals were considered (meaning the exclusion of books, conference proceedings, reports), in the form of an article or review paper. Second, the time frame was set from the beginning of 2013 to the end of 2023, as it was mentioned in the literature that using optimisation algorithms in building studies has grown exponentially since 2013 due to thr affordability of GPUs for conducting computational analysis (Nadia Maaz et al., 2018). Third, to focus on papers related to building and the design process, the research category was set to engineering and construction building technology.
After applying the research protocol, a total of 390 papers were initially identified and imported to Mendeley, and the duplicate papers from different databases were removed. The remaining 311 papers were subjected to title scanning, followed by abstract and keyword scanning, and irrelevant papers were excluded. Meanwhile the snowball approach was also applied, which refers to using reference lists of a paper to identify additional related papers. This approach has been used in previous literature reviews to ensure coverage of important works not retrieved through the search process (Teng et al., 2022). Eventually, 53 papers were selected for full-text reading in detail. From these, 18 papers were selected for reporting in this paper. These papers are indicated with an “*” in the references. Analysis and discussion.
3.3 Scientometrics analysis
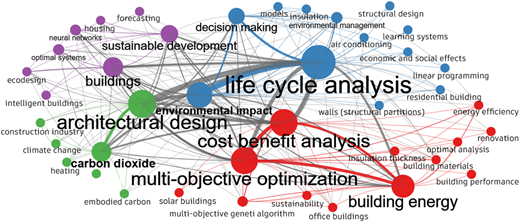
Keyword co-occurrence analysis maps pairs of terms appearing at least twice together in the literature. This study employs “keywords plus”, which derives additional terms from cited references to uncover concepts relevant to the content but not listed by authors. Research shows that keyword plus performs comparably to the author-assigned keywords for bibliometric analysis, effectively revealing emerging trends and providing deeper, more varied insights into reviewed papers (Zhang et al., 2016).
This analysis was conducted in Rstudio using the Bibliometrix package (Aria and Cuccurullo, 2017), assuming each co-occurrence shows a positive correlation between the concepts (Narong and Hallinger, 2023). The number of nodes was defined as 50 keywords. Accordingly, a filtering process was conducted by merging synonyms that differed by only one word (e.g., “Cost benefit analysis” and “Cost analysis”), combining terms that denote the same concept (e.g., “multi-objective genetic algorithm” and “genetic algorithms”), and unifying singular and plural forms (e.g., “embodied carbon” and “embodied carbons”). This process yielded 41 keywords.
Figure 2 illustrates that four different clusters were identified. Node size reflects keyword frequencywhile line thickness indicates the closeness of conceptual relationships. The analysis highlights five significant topics in the field: “life cycle analysis”, “architectural design”, “environmental impact”, “cost benefit analysis”, and “multi-objective optimisation”, all of which are strongly connected across clusters. These clusters provide a structured map of the research landscape, revealing dominant themes and underexplored links. They serve as a quantitative foundation for the subsequent content analysis and directly inform the development of the integrated framework by identifying which concepts, methods, and value dimensions are most critical to building performance optimisation. The scientometric clusters scope the conceptual landscape and expose gaps that the review investigates in depth. In this study, these quantitative insights inform research question 1 (RQ1) by clarifying how optimisation and ML are positioned in the field, guide RQ2 by signalling which methodological families dominate or are missing, and motivate RQ3 by highlighting where cost–carbon efficiency outcomes are emphasised or overlooked.
3.4 Content analysis
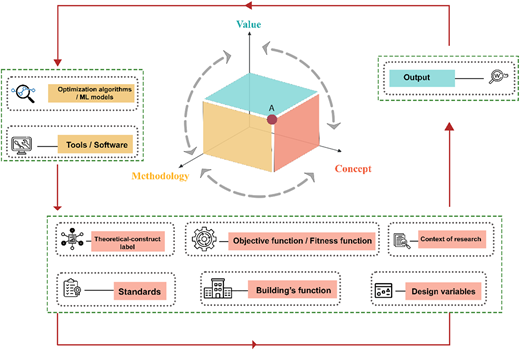
The content analysis is organised around three dimensions—concept, methodology, and practical value—to map the literature directly to the study's research questions. The concept dimension addresses RQ1 by showing how optimisation and ML are framed (e.g., method, model, framework, decision tool) and which problem definitions and assumptions are adopted. The methodology dimension addresses RQ2 by examining algorithms, surrogates, standards, data sources, tools, and variable design spaces. The practical value dimension addresses RQ3 by assessing the contribution of these approaches to enhancing cost and carbon efficiency in architectural design (e.g., Pareto fronts, trade-off quality, decision support).Overall, 9 variables were identified, with six, two, and one variable in the concept, methodology, and practical value dimensions, respectively, as illustrated in Figure 3.
3.4.1 Dialectics found in relation to concept
3.4.1.1 Theoretical-construct label
Paper titles often embed the core theoretical construct, using terms such as method, framework, conceptual framework, decision-support tool, or model (Teng et al., 2022). By identifying each paper's theoretical-construct label and the way problems are framed, the concept analysis clarifies the role of optimisation and ML in life-cycle performance (RQ1). Identifying each paper's theoretical-construct label shows how the authors frame their work, allows comparison of otherwise disparate methods on equal terms, and exposes patterns in the design choices that follow.
Method: Within life-cycle performance optimisation, a method is an integrated sequence of actions for gathering data, analysing it, and presenting results. Data collection typically relies on sources such as energy-simulation databases (e.g., Carreras et al., 2015; Feng et al., 2019), cost records (e.g., Pal et al., 2017), or BIM-based quantity take-offs (e.g., Liu et al., 2015).
Analyses range from standard life-cycle assessment or cost estimation (Feng et al., 2019; Pal et al., 2017) to advanced techniques such as uncertainty assessment with machine learning and multi-objective optimisation that simultaneously minimise cost and carbon emissions(e.g., Schwartz et al., 2016). Many authors describe their work explicitly as a “method”—a step-by-step procedure—making it the most common theoretical-construct label in our set of papers (appearing seven times).
Framework and conceptual framework: A framework provides an overarching structure that integrates multiple methods to deliver a holistic, adaptable solution (Partelow, 2023). Examples often combine several optimisation routines with diverse data inputs and sometimes incorporate surrogate models to accelerate simulation (e.g., Ascione et al., 2017, 2019; Carreras et al., 2016). A conceptual framework, by contrast, maps theoretical relationships among phenomena, prioritising abstraction over technical detail. For instance, implementation (Miah et al., 2017) proposed an LCC–LCA integration framework that outlines relationships conceptually but does not specify optimisation implementation. In practice, frameworks emphasise practical deployment, while conceptual frameworks privilege theoretical coherence.
Decision-support tool: Decision-support tools translate analytical power into actionable guidance, typically comprising a database, software engine, and user interface. Although their roots lie in management-information research of the 1970s, they are still relatively new in construction management. Many remain prototypes without user interfaces, limiting usability and industry adoption (Schwartz et al., 2021b).
Model: A model is a mathematical, logical, or computational representation that simulates scenarios or predicts outcomes (Friedenthal et al., 2011). In optimisation studies, models include simulation-driven multi-objective formulations for energy, cost, and carbon (e.g., Sharif and Hammad, 2019a) as well as machine-learning predictors of life-cycle sustainability indices (Toosi et al., 2022) or environmental-cost assessments (Hamida et al., 2021). Hybrid approaches embed surrogate models into simulation-based optimisation to reduce computational load while maintaining accurate cost–carbon trade-offs (Sharif and Hammad, 2019b; Xue et al., 2022).
Table 1 Cross-maps five theoretical-construct labels to their most common objective sets, optimisation engines, and use of surrogate models across the 18 studies. It shows that methods address the broadest sustainability objectives (eight distinct metrics) with a wide range of classical algorithms and minimal surrogate use, reflecting an operational but simulation-heavy stance. Models, by contrast, focus on narrower cost–energy–carbon triads, often paired with advanced hybrid algorithms and heavy reliance on surrogates (4/5), highlighting a predictive and ML-driven orientation aimed at runtime reduction. Frameworks occupy a middle ground, typically using multi-objective GA variants with occasional surrogates (1/4), combining integrative structures with simulation-based analysis. Conceptual frameworks and decision-support tools are rarer, leaning on cost–carbon objectives with little or no surrogate modelling—emphasising theoretical mapping in the first case and practitioner usability in the second.
3.4.1.2 Standards
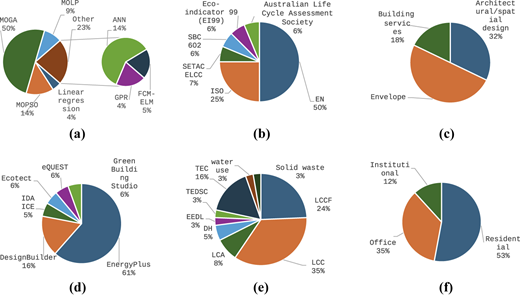
Figure 4(b) highlights the predominance of European standards: almost two-thirds of the reviewed studies adopt EN-series standards, most often BS EN 15978:2011 for building LCA and BS EN 15804:2012 for Environmental Product Declarations. Their prevalence in work carried out worldwide shows how the European regulatory ecosystem is shaping global research practice (Feng et al., 2019; Sharif and Hammad, 2019a; Toosi et al., 2022). BS EN 15978 replaces the traditional four-stage LCA boundary with an A–D modular framework: A1–A5 (product and construction), B1–B5 (use), C1–C4 (end-of-life), and D (beyond-system benefits).
ISO standards account for roughly one-quarter of the sample. ISO 14040/44 underpin environmental LCA (Carreras et al., 2016; Schwartz et al., 2016), while ISO 15686-5 guides life-cycle costing (Miah et al., 2017). Their lower, but still substantial, usage highlights a bifurcated standards landscape: ISO offers global legitimacy; EN delivers domain-specific detail. Many studies hybridise the two, pairing ISO methodological principles with EN boundary conditions to balance comparability and resolution (Feng et al., 2019; Miah et al., 2017; Toosi et al., 2022). The choice and combination of EN/ISO standards determine system boundaries, comparability, and data granularity, directly shaping how methods are applied to optimise life-cycle performance (RQ2).
The reviewed literature reveals fragmented data sources. Most papers source embodied-carbon factors from well-established databases such as ICE (Inventory of Carbon and Energy) (Feng et al., 2019; Heydari and Heravi, 2023; Shadram and Mukkavaara, 2022), and Ecoinvent (Carreras et al., 2015; Pal et al., 2017), complemented by regional inventories like CLCD (China) (Xue et al., 2022), and AusLCI (Australia) (Islam et al., 2015). In contrast, no universal cost database exists. Researchers fall back on builders' price books (Schwartz et al., 2021b), government economic indices (Toosi et al., 2022), historical market data (Pal et al., 2017) or commercial cost guides (Islam et al., 2015), creating methodological inconsistency and hindering reproducibility. Fragmented cost/impact data constrain method implementation and reproducibility, highlighting methodological limits relevant to RQ2.
3.4.1.3 Design variables
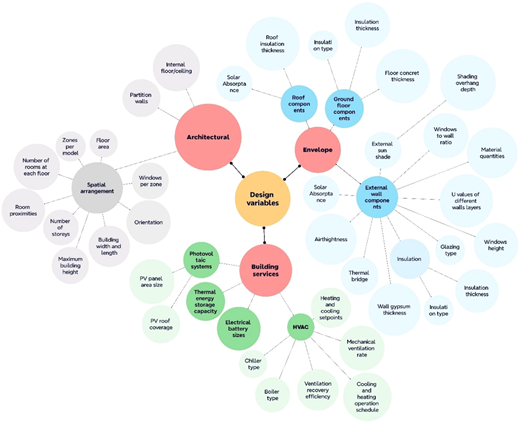
In Figure 5, 38 design variables were identified and grouped into three clusters: architectural, envelope, and building services. The percentage distribution of these clusters in the reviewed literature is illustrated in Figure 4(c). Architectural cluster (11 variables) is dominated by orientation, aspect ratio, floor depth, window-to-wall ratio, and related features. These early-stage geometric variables dictate solar heat gains and surface-area exposure, establishing the fundamental thermal loads that all later cost and operational energy optimisation (Ascione et al., 2019; Fesanghary et al., 2012; Sharif and Hammad, 2019b; Toosi et al., 2022), and cost and carbon emissions optimisation (Schwartz et al., 2016, 2021b) decisions must address.
The envelope cluster (17 variables) includes roof, ground-floor, and external-wall components. Adjusting insulation thickness, glazing U-value, airtightness, and fixed-shading depth can directly lower or raise annual heating and cooling energy demand, resize HVAC sustems and affect total capital cost (Ascione et al., 2019; Liu et al., 2015; Schwartz et al., 2016; Sharif and Hammad, 2019a; Toosi et al., 2022; Xue et al., 2022).
The building services cluster (10 variables) covers photovoltaic-system and HVAC attributes. Variables such as PV array area, roof coverage, inverter efficiency, thermal set-points, ventilation rate, chiller/boiler type & COP serve as high-impact levers that can directly shift annual operational energy demand, alter on-site renewable generation (reducing net grid use and carbon), and influence capital cost through equipment sizing (Ascione et al., 2017; Pal et al., 2017; Sharif and Hammad, 2019b). The selection and clustering of design variables define the search space and sensitivity pathways through which optimisation/ML are effectively applied (RQ2).
3.4.1.4 Objective functions
Figure 4(e) illustrates the variety of different objective functions in the reviewed studies. The search strategy deliberately centred on LCA and LCC; it is therefore expected that variants of these objectives constitute the majority of the dataset. Even with this built-in bias, however, the split across objectives is instructive:
LCC (35%) and life-cycle carbon footprint, LCCF (24%) together outnumber all other objectives, confirming a research agenda that treats cost and embodied carbon as the primary optimisation targets. Thermal energy consumption (TEC 16%) forms a clear secondary tier, indicating continued but smaller interest in operational performance relative to embodied metrics.
Generic LCA (8%) along with the remaining resource or comfort indicators-solid waste, water use, daylight/heating trade-off (DH), Electrical energy demand for lighting (EEDL) and thermal energy demand for space conditioning (TEDSC)- each appear in only around 3% of studies.
The objective mix (LCC, LCCF, TEC, etc.) governs algorithm design and evaluation (RQ2) and sets the basis for demonstrating practical value in cost–carbon efficiency outcomes (RQ3).
3.4.1.5 Building function
Building function emerges as a key dialectic, showing how optimisation studies target different typologies. In the reviewed corpus, residential (53%), office (35%), and institutional (12%) buildings dominate-see Figure 4(f). The relative neglect of commercial buildings is striking, given their disproportionate material-related GHG emissions-which are forecast to rise from 3.5 Gt CO2 eq in 2020 to 4.6 Gt CO2 eq by 2060 (Zhong et al., 2021). Future work must extend performance-optimisation frameworks into the commercial sector to address this growing emissions hotspot. Typology focus frames the role and transferability of optimisation/ML (RQ1) and conditions the practical value achieved in cost–carbon outcomes across use cases (RQ3).
3.4.1.6 Context of research
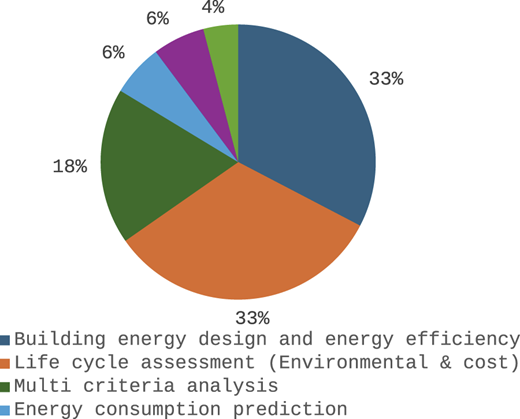
By mapping author keywords into six thematic clusters (Figure 6), the “research context” emerges as a core dialectic shaping study scope and tool maturity. These clusters include:
BIM-parametric design and optimisation/ML
Energy-efficiency modelling
Life-cycle assessment (environmental impact and cost)
Multi-criteria analysis
Although most studies focus on energy efficiency and life-cycle assessment, the limited integration of BIM with parametric design and machine-learning workflows represents a significant gap. This imbalance constrains methodological sophistication and the maturity of BIM-based optimisation tools; advancing the BIM-ML-optimisation nexus is therefore essential to drive genuine innovation in building performance research. The maturity of BIM-parametric-ML integration indicates how methods are (or are not) applied effectively (RQ2) and where improved workflows could yield higher cost–carbon efficiency in practice (RQ3).
3.4.2 Dialectics found in relation to methodology
3.4.2.1 Optimisation algorithms and ML models
Figure 4(a) splits the methods into optimisation algorithms (77%) and ML-based surrogates (23%), revealing distinct strengths, gaps, and emerging trends:
Optimisation algorithms (77%)
Multi-objective Genetic Algorithms (MOGAs) (50% overall): NSGA-II is used in half of all studies for its ability to generate diverse Pareto fronts across cost (LCC, investment cost), carbon (LCA, embodied CO2), and energy (annual HVAC loads) objectives. Its prevalence underscores evolutionary search as the workhorse for multi-criteria building performance problems.
Multiple Objective Particle Swarm Optimisation (MOPSO) (14%): By extending single-objective PSO into the multi-objective domain, MOPSO delivers Pareto-optimal solution sets faster than many GAs, trading exhaustive exploration for designer-friendly compute times (Feng et al., 2019; Ascione et al., 2017).
Single/Multi-objective Linear Programming (LP) (7%): Weighted-sum LP models with LCC and LCEI constraints appear sporadically (Islam et al., 2015) and remain under-explored despite their guaranteed optima; full MOLP applications in building life-cycle performance needs deeper investigation (Miah et al., 2017).
ML-based surrogates (23%)
ANNs (14%): The most common surrogate, ANNs emulate expensive energy or carbon simulations to slash runtime and integrate seamlessly with GAs in surrogate-assisted optimisation workflows (Xue et al., 2022).
Linear regression (4%): Rarely deployed as optimisers, linear models serve primarily as baseline benchmarks for ANN accuracy (Hamida et al., 2021).
ELM + Fuzzy C-Means (5%): Combining fast-learning ELM with fuzzy clustering to quantify design-variable uncertainty shows promise for early-stage prediction of environmental impact, but examples remain limited (Feng et al., 2019; Huang et al., 2006; Zhang, 2012).
The reviewed literature shows that the field leans heavily on GAs and MOPSO for their black-box flexibility, yet the large number of simulation runs they demand highlights a need for more efficient or hybrid optimisers (e.g., NSGA-III, hybrid swarm-GA). ANNs and ELMs are gaining popularity because they offer a good trade-off between accuracy and speed. However, since most studies don't report checks on model accuracy, like cross-validation scores or error margins, it's hard to judge how reliable their results really are. Classical optimisers (LP/MOLP) and newer metaheuristics are under-represented; benchmarking these against established evolutionary approaches could reveal more efficient pathways. Integrating advanced metaheuristics with rigorously validated surrogates and standardised performance metrics will be crucial to advance both methodological sophistication and practical tool readiness in building performance optimisation. The algorithm/surrogate patterns (evolutionary search, LP/MOLP, hybrid surrogates) and validation practices summarise how these methods are effectively applied to life-cycle optimisation (RQ2).
3.4.2.2 Tools
The five most common optimisation tools in the reviewed literature are jEPlus + EA, MOBO, GenOpt, MATLAB–TOMLAB, and pymoo which share core features but differ in scope, maturity, and integration.
jEPlus + EA is tailored for EnergyPlus parametric studies with turnkey workflows for building-energy simulations, is proprietary freeware locked into the EnergyPlus ecosystem without a built-in BIM/plugin interface, making it ideal for rapid prototyping of EnergyPlus-only optimisations when coding resources are limited. MOBO is a free tool that works with any simulation engine and handles single- and multi-objective searches right away, but its weak documentation and closed design make troubleshooting difficult, so it's best for fast, budget-conscious studies that don't require heavy customisation (Osmo Palonen et al., 2022). GenOpt is a free, open-source tool that handles single-objective optimisations with proven reliability across engines like EnergyPlus and TRNSYS, but it can't do multi-objective searches and needs manual text-file setup, making it best for straightforward life-cycle cost or carbon benchmarks across different simulation platforms. MATLAB–TOMLAB is a commercial MATLAB toolbox that connects directly with EnergyPlus and TRNSYS and leverages MATLAB's powerful data-processing tools, but it needs a paid licence, has no real-time BIM plugin, and relies on slow export–import cycles, so it's best for MATLAB-centric teams needing advanced modelling or custom solver setups (Xuan Nghiem and Nghiem, 2015). Pymoo is a free, open-source Python library that plugs seamlessly into any simulation pipeline with powerful multi-objective algorithms but requires Python coding skills and has no GUI or BIM plugin, making it ideal for research prototypes needing custom, automated workflows (Shadram and Mukkavaara, 2022).
Because none of the tools integrate directly into Rhino, Revit, or SketchUp, architects with limited optimisation or coding expertise must export models, run simulations externally, and then manually reimport results. Developing lightweight plugins or drag-and-drop connectors would allow real-time updates within familiar design environments. Hybrid workflows, combining linear programming's guaranteed optima with evolutionary algorithms' Pareto-front diversity, or embedding fast AI surrogates (ANN/ELM) into platforms like jEPlus + EA, MOBO, or pymoo, could deliver optimisations that are both quicker and more reliable. Selecting the appropriate tool based on project needs, whether an EnergyPlus-focused solution, an engine-agnostic freeware, a MATLAB toolbox, or a Python library, will streamline the design process and advance building-performance research.
All software, plugins, libraries, and tools identified across the reviewed papers are categorised by functional type and application, ranging from 3D modelling and energy simulation to LCA, optimisation, ML, energy rating, programming, and parametric extensions. The visualisation of this taxonomy can be found at Supplementary_material_appendix_2. Toolchain integration influences implementation fidelity and turnaround time (RQ2) and ultimately the decision usefulness of results for achieving cost–carbon efficiency (RQ3).
3.4.3 Dialectics found in relation to practical value
3.4.3.1 Outputs
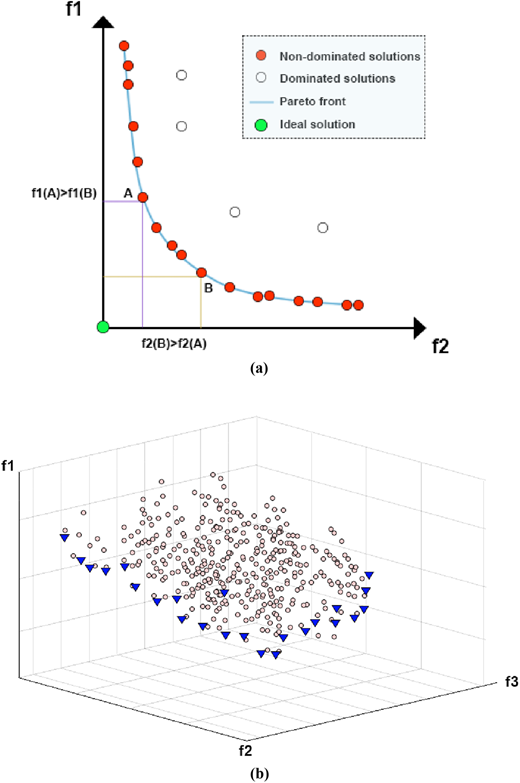
The final results always appear as a Pareto front, the set of best solutions where improving one objective means sacrificing another.
Two objectives (Figure 7(a)): Shown on a 2-D curve (red dots), each point balances f1 against f2. Designers simply choose among these efficient options rather than wading through all inferior ones.
Three objectives (Figure 7(b)): Shown on a 3-D surface (blue markers), each point balances f1, f2, and f3. This makes it easy to spot the “knees” in the surface where overall performance is highest.
Almost every paper in our review uses one of these two visual formats. By presenting results this way, decision-makers can quickly see the trade-offs and pick the solution that best matches their priorities. The quality and interpretability of Pareto fronts, identification of “knee points,” and the presence of decision-support interfaces collectively indicate the practical value of optimisation/ML for enhancing cost and carbon efficiency (RQ3).
3.4.4 An integrative building life cycle performance optimisation framework
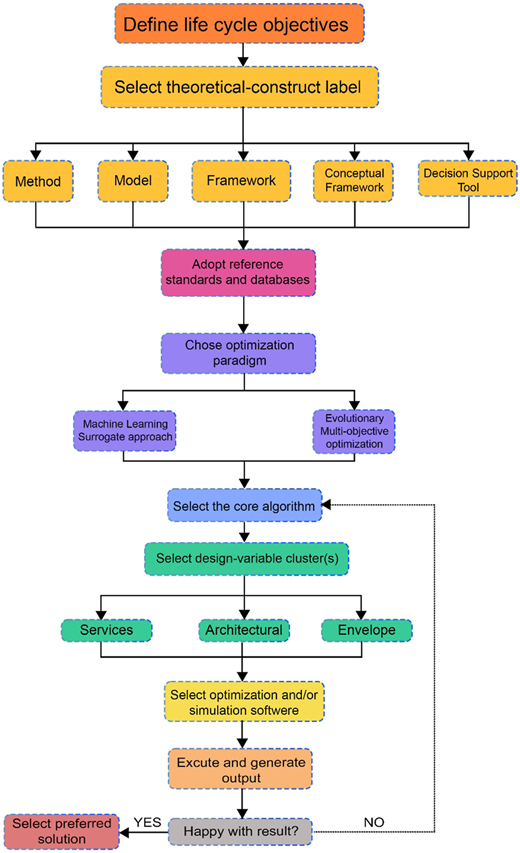
Drawing on our analysis of eighteen papers, we identified nine recurring variables and observed how they interact (Section 3.2). Each step in the framework (Figure 8) corresponds to one or more of these variables and reflects a common practice (or gap) found in the literature. Steps 1–5 (objectives, construct label, standards/databases, optimisation paradigm, core algorithm) operationalise how optimisation/ML are applied (RQ2) within the roles clarified by the conceptual framing (RQ1). Steps 6–9 (design variables, software, outputs, iteration/convergence) demonstrate practical value by producing transparent cost–carbon trade-offs and actionable decision support (RQ3).
Define life-cycle objectives
A clear, specific articulation of objective functions-such as embodied carbon, life-cycle cost, or combined metrics-is foundational to any optimisation workflow. In the context of this review, precisely defining these objectives ensures that subsequent steps (e.g., algorithm selection, variable choice) align with the intended balance between environmental impact and economic performance. By establishing well-scoped, measurable targets upfront, the framework provides a transparent baseline against which all modelling decisions and trade-off analyses can be evaluated.
Select theoretical-construct label
Assigning a theoretical-construct label clarifies whether an approach emphasizes a procedural workflow (method), leverages predictive ML capabilities (model), integrates multiple components (framework), maps theoretical relationships (conceptual framework), or targets practical guidance (decision-support tool). Choosing the right label-word, title, or descriptor-is crucial because terminology shapes expectations about scope, rigour, and intended contributions.
Adopting standards and databases
Selecting appropriate life-cycle standards (e.g., EN, ISO) and reliable databases (e.g., ICE, Ecoinvent) is essential for methodological rigour and comparability. Consistent adoption of well-established data sources ensures that embodied carbon factors and cost inputs are credible and reproducible. In this context, choosing the right database underpins accurate quantification of material and energy impacts, forming a solid foundation for all subsequent optimisation steps.
Choosing optimisation paradigm
Selecting between evolutionary multi-objective algorithms (e.g., NSGA-II, MOPSO) and ML-based surrogates (e.g., ANN, GPR, ELM) determines the balance between exploration of diverse design alternatives and computational efficiency. In this review's context, identifying the appropriate paradigm ensures that solution quality, convergence speed, and uncertainty handling align with defined life-cycle objectives. A careful choice here steers the entire workflow-establishing whether the focus will be on exhaustive Pareto exploration or surrogate-assisted acceleration-thus shaping subsequent algorithm implementation and validation.
Selecting core algorithm
Selecting the most suitable algorithm at this stage ensures that the optimisation process matches the problem's complexity, dimensionality, and available computational resources, thereby improving reliability and reproducibility.
Selecting design variables
Identifying the appropriate subset of design variables is critical for targeting factors with the greatest influence on life-cycle objectives. By explicitly aligning variable selection with defined goals, the framework enhances optimisation efficacy and ensures resources focus on high-impact parameters.
Selecting software
Choosing the appropriate tools—pairing optimisation libraries or platforms (e.g., pymoo, jEPlus + EA, TOMLAB) with simulation engines (e.g., EnergyPlus, TRNSYS, BIM environments)—is vital for establishing seamless data flow and automating analyses. In the reviewed papers, many workflows required manual export–simulate–import loops, undermining efficiency. By explicitly selecting software that integrates optimisation and simulation, the framework promotes streamlined execution and reduces potential errors.
Executing and generating outputs
Almost every paper presents results as static 2-D or 3-D Pareto fronts. By running the configured model here, users obtain the set of non-dominated solutions and visualize trade-offs. Including this as a standalone step underscores that while Pareto charts are ubiquitous, the literature lacks any exploration of stakeholder interaction, something future work should remedy.
Iterating and converge
Only a few studies describe refund loops (e.g., re-running optimisation after adjusting variables), and convergence criteria vary widely. This final step formalises iterative refinement: users compare outputs against objectives and revisit earlier steps (e.g., change the algorithm, tweak variables, or adjust standards) until an acceptable solution set is achieved.
4. Conclusion, limitations and future directions
Balancing life-cycle cost and carbon emissions from the outset of design is crucial for achieving truly sustainable buildings. This review highlights several critical insights: most studies prioritise evolutionary algorithms (e.g., NSGA-II, MOPSO), with limited uptake of linear programming or rigorously validated surrogates; cost data remain fragmented, hindering comparability; and widely used optimisation tools still lack integration with BIM or interactive decision interfaces. These findings underline the need for methodological innovation and stronger data foundations if optimisation and machine learning are to realise their full potential in guiding sustainable design decisions. Our analysis further shows that optimisation studies predominantly frame their approaches as “methods” or “models,” focusing on multi-objective evolutionary algorithms and, to a lesser extent, machine-learning surrogates (e.g., ANN, GPR, ELM). Objective functions typically co-optimise life-cycle cost and carbon emissions. Design variables cluster into architectural, envelope, and building-services categories. Tools such as jEPlus + EA, MOBO, and GenOpt are widely used but remain detached from BIM integration, limiting usability in practice, and workflows often rely on manual processes. Standards adoption is split between EN and ISO, while cost data sources remain fragmented and non-standardised, due to their relevance to geography.By synthesising these practices into a nine-step evidence-based framework, this study provides a structured roadmap linking objectives, algorithms, standards, tools, and variables. The framework exposes dominant patterns (e.g., reliance on NSGA-II and EN standards) and highlights persistent gaps: the underuse of LP/MOLP approaches, inconsistent validation of surrogate models, limited decision-support functionality, and the lack of lightweight BIM-integrated optimisation tools.
This review has certain limitations. First, it relies primarily on secondary data reported in the reviewed studies, which may reflect inconsistencies in assumptions, datasets, or reporting standards. Second, the search was limited to English-language publications, and relevant studies in other languages may have been excluded. Third, while the proposed nine-step framework synthesises patterns observed in the literature, it remains conceptual and will require empirical validation in real-world design contexts. These limitations should be considered when interpreting the findings, and they also point to important opportunities for further research.
Future research should prioritise validated surrogate models, standardised cost–carbon datasets, and lightweight BIM-integrated optimisation tools. In particular, the proposed framework can be applied in three concrete ways. First, as a research protocol, it provides a structured basis for systematically comparing optimisation methods across different building typologies and climates, using harmonised objectives, variable sets, and evaluation metrics. This would help identify which algorithms or ML models are most effective under different design and regulatory conditions. Second, as a practical workflow, the framework can be embedded into BIM environments such as Revit or Rhino–Grasshopper, allowing designers to run cost–carbon trade-off analyses directly within their modelling tools and receive real-time feedback during the design process. This would reduce the current reliance on external, manual workflows and make optimisation accessible to practitioners. Third, as a policy-support tool, the framework offers an evidence base for developing standardised cost–carbon benchmarks and guidelines that can be incorporated into building codes and national climate strategies. This would enable regulators to set consistent performance thresholds and incentivise low-carbon, cost-effective design practices. Together, these applications would not only validate the framework but also extend its relevance from academic research into practice and policy.
Future research should also incorporate stakeholder and industry validation of the framework. Engaging architects, engineers, and policymakers in pilot applications would test its usability, highlight real-world barriers, and encourage cross-disciplinary collaboration. Such engagement would ensure the framework's relevance to practice and accelerate its translation into industry adoption.
This work was supported by a Ph.D. scholarship from Building 4.0 CRC. The authors gratefully acknowledge the Commonwealth of Australia for its support through the Cooperative Research Centres Program. This study is a systematic review of previously published literature and did not involve human participants or animals; therefore, no ethical approval was required. The authors made limited use of an AI-assisted editing tool (ChatGPT) for minor grammar and language refinement. All aspects of research design, analysis, interpretation, and synthesis of the review were conducted solely by the authors.
Appendix 1 List of keywords search:
Environmental assessment keywords:
(“Sustainability assessment*” OR “embodied Carbon emission*” OR “Life cycle assessment*” Or “LCA” OR “coefficient of carbon” OR “Life cycle impact assessment” OR “LCIA” OR “Life cycle analysis” OR “Life cycle inventor*” OR “LCI” OR “carbon dioxide” OR “carbon” OR “emission*” OR “LCA and LCC integration” OR “carbon emission* and cost optimi*” OR “Carbon and cost optmi*” OR “life cycle emission*” OR “life cycle greenhouse gas emission*” OR “life cycle GHG emission*” OR “life cycle carbon and cost optimi*” OR “LCA and LCC optimi*” OR “LCA and LCC assessment” OR “LCA and LCC integration” OR “GHG emission*” Or “carbon emission* optimi*” OR “Carbon emission*” Or “construction material* carbon emission*” OR “material quantit*” OR “Bill of quantity” Or “BOQ” OR “embodied energy” OR “embodied energy assessment” Or “embodied”)
Cost assessment keywords:
(“construction material* Cost*” OR “Life cycle cost assessment*” OR “LCC” OR “cost estimat*” OR “cost prediction” OR “Construction cost*” OR “buildings cost estimation*” OR “cost optmization” OR “cost optimisation” OR “Cost-benefit analysis” OR “LCA and LCC integration” OR “carbon emission* and cost optimi*” OR “Carbon and cost optmi*” OR “life cycle carbon and cost optimi*” OR “LCA/LCC optimi*” OR “LCA/LCC assessment” OR “LCA/LCC integration” Or “Construction material cost*” OR “material quantit*” OR “Bill of quantity” Or “BOQ”)
Optimization and ML keywords:
(“Machine learning” OR “AI” OR “ANN” OR “BNN” OR “CNN” OR “Digital construction” OR “Deep learning” OR “Artificial neural network*” OR “Computer vision” OR “Expert System” OR “Knowledge-based Systems” OR “Optimis*” OR “Natural Language Processing” OR “Artificial Intelligence” OR “K-Means Clustering” OR “Fuzzy Clustering” OR “Model-based Clustering” OR “Monte Carlo” OR “Deep Belief” OR “Deep Learning” OR “Convolutional Neural Network” OR “Recurrent Neural Network” OR “Deep Neural Network” OR “DNN” OR “Evolutionary computing” OR “Evolutionary Algorithms*” OR “genetic algorithm” OR “GA” OR “regression analysis” OR “Fuzzy Logic” OR “Regression methods” OR “Model*” OR “support vector machine” OR “SVM” OR “random forest” OR “meta-model*” OR “response surface model*” OR “Surrogate” OR “GA” OR “Genetic algorithm” OR “Gaussian process” OR “GRNN” OR “General regression neural networks” OR “Hidden layer” Or “Multilayer feedforward neural” OR “White box” OR “black box” OR “grey box” OR “Predict*” OR “ML” OR “NN” OR “MLP” OR “SVM” OR “RF” OR “Back-Propagation Neural Networks” OR “Back-Propagation” OR “Boosted Regression Tree” OR “Random Forest” OR “Multi-Layer Perceptron” OR “Support Vector Machine” OR “k Generalized Regression Neural Network” OR “Real-time” OR “real-time algorithm” OR “Regression Tree” OR “Sensitivity Analysis” OR “Decision Tree Regression” OR “Bayesian Network” OR “Classification Tree” OR “learning systems”)
Architectural design process keywords:
(“building information modelling*” OR “BIM” OR “building design*” OR “building design process” OR “building construction*” OR “interdisciplinary applications” OR “architectural design” OR “Automated Scheduling” OR “Automated Planning” OR “Digital building construction*” OR “Conceptual design stage” OR “building design optimisation” OR “BDO” OR “Sustainable building design” Or “Early design phase” Or “Building design optimization” OR “sustainable construction material*” OR “Construction material selection*” Or “material selection” OR “building construction” OR “construction material*” OR “design optimisation” OR “design optimization” Or “initial design stage*” OR “Building design optimization” OR “material quantit*” OR “Design decision support system*” OR “DDSS” OR “DSS” OR “Decision support system”)
Appendix 2
 The table shows three columns. The left column is labeled “Software, Plugins, Libraries and Tools”. To the right of this label, the next column contains category labels arranged from top to bottom as follows: “3 D Modeling”, “Energy Simulation”, “Life Cycle Assessment”, “Automation and Optimization”, “Machine learning”, “Energy Rating”, “Programming”, and “Parametric tool”. To the right of the category labels, the next column lists software names corresponding to each category. Under “3D Modeling”, the software listed from top to bottom are: “SketchUp”, “Grasshopper”, and “Revit”. Under “Energy Simulation”, the software listed from top to bottom are: “EnergyPlus”, “DesignBuilder”, “I D A I C E”, “Ecotect”, “Equest”, “Green Building Studio”, and “HoneyBee”. Under “Life Cycle Assessment”, the software listed from top to bottom are: “Athena” and “SimaPro”. Under “Automation and Optimization”, the software listed from top to bottom are: “Dynamo”, “M O B O”, “Gen Opt”, “j E Plus plus E A”, “Pymoo”, and “Matlab-Tomlab”. Under “Machine learning”, the listed software is “Neural Designer”. Under “Energy Rating”, the listed software is “Accurate”. Under “Programming”, the software listed from top to bottom are: “MatLab”, “E P P Y”, “Python 3 programming language”, and “Microsoft Excel”. Under “Parametric tool”, the software listed from top to bottom are: “Dynamo” and “j E Plus”. To the right of the software names, icons corresponding to each software entry appear, arranged in the same order as the software list.
Software, plugins, libraries, and tools categorization based on their application. Source: The authors
The table shows three columns. The left column is labeled “Software, Plugins, Libraries and Tools”. To the right of this label, the next column contains category labels arranged from top to bottom as follows: “3 D Modeling”, “Energy Simulation”, “Life Cycle Assessment”, “Automation and Optimization”, “Machine learning”, “Energy Rating”, “Programming”, and “Parametric tool”. To the right of the category labels, the next column lists software names corresponding to each category. Under “3D Modeling”, the software listed from top to bottom are: “SketchUp”, “Grasshopper”, and “Revit”. Under “Energy Simulation”, the software listed from top to bottom are: “EnergyPlus”, “DesignBuilder”, “I D A I C E”, “Ecotect”, “Equest”, “Green Building Studio”, and “HoneyBee”. Under “Life Cycle Assessment”, the software listed from top to bottom are: “Athena” and “SimaPro”. Under “Automation and Optimization”, the software listed from top to bottom are: “Dynamo”, “M O B O”, “Gen Opt”, “j E Plus plus E A”, “Pymoo”, and “Matlab-Tomlab”. Under “Machine learning”, the listed software is “Neural Designer”. Under “Energy Rating”, the listed software is “Accurate”. Under “Programming”, the software listed from top to bottom are: “MatLab”, “E P P Y”, “Python 3 programming language”, and “Microsoft Excel”. Under “Parametric tool”, the software listed from top to bottom are: “Dynamo” and “j E Plus”. To the right of the software names, icons corresponding to each software entry appear, arranged in the same order as the software list.Software, plugins, libraries, and tools categorization based on their application. Source: The authors