Soil nutrient management and fertilizer use by farmers are important for sustainable grain production. The authors examined the effect of an experimental agricultural extension program, the science and technology backyard, in promoting sustainable soil nutrient management in the North China Plain (NCP). The science and technology backyard integrates farmer field schools, field demonstrations, and case-to-case counselling to promote sustainable farming practices among rural smallholders.
The authors conducted a large-scale household survey of more than 2,000 rural smallholders. The authors used a multivariate regression analysis as the benchmark to assess the effect of the science-and-technology backyard on smallholder soil nutrient management. Furthermore, the authors used coarse exact matching (CEM) methods to control for potential bias due to self-selection and the (endogenous) switching regression approach as the main empirical analysis.
The results show that the science-and-technology backyard program increased smallholders' wheat yield by approximately 0.23 standard deviation; however, no significant increase in maize yield was observed. Regarding soil nutrient use efficiency, the authors found a significant improvement in smallholders' phosphorus and potassium use efficiencies for both wheat and maize production, and a significant improvement in nitrogen use efficiency for wheat production, but no significant improvement of nitrogen use efficiency for maize production.
This study evaluated a novel participatory agricultural extension model to improve soil nutrient management practices among smallholders. The integration of agronomists' scientific knowledge and smallholders' local contextual experiences could be an effective way to improve farmers' soil nutrient management. This study provides the first quantitative estimates based on rigorous impact assessment methods of this novel extension approach in rural China.
1. Introduction
There is growing concern in China regarding its environmental sustainability in food production (Norse and Ju, 2015). The demands for food in China pose significant challenges in food provision, especially with its increasing purchasing power. Continuous intensification (e.g. intensive use of chemical fertilizers) does not guarantee sustainable food provision (Kassie et al., 2015). Chinese farmers use a substantially higher amount of fertilizer per hectare than farmers anywhere else in the world (FAO, 2017) [1]. The intensive use of chemical fertilizers has caused severe pollution of groundwater, rivers, and lakes (Qu et al., 2011). However, China's agricultural production is still dominated by smallholder farming systems (Rapsomanikis, 2015) and is an important source of income for the smallholders. Meeting the increasing food demand and transforming it into sustainable food production has become an urgent challenge.
Early experiences show that agricultural extension can play a critical role in disseminating information and technology (Swanson, 2006a; Duflo et al., 2008; Takahashi and Barrett, 2014). Its success was evidenced during the “Green Revolution,” when public agricultural extension was delivered to millions of smallholders (Alston et al., 2000; Swanson, 2006b; Van Braun, 2007). However, the central goal of agricultural extensions during the “Green Revolution” was to increase productivity (Swanson et al., 2003), and most technologies introduced, such as chemical fertilizers, pesticides (Pimentel, 1996; Carvalho, 2006), and large-scale mechanization (Pingali, 2007), were less concerned about environmental sustainability.
Building a sustainable agricultural extension requires multiple innovations, including (1) productivity innovation, which ensures food security; (2) natural resource management innovation, which improves resource use efficiency and reduces environmental damage; and (3) institutional innovation, which guarantees sustainable operation of the extension system (Pretty et al., 2011; Robinson et al., 2015). In many developing countries, including China, the agricultural extension system is fragmented (Garfield et al., 1996) and unaffordable for smallholders (Sulaiman and Sadamate, 2000) [2]. From the supply side, many privately funded agricultural extensions are persistent with a “productivity-profit-orientation” (Rivera, 1997). This has resulted in various unintended negative effects on environmental sustainability. From the users' perspective, the lack of information and low educational attainment among smallholders often limit their accessibility to advanced technologies (Feder et al., 1985; Kassie et al., 2013). The presence of the “know-do gap” further inhibits technology adoption (Udry, 1990; World Bank, 2008).
Given the wide advocacy of sustainable agricultural production and the hard realities of extension systems in most developing countries (Schut et al., 2016), this paper presents an innovative solution that has been tested in China and outlines insights for the further development of agricultural extension. Specifically, we study an active participatory agricultural extension model, namely the “Science and Technology Backyard” (STB). The STB model was developed and implemented by a group of agronomists from the China Agricultural University in the North China Plain (NCP). It integrates farmer field schools, field demonstrations, and case-to-case counselling to promote sustainable agricultural production. In practice, STB is organized by experts (mostly agronomists and experts from other related disciplines) and postgraduate agronomy students who work jointly with local community smallholders. A recent paper by Zhang et al. (2016), published in Nature, provided a detailed description of the STB model in the field and a primary evaluation of the effects of STB on smallholders' agricultural production.
However, the evaluations by Zhang et al. (2016) suffer from several limitations. First, direct outcome comparisons between STB and non-STB villages might present a serious sample selection problem if the STB villages were not randomly selected (Imbens, 2004; Rosenbaum, 2010). In other words, if there was a confounding factor affecting both the outcome and participation in the STB program, the outcome comparison might overestimate (or underestimate) the true effect of STB. Second, the data used in Zhang et al. (2016) were primarily collected from 2011 to 2012, approximately two to three years after the establishment of the STB. Some previous studies found more significant effects of agricultural extension in the long term (Davis et al., 2012), while other studies claim that the short-term effect will eventually fade out (Tripp et al., 2005; Rejesus et al., 2012). It would be interesting to examine the long-run effect of STB and compare it with other similar studies in other developing country contexts. In addition, the sample size of the control group (both smallholders from neighboring villages and control villages) in Zhang et al. (2016) was rather small, and there were limited comparisons of smallholder farming and farm-related characteristics. Inferences from this small sample comparison might lead to low statistical power.
In this study, we examined the long-term effects of STB on smallholder soil nutrient management using a quasi-experimental approach. We specifically focused on smallholder fertilizer use as the main practice in soil nutrient management. We conducted a large-scale household survey with 2,000 rural smallholders from 135 villages in early 2018 to assess the effect of the science-and-technology backyard on smallholder grain production and soil nutrient use efficiencies. We first ran a multivariate regression analysis as the benchmark analysis. Furthermore, to control for potential bias due to sample self-selection, we used both the coarse exact matching (CEM) method and the (endogenous) switching regression model to conduct the main empirical analysis. Additionally, we benchmark our study against farmer field school studies from other developing countries, discuss the limitations of STB practice, its potential improvement, and policy implications.
Our study contributes to the literature on the development of agricultural extensions to promote sustainable farming among smallholders in developing countries. First, China's agricultural extension has been a great success in transforming itself into a modern agricultural production system (Huang and Yang, 2017). However, its environmental sustainability remains a challenge. The practice of the STB program is of great value in providing more insight into reforming China's agricultural extension. Second, unlike the conventional government-led extension program, STB is a public university-led extension program. It has integrated both up-to-date agronomic knowledge and local geo-climate contextual experiences carried out by university staff. Understanding the internal mechanism and its effectiveness can yield a strong policy implication, given that China outlined an ambitious target for achieving agricultural green development in its 19th National Congress of the Chinese Communist Party in 2017.
The remainder of this paper is organized as follows. In Section 2, we present the problem of smallholders' intensive use of chemical fertilizers in China and a brief description of the STB in the field. In Section 3, we present our research design regarding sampling, data collection, and the analytical approach used for quantitative analysis. We present the results in Section 4 and conclude the paper with an extensive discussion in Section 5.
2. Sustainable agricultural development in rural China
China's agricultural production has undergone several significant transformations since the 1980s (Yu and Zhao, 2009). The growth of agricultural productivity in China has primarily been achieved through continuous intensification. According to national statistics, China's grain production has increased at an annual rate of 20% since the early 1990s (NBS, 2012). However, the use of chemical fertilizers during the same time has increased at an annual rate of more than 30% (Wu et al., 2018; Xu, 2020). Smallholders who cultivated less than 1 hectare of land consumed a substantial share of the increase in fertilizer use.
2.1 The intensive use of chemical fertilizers in China
The concern about the intensive use of chemical fertilizers was triggered by its significant negative impact on China's water system, in both surface and ground water. During the 1970s and the 1980s, the application of chemical fertilizers was largely nitrogen (N) fertilizers, followed by the addition of phosphorus (P) and potassium (K) when synthetic fertilizers were introduced (N-P-K, Fan et al., 2012).
The large-scale intensive use of chemical fertilizers can be attributed to three factors. The first is political concerns over food self-sufficiency and national food security (Ghose, 2014; Wong and Huang, 2012). To ensure food self-sufficiency, promoting “productivity-oriented” agricultural development policies was the priority for a period of time (MoA, 2016). During this period, the use of chemical fertilizers was encouraged by agricultural extensions to achieve high yields. Second, with the continuous decentralization and privatization of agricultural extensions since the 1990s, many grassroots (village- and township-level) extensionists have become self-employed with agricultural extension reform and a decrease in public financial support (Qiao et al., 1999; Hu et al., 2004). According to some anecdotes, a substantial share of current agricultural input retailers is formal local extensionists (specializing in fertilizers and pesticides). Profit maximization and market share have become primary goals (Hu et al., 2004). Third, many studies argue that the intensive use of chemical fertilizers is partially because smallholders are risk-averse (Chen et al., 2018) and are misinformed (Huang et al., 2012a) [3]. These studies often call for political and financial support from agricultural extension systems.
2.2 The “science-and-technology backyard” pilot experiment
The Science and Technology Backyard (STB) integrate academic research with field practices so that knowledge from agricultural R&D can be redeveloped using rural smallholders' farming experiences. The STB was developed to serve different crops – ranging from staple crops (wheat, maize, and rice) to cash crops (apple, banana, tea, and mandarin) – working with different stakeholders (including researchers, local governments, non-government organizations, and private companies) in rural villages. In our study, we specifically focus on STBs developed to serve local smallholders in wheat-and-maize production in the NCP [4]. Thirteen STBs have served villages across four townships in Quzhou County of Handan Prefecture since 2009. We chose this experimental program because smallholder farming is the most prevalent farming system in the NCP (Huang et al., 2012b), and the NCP region is one of China's most important grain-producing regions (Zhang et al., 2016).
The STB operates in a highly site-specific approach with three core components: (1) farmer field schools, (2) local field demonstrations, and (3) case-to-case counseling. The organization of these activities is demand-driven. To serve smallholders, the local executive team developed four general principles for compliance (Zhang et al., 2016). First, the zero-fee principle requires that all STBs serve smallholders without requesting a service fee. Local extension staff argued that an inclusive service, in which all smallholders had a chance to participate and receive the services, could only be delivered if the zero-fee principle was implemented. Second, the zero-distance principle requires that all STB services be delivered locally within the rural community (in the village or farm). This principle, as argued, is crucial for ensuring that an interactive relationship between STB staff and rural smallholders is achieved. Third, the zero-time difference principle. STB services should be delivered to rural smallholders in a timely manner, with no delay in important information and field practices. Finally, the inclusive (or zero-criteria) principle indicates that STB services are nonexclusive. All stakeholders are eligible to participate and interact with the local STB staff, and all STB activities are open to local community members. More details regarding the STB activities can be found in Zhang et al. (2016).
3. Research design
3.1 Sampling and data collection
We conducted a large-scale household survey from February to March 2018 in four counties in Handan prefecture (including the experiment county [Quzhou] and three neighboring counties) to examine the effect of the STB program on smallholder grain production and soil nutrient management. Handan Prefecture is a typical smallholder farming region in the NCP (Tan et al., 2006), with maize and wheat rotation being the most common staple crops. With 35,265 yuan (about 5,250 USD) per capita GDP in 2016, about 12.5% of the total GDP in Handan Prefecture was from the agricultural sector, which was significantly higher than the national average (8.56%, NBS, 2017). The three selected neighboring counties have identical climatic conditions and share the same type of soil (cinnamon soil) [5]. Therefore, we were less concerned about the inconsistencies in outcomes caused by climatic or soil differences.
The sampling was conducted in two steps. First, within the experimental county, 13 villages across four townships had received the STB program since 2009. We further sampled 15 villages that had never received STB services to match these 13 villages [6]. Thus, 28 villages were sampled from the experimental county. Second, we included three neighboring counties that had never received any STB services as the comparison villages to increase the statistical power. We sampled villages within these neighboring counties according to the following criteria: First, the majority of the households within the villages are grain (wheat and maize) farmers (with more than 70% of smallholders being grain producers). This restriction makes STB treatments relevant to local agricultural production conditions. Second, the villages have not received any related training programs or support over the previous five years. This guarantees that our study is not contaminated by other similar agricultural extension programs. Involving these three counties provides us with additional power to test whether there is any statistically significant impact of STB services on rural smallholders' fertilizer use and grain yield. Using these sampling criteria, we sampled 135 rural villages (across 28 townships) for our household survey. Within each sampled village, we randomly selected 16 households to participate in field interviews.
The survey was conducted through face-to-face interviews. Enumerators conducted interviews with household members who were primarily responsible for farming decisions. If more than one household member was in charge of farming activities, the head of the household was the first choice for the interview. This protocol enabled us to consistently collect information within households and guaranteed accurate agricultural input and output information. The household surveys were divided into three groups. In the first block, detailed household demographic information (e.g. the household head's age, education, farming experience, off-farming employment, family size, and family wealth measured by durable goods) was collected. In the second block, we collected detailed household agricultural outputs and input data, including wheat and maize yields, contracted farmland, labor, and machinery inputs. Additionally, information on fertilizer use for maize and wheat production was collected. In the third block, we collected data on village characteristics (including distance to the local township and county seat, village population and farm size, irrigation facilities, and other related agricultural production infrastructure). Table 1 presents descriptive statistics for these variables [7]. These covariates have been frequently used in studies on smallholders' farming practices and agricultural production.
3.2 Analytical approach
3.2.1 Multivariate regression analysis
Given that STB services were provided at the village level, to examine the effect of receiving STB services on smallholders' outcomes, we ran the following multivariate regression analysis (1) as a benchmark estimation:
In Equation (1), represents the smallholders' outcomes of interest (including smallholders' yields and nutrient use efficiencies, as presented in Table 2). Tj is a dummy variable indicating whether village j has received STB services, and the coefficient α1 captures the estimated effect of STB services on smallholder outcomes (). We also controlled for the village-level observed covariates (), where is the robust clustered standard error at the village level. To improve the efficiency of our estimation, we add smallholders' personal and family characteristics (Table 1) to specification (2):
In Equation (2), coefficient captures the effect of STB services on smallholders' outcomes (). The vector of represents the observed smallholders' personal and family characteristics that were not affected by STB services. Adding these control variables could significantly increase estimation efficiency.
Multivariate regression analysis can be informative; however, it does not guarantee an unbiased estimation of the effect of STB services if the assignment of STB villages is not random (i.e. , Imbens, 2004). The fundamental challenge in Equations (1) and (2) is whether the selection of STB villages is independent of some previously observed and unobserved village characteristics, which might be correlated with smallholders' outcomes (Imbens, 2004; Rosenbaum, 2010). In other words, when the STB villages (as the treatment group) were not comparable to the non-STB villages (as the control group, Rosenbaum and Rubin, 1983; Heckman et al., 1999), our multivariate regression estimation would be biased due to an invalid counterfactual.
3.2.2 Coarsened exact matching
The cause of an invalid counterfactual may be for two reasons. First, if the analytical sample contains smallholders from both STB and non-STB villages that differ significantly in their background characteristics, the linearity assumption in multivariate regression might produce a biased estimate by extrapolating away from the common support region (King and Zeng, 2006). We used coarsened exact matching (CEM) to create a sample of non-STB villages that share similar observed characteristics with STB villages as the counterfactual to reduce the potential bias (Iacus et al., 2012; Blackwell et al., 2009). We specifically used CEM for two reasons. First, the STB services were delivered at the village level that most smallholders within the village had either directly or indirectly received STB services. A clustered design of the STB program indicates matching should be conducted at the village level instead of among households. With a limited number of villages received STB services, hence, the CEM can maximum reserve the treated samples and match at the village level. Second, the CEM is a monotonic imbalance bounding (MIB) matching method. It requires no assumptions about the data generation process, and the level (covariates) of matching is chosen by the user based on specific, intuitive substantive information with ex ante choices. Thus, the imbalance between the matched treated and control groups will not be larger than the ex ante user choice (Kumar et al., 2019). Online Appendix 1 presents the covariate balance check before and after CEM implementation. Our estimators are doubly robust under the conditional independent assumption (CIA) and by running regression analyses as in Equation (2) on top of the matched villages, in the sense that the estimators are unbiased if either the matching procedure or the regression specification is correctly specified (Ho et al., 2007; Bang and Robins, 2005).
Second, the use of matching could reduce the bias due to selection of observables, providing no assurance that the assignment of the STB meets the CIA due to unobservables (or hidden-bias, Imbens, 2004; Ichino et al., 2008; Rosenbaum, 2010). Given that the program was implemented a priori, it was impossible to test CIA. We used the Rosenbaum bounds analysis to estimate any “hidden bias” caused by unobserved covariates, which may bias our interference. We present the results of the Rosenbaum bounds analysis online, in Appendix 2 with additional discussions.
3.2.3 Robustness check using the (endogenous) switching regression approach
We employ another strand of econometric method – the (endogenous) switching regression approach (Maddala, 1986; Lokshin and Sajaia, 2004; Abdulai and Huffman, 2014)–to examine whether our multivariate regression and CEM estimations suffer from endogeneity issues due to the unobserved sample self-selection problem (Heckman, 1979). We assume that the selection of villages receiving STB services is determined by the following selection Equation (3):
where is a binary variable indicating if village j received STB services or not; is a vector of exogeneous village characteristics, and is a vector of parameters to be estimated. The error term with a mean of zero and variance captures the unobserved factors.
Given that smallholders in the sampled villages either received STB services () or not (), we observed that smallholders' outcomes take the following two regimes:
where and are the outcomes of smallholders from STB villages and non-STB villages, respectively; and are vectors of smallholders' exogenous characteristics. The three error terms () are assumed to have a tri-variate normal distribution with a mean vector of zero and the following covariance matrix:
where , , , assuming , the correlations , and . When there is an unobserved self-selection factor that affects villages receiving STB services () and smallholder outcomes (), the correlations of the error terms of the outcomes () and the choice equation () will take a non-zero value, and the multivariate regression estimates will suffer from sample selection bias (Lee, 1982). Together, Equations (3), (4), and (5) constitute a switching regression model (SRM).
We used the full information maximum likelihood method to estimate the parameters (Lokshin and Sajiia, 2004) to simultaneously estimate choice Equation (3) and outcome Equation (4). The identification of the model requires at least one variable in vector , which is not included in vector . Specifically, in Equation (3), the exploratory variables include a vector of variables that might influence the assignment of the villages to receive STB services, and a vector of instrumental variables that is correlated with the (endogenous) treatment variable but uncorrelated with the error term in Equation (3). In our study, we included two instrumental variables, including a binary variable indicating whether a village was a new socialist model village, and found that the average share of smallholders is CCP party members [8]. Once the parameters are estimated, we can identify if there is a sample selection bias due to unobserved factors and the average treatment effect on the treated (ATT) STB services.
4. Empirical results
4.1 Effect of the STB on smallholders' grain productivity
The descriptive results shown in Table 3 indicate that smallholders from STB villages have higher yields than those from non-STB villages in both wheat and maize production (Table 3, rows 1 and 5). The yield differences in wheat production are substantial (∼279 kg per hectare). In the multivariate regression analysis, after controlling for the villages' characteristics (Model 1) and subsequently with additional control of household characteristics (Model 2), we find a robust consistent result. On average, households from STB villages produce about 0.23–0.27 standard deviation (about 250 kg) more wheat per hectare than non-STB villages (Table 4, row 1). The results from the matched-sample regression analysis produce roughly the same results.
However, the results on maize production are inconclusive. The descriptive results show that smallholders from STB villages produce a higher maize yield than those from non-STB villages; the difference is rather small (about 101 kg per hectare) and statistically insignificant. Multivariate regression analysis with Models (1) and (2) produce the same and insignificant results (only about 0.11 standard deviation increase, Table 4, row 4). These results indicate that, at least in 2017, a limited positive impact of STB services could be observed on maize yield.
4.2 Effect of the STB on smallholders' nutrient use efficiency and fertilizer application
Regarding smallholders' soil nutrient use efficiency (in N-P-K), we find inconsistent results. For instance, in wheat production, smallholders from STB villages show a significant improvement in nitrogen use efficiency (approximately 3.88 kg additional wheat producer per kg nitrogen applied, Table 3, row 2); however, no significant positive improvement is observed in phosphorus and potassium use efficiency. In contrast, for maize production, the results are reversed. We find no significant improvement in nitrogen use efficiency but significant improvements in phosphorus and potassium use efficiencies (Table 3, rows 7–8).
The multivariate regression and matching results in Table 5 show that there was a statistically significant increase in nutrient use efficiency across all nutrients (N, P, and K) in wheat production. The regression results indicate consistent results. Specifically, per kilogram nitrogen application yielded an additional 2.5–3.3 kg wheat produced per hectare (Table 5, row 1) than comparison villages; additional wheat per kilogram of phosphorus applied, Panel efficiency (Row 4.42–6.47 kg additional wheat per kilogram of potassium applied, Panel 2, Row 4; and 4.68–7.59 kg additional wheat per kilogram of potassium applied, Panel 3, Row 7). These results indicate that the STB program has indeed improved smallholder nutrient use efficiency in wheat production. In maize production, we find significant increases in P and K use efficiency (Table 5, rows 4 and 7), but no significant increase in N use efficiency.
Comparing the nutrient use efficiency of wheat and maize production and the differences in wheat and maize yields, we notice that there is a large and robust improvement in phosphorus and potassium use efficiencies, whereas the increase in nitrogen use efficiency is rather weak and statistically insignificant. Given that applying fertilizer is a common practice among smallholders, the question arises as to why we find inconsistent results between wheat and maize; and between nitrogen use efficiency (NUE), phosphorous (PUE), and potassium (KUE) use efficiencies.
Interviews with the field STB staff indicate that there were two potential causes for this inconsistency. First, the application of fertilizer is not only about the amount applied, but also about when it is applied. The base fertilizer is crucial for fostering plant germination; however, not intensified. Smallholders often intensively apply base fertilizer but avoid top-dressing fertilization. The naïve belief is that as long as the total amount of fertilizer is applied, nutrients remain in the soil. Although this approach can save a substantial amount of labor input, it results in excessive nutrient loss. In field training, STB staff encourages smallholders to reduce the base fertilizer application (particularly nitrogen) and ensure top-dressing, which is crucial for grain formation (an essential step in improving yields). Thus, we should be able to observe a decrease in base fertilizer use.
Second, the nutrient demands of wheat and maize are essentially different. Unlike wheat production, N is particularly important for maize growth during the jointing stage and grain formation (Cui et al., 2010). STB staff emphasizes the reduction of base fertilizer in both wheat and maize production. However, they recommend a reduction in top-dressing fertilization for wheat production and a slight increase in maize production since more than 95% of smallholders practice top-dressing fertilization for wheat production, and some smallholders might still intensively apply chemical fertilizers. In contrast, in maize production, less than 40% of smallholders were in fact applying top-dressing fertilizers due to the high temperatures in summer and the physical difficulties involved. This leads to a lack of nitrogen for maize formation, which further decreases maize yield.
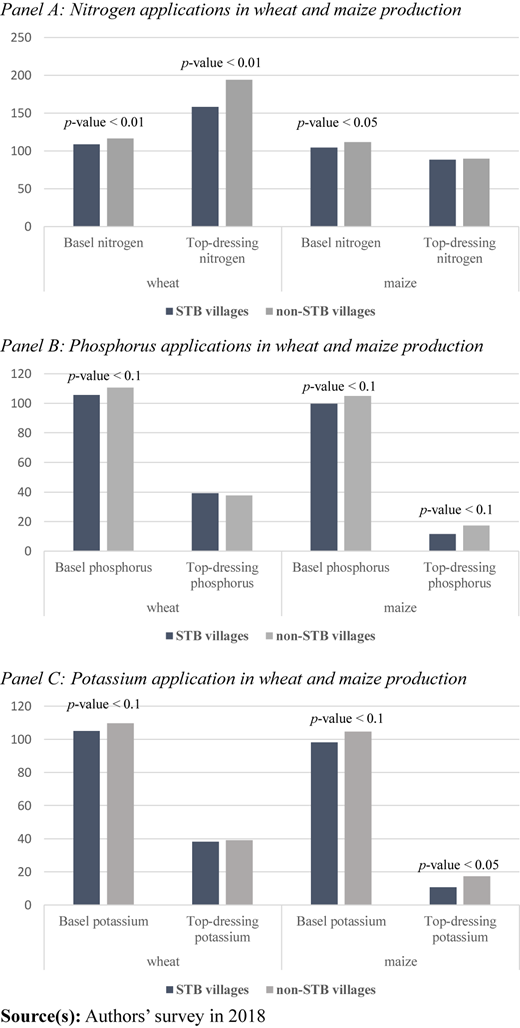
We further analyzed the amount of nitrogen applied in base fertilization and top-dressing fertilization separately to verify whether this field practice might cause a discrepancy in nitrogen use efficiency and maize yield [9]. Figure 1 shows the basic descriptive comparisons of the base and top-dressing fertilizations between smallholders from STB and non-STB villages. We found a statistically significant reduction in base fertilizer application in both wheat and maize production (Table 6, Panel 1). However, regarding top-dressing fertilization, we found a significant reduction in wheat production (approximately 0.22–0.28 standard deviation; Table 6, Panel 2), but no increase or decrease in maize production. This result indicates that the change in smallholder top-dressing fertilization in maize production is limited.
4.3 The (endogenous) switching regression estimations
Tables 7 and 8 present the (endogenous) switching regression estimations for both wheat and maize yields. The selection equations are provided in Column 1 using the full information maximum likelihood approach, which jointly estimates the selection the outcome equations. In both specifications, the estimated coefficients of the selection equation are slightly different, because we use the full information maximum likelihood approach [10]. In both specifications, the coefficients of the selection equation show that smallholders' education, locus of control, and number of land pieces have a statistically significant value, although the coefficient of education is rather small (Table 7, Column 1). The coefficient of village is a socialist model village, which is statistically significant, indicating that if the village is a model village, there is a low probability of receiving STB services. We also noticed a negative coefficient for the percentage of CCP memberships in the village and the selection of receiving STB services; however, the estimated standard error is large, and it is difficult to reject the null hypothesis.
Second, a more important finding is that the estimates presented at the bottom of Tables 7 and 8 indicate no statistically significant endogenous selection effects. The coefficients of rho_1 () and rho_2 () were small and not statistically significant, and the estimated standard errors are rather large (Tables 7 and 8, Columns 2 and 3). Thus, we cannot reject the null hypothesis that no statistically significant correlations exist between the two error terms. This result implies that there was no unobserved factor affected the selection of villages receiving STB services and affected smallholder wheat and maize yields simultaneously. We also ran the same analyses with smallholder nutrient use efficiencies with N-P-K, smallholder basal fertilization, and top-dressing fertilization. The switching regression results were consistent, with no statistical significance. Thus, the results of either the multivariate regression or CEM estimations should be consistent and robust. This result further echoes the results of the multivariate regression and CEM results. We find limited changes in the estimations using these two methods.
5. Conclusion and discussion
In this paper, we studied a novel agricultural extension model – the “science and technology backyard (STB)” – in promoting sustainable farming among rural smallholders in the NCP. Taking a large-scale smallholder survey in early 2018, we used both the multivariate regression, CEM, and the (endogenous) switching regression approaches to examine the long-term effect of STB services on farmers' grain production and soil nutrient use efficiencies. We found that the STB program increased smallholders' grain yields, particularly in wheat production, and reduced smallholders' fertilizer use, particularly basal fertilizer use, subsequently improving smallholders' overall nutrient use efficiency. This result suggests that the STB approach can contribute to a significant reduction in agricultural pollution due to the use of chemical fertilizers.
Considering these quantitative findings, to what extent are the findings of our study comparable to similar international studies? Does the STB program have a substantial effect relative to other programs in other developing countries? To answer these questions, Table 9 presents a summary of similar studies conducted in both China and other developing countries. First, we compared our results to those of Zhang et al. (2016). Both studies showed rather consistent results; however, given the focus on applying rigorous impact assessment methods in our research, the scale of our study was much smaller than that of Zhang et al. (2016). Considering the differences in research methods and data generation process, it seems that Zhang et al. (2016) overestimated the magnitude of the effect of the STB program. Second, most recent studies in this field literature, a substantial number (seven out of 11) of the studies examine the effect of farmer field schools on integrated pesticide management. Most of these studies found significant improvements in farming knowledge (Godtland et al., 2004; Guo et al., 2015; Van Campenhout, 2017); however, with the exception of Davis et al. (2012) and Kondylis et al. (2017), most of these studies did not provide concrete evidence on smallholders' yield increase or improvement of nutrient use efficiencies.
The STB program shows that technology adoption is important, but that an effective extension requires strategies to identify smallholder's needs, to integrate technologies in the local context, and communicate effectively with local smallholders. However, our study provides no cost-effectiveness analysis of the STB program and its effects beyond grain production and soil nutrient use efficiency. This is partially because the current program collaborates closely with different stakeholders (including public universities, local governments, private companies, and individual donors). A cost-effectiveness analysis will be a crucial next step in examining to what extent the STB model could be further expanded in the long run and to other parts of China.
Finally, a number of limitations should be taken into account. First, although we argue that our sample is representative for smallholder agriculture in the NCP as a whole, care should be taken in extending our findings and conclusions to that larger region without carrying more rigorous evaluations for those other parts of the region. Second, the matching methods that we applied might effectively reduce the omitted variable bias, they provide no guarantee that other unobserved covariates might not bias our estimation. Sensitivity analysis with Rosenbaum bounds analysis indicated that our results are robust to hidden bias. Moreover, the use of (endogenous) switching regression estimation provides us additional confidence in the robustness of our main findings. Yet, additional more rigorous evaluations based on large-scale randomized controlled experiments are desirable for a more effective empirical evaluation.
The authors acknowledge the following financial support: The KNAW-MOST project “Sustainable Resource Management for Adequate and Safe Food Provision (SURE+)” [grant number PSA-SA-E-01 and 2016YFE0103100], and Ministry of Agriculture and Rural Affairs of China [grant number: 202018].
Notes
Statistics from the Food and Agricultural Organization (FAO) shows that on average Chinese farmers are using more than 300 kg chemical fertilizer per hectare, which is significantly higher than the recommended 225 kg per hectare (Cui et al., 2008), and it is almost three times higher than the OECD members' average amount of fertilizer use (137 kg per hectare, FAO, 2017).
This was partially due to the decentralization and privatization trends in public goods provision during 1990s. See Swanson and Samy (2002) for detailed studies about decentralization and privatization of agricultural extension.
As a rescue plan and to avoid crop failure due to unforeseen bad weathers (such as flooding, strong winds, and extreme cold), farmers often apply more chemical fertilizers to increase the plant resilience.
In Zhang et al. (2016), the STB village only includes villages that have STB offices. However, in the field, STB staff serve not only these villages but also other neighboring villages. After consulting with local STB staff, we included all STB villages (including villages that have received STB services without an office) in our study area.
To examine the representativeness of the sampled households to the rest of the North China Plain, we compared our sampled smallholders' wheat and maize yield, and farm size distributions with some previous studies in Henan and Shandong provinces (Wang et al., 2020). Our samples have a close distribution with other smallholders in the NCP. Detailed comparisons are available upon the reader's requests.
We selected 1–2 neighboring villages per STB village according to the population, farm size and its cropping structures to match with the existing STB villages; all matched villages had never received STB services.
In the online Appendix Table A1, we show the comparisons between the STB villages and the non-STB villages over these predetermined control covariates (column 1–3, Table A1).
If the village is a socialist model village (as a local government special model village), there is less chance of having a STB program because there will be too much political attention. However, the assignment of the model village has no relationship with smallholder's farming and their agricultural production. The percentage of CCP members indicates the political condition of village governance; higher CCP members often have a high level of turnover at village elections, thus, less probability to receive a STB service.
We present the descriptive comparisons between STB villages and non-STB villages regarding the nutrient applications in Figure 1. Panels A, B and C are the comparisons of nitrogen, phosphorous and potassium applications between STB villages and non-STB villages respectively.
The full information maximum likelihood (FIML) method estimates the selection equation and smallholder (wheat and maize) yield equation simultaneously to have consistent estimates (Lokshin and Sajaia, 2004).
CRediT author statement: Fan Li: Conceptualization, methodology, investigation, formal analysis and writing – original draft; Dangui Li: Investigation, resources and data curation; Maarten Voors: Methodology and supervision; Shuyi Feng: Conceptualization, supervision, project administration; Weifeng Zhang: Conceptualization and data curation; Nico Heerink: Writing – review and editing, funding acquisition.
References
Appendix
The Appendix file for this article can be found online.
Competing Interests
Declaration of the conflicts of interests: The authors declare that they have no known competing financial interests or personal relationships that could have appeared to influence the work reported in this paper.