The purpose of this paper is to study the drivers of service provider switching intention other than satisfaction and, additionally, analyse the moderating role of the type of service (utilitarian vs hedonic). Specifically, the authors study the effects of alternative attractiveness, post-purchase regret, anticipated regret and past switching behaviour.
A representative survey with 800 consumers of mobile phone services (utilitarian) and holiday destinations (hedonic) was carried out.
Satisfaction is not a significant antecedent of switching intention in the hedonic service and its effect is marginal in the utilitarian service. In the utilitarian service, the main predictor of switching intention is post-purchase regret, whereas in the hedonic service, the main determinants of switching intention are past switching behaviour and anticipated regret.
The main contribution of this study is the analysis of the determinants of provider switching behaviour that may explain abandonment by satisfied customers, to see if their influence is greater or smaller than that of satisfaction itself, which has been the most analysed variable. Furthermore, there are expected to be differences between utilitarian and hedonic services, an aspect which is also studied in this work.
1. Introduction
Consumers are becoming increasingly more demanding and more knowledgeable about products and brands thanks, in part, to new technologies development that leads to lower information costs. This situation discourages consumers from remaining loyal to their service providers even when they are satisfied (Fraering and Minor, 2013), and poses the challenge of achieving repatronage behaviours for companies. There is consensus on the fact that loyal customers are more profitable than new ones because they provide increasing income with decreasing costs (Anderson et al., 2004; Anderson and Mittal, 2000; Lin et al., 2016; Mittal and Lassar, 1998). Furthermore, a loyal customer is more willing to continue doing business with the company even when prices rise (Baumann et al., 2012; Keaveney and Parthasarathy, 2001; Zeithaml, 2000). Hence, customer retention is a priority for service organisations and also has received a great deal of attention by scholars (Balaji, 2015; Miranda-Gumucio et al., 2013; Pan et al., 2012).
The design of successful loyalty strategies involves finding out the main determinants of consumer switching behaviour (Maicas et al., 2006; Ryals and Knox, 2006). Traditionally, it has been assumed that satisfaction leads to repatronage behaviour and dissatisfaction results in switching (Chuah, Marimuthu, Kandampully and Bilgihan, 2017). The expectancy confirmation theory (ECT) has been generally adopted to explain customers’ decisions to remain loyal or exit (Liao et al., 2017). This theory assumes that consumers compare the product or service performance with prior expectations and this comparison results in satisfaction or dissatisfaction that, in turn, leads to loyalty or switching (Chih et al., 2012; Oliver, 2010).
However, increasingly, scholars are claiming that satisfaction does not always translate into loyalty and that dissatisfaction does not always cause switching behaviour (Chuah, Marimuthu, Kandampully and Bilgihan, 2017; Chuah, Rauschnabel, Marimuthu, Thurasamy and Nguyen, 2017; Liao et al., 2017) and that “the variance explained by just satisfaction is rather small” (Kumar et al., 2013, p. 246). Thus, new approaches are needed to further explain consumer continuity or switching decisions because despite decades of satisfaction research, “the true role of satisfaction in customer loyalty” is still not clear (Mittal, 2016).
In this vein, Liao et al. (2017) point out that there is an alternative paradigm to the ECT that employs external reference points (the performance of competitors or the non-chosen alternatives) to explain retention or switching. Indeed, Liao et al. (2017) highlight a gap in the literature regarding the joint analysis of both paradigms adding to the classical ECT variables such as regret and alternative attractiveness to better explain repatronage or switching behaviour. Under this approach, anticipated regret (the regret consumers predict they could feel if they decide to switch to a different provider) is expected to affect buying decisions (pre-purchase influence), whereas after the purchase, consumers will compare the chosen alternative with the foregone ones and will experience regret if the last ones were better even if satisfied with the current provider (Liao et al., 2017). In addition, if consumers perceived that there are other attractive alternatives available, this could also trigger switching in spite of being satisfied (Calvo-Porral et al., 2017; Liao et al., 2017).
With the aim of filling this gap in the literature, this present study analyses the influence of anticipated regret, post-purchase regret and alternative attractiveness on switching intention along with satisfaction in order to contribute further insights into the actual role played by satisfaction in switching decisions when variables related to external reference points are included. Furthermore, since our main interest is to identify alternative explanations for switching beyond satisfaction, past switching behaviour is also considered because it is a good reflection of variety-seeking tendencies and can motivate satisfied customers to change to a different provider.
Finally, this work aims to address another research gap pointed out by Mittal (2016). The author calls for more research to reveal the role of service type within service switching or loyalty models. The proposed relationships are tested in utilitarian and hedonic services in order to establish a comparison of both that allow elucidation of whether the determinants of switching intentions differ according to the utilitarian or hedonic nature of the service. To our knowledge, this moderating role of service type (hedonic vs utilitarian) has not been addressed in the service marketing literature despite reports from some scholars of significant differences between utilitarian and hedonic services in relation to evaluation of the service (Jiang and Wang, 2006; Lien and Kao, 2008; Ryu et al., 2010).
In summary, we propose that a consumer’s decision to switch to a different service provider is not only explained by satisfaction (comparison of current supplier performance and prior expectations) but also by anticipated regret (the regret or lack of it that individuals think they will experience if they decide to switch); post-purchase regret (comparison of current service performance and performance of non-chosen providers); the existence of other attractive alternatives in the market; and variety-seeking behaviour (past switching).
Therefore, the main contribution of this study is the analysis of the determinants of provider switching behaviour that may explain abandonment by satisfied customers, to see if their influence is greater or smaller than that of satisfaction itself, which has been the most analysed variable. Furthermore, there are expected to be differences between utilitarian and hedonic services, an aspect which is also studied in this work.
To test this proposal, a representative study with 800 Spanish users of mobile phone services and holiday destinations, as utilitarian and hedonic services, respectively, was conducted.
The paper is organised as follows. Section 2 presents the conceptual framework for the investigation and proposes the theoretical model to be estimated on the basis of the hypotheses. Section 3 presents the methodology used in the empirical study, the research context and sampling method. Section 4 presents and discusses the main findings from estimation of the model and the multigroup analysis run to test the moderating effect of service type. Finally, Section 5 summarises the main conclusions, limitations of the study and possible future lines of research.
2. Conceptual framework and hypotheses
2.1 Consumer switching behaviour in services
Identification of the main factors behind consumer decisions to change service providers may help companies to design more effective strategies that enable them to prevent new customers from leaving or recover those that have already left (Stewart, 1998; Thomas et al., 2004). This approach would lead to significant increases in business profitability, given that it is widely accepted that retaining a customer costs much less than capturing a new one (Hur et al., 2013; Hwang and Kwon, 2016; Zeithaml, 2000).
Table I shows the main factors identified by the literature as determinants in the decision to change service providers (it is not an exhaustive examination of antecedents of switching but an overview of the most relevant).
Antecedents of service switching behaviour
Source: Own elaboration
Out of all the above determinants, researchers have paid greater attention to perceived quality, satisfaction, switching costs and service failures (An and Noh, 2009; Antón et al., 2007; Bansal et al., 2005; Li et al., 2007; Manrai and Manrai, 2007; Olsen and Johnson, 2003), and the first two in particular.
Scholars and practitioners alike have assumed that satisfaction leads to loyalty and so they have emphasised the study of customer satisfaction levels and their effects (Chuah, Marimuthu, Kandampully and Bilgihan, 2017; Jones and Sasser, 1995; Miranda-Gumucio et al., 2013). Consequently, it is thought that one of the main causes leading customers to abandon their providers is dissatisfaction due to a problem with the company (Coulter and Ligas, 2000; Roos, 1999).
Without undermining the undoubted influence of satisfaction and perceived quality on the decision to change provider, the need to seek other reasons to explain switching behaviour has been noted (Keaveney and Parthasarathy, 2001; Liao et al., 2017).
In fact, not all consumers who decide to change provider are dissatisfied because in some cases, the change is due to other factors like variety seeking, the existence of more attractive alternatives or regret (Antón et al., 2007; Calvo-Porral et al., 2017; Liao et al., 2017).
In addition, the factors behind the decision to change provider may be contingent upon the type of service and so there will be differences between continuous and discrete services or between utilitarian and hedonic services (Pollack, 2015).
2.2 Satisfaction
Satisfaction can be examined from one of two approaches: the approach based on a specific transaction and the overall or accumulated satisfaction approach adopted in this work (Garbarino and Johnson, 1999; Olsen and Johnson, 2003; Yang and Peterson, 2004). The specific transaction approach defines satisfaction as the consumer’s response to the most recent transaction with the organisation (Oliver, 1993), which will therefore be influenced by the situational variables present at that moment, whereas overall satisfaction considers that the opinion emitted by the consumer is the result of an accumulation of experiences, including both satisfaction associated with specific products and satisfaction with various aspects of the company (Cronin and Taylor, 1992; Homburg and Giering, 2001). In this regard, Homburg and Giering (2001) consider satisfaction to be “the result of a cognitive and affective evaluation in which perceived performance is compared with a comparative standard. The satisfaction judgment is related to all the experiences with the specific provider in relation to its products, sales process and after-sales service”.
As noted above, satisfaction continues to be considered as one of the main precursors of consumer loyalty (Bolton and Lemon, 1999; Chen, 2012; Jones et al., 2000; Lam et al., 2004; Lee et al., 2017; Tam, 2011) and, so, of market share (Rego et al., 2013) and profitability (Lee et al., 2017).
Analogously, it has been widely proved that dissatisfaction increases consumer switching behaviour (Keaveney and Parthasarathy, 2001; Roos, 1999) and switching intention (Bansal and Taylor, 1999; Gray et al., 2017; Liu et al., 2016; Lucia-Palacios et al., 2016; Manrai and Manrai, 2007). Therefore, it is proposed that:
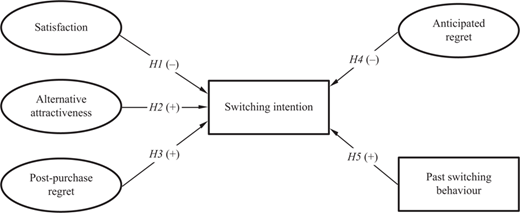
Satisfaction has a negative influence on consumer switching intention.
In spite of the strong support received in the literature for the above hypothesis, the relationship between (dis)satisfaction and behavioural intentions is more complex than it first appears (Hau and Thuy, 2012; Mittal and Kamakura, 2001; Oliver, 1999; Pan et al., 2012).
The relationship between satisfaction and loyalty is non-linear and asymmetric (Chuah, Marimuthu, Kandampully and Bilgihan, 2017; Liao et al., 2017; Tuu and Olsen, 2010). Thus, it is likely that the factors that prevent customers from feeling dissatisfied are not necessarily the same that make them loyal to the company (Anderson and Mittal, 2000; Mittal et al., 1998,1999; Tsiros, 1998).Consequently, in the great majority of cases dissatisfaction causes individuals to leave the company but satisfaction does not guarantee loyalty. In this vein, Mittal et al. (1998) offer empirical support for the existence of an asymmetric relationship between the attributes performance, overall satisfaction and behavioural intentions. Thus, a negative performance of an attribute will have a greater impact on overall satisfaction and on repurchase intentions than a positive performance (Yoon and Kim, 2000). In addition, overall satisfaction presents a decreasing sensitivity to the performance level of the attributes so that, at high levels of positive or negative performance of the attribute, it will be less affected than at intermediate levels. Therefore, the determinants and consequences of satisfaction and loyalty may differ from the determinants and consequences of dissatisfaction and disloyalty (Bloemer et al., 2002; Bloemer and Kasper, 1995). Futhermore, and closely related to the above, satisfaction does not always translate into loyalty and dissatisfaction does not always lead the customer to abandon the provider (Chuah, Rauschnabel, Marimuthu, Thurasamy and Nguyen, 2017; Liao et al., 2017). The relationship between satisfaction/dissatisfaction and consumer behaviour may therefore be weak or even non-significant. Several studies offer support for this assertion. For instance, the meta-analysis carried out by Szymanski and Henard (2001), although it shows the influence of satisfaction on repurchase, reveals that this only explains, generally, a quarter of the variance of behavioural intentions. Similarly, the study by Burnham et al. (2003) shows that exchange costs explain, in isolation, a greater proportion of the variance of repurchase intention than satisfaction itself (30 vs 16 per cent). Likewise, Reichheld (1996) reports that more than 65 per cent of customers who abandon their providers were satisfied. Kumar et al. (2013) also point out that the variance explained by satisfaction alone is quite small. In addition, several studies have found a non-significant influence of (dis)satisfaction on repurchase/switching. See, for example, Bodet (2008), Carpenter (2008) and Hellier et al. (2003).
Among the reasons that can make dissatisfied consumers stay with their current provider, the most cited are switching costs and inertia (Dagger and David, 2012). In contrast, satisfied customers may decide to switch providers because they perceive that there are more attractive alternatives in the market (Andreassen and Lervik, 1999; Liu et al., 2016) because they realise that another alternative could have been more satisfactory, thus making them regret the choice (Liao et al., 2017; Tsiros and Mittal, 2000; Zeelenberg and Pieters, 2004), or just for the sake of variety (Bansal et al., 2005; Ratner et al., 1999; Sánchez-García et al., 2012), among others.
With the aim of providing new insights into why satisfied customers switch service providers, this work analyses the effect of alternative attractiveness, anticipated and post-purchase regret and variety seeking on consumer switching intentions.
2.3 Alternative attractiveness
In their purchase decisions, consumers have to deal with a myriad of alternatives that are constantly changing due to strong competitive pressure. Furthermore, it is becoming increasingly easy to obtain information on different purchase options through personal and impersonal sources, such as blogs, virtual communities and newsletters, among others. This situation is reducing the length of the relationship between customers and providers (Buckinx and Van den Poel, 2005).
Alternative attractiveness refers to consumer perceptions about the extent to which there are other satisfactory alternatives available in the marketplace (Jones et al., 2000). The existence of a significant relationship between alternative attractiveness and consumer switching intentions has been supported by a number of researchers (Bansal et al., 2005; Lin et al., 2016; Liu et al., 2016; Roos et al., 2004). If consumers do not perceive that there are more attractive alternatives in the market, they may stay with their provider even though they are dissatisfied (Anderson and Narus, 1990; Jones et al., 2000). Consumers may also decide to switch providers despite being satisfied if they think there are better options (Andreassen and Lervik, 1999). Consequently, we posit that:
Alternative attractiveness has a positive influence on consumer switching intention.
2.4 Consumer regret
Regret has been defined in different ways and, so, scholars have not always studied the same phenomenon using the same term (Connolly et al., 1997). There is broad agreement on the fact that regret is an emotion with a cognitive base because it is necessary to think about “what might have been” to experience this emotion (Brehaut et al., 2003; Zeelenberg and Pieters, 2007). There is no consensus, however, on whether regret is necessarily linked to self-responsibility for the decision (Connolly et al., 1997; Zeelenberg and Pieters, 2007) or if the outcomes of the non-chosen alternatives must be known or if it is enough imagine what might have been (Tsiros and Mittal, 2000; Zeelenberg and Pieters, 2007). In the present work, we adopt the definition by Zeelenberg and Pieters (2007) because it is one of the most comprehensive. Thus, regret is conceived as “the emotion that we experience when realizing or imagining that our current situation would have been better, if only we had decided differently. It is a backward looking emotion signalling an unfavourable evaluation of a decision. It is an unpleasant feeling, coupled with a clear sense of self blame concerning its causes and strong wishes to undo the current situation” (Zeelenberg and Pieters, 2007, p. 3).
The regret theory posits that post purchase behaviour is determined both by the disconfirmation of expectations and by the foregone alternatives (Zeelenberg and Pieters, 2007). This theory is quite similar to the well-known cognitive dissonance theory although there are subtle differences. The cognitive dissonance theory posits that, when making an important purchase decision, consumers may feel psychological discomfort if they think they are not selecting the best option and these tensions can appear in any stage of the purchase and consumption process (Herrmann et al., 1999; Wilkins et al., 2016). When cognitive dissonance arises, consumers try to reduce it in different ways including blaming others, such as sellers, for the decision (Wilkins et al., 2016). The regret theory, however, is associated with self-blame because of an erroneous purchase decision so that satisfaction with the chosen option depends not only on the performance of the selected alternative but also on the foregone ones (Zeelenberg and Pieters, 2007). Regret is usually associated with the post-purchase stage and can appear in any kind of purchase.
The common reasoning underlying both theories, the cognitive dissonance theory and the regret theory, offer support for the thesis defended in this work: post-purchase behaviour is not only dependent on an internal comparison analysis (perceived performance with prior expectations), but also on an external one (perceived performance with real or imagined performance of foregone alternatives).
In the service provider switching behaviour context, this implies that if consumers regret their choice because they think other alternatives might have been better, they could decide to switch to another provider even though they are satisfied (Tsiros and Mittal, 2000). Indeed, Zeelenberg and Pieters (1999, 2004) obtained support for a direct effect of post-purchase regret on consumer switching intention. Hence, we hypothesise that:
Post-purchase regret has a positive influence on consumer switching intention.
Although, as noted above, the regret theory usually makes reference to post-purchase regret, several studies have addressed the role of anticipated regret in consumer behaviour (Chernev, 2004; Greenleaf, 2004; McConnell et al., 2000). These and other researchers defend that, when choosing among several alternatives, individuals anticipate the regret that they will feel if they make a wrong decision, and their choice is affected by this anticipated regret (Connolly and Butler, 2006; Zeelenberg and Pieters, 2007).
In the domain of service switching behaviour, “anticipated regret refers to a consumer’s active consideration of the regret he/she would feel after dropping a service” (Lin et al., 2016, p. 124). Lemon et al. (2002) proved that consumers take into account not only past and present but also anticipate the future regret when deciding whether or not to switch service providers. They performed an experiment with students using a fictitious online grocery store and found a significant effect of anticipated regret on intentions to drop the service. Likewise, Lin et al. (2016) also demonstrated through a real sample of customers from a health club that anticipated regret had a negative and significant effect on intention to renewal or exit.
Thus, if consumers anticipate regretting finishing the relationship with their provider, this will reduce the likelihood of switching (Lemon et al., 2002; Lin et al., 2016). Therefore:
Anticipated regret has a negative influence on consumer switching intention.
2.5 Variety seeking
Although variety-seeking research has a long tradition in marketing, there are still several topics than deserve investigation (Berné et al., 2001; Bigné et al., 2009). Most researchers have focussed on goods, so studies on the service industry are still scarce, and quite recent (Barroso et al., 2007; Niininen et al., 2004; Vázquez and Foxall, 2006). Specifically, the relationship between variety seeking and loyalty in services is an under-researched topic in the marketing literature (Berné et al., 2001, 2005).
Variety-seeking propensity has been found to be an important driver of consumer switching behaviour (Bansal et al., 2005; Van Trijp et al., 1996), since it is defined as a consumer tendency to change the item consumed in the last purchase (Givon, 1984; Kahn et al., 1986) or the propensity to seek diversity in the choice of goods and services (Kahn, 1995). It should be noted that we refer to intrinsic or true variety seeking, which involves switching brands, products or providers for the sake of variety and not because of the functional value of the alternatives (Berné et al., 2005; Van Trijp et al., 1996).
Many studies have measured consumer variety seeking propensity through an objective measure consisting of actual brand or provider switching behaviour conducted by a consumer in a concrete period of time (Menon and Kahn, 1995; Trivedi, 1999). It has been suggested in the literature that consumers’ past behaviour has a direct influence on their behavioural intentions (Bigné et al., 2009; Cheng et al., 2005; Leone et al., 1999). Consumer past switching behaviour has been defined as the extent to which consumers have switched providers in the past (Bansal et al., 2005). The greater the past switching behaviour, the lower the perception of switching costs (Burnham et al., 2003; Hu and Hwang, 2006) and, therefore, the higher the switching intention (Farah, 2017). Consequently, it is proposed that:
Past switching behaviour has a positive influence on consumer switching intention.
To sum up, customers may switch service providers even when satisfied if they perceive there are more attractive alternatives in the market because they realise or imagine that they could have been more satisfied with a different choice or just for the sake of variety. In contrast, the probability of switching will be lower if they anticipate they could regret the decision. The proposed model is depicted in Figure 1.
2.6 Hedonic vs utilitarian services: moderating effects
There is strong consensus in the literature that consumer behaviour is driven by hedonic and utilitarian motivations (Childers et al., 2001; Dhar and Wertenbroch, 2000; Fernandes and Pedroso, 2017; Lin, 2011). Utilitarian motivations are described as “mission critical, rational, decision effective, and goal-oriented” (Lin, 2011, p. 297) whereas hedonic motivations are related to “the search for happiness, fantasy, awakening, sensuality, and enjoyment” (Lin, 2011, p. 297).
In the same vein, most scholars conceive perceived value as a multidimensional construct and, although there is no agreement over its dimensions, the majority agree that it comprises a functional or utilitarian value and an emotional or hedonic value (Hur et al., 2013; Sheth et al., 1991; Sweeney and Soutar, 2001). Whereas hedonic value reflects the potential for entertainment and enjoyment, utilitarian value is associated with the accomplishment of a task (Babin et al., 1994, 2005; Chandon et al., 2000). Chaudhuri and Holbrook (2001) define hedonic value as a product’s potential to provide pleasure and utilitarian value as the ability of the product to perform functions in the consumer’s daily life.
In relation to the above, some authors talk of utilitarian or hedonic products and services (Dhar and Wertenbroch, 2000). In fact the same product may possess both types of value (Chaudhuri and Holbrook, 2001; Gursoy et al., 2006; Sloot et al., 2005), although consumers characterise some products as mainly hedonic and others as mainly utilitarian (Dhar and Wertenbroch, 2000). Hedonic products provide consumption that is more experiential, fun, pleasure and excitement, whereas utilitarian products are mainly instrumental and functional (Dhar and Wertenbroch, 2000). Therefore, to distinguish between utilitarian and hedonic services, the core benefit or main reason for consumption should be considered (Ng et al., 2007).
Finally, some authors differentiate between hedonic and utilitarian at attribute level (Baltas et al., 2017). For example Falk et al. (2010) attempt to explain the asymmetric relationship between service quality and satisfaction, by considering the hedonic or utilitarian nature of the different attributes of quality.
In this present study, we focus on analysing the moderating effect of the type of service, utilitarian vs hedonic, on the influence of the different antecedents of intention to switch provider.
At the product level, several studies have shown that product type (hedonic vs utilitarian) plays a moderator role in several areas of consumer behaviour, for instance, in the selection of purchase channel (Kushwaha and Shankar, 2013); country-of-origin effects (Sharma, 2011) and the effect of brand equity on consumer stock-out responses (Sloot et al., 2005), among others.
In the services domain, various works have shown that the nature of the service moderates the relationship between various evaluative variables. For example, Jiang and Wang (2006) demonstrated that pleasure and arousal had stronger impact on consumers’ perceived quality and satisfaction in hedonic than in utilitarian product/services. In the same vein, Hellén and Sääksjärvi (2011) showed that the effect of happiness on perceived quality and commitment varied depending on whether the service was hedonic or utilitarian. Similarly, Pollack (2015) found that the relationship between satisfaction and behavioural intentions differed according to the type of service. For example, they found that variety seeking was significant for discrete services with experiential benefits whereas switching costs were more important in utilitarian services. Likewise, the study by Lien and Kao (2008) showed that whereas technical quality is more influential on consumer satisfaction in the case of utilitarian services, functional quality is the most relevant driver of satisfaction in hedonic services. In addition, Baek and King (2011) found that the effects of perceived value for money, perceived quality and information costs on purchase intention differ between utilitarian and hedonic services.
In our case, as noted above, hedonic value reflects the fun and potential enjoyment of a service whereas utilitarian value is related to task completion, that is, utilitarian services are purchased for their functional features whereas hedonic ones are bought for the pleasure they provide (Babin et al., 2005; Bigné et al., 2008; Chiu et al., 2005; Shukla and Babin, 2013). These differences regarding purchase or consumption reasons lead to differences in how consumers evaluate both service types. In this way, when evaluating utilitarian services consumers use more cognitive cues. However, affective appraisals dominate hedonic services because the importance of experiencing personal pleasure and enjoyment during the service consumption is more salient here (Lien and Kao, 2008; Ng et al., 2007).
The above-mentioned differences between utilitarian and hedonic services suggest a moderating effect of service type on the determinants of service evaluation that has received only limited attention in the literature.
The previous divergences between utilitarian and hedonic services lead us to expect that the moderating role of service type could also be extended to the determinants of switching, that is, we propose that the determinants of consumers’ switching intentions will differ depending on the hedonic or utilitarian nature of the service because evaluation is also different. This idea is also reinforced by the fact that consumer variety-seeking behaviour is higher when the product has more hedonic attributes (Kahn and Lehmann, 1991; Van Trijp et al., 1996). Thus, the tendency of consumers to look for variety in the acquisition of hedonic services could lead them to search for a new provider or alternate among familiar ones despite being satisfied with the service because of the need for stimulation (Barroso et al., 2007; Vázquez and Foxall, 2006). We hypothesise then that in hedonic services, consumers will switch providers more than in utilitarian services (Carroll and Ahuvia, 2006; Van Trijp et al., 1996) independently of alternative attractiveness perception, satisfaction and post-purchase regret, as reflected in the following research questions:
The influence of satisfaction on consumer switching intention will be weaker for hedonic services than for utilitarian services.
The influence of alternative attractiveness on consumer switching intention will be weaker for hedonic services than for utilitarian services.
The influence of post-purchase regret on consumer switching intention will be weaker for hedonic services than for utilitarian services.
Jiang and Wang (2006) and Hellén and Sääksjärvi (2011) proved that the influence of affect/emotions on satisfaction, perceived quality and commitment was moderated by service type (hedonic vs utilitarian). Since anticipated regret is also an emotion, its influence on switching intention is expected to be moderated by the nature of the service. The idea is that in hedonic services consumers get pleasure from switching and, so, we reason that they will anticipate lower regret than in utilitarian services, reinforcing their decision to switch service provider. Therefore:
The influence of anticipated regret on consumer switching intention will be stronger for hedonic services than for utilitarian services.
As noted in the introduction past switching behaviour is considered a good proxy for variety seeking behaviour (Chintagunta, 1999). The search for variety has been identified as an important motivation for brand/provider switching behaviour (Bansal et al., 2005; Van Trijp et al., 1996), since it is defined as “ the tendency of an individual to seek diversity in the choice of goods or services, changing the item consumed on the last occasion” (Berné et al., 2001, 2005).
As pointed out previously, there is strong consensus over the more salient role played by variety seeking in hedonic vs utilitarian services (Pollack, 2015). Thus, in hedonic services, variety seeking will have a stronger impact on exit/repurchase intentions than in utilitarian services. Since variety seeking is captured here through past switching, it is hypothesised that past switching behaviour will have a stronger positive effect on switching intention in hedonic than in utilitarian services. Rational arguments therefore dominate exit decisions in utilitarian services and, so, more intense switching behaviour in the past does not necessarily imply a higher tendency to switch again. However, in hedonic services, past switching is carried out for the sake of variety and it is expected to be a strong predictor of new exiting behaviour. Hence, we postulate that:
The influence of past switching behaviour on consumer switching intention will be stronger for hedonic services than for utilitarian services.
3. Method
3.1 Research context
Mobile phone services and holiday destinations have been selected as the research setting. Several reasons led to the choice of mobile phone services for the present study. First, although currently mobile phones provide both hedonic and utilitarian benefits, the choice of a mobile phone company is guided mainly by functional reasons, such as the fees or the characteristics of the phone offered. Second, it can be considered a relational service, where consumers tend to continue with the same provider because of inertia and/or the presence of switching costs (Hu and Hwang, 2006; Lee et al., 2001). In fact, the mobile phone industry in the study context (Spain) is characterised by having barriers to switching that increase the risk for consumers. There are different types of switching costs: procedural (e.g. complex procedures for changing provider, excessively long waiting times, abusive long-term contract commitments etc.), financial (e.g. compensations for switching provider), functional (e.g. risk of not keeping the telephone number when switching provider, unexpected changes in coverage, etc.). According to the latest data from Spain’s Committee on Markets and Competition (Comisión Nacional de los Mercados y la Competencia, CNMC), in December 2017, in Spain, there were 52,009,637 mobile lines with a penetration rate over the population of 111.8. Finally, due to market saturation and strong competitive pressure in Spain, deeper knowledge of the determinants of consumer tendencies to switch mobile companies has relevant managerial implications.
The main motivation for selecting holiday destinations is twofold. First, because there is consensus in the literature concerning the predominance of hedonic motivations in the purchase of leisure and tourism services (Decrop and Snelders, 2005; Gursoy et al., 2006). Second, variety seeking plays a significant role in this product category (Barroso et al., 2007; Jang and Feng, 2007). The present work focusses on holiday destinations as opposed to weekend and long weekend trips. This makes it possible to identify different tourist profiles depending on their propensity to switch destinations: those who seek variety and those who prefer to return to the same destination for their holidays (Decrop and Snelders, 2005).
3.2 Research approach and sampling
The study is mainly quantitative, although two focus groups were used to adapt the measurement scales to the field of study. The focus of the research is causal and the information was collected in Spain by means of a structured questionnaire. In the case of mobile phone services, the target population comprises individuals between 18 and 65 years old who have a mobile phone for private use. Regarding holiday destinations, the target population consists of individuals between 18 and 65 years old who have travelled on their main holiday at least once in the last two years, excluding lodging in relatives and friends’ houses or their own secondary residence. A two-year period rather than a one-year period was established in order to make sample recruitment easier, as the proportion of Spanish inhabitants who travel for leisure is around 57 per cent but this figure would be even lower if secondary residences were excluded, as in the case of the present study. The variables under study focus on the last main holiday destination giving rise to a set of 172 holiday destinations visited by interviewees: sun-and-beach (e.g. Ibiza, Tenerife and Cuba, to name the most popular), urban destinations (e.g. Barcelona, Madrid, London, Paris) and rural holiday destinations (e.g. Pyrenees, Asturias).
The sample selection was a result of a combination of the random route sampling method and the establishment of gender and age quotas to ensure that the sample shows the same sociodemographic structure as the target population. Data were gathered in eight Spanish cities (A Coruña, Alicante, Bilbao, Madrid, Seville, Valencia, Valladolid and Zaragoza), and the questionnaire was administered personally to the respondents in their homes. Participants came from households chosen using the random route procedure in the above cities. After selecting the household, sample representativeness was ensured by fixing a priori gender and age quotas for the interviewees. This procedure was monitored by a company specialising in field work, with duly trained professional interviewers.
We finally obtained a sample size of 800 individuals, 400 for each service, with 4.9 per cent sample error, for a confidence level of 95.5% (p = q = 0.5). Table II shows the sociodemographic characteristics of the sample by the type of service. These samples comprise a similar number of males and females, with a predominance of 26–45 year olds, employed, with secondary studies and income similar to the average in Spain.
Sociodemographic profile of the sample
| Characteristics | Utilitarian % | Hedonic % |
|---|---|---|
| Gender | ||
| Men | 50.3 | 51.0 |
| Female | 49.7 | 49.0 |
| Completed studies | ||
| Primary | 35.5 | 27.1 |
| Secondary | 41.8 | 47.6 |
| University | 21.4 | 24.8 |
| Age | ||
| Up to 25 | 15.6 | 15.5 |
| 25–45 | 51.3 | 49.6 |
| 45 and over | 34.1 | 34.9 |
| Job | ||
| Not working | 25.2 | 21.8 |
| Self-employed | 13.9 | 13.9 |
| Employed | 56.9 | 60.5 |
| Retired | 4.0 | 3.8 |
| Household income (reference average €1,800) | ||
| Well below average | 14.1 | 7.8 |
| Below average | 25.3 | 19.7 |
| Average | 39.3 | 41.1 |
| Above average | 16.9 | 24.5 |
| Well above average | 4.4 | 6.9 |
The subsample of mobile telephone consumers was characterised by having long experience with the service, since 62 per cent had used it for more than five years. In total, 45 per cent had been with their operator for more than four years and almost 72 per cent for more than two years. Also, 67.3 per cent of interviewees had a contract with their provider, as against 31 per cent who had the prepaid service. As regards the subsample of consumers of holiday destinations, 85 per cent of the sample travel between one and three times a year for leisure, and only 15 per cent do so more frequently. The last holiday trips were mainly 5–14 days long (68 per cent) during the summer period (67.5 per cent). Holiday destinations were mainly urban and cultural (43.7 per cent), followed by sun-and-beach (39.7 per cent) and rural tourism (8.5 per cent). Finally, interviewees usually choose the same type of holiday, since 60 per cent said they went on the same type of holiday often, almost always or always.
3.3 Measurement scales
In the appendix is a description of the measurement scale for the variables in this study. The initial questionnaire was pretested before establishing its final form. In total, 25 users of mobile telephony and 25 users of holiday destinations were interviewed. This pretest helped to improve the wording of the questions and even reconsider the composition of some scales, which was important for refining the final measurement instrument. In this study, we followed the double translation protocol: the original scales (in English) were translated into Spanish, and then back into English to report the results. In Tables AI and AII, we detail the measurement scales selected for each variable for both services.
Mobile services
| Please show from 1 (totally disagree) to 7 (totally agree) your level of agreement with the following statements | ||||||||
| Satisfaction | ||||||||
| sat1 | I am satisfied with my mobile company (MC) | 1 | 2 | 3 | 4 | 5 | 6 | 7 |
| sat2 | My MC meets my needs extremely well | 1 | 2 | 3 | 4 | 5 | 6 | 7 |
| sat3 | What I get from my MC is what I expect for this service | 1 | 2 | 3 | 4 | 5 | 6 | 7 |
| sat4 | Globally, I am satisfied with the service provided by my MC | 1 | 2 | 3 | 4 | 5 | 6 | 7 |
| Alternative attractiveness | ||||||||
| atr1 | I would probably be happy with another MC | 1 | 2 | 3 | 4 | 5 | 6 | 7 |
| atr2 | If I needed to switch there are other good MC to choose from | 1 | 2 | 3 | 4 | 5 | 6 | 7 |
| atr3 | Compared to my MC, there are other MC with which I would be equally satisfied | 1 | 2 | 3 | 4 | 5 | 6 | 7 |
| Post-purchase regret | ||||||||
| preg1a | It was a wise decision | 1 | 2 | 3 | 4 | 5 | 6 | 7 |
| preg2 | I regret the choice | 1 | 2 | 3 | 4 | 5 | 6 | 7 |
| preg3a | If I had to do it over again I would make the same choice | 1 | 2 | 3 | 4 | 5 | 6 | 7 |
| preg4a | The choice has been beneficial for me | 1 | 2 | 3 | 4 | 5 | 6 | 7 |
| preg5a | I consider it a right decision | 1 | 2 | 3 | 4 | 5 | 6 | 7 |
| Show from 1 (totally disagree) to 7 (totally agree) your level of agreement with the following statements regarding how you think you would feel about switching to another mobile company | ||||||||
| Anticipated regret | ||||||||
| areg1a | I would think it is a wise decision | 1 | 2 | 3 | 4 | 5 | 6 | 7 |
| areg2a | I would not regret leaving my company | 1 | 2 | 3 | 4 | 5 | 6 | 7 |
| areg3a | I would feel that if I had to do it over again I would go for the same choice | 1 | 2 | 3 | 4 | 5 | 6 | 7 |
| areg4a | I would think that the decision is beneficial for me | 1 | 2 | 3 | 4 | 5 | 6 | 7 |
| areg5a | I would consider it a right decision | 1 | 2 | 3 | 4 | 5 | 6 | 7 |
| Past switching behaviour | ||||||||
| psb | How many mobile companies have you been with since you started using this kind of service? | – | ||||||
| Switching intention | ||||||||
| si | Rate the probability of switching to another MC within the next two months from 1 (definitely not) to 7 (yes, definitely) | 1 | 2 | 3 | 4 | 5 | 6 | 7 |
Note: aReverse coded
Holiday destinations (HD)
| Please show from 1 (totally disagree) to 7 (totally agree) your level of agreement with the following statements | ||||||||
| Satisfaction | ||||||||
| sat1 | I am satisfied with my experience in X | 1 | 2 | 3 | 4 | 5 | 6 | 7 |
| sat2 | My trip to X meets my needs extremely well | 1 | 2 | 3 | 4 | 5 | 6 | 7 |
| sat3 | What I get from my trip to X is what I expected for this trip | 1 | 2 | 3 | 4 | 5 | 6 | 7 |
| sat4 | Globally, I am satisfied with my experience in X | 1 | 2 | 3 | 4 | 5 | 6 | 7 |
| Alternative attractiveness | ||||||||
| atr1 | I would probably be happy with another HD | 1 | 2 | 3 | 4 | 5 | 6 | 7 |
| atr2 | If I needed to switch there are other good HD to choose from | 1 | 2 | 3 | 4 | 5 | 6 | 7 |
| atr3 | Compared to X, there are other HD with which I would be equally satisfied | 1 | 2 | 3 | 4 | 5 | 6 | 7 |
| Post-purchase regret | ||||||||
| preg1a | It was a wise decision | 1 | 2 | 3 | 4 | 5 | 6 | 7 |
| preg2 | I regret the choice | 1 | 2 | 3 | 4 | 5 | 6 | 7 |
| preg3a | If I had to do it over again I would make the same choice | 1 | 2 | 3 | 4 | 5 | 6 | 7 |
| preg4a | The choice has been beneficial for me | 1 | 2 | 3 | 4 | 5 | 6 | 7 |
| preg5a | I consider it a right decision | 1 | 2 | 3 | 4 | 5 | 6 | 7 |
| Show from 1 (totally disagree) to 7 (totally agree) your level of agreement with the following statements regarding how you think you would feel about switching to another mobile company | ||||||||
| Anticipated regret | ||||||||
| areg1a | I would think it is a wise decision | 1 | 2 | 3 | 4 | 5 | 6 | 7 |
| areg2a | I would not regret switching to a different HD | 1 | 2 | 3 | 4 | 5 | 6 | 7 |
| areg3a | I would feel that if I had to do it over again I would go for the same choice | 1 | 2 | 3 | 4 | 5 | 6 | 7 |
| areg4a | I would think that the decision is beneficial for me | 1 | 2 | 3 | 4 | 5 | 6 | 7 |
| areg5a | I would consider it a right decision | 1 | 2 | 3 | 4 | 5 | 6 | 7 |
| Past switching behaviour | ||||||||
| psb | How many different tourist destinations have you gone on your main holidays in the last 4 years? | – | ||||||
| Switching intention | ||||||||
| si | Rate the probability that on your next main vacation trip you will go again to X from 1 (definitely not) to 7 (yes, definitely) | 1 | 2 | 3 | 4 | 5 | 6 | 7 |
Notes: aReverse coded. The questions refer to the last main holiday destination: X
The review of the literature on consumer satisfaction highlights the absence of agreement over measurement of this construct (Giese and Cote, 2000; Oliver, 1997). Despite decades of research interest in this concept different methodological approaches co-exist: direct and indirect measurement (Yi, 1990); single-item or multi-item measures (Babin and Griffin, 1998; Oliver, 1997; Westbrook, 1987; Yi, 1990); and various scale intervals and response formats (Babin and Griffin, 1998; Yi, 1990).
When determining the scale to use in this study to measure overall satisfaction, it was ensured that there were no measures of regret of the type “My choice of X was correct” (Patterson and Smith, 2003), given that regret will be studied as a different concept, thereby avoiding problems of discriminant validity. Additionally, a scale used in a work focussing on provider switching behaviour has been used.
Thus, the scale finally used to measure global satisfaction is based on Burnham et al. (2003), and initially comprised five items that gathered information on: overall satisfaction with the provider; whether the provider meets the individual’s needs; assessment of the relationship; fulfilment of expectations; and overall satisfaction with the service. The pretest confirmed that this scale was suitable because there were no difficulties with comprehension or assessment, but it also led to the elimination of one item, item 3.
The scale used to assess alternative attractiveness is based on Jones et al. (2000) and Ping (1993). Concerning regret, the scale developed by Brehaut et al. (2003) was used to measure post purchase regret, and also anticipated regret with the pertinent adaptation. Past switching behaviour was captured by means of an objective question that collected the number of different providers the consumer had used, following Niininen et al. (2004). In mobile phone services, interviewees were asked about the number of different companies they had been with since becoming users of this type of service because the number of providers is limited. However, for holiday destinations, the period of time was constrained to the last four years to facilitate the response.
Finally, to measure switching intention, a one-item scale option was selected, following other authors such as Garland (2002), Jones et al. (2003) and Mittal and Kamakura (2001). Due to the fact that one of the objectives of the present work is to analyse the effect of variety seeking on switching behaviour and variety seeking has been defined as the tendency of an individual to change the item acquired in the last purchase event (Kahn et al., 1986), it is necessary to restrict the temporal period of reference. In the case of mobile phone services, respondents were asked about their intention to switch their mobile company in the next two months, following Bansal et al. (2005). In holiday destinations, interviewees were asked about their intention to go to a different destination in their next holiday trip.
4. Findings and discussion
Before testing the proposed hypotheses, the psychometric properties of the measurement scales were evaluated. Measurement instrument validity and reliability were verified by confirmatory factor analysis (CFA) with EQS 6.1 (Bentler, 2005) and including all the latent variables in our theoretical model. Given that model estimation showed no evidence of multivariate normality (Mardia normalised coefficient is 21.81 and 57.74 for mobile services and holiday destinations, respectively), we report robust statistics (Satorra and Bentler, 1994) for model estimation using the maximum likelihood method.
Three items (atr1, preg2 and sat1) were eliminated in the holiday destinations measurement model because they were causing convergent validity problems. These items were also removed from the mobile services measurement model to ensure factor structural equivalence and configural invariance between groups (Hair et al., 2006).
Results of the final CFAs confirmed that the measurement model provided a good fit to the two data sets on the basis of various fit statistics. CFA results (see Tables III and IV) provide evidence of reliability, convergent and discriminant validity according to the criteria proposed by Anderson and Gerbing (1988), Bagozzi and Yi (1988) and Fornell and Larcker (1981).
Reliability and convergent validity of the measurement model
| Convergent validity | Reliability | ||||||||||
| Factor loading (robust t-value) | Loading average | α | CR | AVE | |||||||
| Factor | Item | (M)obile | (D)estinations | M | D | M | D | M | D | M | D |
| SATISFACTION (SAT) | sat2 | 0.86 (15.08) | 0.83 (10.54) | 0.90 | 0.85 | 0.92 | 0.89 | 0.92 | 0.89 | 0.80 | 0.72 |
| sat3 | 0.92 (18.27) | 0.89 (12.19) | |||||||||
| sat4 | 0.91 (18.29) | 0.83 (9.94) | |||||||||
| ALTERNATIVE ATTRACTIVENESS (ATR) | atr2 | 0.77 (11.16) | 0.76 (8.85) | 0.82 | 0.74 | 0.80 | 0.70 | 0.81 | 0.71 | 0.67 | 0.55 |
| atr3 | 0.87 (12.51) | 0.72 (8.90) | |||||||||
| POST PURCHASE REGRET (PREG) | preg1 | 0.90 (16.07) | 0.88 (13.86) | 0.86 | 0.83 | 0.91 | 0.89 | 0.92 | 0.90 | 0.74 | 0.70 |
| preg3 | 0.86 (15.84) | 0.77 (13.70) | |||||||||
| preg4 | 0.82 (19.30) | 0.82 (17.04) | |||||||||
| preg5 | 0.86 (17.14) | 0.87 (14.24) | |||||||||
| ANTICIPATED REGRET (AREG) | areg1 | 0.90 (27.35) | 0.76 (14.80) | 0.92 | 0.83 | 0.96 | 0.91 | 0.96 | 0.92 | 0.84 | 0.69 |
| aref2 | 0.86 (25.22) | 0.76 (12.82) | |||||||||
| areg3 | 0.93 (30.59) | 0.88 (15.10) | |||||||||
| areg4 | 0.95 (31.57) | 0.83 (13.71) | |||||||||
| areg5 | 0.95 (32.39) | 0.90 (13.05) | |||||||||
| Goodness of fit indexes | |||||||||||
| NFI | NNFI | CFI | IFI | RMSEA | |||||||
| Mobile services | S-B χ2 (71df)=138.04 (p=0.00) | 0.962 | 0.976 | 0.981 | 0.981 | 0.049 | |||||
| Destinations | S-B χ2 (71df)=137.61 (p=0.00) | 0.926 | 0.952 | 0.962 | 0.963 | 0.048 | |||||
Notes: α, Cronbach’s alpha; CR, composite reliability; AVE, average variance extracted
Discriminant validity of the measurement model
| SAT | ATR | PREG | AREG | |
|---|---|---|---|---|
| Mobile services data set | ||||
| SAT | 0.80 | 0.02 | 0.66 | 0.12 |
| ATR | [0.18;0.42] | 0.67 | 0.07 | 0.13 |
| PREG | [0.21;0.33] | [0.55;0.79] | 0.74 | 0.16 |
| AREG | [−0.12;0.04] | [−0.21;0.03] | [−0.18;−0.02] | 0.84 |
| Holiday destinations data set | ||||
| SAT | 0.72 | 0.00 | 0.01 | 0.00 |
| ATR | [−0.15;0.09] | 0.55 | 0.00 | 0.11 |
| PREG | [−0.04;0.16] | [−0.11;−0.17] | 0.70 | 0.00 |
| AREG | [−0.16;0.04] | [0.19;0.47] | [−0.06;0.14] | 0.69 |
Notes: Diagonal represents average variance extracted: above the diagonal, the shared variance (squared correlations) are represented; below the diagonal, the 95% confidence interval for the estimated factors correlations is provided
After refining the measurement scales and with the aim of testing the first five hypotheses, structural equation analysis was carried out using EQS 6.1 and the maximum likelihood estimation method, corrected with robust statistics. The main results obtained for mobile services and holiday destinations are shown in Table V. In addition, the results are graphically represented in Figures 2 and 3 to facilitate comparison.
Antecedents of service provider switching intention
| Mobile services | Destinations | |||||||
|---|---|---|---|---|---|---|---|---|
| H | Signa | Structural relations | β | Robust t | S/NS | β | Robust t | S/NS |
| H1 | (−) | Satisfaction→Switch Int | −0.17 | −1.66 | Not supported | −0.06 | −0.72 | Not supported |
| H2 | (+) | Alt. attractiveness→Switch Int | 0.18 | 3.31** | Supported | 0.14 | 2.36* | Supported |
| H3 | (+) | Post purchase regret→Switch Int | 0.43 | 3.99** | Supported | 0.12 | 1.67 | Not supported |
| H4 | (−) | Anticipated regret→Switch Int | −0.03 | −0.78 | Not supported | −0.16 | −3.48** | Supported |
| H5 | (+) | Past switching→ Switch Int | 0.02 | 0.49 | Not supported | 0.31 | 5.89** | Supported |
Notes: S/NS, hypotheses support or not support. aHypothetical sign of the relation. *p<0.05; **p<0.01
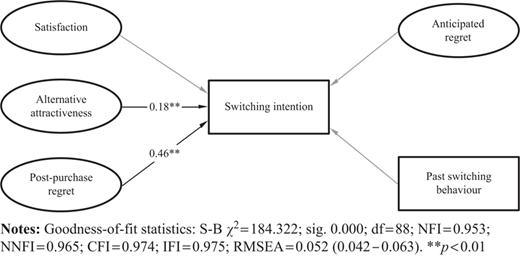
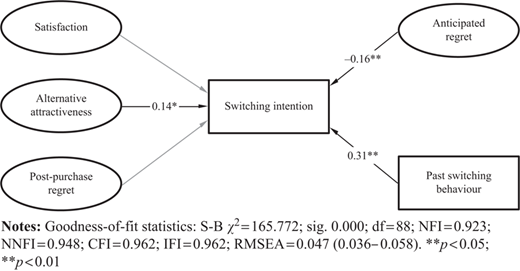
A first approach to the results showed several differences in the significant antecedents of mobile services and holiday destination switching intentions, finding agreement only regarding the effect of satisfaction and alternative attractiveness. Surprisingly, satisfaction was not a significant antecedent of switching intention (H1) in mobile services or in holiday destinations despite the fact that this relationship has been strongly supported by the literature (Bansal et al., 2005; Manrai and Manrai, 2007). These findings are in line with the researchers who argue that the relationship between satisfaction and behavioural intentions is more complex than it first appears (Patterson, 2004; Yi and La, 2004) and also offers support to the underlying idea of this work: factors other than satisfaction are needed to explain service provider switching propensity. In utilitarian services (e.g. mobile services), post-purchase regret could be the main driver of exiting decisions, while in hedonic services (e.g. holiday destinations), variety seeking could trigger switching behaviour.
Alternative attractiveness (H2) exerted a significant direct impact on switching intention in both services, corroborating the findings of previous studies (Bansal et al., 2005; Jones et al., 2000; Vázquez and Foxall, 2006). Therefore, when consumers perceive that there are more satisfactory viable options in the marketplace, the likelihood of switching their current service provider increases regardless of whether the service is utilitarian or hedonic.
Post-purchase regret (H3) was the main driver of switching intention in the utilitarian service. These results add new empirical support to the findings obtained by Tsiros and Mittal (2000) and Zeelenberg and Pieters (2004), reinforcing the idea that post purchase regret is a key concept to explain switching behaviour. However, this factor had no influence on switching intention in the hedonic service. These findings could be explained by the high propensity of consumers to seek variety in the purchase of hedonic products (Carroll and Ahuvia, 2006; Van Trijp et al., 1996) and, especially, in tourism and leisure services (Barroso et al., 2007; Jang and Feng, 2007). Consequently, tourists may decide to switch holiday destinations on their next trip, despite not regretting their last choice, for the sake of variety.
As far as the effect of anticipated regret is concerned (H4), results showed a non-significant influence on switching intention in the context of mobile services. In this particular case, it could be observed that whereas the regret that interviewees think they would feel if they switched mobile company is low because they consider there are other good companies to choose from, switching intention is not high. This could be due to switching costs perception or inertia, which are more relevant in this type of service. In contrast, in holiday destinations anticipated regret linked to switching significantly predicted switching intention. In this service, given that consumers thought they would not regret travelling to a different destination for their next holiday trip, switching intention was higher.
Finally, past switching behaviour (H5) was not a significant predictor of switching intention in the utilitarian service. This could be explained by the interviewees’ low propensity to switch their mobile company due to the relational nature of this type of service. However, past switching behaviour positively affected intention to switch holiday destinations, and was even the most influential factor. Hence, consumers who had been to more different destinations in recent years were also the ones more prone to changing again for their next trip. Consequently, findings in the hedonic service setting agreed with those obtained by Bansal et al. (2005), whereas the results for the utilitarian service were consistent with Cheng et al. (2005). Further research is therefore needed to elucidate the effect of past switching behaviour on service provider switching intention.
A multigroup analysis was run to test whether the type of service (utilitarian vs hedonic) moderated the influence of satisfaction, alternative attractiveness, post-purchase and anticipated regret and past switching behaviour on switching intentions (RQ6a–RQ6e). The results are shown in Table VI.
Multigroup analysis: moderating effect of type of service
| G1: mobile | G2: destination | ||||
|---|---|---|---|---|---|
| H | Structural relation | Loading (t-value) | Loading (t-value) | χ2 Diff. | S/NS |
| RQ6a | Satisfaction→Switch Int (G1>G2) | −0.17 (−1.66) | −0.06 (−0.72) | 12.61** | Supported |
| RQ6b | Alt. attractiveness→Switch Int (G1>G2) | 0.18 (3.31**) | 0.14 (2.36*) | 1.50 | Not supported |
| RQ6c | Post purchase regret→Switch Int (G1>G2) | 0.43 (3.99**) | 0.12 (1.67) | 16.84** | Supported |
| RQ6d | Anticipated regret→Switch Int (G1<G2) | −0.03 (−0.78) | −0.16 (−3.48**) | 4.14* | Supported |
| RQ6e | Past switching→Switch Int (G1<G2) | 0.02 (0.49) | 0.31 (5.89**) | 15.62** | Supported |
| S-B χ2 (176df)=349.268 (p=0.00) | BBNFI 0.940 | BBNNFI 0.958 | CFI 0.969 | IFI 0.970 | RMSEA 0.050 |
Notes: S/NS, RQ support or not support. *p<0.05; **p<0.01
The significance of the χ2 difference showed that, as predicted, the effect of satisfaction on switching intention was weaker in the case of hedonic services (RQ6a). However, as discussed previously, satisfaction was not really an influential factor even in the case of mobile services because its effect was only significant at p<0.10. Hence, other drivers of switching must be found. In this regard, post-purchase regret strongly affected switching intention in the utilitarian service. Nevertheless and, as expected, its effect was weaker and even non-significant for the hedonic service. Concerning alternative attractiveness and contrary to our hypothesis, if consumers perceive that there are other attractive options in the marketplace, this is going to increase their switching intention regardless of the type of service. Finally, and consistent with our predictions, anticipated regret and past switching behaviour had a stronger effect on holiday destination users’ switching intention than in mobile users. The higher propensity to variety seeking associated with hedonic services in contrast to utilitarian services goes a long way to explaining the above results Table VI.
5. Conclusions and implications
The main purpose of the present research was to gain new insights into the drivers of service provider switching intention beyond the ECT and, additionally, analyse the moderating role of the type of service (utilitarian vs hedonic) on the determinants of switching intention. Specifically, the effects of alternative attractiveness, post-purchase and anticipated regret and past switching behaviour have been studied. The findings contribute to revisit the debate in the literature regarding the relationship between satisfaction and behavioural intentions. In this regard, several researchers have pointed out that the relationship between both variables is more complex than it first appears (Hau and Thuy, 2012; Pan et al., 2012).
In fact, the results show that satisfaction is not a significant antecedent of switching intention in the hedonic service and its effect is only significant at p<0.10 in the utilitarian service. These findings are in line with previous studies that have shown that satisfaction only accounts for a small portion of the variance of consumer behaviour in the future (Kumar et al., 2013; Szymanski and Henard, 2001). For instance, the meta-analysis by Szymanski and Henard (2001), although evidencing the influence of satisfaction on repurchase, highlighted that it only explained, generally, a quarter of the variance of the behavioural intentions. Likewise, Bodet (2008), in a sport service context (a fitness club), found that satisfaction did not predict customer repurchase behaviour.
There are several possible explanations for the non-significant effect of satisfaction on switching intentions. First, there is evidence that the effect of satisfaction on behavioural intentions is non-linear and asymmetric (Chuah, Marimuthu, Kandampully and Bilgihan, 2017; Liao et al., 2017). Therefore, the antecedents and consequences of satisfaction and loyalty may differ from the determinants and outcomes of dissatisfaction and disloyalty (Bloemer et al., 2002; Bloemer and Kasper, 1995). In other words, whereas dissatisfaction very often leads to switch the current provider, merely satisfying a customer frequently is not enough to avoid switching (Calvo-Porral et al., 2017; Liao et al., 2017).
Second, the strength of the effect of satisfaction on loyalty depends on certain idiosyncratic factors (Kumar et al., 2013) such as the considered industry, the market segment and the presence of switching barriers (i.e. switching costs) or switching triggers (e.g. alternative attractiveness or variety seeking). According to this reasoning, the lack of influence of satisfaction on switching intentions in holiday destinations could be due to tourists’ desire for variety in their next holiday trip. In the case of mobile services, most likely, the existence of other attractive options (Calvo-Porral et al., 2017) diminishes the impact of satisfaction on changing providers but increases the thoughts of “what might have been if I had chosen B instead of A…” (i.e. post-purchase regret). Thus, the impact of satisfaction on switching or repurchase intentions may differ depending on the type of service and the findings of the present study cannot be generalised to other sectors without caution. For example, in a service with high switching costs like financial services, the relationship between satisfaction and retention is likely to be medium or even low but not because satisfied customers leave but because dissatisfied customers stay due to inertia or searching costs, among others.
Thus, results provide support for the theoretical argument proposed in this study: satisfaction is no longer a necessary or sufficient condition to avoid service switching behaviour and, so, further drivers must be found.
In the utilitarian service, the main predictor of switching intention is post-purchase regret, followed some way off by alternative attractiveness. Thus, if consumers regret their decision because they think that other alternatives could have been more satisfactory, they might decide to switch to another provider even if initially they were satisfied. In the hedonic service, although the perception of other attractive alternatives also has a significant effect on switching propensity, the principal determinant of switching intention is past switching behaviour and, to a lesser extent, anticipated regret. Therefore, results show important differences between the antecedents of switching in utilitarian and hedonic services that have been confirmed by means of a multigroup analysis. An important explanation for these discrepancies is the higher variety-seeking propensity associated to hedonic vs utilitarian services. Also, differences in the way consumers evaluate hedonic and utilitarian services, through an affective or cognitive approach respectively, may explain part of these divergences.
Another point that needs further discussion is if the previous arguments can be applied to any hedonic service or are specific to tourist destinations. Hedonic services have been associated with variety seeking propensity. However, in other hedonic services, the temporal pattern could be different. For example, in a restaurant, maybe in the short run, satisfaction could lead to return when the individual has not reached saturation point because there are still new dishes to taste but, after repeated visits, the marginal intention to return could decrease if the stimulation level provided by the restaurant falls below the optimum. Nevertheless, there are also consumers who do not like to repeat the restaurant in two consecutive purchases and prefer to alternate among different providers. Hence, there is an important gap in the literature regarding the temporal effect of satisfaction and variety seeking on hedonic services switching behaviour.
Concerning the managerial implications of this study, in utilitarian services, it is important to emphasise that in defensive marketing strategies, service managers should aim to reduce post purchase regret or increase rejoice in order to discourage customers from switching. In contrast, in offensive marketing strategies, service managers should increase post-purchase regret of competitors’ customers, stressing that they could be more satisfied with other alternatives. In the mobile phone sector, these strategies are usually based on prices and the device offered but, depending on the type of service, other features could be highlighted. In hedonic services, however, companies should design offensive strategies based on reducing anticipated regret associated to switching by strengthening the perception that there are better alternatives in the marketplace. Also, in defensive strategies, since variety seeking is important, hedonic services providers should change the content of their services adding new stimuli quite often in order to satisfy consumer variety needs and induce positive affect and surprise, what may lead to repatronage behaviour (Jiang and Wang, 2006). For example, in the travel industry, destination managers could increase the stimulation level of the experience by designing new products or activities such as festivals or events. Also, in offensive marketing strategies, destination managers should encourage tourists to share content in internet using eWom as a mean of reducing anticipated regret and capturing new visitors.
The main limitation of the present work consists of the consideration of only one utilitarian and one hedonic service in the empirical study. This makes it difficult to generalise the findings because the detected differences could be due not only to the utilitarian or hedonic nature of the services, but also to other idiosyncratic features such as the number of competitors, their communication effort, continuous vs sporadic consumptions of the service or the economic cost, among others. Specifically, the choice of holiday destinations as the hedonic service could bias the results because it is a very particular product where consumer switching behaviour is more salient than in other hedonic services such as paddle courts or golf courses. Thus, future research is encouraged that can offer new insights into the role played by anticipated and post purchase regret in other utilitarian and hedonic services.
A technical limitation of this work is that after testing for different types of invariance between groups (partial or complete), only the requirements of configural invariance were met. In the future, it would be necessary to replicate the estimation of the model in both types of services, ensuring compliance with other forms of invariance.
Another limitation is the different time horizon of the switching intention considered for mobile services (two months) and for holiday destinations (next holiday trip) and thus, an interesting research line to advance understanding of service switching behaviour is the analysis of such behaviour in different time periods. In this sense, the study could be repeated, considering not only short-term switching intention but also mid- and long-term intentions.
As a fourth limitation, it is important to note that despite broad agreement on the influence of switching costs on switching intentions (Chuah, Rauschnabel, Marimuthu, Thurasamy and Nguyen, 2017) the variable was not considered in this study because our focus was on consumers’ switching behaviour in spite of being satisfied. Thus, future studies should analyse jointly the influence of ECT, external reference points (i.e. regret and alternative attractiveness), switching costs and variety seeking on consumers future behaviour considering that switching costs could affect as both a direct antecedent and as a moderator. A very similar concept that requires further insights is consumer inertia that could make customers stay with their current provider just out of habit. In addition, several personality traits could moderate the impact of the determinants of switching either by enhancing it or by attenuating it such as risk aversion proneness, consumer innovativeness or prudence, among others. In the case of utilitarian continuous services such as mobile services, customer seniority could also moderate the impact of the determinants of switching intentions, which is an interesting avenue to explore in future research.