Railway networks are constructed, maintained and developed to provide service to stakeholders. The timing of infrastructure interventions depends on the costs of intervening and the risks of not intervening. Determining the optimal trade-off requires a rigorous definition of the service provided and a way to quantify it. In this paper, such a definition and method of service quantification for the railway infrastructure is provided. Service is defined as a function of how every stakeholder is affected by the changes in the state of the railway infrastructure. It is quantified by estimating the value of each unit of service provided. This definition of service enables the quantification of railway service for all the affected stakeholders when the infrastructure state improves – for example, due to maintenance – or deteriorates – for example, due to fatigue.
Introduction
Transportation is key to the proper functioning and economic growth of a society. Railway systems are built to enable the transportation of people and goods. However, their construction, use, operation, maintenance and development affect in many ways multiple stakeholders within the society. Understanding, defining and quantifying these effects is crucial for the railway manager who wants to know the effects on service of different decisions – that is, when and what is the optimal way to intervene and change the state of the infrastructure.
The term ‘railway service’, which is the service provided by the railway systems, is often used without providing a definition. However, for this work, it is essential to provide a clear definition of this term before using it. Service is, as defined for this paper, the effect – that is, positive or negative – on stakeholders due to the operation of a system. Transport service is the effect on stakeholders due to the transportation of people or goods for x units of distance, in y units of time, or enabling this transportation. Transportation systems exist to provide transport service. The railway system is one type of transportation system that exists to provide transport service – that is, to transport passengers and goods from station A to B in y units of time. Railway service is the service provided to stakeholders from the operation of railway systems.
Railway systems consist of three subsystems, the railway infrastructure, the rolling stock and the railway operation. Railway infrastructure, at least in this paper, is considered the subsystem of fixed physical objects that are required to provide railway service. According to the European Community (EC, 2012), the railway infrastructure consists of the ground area; the track and trackbed; the engineering structures; the level crossings; the track superstructure; the access ways; the installations for safety, signalling and telecommunication; the lighting installations; and the electric traction supply system. Rolling stock is the subsystem of rail vehicles on which people and goods travel. Railway operation is considered the subsystem line paths, service intentions, policies and rules that are responsible for the traffic flow of rolling stock on the infrastructure. When any of those components of the infrastructure does not work as intended, the service provided by the railway system is compromised. For example, infrastructure failures (e.g. switch failure), rolling stock failures (e.g. failure of the train’s braking system) and failures of the railway operation (e.g. dispatching two trains on the same block at the same time) can all lead to accidents, delays and the execution of interventions. However, this paper focuses on the part of the railway service that is affected by the changes in the state of the first subsystem, the railway infrastructure. In this context, the railway service related to the infrastructure is the service provided to people due to the operation of the railway infrastructure.
The railway infrastructure loses its ability to provide service over time, through use, environmentally induced deterioration and changes in demand. Railway managers execute interventions to maintain, restore or improve the infrastructure’s state to ensure that the infrastructure provides an adequate level of service (EC, 2007). However, the service provided by the infrastructure might also be affected by the execution of interventions. For example, during mechanical tamping, the track must remain closed to traffic. Every change in the state of the infrastructure either positive (i.e. maintenance, restoration, development) or negative (i.e. deterioration, failure, demolition) has different impacts on the service provided by the infrastructure to the stakeholders.
Railway managers are responsible for ensuring that the changes in the state of the infrastructure have an overall minimum negative impact on the service provided, by deciding to execute, postpone or neglect interventions. Consequently, to make these decisions, it is required to have an exact definition of service and to be able to quantify service in a way that there is a direct link between the changes in the infrastructure’s state and the changes in service experienced by different stakeholders. For example, when the state of a track section degrades to a level that a maximum speed restriction is imposed to ensure safety, the passengers might experience delays but are less likely to experience accidents. In this example, the change in the state of the track and the decision to impose a maximum speed restriction has a direct impact on the service offered to the passengers, as the users of the system. If this track section is maintained before it reaches a critical state and therefore there is no need to impose a maximum speed restriction, the passengers will not experience any delays and will be less likely to experience accidents. In other words, the railway service related to the change in the state of the infrastructure – for example, deterioration or maintenance of the track – has a direct impact on the service provided to the stakeholders– for example, delays. The scope of this paper is to propose a methodology for defining and quantifying the railway service for all the affected stakeholders when the infrastructure state changes. Railway managers can use this methodology to define and quantify the service due to all the changes, positive or negative, in the state of the infrastructure – that is, they can assess the impact on service when interventions are executed, postponed or neglected.
This work is organised as follows. The literature review is presented in the section headed ‘Literature review’. The definition of the railway service is provided in the section headed ‘Defining the railway service in space and time’. The stakeholders of the railway infrastructure are presented in the section headed ‘Stakeholder groups’. The section headed ‘Quantification of impacts’ contains the definition and quantification of impacts for each stakeholder, while in the section headed ‘Example’, an example is presented of an application of the proposed methodology. A discussion about the findings, the advantages and shortcomings of the proposed methodology is given in the section headed ‘Discussion’. Some concluding remarks and suggestions for future work are given in the section headed ‘Conclusions’.
Literature review
Currently, the railway service related to the infrastructure – that is, the service provided to people due to the operation of the railway infrastructure – is predominantly measured using proxies of service. Four proxies that are often used are state, reliability, availability and safety (Adey et al., 2019a). The state is considered a measure of the structural and operational condition of the infrastructure. When the state is used to assess the service of the railway infrastructure, often the condition of the different components of the infrastructure is examined. For example, in the paper by Gkountis and Zayed (2015), the condition of the structural, electric and mechanical components of subway stations is examined to determine whether they are functional. The condition or state of the infrastructure is then often used as an indicator of the probability of a defect or a failure to occur, which is related to reliability. Reliability is the probability that the infrastructure will provide an adequate level of service. When reliability is used to assess the service of the railway infrastructure, often the probability of failure of the infrastructure is estimated. For example, in the papers by Jamshidi et al. (2016) and Kumar et al. (2010), the probability of rail failure is estimated. Availability is the amount of time that the infrastructure is likely to provide an adequate level of service. For example, in the papers by Stenström et al. (2016) and Qiu et al. (2014), the availability of a signalling system is estimated. Safety is the probability that people will be involved in accidents due to infrastructure failures. When safety is used to assess the level of service of the railway infrastructure, either the probability of an accident or derailment is estimated or the probability of fatalities or injuries due to an accident is estimated. For example, in the publications by Zhao et al. (2006, 2007), Jafarian and Rezvani (2012), Morales-Ivorra et al. (2016) and Liu et al. (2017), the probability of derailment due to track failures is estimated, and in the paper by Peng et al. (2016), the probability of an accident due to failure at the signalling system is estimated. Examples from the literature where the probability of fatalities or injuries occurring is estimated are the paper by Hu et al. (2011) for level crossings and the publication by Ko Ko et al. (2005) for landslides.
Although these proxies are useful in assessing the probability that changes in the state of the infrastructure will result in providing inadequate service, they do not quantify the exact impacts for all the different stakeholders. For example, the studies that examine the state or reliability of the system do not quantify the cost of repairing or maintaining the infrastructure when it fails. The studies that examine the availability of the system do not quantify the cost of the delays for the users. The studies that examine the safety of the system – that is, accidents, derailments and fatalities – do not quantify other impacts related to the accidents – for example, restoration costs.
On the other hand, several studies provide an analysis of the railway service focusing on impacts related to specific stakeholders, mostly for the passengers. Most of them use questionnaires to evaluate the importance of different factors – for example, delays, safety, comfort, services and information provided – from the passenger’s perspective (Aydin, 2017; Cavana et al., 2007; Chou et al., 2011; de Oña et al., 2015; Eboli and Mazzulla, 2012; Nathanail, 2008; Thomas et al., 2006). Small groups have also investigated the impact of these various factors on other stakeholders. For example, Chou et al. (2014) analysed the importance of various factors related to railway service – for example, customer loyalty and service quality – for both passengers and passenger carriers, while Cascetta et al. (2011) analysed the importance of various factors related to the mobility provided by the railway service for both passengers and society. Although these studies are useful when comparing a wide range of service characteristics related to all three parts of the railway system – namely, the infrastructure (e.g. noise), the rolling stock (e.g. air-conditioning on board) and the operation (e.g. train frequency) – they do not provide a complete analysis of all the impacts related to changes in the infrastructure state – for example, restoration costs. For railway managers, it would be useful to be able to quantify the railway service considering all the impacts related to changes in the state of the infrastructure for all the affected stakeholders, consistently. This will enable them to develop complete and systematic evaluations of multiple possible intervention strategies – that is, executing, postponing or neglecting interventions – based on their impact on service.
Multi-objective functions are capable of quantifying all impacts on service related to different stakeholders due to changes in the state of the infrastructure and, therefore, are often used for this purpose (Ebrahimnejad et al., 2012; Núñez et al., 2019; Su et al., 2017). According to this approach, weights are assigned to multiple technical aspects and parameters based on their impact on service. Although the results of those methods are useful for railway managers, often they do not consider an evaluation of the service in a way that allows direct comparison between the costs required to improve the infrastructure’s state and the impact on service.
Mainly, for railway managers, it is helpful to express the impacts in units comparable with the costs of interventions – for example, monetary units – and without using performance rates, factors or weights, as this gives them the ability to compare the costs related to the service provided by the infrastructure with the investment that is required to improve this service, by modifying the state of the infrastructure. When this is possible, the railway manager can decide between multiple possible intervention scenarios, to execute the ones that result in the highest net benefit (Burkhalter and Adey, 2018).
In 2008, the EU recognised the need to quantify the transport service using monetised values to help managers make rational decisions related to the external costs of transport (Maibach et al., 2008). An update on these monetised values is provided in the report by Korzhenevych et al. (2014) for seven cost categories related to railway service, delays, accidents, noise, air pollution, environmental impacts and maintenance. Although this report is a useful source of monetised cost categories, it is not complete, as several cost categories are not considered. For example, vibrations, which can cause discomfort for passengers, as explained in the papers by Nathanail (2008), Eboli and Mazzulla (2012), Chou et al. (2011, 2014) and Aydin (2017), or mobility, which is essential for society, as explained in the paper by Cascetta et al. (2011), are not quantified in these studies.
The quantification of the railway service to be used in intervention planning requires a complete analysis of all the impacts related to all changes in the infrastructure’s state and for all the affected stakeholders. In other words, in order to ensure that the impact of a change on the state of the railway infrastructure is evaluated adequately, one must examine all the impacts that this change has on all the affected stakeholders. The purpose of this paper is, therefore, to present a methodology for defining and quantifying in monetary values all the impacts related to all changes in the railway infrastructure’s state for all the affected stakeholders.
Defining the railway service in space and time
When executing interventions, the state of the infrastructure is modified, resulting in changes to the provided service – that is, changes in the effects of operating a railway network over a specific time period, for all stakeholders. Such changes in the state of the railway infrastructure can affect multiple stakeholders, beyond the users. For example, when a railway bridge is maintained, people living near the construction site will be affected by the noise. This means that the service provided by the railway infrastructure can have multiple effects on multiple stakeholders. To define the railway service, it must be considered who is affected and how they are affected by changes in the state of the infrastructure. Moreover, as the railway infrastructure is spatially embedded in a network and provides service over time, the railway service provided and, thus, the impacts on stakeholders are space and time dependent. For a manager responsible for planning interventions, it is essential to measure all the impacts related to all stakeholders affected by the different states of the railway infrastructure across a specific network and over a specific time period.
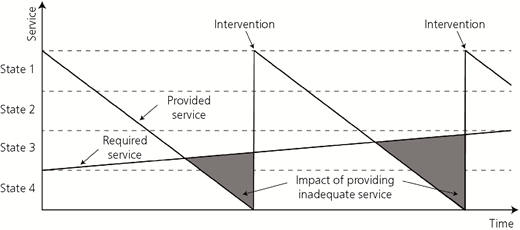
To identify these impacts, one must consider the effects of providing an inadequate level of service for each stakeholder. Therefore, it is required to determine for each stakeholder what level of railway service is required and expected to be offered by the infrastructure (ISO 55000:2014 (ISO, 2014)) – that is, required service – in space and time; what level of railway service that the infrastructure can offer – that is, provided service – in space and time, and what the impact on the stakeholders is when the required service is lower than the provided service in space and time. For example, Figure 1 shows the required level of service for a stakeholder – that is, the required amount of positive effect (e.g. punctuality) for the stakeholder due to the operation of the infrastructure – and the provided level of service by the infrastructure – that is, the provided amount of positive effect (e.g. punctuality) for the stakeholder due to the operation of the infrastructure at a specific state over time – and the impact of providing a level of service different from the required one – that is, the impact of providing a service that is related to less than the required positive effect (e.g. punctuality) or to more than the accepted negative effect (e.g. delays), over space and time for this stakeholder.
This definition of the railway service enables the quantification of the railway service. When the railway service is defined as the service provided to stakeholders from the operation of railway systems, the railway service can be quantified by measuring how the difference between the required level of service and the provided level of service changes in space and time and for each stakeholder and what is the effect of these changes to each stakeholder. Consequently, the impact of providing inadequate service is defined by the deficiency of the provided service compared with the required service for each stakeholder, and the inadequate railway service can be quantified by measuring the impacts related to this deficiency in space and time for each stakeholder. For this, one must estimate
how the required service changes in space and time for each stakeholder
how the infrastructure’s ability to provide service changes in space and time
how the impact of providing a level of service different from the required service changes in space and time.
These points are explained in succession in the following sections.
How the required service changes in space and time
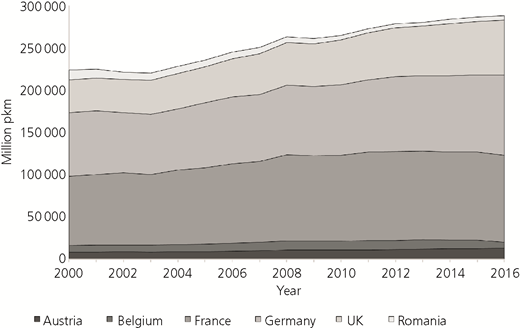
The railway infrastructure might be required to provide different levels of service for different stakeholders and in different areas and over time. For example, travel demand changes in space and time. Within a railway network, certain lines have higher traffic density than other lines. Within the day, the travel demand is usually higher during the morning and evening peak hours, while it is lower during the non-peak hours. Travel demand might also change over several years. For example, Figure 2 shows the evolution of the railway in million passenger-kilometres (pkm) travelled in six different EU countries between the years 2000 and 2016. Although the changes in the volume of the passenger traffic were also related to changes in the service provided by the infrastructure, undoubtedly in 2016, there was a higher overall request for railway transport, particularly in Germany and in the UK, compared with 2000. Over the past decade, the request for higher capacity and higher speeds on the European railway network has significantly increased, particularly in France, Germany and the UK. Consequently, when defining the required service to be offered by the railway infrastructure, it is crucial to consider which level of service will be demanded by different stakeholders within the period of the analysis.
How the provided service changes in space and time
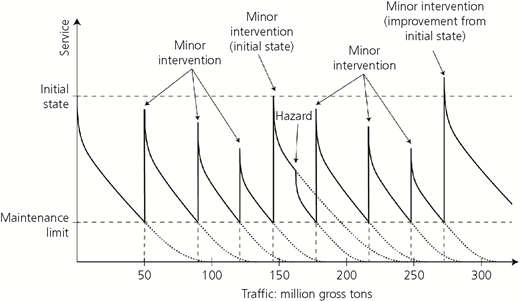
The ability of the infrastructure to provide a certain level of service depends on the state of the infrastructure. This ability is reduced over time (i.e. negative change), through use and environmentally induced deterioration, and it is improved (i.e. positive change) through interventions. As different parts of the infrastructure are used differently, are exposed to different environmental conditions and are maintained at different rates, the state of the infrastructure, and therefore the provided service, changes in space and time. For example, Figure 3 shows the changes in the service provided by a hypothetical track section due to accumulative traffic, hazard and minor and major interventions. Condition-based indicators are often used for the assessment of the track quality – for example, vertical deviation of track geometry – and the maintenance limit of the track quality triggers the execution of an intervention. In this case, the decision on whether a minor intervention, such as tamping, or a major intervention, such as track replacement, should be executed depends on how fast the track deteriorates back to the maintenance limit rather than using two different maintenance limits for the two interventions. Although the relationship between the provided service, the maintenance limit and the execution of minor and major interventions might be different for other types of objects – for example, bridges – it is crucial, in every case, to be able to evaluate all the changes in the provided service, positive and negative, in relation to the changes in the state of the infrastructure. Consequently, when defining the expected service to be provided by the railway infrastructure, the complete evolution of the state of the infrastructure must be considered within the period of the analysis.
How the impact of providing inadequate service changes in space and time
Variations on the state of the infrastructure in any direction – that is, positive or negative – might increase or decrease the level of service provided for a stakeholder. When the required level of service for this stakeholder is known, it is possible to determine whether the change in the state of the infrastructure leads to an improvement of the provided service above the required level or a decrease below the required level. When the provided service exceeds or is equal to the required level of service for a stakeholder, adequate service is provided to this stakeholder and there are no negative effects. However, when the provided service is below the required service, inadequate service is provided to this stakeholder, who is negatively affected by the service.
By defining the required and provided service of the infrastructure in space and time, it is possible to identify where and when the infrastructure is expected to offer inadequate service – that is, the required service is less than the provided service. In order to quantify inadequate railway service, the impacts related to providing inadequate service must be quantified. For example, if a passenger train arrives with a 20 min delay and the next passenger train arrives with a 10 min delay due to a switch failure, the railway service offered to passengers by both trains in terms of travel time is inadequate. If the train delay time is measured to quantify the impact on the service, the impact related to the first train is more significant than the impact related to the second train. If there are 50 passengers on the first train and 150 people on the second train, the passenger-delay minutes related to the first and second trains are 1000 and 1500, respectively. If the passenger-delay minutes are measured to quantify the impact on the service, the impact related to the second train is greater than the impact related to the first train. However, it can be argued that passengers perceive delays differently according to their length. Often the relationship between cost and delay is considered non-linear – for example, logarithmic. In this case, a 10 min delay can be valued at €0·3/min, and an additional 10 min delay can be valued at €0·6/min. This means that the delay related to each one of the trains is valued at €450. If the cost related to the passenger-delay minutes is measured to quantify the impact on the service, both have the same impact in terms of delay costs. Although for this example a deterioration in the state of the infrastructure was considered – that is, switch failure – a positive change in the state of the infrastructure could also have an impact on service provided that should be quantified – for example, in the case of maintenance leading to the improvement of the ride comfort. If 1000 passengers are willing to pay €1 each to travel 1 km more comfortably – that is, less vibration in reference to the acceleration transmitted to the body by the vehicle (Barone et al., 2017) than the current state of the infrastructure provides, then there is an impact equal to €1000 related to the current state of the infrastructure. If the comfort level improves due to an improvement in the state of the infrastructure after the execution of an intervention and the passengers are willing to pay less than before to improve further the level of comfort – for example, €0·2 per passenger per 1 km of travel – then the impact related to the service after the execution of the intervention will be €200. The positive impact of the execution of this intervention on the service is €800 for the passengers. Consequently, one must determine if a positive or negative change in the infrastructure state results in inadequate service and how the impact related to an inadequate level of service is quantified.
When the level of railway service is analysed to help railway managers plan interventions, the use of monetary values in the quantification of the impacts allows direct comparison between the costs of providing inadequate service and the intervention costs required to be invested in providing adequate service. In recent years, this need for such direct comparisons has triggered extensive research on the monetisation of impacts. In the EU, significant research was developed in this direction due to the deregulation of railway transport (Pollitt and Smith, 2005). For example, as part of the EU projects, Catrin, ExternE and Heatco specific values were assigned to costs related to railway service (Korzhenevych et al., 2014).
According to this research, commonly used methods for estimating the cost associated with the impact that heavily depends on individual preferences are the willingness to pay (WTP) for improvement and the willingness to accept (WTA) compensation for a non-improvement (Korzhenevych et al., 2014). Using either method, these costs can be estimated directly or indirectly.
Direct estimation of impacts
Direct estimation is usually achieved through the analysis of the market price of the impact – that is, WTP – or compensation for the impact – that is, WTA. For example, the cost of the damaged property can be considered equal to either the market price for repairing the damaged property or the market price for compensating for the damage of the property. EU regulation (EC) 1371/2007 (EC, 2007) gives specific values for compensation costs. However, the regulated price paid for compensation when an inadequate service is provided is not always equal to the cost related to the impact of providing an inadequate service.
IMPACTS RELATED TO DELAYS
The regulated price paid for compensation of delays might be different from the cost related to a delayed trip. Delay is defined as the time difference between the time that the passengers or goods were scheduled to arrive by the published timetable and the time of their actual or expected arrival (EC, 2007). In Europe, most carriers are obligated to pay some compensation to the passengers only if a delay of over 60 min occurred. This compensation cost is not equal to the cost of the impact of delays on passengers. The cost of the impact of delays for passengers is the economic costs related to the value of lost time when travelling, which occurs from the first minute of delay, and it can have a different value or distribution over time depending on the purpose of the trip, the income of passengers, the gross domestic product (GDP) and other parameters.
Consequently, railway managers are interested in knowing all the delays that occurred. For example, delays over 3 and 5 min are monitored and assessed in Switzerland and Austria, respectively, as they are considered to show inadequate service (CER, 2012). In EU directive 2016/798, the cost related to delays is often estimated based on the monetary value of travel time savings and the number of work passengers – that is, passengers travelling in connection with their professional activities excluding commuting – and non-work passengers affected (EC, 2016).
Indirect estimation of impacts
If it is not possible to obtain the actual cost of an impact directly, then indirect methods are used. Usually, these methods employ hypothetical market situations and surveys to identify the values associated with either the cost of the impact – that is, WTP – or the compensation or subsidies – that is, WTA. For example, the cost associated with an uncomfortable ride due to vibrations can be estimated by conducting a survey to determine either the amount of money that someone would be willing to pay to avoid such an uncomfortable ride – that is, WTP – or the amount of money that someone would expect to receive as a compensation for experiencing an uncomfortable ride – that is, WTA. Although these indirect methods are useful for determining WTP and WTA costs, the results highly depend on the survey design (Achtnicht, 2012; de Blaeij et al., 2003; Guria et al., 2005; Hensher, 2010), and, therefore, it is essential to calibrate those results with market prices where possible.
IMPACTS RELATED TO ACCIDENTS
Accidents are related to major impacts on the service. In this paper, the word ‘accident’ is defined as an unwanted or unintended sudden event or a specific chain of such events that have harmful consequences, as defined in EU directive 2016/798 (EC, 2016; ERA, 2017) and by the Rail Safety and Standards Board (RSSB, 2018). However, the use of the word ‘accident’ might differ from country to country and between different organisations, and, therefore, it is recommended that each organisation uses the term on which it agrees. It is particularly challenging to monetise the impact related to accidents, such as injuries and fatalities. EU directive 2016/798 presents the value of preventing a casualty to be used for the calculation of cost related to injuries or fatalities due to railway accidents (EC, 2016). In most European countries, this cost is divided into six parts, human cost, medical cost, production loss cost, property damage cost, administrative cost and other costs (Kasnatscheew et al., 2016). Often, the medical, property damage and administrative costs can be estimated directly through the analysis of the market price, while the production costs are often estimated based on the GDP. The estimation of human cost – that is, the part of the accident cost that considers the victims of accidents directly and is used to value suffering and pain – is a particularly challenging task.
In many cases, the value of statistical life (VSL) is used to estimate the value of human cost. However, there are many methods for determining the VSL, resulting in significant variations of the cost associated with the VSL – for example, WTP methods, restitution costs method or human capital method. In Europe, WTP methods are widely used to estimate the VSL (EC, 2016; Kasnatscheew et al., 2016). Although EU directive 2016/798 gives specific guidelines on how to conduct and use the results of the WTP methods, it is evident in the literature that when WTP methods are used, the cost of VSL tends to increase. This might be responsible for the prioritisation of interventions on the infrastructure that reduces significantly the risk related to fatalities, as discussed by Elvik (1995) and Kasnatscheew et al. (2016). Where data from WTP are not available, methods that relate the GDP with the VSL cost are used (Elvik, 2000; Milligan et al., 2014).
Changes in the values of impacts over space and time
When all the impacts are quantified using monetary values, one must also consider how the value related to each impact of providing an inadequate level of service might change in space and time. This is often a challenging task, as there is a high uncertainty related to these changes. For example, EU regulation EC 1371/2007 (EC, 2007) changed the impact related to the lack of accessibility to the railway service. Since 2007, railways must secure the right to transport for the public (CER, 2012). The importance and, therefore, the value of accessibility in stations increased significantly due to the introduction of this regulation.
Changes in the economy of a society can also change the value of the impacts of providing an inadequate level of service. For example, many studies have concluded that there is a strong correlation between the cost related to delays and accidents and the GDP (de Blaeij et al., 2003; Maibach et al., 2008; Milligan et al., 2014). Depending on the changes in the economy of a society and within the analysed time, changes in the GDP can result in significant differences in the value of the impacts over time.
Depending on the period of the analysis, the fluctuations in the cost of impacts over time can be significant when short or long periods – for example, during the life cycle of an object – are examined or both. When changes in the values occur over short time periods – for example, the value of time between a weekday and a weekend – these changes can be addressed by using minimum, maximum and average values or values that include the consideration of the standard deviation. However, when the values change over more extended time periods – for example, value of time over several decades – one should consider reanalysing the situation.
In either case, when monetising such impacts, it is essential to perform a sensitivity analysis to address the uncertainties related to the fluctuation of these values over time. Undoubtedly, the perceived costs associated with certain impacts vary significantly between individuals, organisations, societies, stakeholders and countries. For example, although in the report by Korzhenevych et al. (2014) specific values are given to monetise the impacts related to noise in the EU, these values might differ among individuals and societies. As often there is no one right value for the quantification of such perceived costs, a range of values should be used to achieve a high level of confidence among all the affected stakeholders that the results describe the specific situation, at an appropriate level of accuracy and effort.
Stakeholder groups
According to ISO 55000:2014 (ISO, 2014), the purpose of the infrastructure is to provide value to the stakeholders. In this context, the railway infrastructure should meet the needs and satisfy the expectations of the stakeholders. The first step to a sound quantification of the railway service is, therefore, to identify the stakeholders who will be affected if the service provided by the infrastructure is inadequate – that is, their needs and expectations are not satisfied – and how they are affected. As a rule, for transportation projects, all stakeholders should be considered as a part of the evaluation process before implementing any changes (ORR, 2015; Sinha and Labi, 2007). For this analysis, a stakeholder is a person, a group or an organisation influenced by the changes in the railway infrastructure.
Although some studies have identified the stakeholders involved or influenced by specific changes on the railway infrastructure (Granström, 2008; Rangarajan et al., 2013; Ravesteijn et al., 2014) and some national railways often refer to a more extended list (e.g. Network Rail, 2019; SBB, 2010), no consistent methodology was found in the literature to identify all the stakeholders influenced by changes in the railway infrastructure. A consistent methodology for identifying and classifying the stakeholders for evaluation of interventions on public roads is described by Adey et al. (2012, 2019b). Being a stakeholder is considered time dependent, and all stakeholders are classified into two levels. The first level consists of stakeholders whose net benefit should be maximised. On the first level, four main categories of stakeholders are identified, (a) the owner, (b) the user, (c) the directly affected public (DAP) and (d) the indirectly affected public (IAP). The second level includes the stakeholders who are affected by the maximisation of the benefit of the first level, and, therefore, the impacts related to these stakeholders must be monitored. On the second level, stakeholders such as contractors and financial institutions are considered.
According to this approach, the impact related to each stakeholder is evaluated over space and time by assessing the cost related to the extent to which they are affected. Therefore, there is no need to assess the relative importance of the stakeholders or to use different weights for different stakeholders, as the impact related to each stakeholder will be directly quantified and monetised.
Specifically for the management of railway infrastructure, the stakeholders for which the net benefit is to be maximised are given in Table 1. Railway infrastructure users can be further divided into passengers, freight customers and passenger and freight carriers. Carriers are defined for railways by regulation (EC) 1371/2007 (EC, 2007) as the public or private body that is responsible for undertaking the activity of railway transport. When considering the service provided by the railway infrastructure, carriers are considered the organisations or enterprises that operate the trains.
Quantification of impacts
Once the relevant stakeholders have been identified, the next step is to determine how each stakeholder is affected by changes in the state of the railway infrastructure. All possible impacts for all the stakeholders must be identified and directly quantified by estimating the cost – that is, in monetary units – related to them. The owner is affected by the execution of interventions on the infrastructure in order to maintain an adequate level of service, including the effects of the accidents affecting the infrastructure and the workers. The users are affected by the change in the number of accidents, delays, level of comfort and profit resulting from the use of the infrastructure. The DAP is affected by changes in the number of accidents, level of comfort and environmental preservation that affects their environment. Finally, changes in the railway infrastructure affect the number of accidents, the socio-economic activity, environmental preservation and the environmental consumption of the IAP. The description of these impacts is given in the sections headed ‘Owner’, ‘Users’, ‘DAP’ and ‘IAP’ and in Tables 2–11.
All possible impacts are then accounted for by starting from an abstract level of impacts across the different stakeholders and continuously dividing them into more detailed levels of cost indicators until an objectively quantifiable value is reached. This impact hierarchy is used to quantify the impacts related to the state of the infrastructure for all the stakeholders. The cost categories defined in the impact hierarchy developed for the railway infrastructure are presented in Tables 2–11. Examples of units that can be used for the costs are also presented in the tables. In the presented impact hierarchy, three types of costs are defined, economic, societal and environmental costs, related to the three pillars of sustainability. By considering these three pillars of sustainability, the orthogonality of the impact hierarchy is ensured (Adey et al., 2012).
To ensure orthogonality between the cost categories, impacts that are positive for one stakeholder but negative for another are not taken into consideration. An example of such an impact is the track possession fee that the carrier might be required to pay to the owner to use the track. If carriers are required to pay a track possession fee to the track owner to use the track, the impact related to this fee is negative for the carriers and positive for the owner (EC, 2007). Therefore, this impact is excluded from the impact hierarchy.
Once the impact hierarchy is determined, the next task is to identify the indicators to be used to measure each impact and to estimate the values that quantify each impact – that is, how each stakeholder is affected by each change in the state of the railway infrastructure. For example, if there is a change in the view of the natural or built environment after a bridge is rebuilt, should this societal impact be valued at less than €1 million, €10 million, €100 million or even more? The impact related to each stakeholder is the cost expressing how the stakeholder is affected. If two stakeholders are affected differently by the same impact, two different costs will be considered to quantify the same impact for the two stakeholders. For example, if a person travelling for business is affected more by per minute of delay compared with a person travelling for leisure, then two different costs per minute of delay will be considered based on the trip purpose. Although it is common to use weights to assess the relative importance of the stakeholders, with the use of this methodology, the values assigned to the impacts should be the cost considered by each stakeholder due to the change in the infrastructure state. This is a particularly challenging task, as there are many diverging opinions as to what these values should be, and the values might vary between individuals and societies.
Owner
The costs attributed to the owner are those directly associated with the interventions executed on the infrastructure, damages of infrastructure and workers’ injuries and fatalities due to accidents (Table 2). Two categories are defined at the first level, the costs related to the execution of interventions and the costs related to the accidents that affect either the infrastructure or the workers. For example, the costs related to the owner of a railway track of 1 km are the costs associated with the costs of continuously maintaining the track in a state where it can be used as expected at the required speed and by the required traffic load, and with the accepted accident costs due to the operation and continuous maintenance of this track section.
Users
Three groups of users are relevant for quantifying the railway service, the passengers, the freight customers and the carriers. The impacts affecting these three groups are explained in succession in the following sections.
Passengers
Rail passengers are affected by changes made to the railway infrastructure that affect the travel service itself. The cost categories and cost indicators for the passengers are given in Table 3. In the table, examples of WTP and WTA methods are used to identify the additional cost that passengers may be willing to pay to improve the conditions at the station or during the railway trip or the compensation costs that passengers might request for unacceptable conditions at the station or during the railway trip. This cost is different from that of the carriers. For example, although the carrier might be willing to pay a certain amount to encourage the passenger to continue using the railways, the passenger might be willing to pay an additional amount to have an improved travel experience (Jou et al., 2013).
Often in the literature and practice, when the impacts related to users are quantified, no differentiation is made between the sources of impact in the railway system – that is, infrastructure, rolling stock and operation. For example, in the papers by Cavana et al. (2007), Aydin (2017) and Chou et al. (2014), different impacts are examined that are not necessarily related to the infrastructure – for example, accuracy of timetable information and cleanliness of the train. However, a railway manager must consider only those impacts that are related to the state of the infrastructure. This is not always an easy task. For example, an uncomfortable trip can be the result of vibrations caused by the inadequate state of the track, inadequate state of the train or inadequate speed of the train (de Vos, 2017). The state of the track is improved by executing interventions on the infrastructure, and the railway manager is responsible only for executing these interventions. The state of the train is improved by executing interventions on the rolling stock, and the rolling stock owner or carrier might be responsible for executing these interventions. The traffic operator regulates the speed. To quantify the part of the service that is affected by the infrastructure, the costs related only to the effects of an uncomfortable ride caused by the poor state of the infrastructure should be estimated. Depending on the organisational and operational scheme of the railway network, it can be particularly challenging to link directly the impacts experienced by passengers to the infrastructure system. Some examples of such challenging impacts are the unhappiness of passengers due to the infrequency or regularity of train runs, the way that service interruptions are resolved and the quality and quantity of information provided to them before and during the trip (Nathanail, 2008). For these cases, it is helpful to estimate the average cost related to the inadequate state of the infrastructure over the total cost of the impact for a specific time period.
Freight customers
In many countries, the railway infrastructure is used by both passenger and freight trains; however, often, some sections of the network are used explicitly for freight traffic. Moreover, there is railway infrastructure used explicitly by freight trains – for example, at freight rail yards. This infrastructure, according to directive EU.343.32.2012 (EC, 2012), is considered as an access way and therefore as part of the railway infrastructure. If the manager responsible for this infrastructure is interested in estimating the changes in service related to changes to the state of the infrastructure at such freight rail yard, then the proposed methodology can be used. For example, if a railway manager is interested in knowing what will be the impact from improving the operation of a Dowty retarder, then the reduction in time required to classify the wagons must be quantified.
Freight customers are affected by changes made to the railway infrastructure that affect the travel service itself. The cost categories and cost indicators for the passengers are given in Table 4. As with passengers, the cost associated with impacts related to inadequate service varies significantly between freight customers. Consequently, in Table 4, examples of WTP and WTA methods are used to identify the additional cost that freight customers may be willing to pay to improve the conditions or the compensation costs that they might request for unacceptable conditions that occurred when using the railway service to transport their goods.
Carriers
Carriers are affected by the changes to the infrastructure that are related to changes in travel demand, and, therefore, they may be willing to invest more in keeping their customers satisfied and their profits high. Additionally, carriers often cover costs related to rolling stock, which is also affected by the changes in the infrastructure. The costs attributed to the passenger and freight carriers and associated cost indicators are given in Tables 5 and 6, respectively.
DAP
The DAP is influenced by the changes in the part of railway infrastructure with which they share the environment. Hence, the cost related to the impacts of this category is mainly dependent on the distance and density of the settlements and the area that the railway infrastructure covers. As a result, not only alterations of the elements of the railway lines – that is, often referred to as permanent way – but also changes affecting stations and yards are relevant. The cost categories and cost indicators for the DAP are given in Table 7.
Two of the most common nuisances affecting the DAP are noise and vibration. In the proposed methodology, the impacts related to nuisances, such as noise and vibration, are quantified through the specific damages that they cause. For example, the impact related to vibrations can be estimated by quantifying the impact related to property damage, physical and psychological impact due to vibration, as these values are often easier to estimate. Ground-borne noise and vibration can affect the operation of sensitive equipment in adjacent buildings. In this case, the cost related to the damage of this equipment should be considered when the levels of vibration change due to changes in the state of the infrastructure.
IAP
Costs related to the IAP are linked to those derived from changes in the railway infrastructure that affect society as a whole, independently of the proximity to the infrastructure. The cost related to this stakeholder highly depends on the relationship that the society has with the railway infrastructure. For example, a society where 60% of the goods transport use the railway will value an event that affects the freight corridors more highly than one where only 5% of the goods transport use the railway. The cost categories and cost indicators for indirectly affect public are given in Tables 8–11.
For the estimation of the costs related to the economic impact due to injury or fatality, the estimation of productivity loss is required. This can be estimated using the human capital approach (HCA), which is used to determine the production loss to society caused by transport accidents. The HCA estimates the discounted income that would have been realised during the expected life of a person, in the case of an accident causing fatality, or without the disability, in the case of an accident causing injury (Kasnatscheew et al., 2016). This value can be estimated by considering the productivity factors of the society – for example, GDP, average income per capita, growth rate, discount rate, unemployment rate, age distribution and average retirement age. It is considered that the human costs are not included in the estimation of the HCA, as they are costs included in the estimation of societal impact due to fatality, estimated for the owner, users or DAP.
The quantification of environmental pollution costs is a complex process. Bickel and Friedrich (2005) proposed the method of impact pathway approach to quantify impacts caused by emissions to air, water and soil. According to this method, the impact of pollutants is quantified by considering the burden of the emissions; the dispersion of the pollution around the source; exposure of the population to the imposed burdens; the impacts on people and natural environment – for example, number of premature deaths and lost agricultural production – and the momentary equivalent of each impact. In the report by Korzhenevych et al. (2014), updated unit values are given for the quantification of these impacts for railway transport.
Aggregation of impacts
Once the cost related to each impact is estimated for each stakeholder, the aggregation of all the impacts related to all the stakeholders can be performed. The total impacts related to a change in the infrastructure’s state can be estimated as the direct sum of all the costs related to all the stakeholders. In other words, the impact due to a change in the infrastructure state is quantified by considering the sum of all the possible impacts – that is, in terms of costs – in the service for all the stakeholders due to this change.
It is also possible to aggregate all the costs related to a specific stakeholder – for example, passengers – or a specific impact – for example, accidents. For example, when an accident occurs, the owner, the users, the DAP and the IAP will all be affected. The total costs related to the accident will be the sum of all the monetised accident-related impacts related to all stakeholders.
However, when aggregating the costs, one should also consider the uncertainty related to the extent of the impacts and the uncertainty related to the estimates of the costs. The consideration of these two types of uncertainties is essential to perform the sensitivity analysis that will help understand how the variations of these values affect the final estimates.
Example
A simple example is presented in this section to illustrate the use of the methodology. According to this example, the state of a 1 km track section in a network that is used only by passenger trains has been degraded overnight due to extreme rainfall and the railway manager has two options to address the situation.
Option 1: impose a temporal maximum speed restriction from 100 to 40 km/h to reduce the probability of an accident occurring, until maintenance is performed overnight 2 months later to restore the track condition.
Option 2: to restore the track condition immediately the same morning. The immediate restoration will require the complete closure of the track section for 1 day, during which all trains will be rerouted through another line.
If the line where this track section is located is used by 500 passengers per hour and for 18 h/d, which is the optimal option?
The costs, according to level 1 cost categories, for each stakeholder are given in Tables 12–16. To use the proposed methodology, the railway manager should be able to estimate the monetised cost per unit of impact and the extent of the impact – that is, the number of units. Several references in the literature are provided in the following text regarding the costs per unit. The number of units depends on the problem-specific situation that is described. For example, the number of units for the accident costs reflects the average probability that the stakeholder will be affected by the occurrence of an accident. The cost was estimated as the product between the cost per unit and number of units.
It is important to state that any values and results presented as part of this example are provided with the single purpose of demonstrating the use of the proposed methodology and are not considered appropriate to be used in any other situation. When the proposed methodology is applied, the railway manager and the stakeholders should agree on the values, ranges of values or distributions to be used, and sensitivity analysis should be performed to assess the uncertainties related to the input values and the results.
As shown in Table 12, the immediate intervention, according to option 2, was expected to cost double per metre of track compared with the planned overnight intervention. The values used were based on experts’ opinion on the cost related to such interventions. The cost per accident was estimated by using the average values in Europe given in the publication by Kasnatscheew et al. (2016) and is the same for both options. However, it was expected that the execution of an immediate intervention is three times more likely to result in an accident involving a worker compared with a planned intervention.
Table 13 presents the costs related to passengers as the first user group of the infrastructure. As, according to option 2, the track section will be restored immediately and therefore before the line is used by any passenger train. Hence, for this option, no accidents involving passengers were expected. However, according to option 1, the section will be used for 2 months; it is possible that an accident will occur during this period. The cost per delay minute was estimated based on the values given for the rail travel in rge EU (Wardman et al., 2012) and adapted for the year 2018. The delays can be estimated based on the capacity of the network and the traffic volume. In this example, for option 1, it was considered that on average the passenger will experience a delay of 5 min due to the speed restriction, while for option 2, 15 min, as the trains will be rerouted. The ride comfort was not expected to be affected by the implementation of either option, as, in either option, the trains will not be affected by additional dynamic impacts. Therefore, the passengers are not willing to pay any additional amount to improve the ride comfort, and no passenger is affected by the discomfort, resulting in zero cost for both options related to this impact type.
Table 14 presents the costs related to passenger carrier as the second user group of the infrastructure. Similarly to the approach used for the passenger accidents, according to option 2 no accidents were expected, while according to option 1 there is a probability that an accident will occur, as the track will remain open. The involvement of a passenger during an accident was estimated to be a less likely event compared with the involvement of personnel, according to RSSB (2017). Regarding the impact due to delays, although the carrier was considered willing to pay the same cost per passenger for the two options, option 1 will affect more passengers compared with option 2, and, therefore, the two options will have different delay impacts on the carrier. Regarding the profit, it was assumed that the two options would not have any impact on the long-term profit of the carrier.
The costs related to the DAP are presented in Table 15. The involvement of the DAP to an accident was considered less likely compared with the involvement of a passenger or a member of the carrier’s personnel, according to RSSB (2017). Being consistent with the assumptions made for the rest of the stakeholders, option 2 was considered to be related to no accidents involving trains and therefore not likely for a person from the DAP to be involved in an accident. Regarding the comfort, as the maintenance according to option 1 will take place overnight, it was estimated to have a higher impact on the DAP, according to Korzhenevych et al. (2014). However, in both options, the same number of people was expected to be affected by the execution of the intervention in the area. As the design of the structure is affected by neither of the two options in this example, the cost that the DAP is willing to pay for this change of the environmental preservation – that is, due to changes in aesthetics and fragmentation – was assumed zero.
As shown in Table 16, the IAP is affected by the occurrence of accidents and due to environmental preservation. The impact due to socio-economic activity and environmental consumption was assumed negligible in this example, as the service is not completely interrupted and the design of the infrastructure is not changed when either of the two options is chosen. It should be noted that the accident cost per unit is different, as the economic impact related to the IAP due to an accident is different compared with the societal impact affecting the owner, user and DAP, as explained in the section headed ‘IAP’. The value used for this example was estimated based on the EU average cost of an accident, according to Kasnatscheew et al. (2016). To estimate the number of units affected, the sum of all the probabilities of accidents of the previous tables was used, as the IAP will be affected by the occurrence of any accident that involves a member of the society – that is, worker, passenger, carrier personnel or a person of the DAP. The environmental preservation and consumption costs were estimated based on the values for track restoration given in the publication by Tuchschmid et al. (2011) and the track length, assuming a ballasted track with rail UIC60. It was assumed that the environmental preservation costs and the environmental consumption costs due to the speed restriction, in option 1, and due to the rerouting of trains, in option 2, are negligible.
Table 17 presents the aggregated results for the two options. The results allow for comparisons between the different stakeholders. For example, the costs related to the owner are expected to be higher, while the users, DAP and IAP are expected to incur lower costs if option 2 is selected. After analysing all the impacts and given the assumptions and values as presented before, option 2 has an overall lower cost with respect to option 1. However, as option 2 requires a higher budget compared with option 1 – that is, the cost for the owner of the restoration is €500 000 when option 1 is selected and €1 000 000 when option 2 is selected – option 2 can be selected only if this higher budget is available.
Using this methodology, it is also possible to aggregate the results depending on different impact categories. For example, Table 18 presents the costs aggregated into three categories, costs related to the intervention works, costs related to accidents and costs related to delays. The costs related to delays differ significantly between the two options, making this impact the most decisive in this example. This type of analysis helps the railway manager examine multiple options that result in the same change in the state of the infrastructure but are related to different impacts in the service. By comparing the results of multiple options, the manager can identify the option that results in the optimum benefit – that is, minimum costs.
The uncertainty related to the values used for this example was not assessed, as the purpose of the example is to demonstrate the use of the proposed methodology. However, it should be highlighted that if there is high uncertainty related to any of the costs estimates or if the uncertainty varies between the cost estimates, the results presented in this example could differ significantly. Therefore, a sensitivity analysis should follow to assess the uncertainty related to all the values used in the analysis before reaching a sound conclusion.
Discussion
The definition and quantification of railway service is a prerequisite step in order to plan interventions on the railway infrastructure optimally. If railway managers can define and quantify the impact over time and across the network before, or when the railway infrastructure changes state, they can make optimal decisions on how much they should spend on interventions and what type of interventions should be executed in order to minimise the impacts on service related to infrastructure changes. Although there is a plethora of methodologies proposed to assess the impacts the infrastructure changes have on the service, they do not provide results that are directly comparable with the intervention costs required to be executed to manage the infrastructure changes.
As the state of the different parts of the railway network affects the provided service differently, the proposed methodology can be used to estimate the impact related to changes in the state across different levels of the network’s resolution. In other words, one can use this methodology for the quantification of the impacts when the state of entire lines changes – for example, a line is out of service – but the same methodology can also be used when assessing the impacts related to changes in states of smaller components of the infrastructure – for example, track failure. For example, if a double-track line that connects two stations is supported at a section by one bridge, if this bridge fails, the connection between the two stations will be compromised, resulting in significant traffic disruptions. However, the impact in service might be different if instead of the bridge, one track of the double-track section fails. If the appropriate switches, signalling and capacity are available, it is possible to restore this track failure with only minor traffic disruptions. This means that these two changes in the state of the infrastructure objects, the failure of the bridge and the failure of the track, will have different impacts on the service. The proposed methodology can also be applied when considering improvement, instead of failure, of the state of smaller parts of the network – for example, the impact due to tamping and the impact due to rail replacement is different on the service – that is, different costs for the owner, delays for the passengers, noise for the DAP, emissions for the IAP and other costs.
Although other views on the identification of stakeholders and impacts related to railway service are possible, the presented view has provided the authors with a clear definition that has allowed them to analyse different situations related to planning interventions. It is possible to quantify the impact over time that deterioration, failures and short-term or long-term maintenance actions and upgrades of the infrastructure will have in the provided service. Depending on the purpose of the analysis and the change in the state of the infrastructure to be assessed, it might be required to estimate the impacts on service for a short period – for example, days – or the entire lifetime of the infrastructure. In each of those cases, a different part of the impacts listed for each stakeholder needs to be considered. For example, if the objective is to compare the railway service provided before and after tamping on a track has been performed, then the impacts related to environmental preservation for the DAP and socio-economic activity for the IAP will not be affected by the change of the state of the track due to this minor intervention. However, if the objective is to compare the railway service provided before and after upgrading a line to allow a maximum speed of 200 km/h instead of 80 km/h, then all the impacts might be relevant to quantify, including the impacts related to fragmentation and socio-economic activity.
Using the proposed methodology, railway managers can estimate the impacts related to executing and neglecting interventions for all the stakeholders in monetary values. This enables direct comparisons between the costs and risks occurring when interventions are executed or neglected. However, this requires assigning monetary values to each impact related to the changes in the railway service per unit time. Although this monetisation of impacts can be done directly for some impacts (e.g. intervention costs for the owner), for other impacts, this is a particularly challenging task (e.g. vibrations, cultural preservation, VSL, environmental impact due to the land consumption for the railway infrastructure).
Resources and recommendations are provided in the paper to facilitate this process, but it is important to note that these values vary significantly over space and time and between individuals and societies. Although some of these fluctuations can be addressed by using a range of values, instead of single values, the monetisation of certain impacts remains a challenging task due to these fluctuations. Mainly, the values used to estimate perceived costs – for example, vibrations – might vary significantly between individuals (Maclachlan et al., 2017) and societies (de Vos, 2017). In situations where there is not a single value that can be used with high confidence to express the cost related to an impact, a range or distribution of values should be used, and sensitivity analysis should always be performed to assess the impact of the uncertainty related to the input and the results. After a sensitivity analysis has been performed and the uncertainties related to the different impacts have been assessed, the level of confidence related to the results can be evaluated based on the required level of confidence regarding the specific analysis. If a satisfactory level of confidence has been achieved, then the railway manager can use the results of the quantification of service in decision-making. However, if a low level of confidence has been achieved, then the situation should be reanalysed when the uncertainties related to the analysis can be limited.
Despite the difficulties in estimating the costs related to each impact, this way of quantifying the railway service in space and time gives an overview of how each stakeholder is affected by the changes in the state of the infrastructure. However, this methodology can be effective only if the impacts on all stakeholders are assessed. For example, if line A of the network serves fewer passengers than line B, this should not be the exclusive parameter to prioritise interventions on line B instead of line A. One should examine all the impacts related to all stakeholders due to all possible changes of the infrastructure’s state before making a decision, as it is possible that, for example, by postponing the maintenance of line A, its state will deteriorate further, resulting in significant impacts (e.g. due to lack of connectivity for other users of the network, due to lack of mobility for the IAP, due to increased intervention costs for the owner). Only when the required and the provided level of service are defined for all stakeholders and all possible states of the infrastructure and the impacts related to providing a deficient level of service are quantified for all stakeholders, it is possible to estimate the cost related to changes in the infrastructure state. This ensures railway managers that the concerns of all stakeholders have been considered and shows how they have been considered and how great the uncertainties related to their consideration are.
The proposed methodology can be used to assess the impact that changes in the railway infrastructure state have on the service. However, by applying this methodology alone, the railway manager cannot plan interventions that ensure the reduction of the probable impacts due to changes in the infrastructure state in the future – that is, risk-reducing intentions. This methodology aims to quantify the impact on the service due to changes in the infrastructure’s state – that is, the impacts of future scenarios – regardless of their probability of occurrence. However, in order to estimate the cost related to likely changes in the infrastructure state in the future, it is crucial to estimate the probability of occurrence of those changes. Different models can be used to address the probabilistic part of the costs related to future changes before deciding on which interventions should be executed. An example of such a model is presented in the paper by Papathanasiou et al. (2018).
Conclusions
The problem of defining the railway service in a way that can assist railway managers in planning interventions is not a simple task. It requires the definition of the service required by the infrastructure, the actual service that the infrastructure offers, the impact on all affected stakeholders when inadequate service is offered and the probability that this service will not be offered in the future. Additionally, these must be defined and quantified over time. In this paper, a methodology is proposed to define and quantify the service based on the impacts on different stakeholders related to changes in the infrastructure state. All the stakeholders that are influenced by changes in the railway infrastructure are identified, and then all the impacts related to providing inadequate service to each stakeholder are defined and quantified. The approach presented in this work deals with the quantification of those impacts using monetary values.
In particular, the systematic examination of the stakeholders, the impacts related to them and the changes in the railway infrastructure, from a higher level to a more precise cost indicator, allows a complete and orthogonal analysis of all the costs related to the railway infrastructure. This ensures the railway manager that all the related costs are considered in the analysis, which facilitates the estimation of the net benefit related to different interventions. A simple example is also presented where the usefulness of this methodology in decision-making is demonstrated.
Further work will focus on the application of this definition and quantification of the railway service in a large-scale example, where the optimal intervention strategy can be determined considering the impacts related to the execution of interventions for all stakeholders. The results of the application of the proposed quantification of service will be compared with the use of proxies – for example, state of the infrastructure, reliability, availability and safety – for the selection of the optimal intervention strategy.
Acknowledgement
The work has received funding from the European’s Union Horizon 2020 research and innovation programme under grant agreements 636285 (DESTination RAIL project) and 769373 (FORESEE project).