


In Bangladesh, the banking companies have huge opportunity to capture market share by properly understanding the critical aspect of customer satisfaction. This paper mainly focuses on young generation as target group to find out their differential perception. This study aims to identify most influencing factors and determine their influencing power on young customer's satisfaction and retention in mobile banking.
It is a quantitative research with self-administered questionnaire as primary data collection instrument. Existing literature and published articles are reviewed as secondary data for hypothesis development. Out of 300 questionnaires, 279 usable questionnaires were returned and these collected data were analyzed by partial least square-structural equation model (PLS-SEM) with the use of Smart_PLS (V 327) to validate the model and test the hypothesis.
The findings of the research revealed that expense, responsiveness and relative advantage have significant influence while security and convenience have insignificant influence on satisfaction. But they are not directly related with loyalty although satisfaction and loyalty strongly related with each other.
Although mobile banking is not a new issue in Bangladesh, the use of PLS_SEM to measure young user's satisfaction as the customer of mobile banking is not available in literature. So, this paper is an attempt to fill up this gap. In spite of having some limitation the research provides some practical implication for banks with better strategic insight to design mobile banking services to yield higher customer satisfaction.
Introduction
The introduction of information technology in financial sector has given banking services a new dimension in the 21st century. The banking industry has inevitably changed itself for the provision of quick and quality customer services in the form of modern technology based banking facilities such as online banking, ATM service and mobile banking. Mobile banking is one of the most convenient banking services which create the opportunity to bring the people under the umbrella of banking activities who were away from banking services before. Simply mobile banking means conducting banking transactions via a mobile device such as cell phone. Broadly it is a multi-platform cooperation between mobile operators and banking industry that integrate mobile communication and electronic money to facilitate bank related various activities through a mobile phone. With the rapid advancement of technology and increasing use of mobile phone, this mobile banking service is gaining popularity not only in developed countries but also in developing countries like Bangladesh.
Growing popularity of mobile banking creates a great opportunity for banking industry to expand their business, but it brings the challenges to satisfy and retain customers as well. That's why the critical understanding of customer satisfaction in mobile banking is now the demand of time. Critical evaluation of factors that affect customer satisfaction in mobile banking and how those factors influence satisfaction and confirm retention is important for banking industry to formulate marketing strategies that will ensure present satisfaction and promote new dimension for future customer satisfaction in mobile banking in Bangladesh.
This study basically focuses on young people, and tries to measure their satisfaction level, evaluate their choices, preference and considerable factors for mobile banking adoption and retention.
So the following objectives have been developed for the study.
To determine the significant factors affecting customer satisfaction in mobile banking
To evaluate the significance of each factor in Bangladesh perspective
To measure how strongly the factors influence young customers satisfaction
To find out the relation between satisfaction and loyalty in case of mobile banking
Literature review
With the tremendous growth in mobile usage, mobile banking has become very familiar and popular. At the same time bankers also interested to add new features and maintain current value added services in mobile banking. Therefore mobile banking is now an important issue of research. Singh (2012) stated mobile banking as an evolutionary step in banking sector of India where banks collaborate with mobile operators to offer latest banking service in variety of business domain. In commercial transactions mobile banking creates a new platform and this platform facilitates Sri Lankan business trading with minimum time and effort (Kahandawa and Wijayanayake, 2014). Same opinion provided by Yousuf and wahab (2017) by mentioning the speed of mobile banking as the most remarkable terms in Malaysian business sector. Quick transaction and easy access of mobile banking make banking activities convenient for Nepalese people (Shrestha, 2013). In 2005, a research in China regarding people's general view about mobile banking revealed that, in spite of having various benefits, Chinese people were reluctant to use mobile banking in the initial stage because of security concern (Laforet and Li, 2005). Along with security, cost also a concerning issue for Kenya's people when they think about the use of mobile banking (Achieng and ingari, 2015). Although security and trustworthiness were most important factors, complexity, compatibility and relative advantage also had significant influence on the people of Finland for the adoption of mobile banking service (Mattila, 2003). In this study author analyze the relation of five factors (complexity, reliability, relative advantage, compatibly and accessibility) with customers attitude towards mobile banking and finally found relative advantage was the most significant predictors of adoption of mobile banking. In a study regarding customer's adoption and satisfaction in mobile banking in India, Bhatt and Bhatt (2016) found time effectiveness, convenience, safety, responsiveness and simplicity had significant influence on customer satisfaction. Similarly, India's Students as the customer of mobile banking had significantly influenced by Perceived usefulness, ease-of-use, image value, self-efficacy and credibility (Dasgupta et al., 2011). Through the use of SPSS V21, Ravichandran and Madana (2016) found in Sri Lanka usefulness, perceived risk and compatibility significantly influence people but social influence and literature have little impact on customer satisfaction in mobile banking. Almost same result revealed in Malaysia in 2011 when Cheah et al. (2011) made a research to find out significant factors influencing mobile banking adoption. By using technology acceptance model (TAM) they found usefulness, relative advantage, ease of use and innovativeness had positive influence but risk had negative influence and social norms had no role in this case. The traditional TAM model suggests security, facilitating condition and performance expectancy can satisfy a customer in mobile banking in Thailand (Boonsiritomachai and Pitachyadejanant, 2017). By adopting an extended TAM, structural equation model (SEM) analysis reveals usefulness, trust, easiness and relative advantage as main influencing factor in Spain for mobile banking adoption (Leiva et al., 2017).
Like many other countries, in Bangladesh mobile banking is now very popular and also gaining more popularity day by day.
The following table shows an increasing trend on users of both mobile phone and mobile banking (see Table 1).
Use of mobile phone and mobile banking
| April, 21 | March, 21 | Feb, 21 | Jan, 21 | Dec, 20 | Nov, 20 | |
|---|---|---|---|---|---|---|
| The total number of mobile phone subscribers (in millions) | 174.10 | 174.63 | 173.36 | 171.85 | 170.14 | 168.37 |
| No. of registered clients in mobile banking (in millions) | 96.48 | 102.80 | 102.37 | 100.55 | 99.37 | 99.84 |
| No. of daily average transaction (In thousand) | 10,165.96 | 9911.88 | 9987.98 | 9652.75 | 9661.51 | 9376.9 |
| Average daily transaction (in crore BDT) | 2115.96 | 1923.95 | 1966.40 | 1846.99 | 1824.42 | 1786.61 |
Source(s): Bangladesh Bank and Bangladesh Telecommunication Regulatory Commission (BTRC)
In Bangladesh, there also has some study about mobile banking. In order to identify the factors that influence the use of mobile banking in developing countries, Kabir (2013) made a research in Bangladesh and found easy use, usefulness, trust and relative advantage positively influence and risk negatively influence mobile banking adoption. Making a quantitative research only on 2nd generation bank, Jannat and Ahmed (2015) identified ineffective advertisement as negatively influencing factor of mobile banking. Although convenience and responsiveness were important and significantly influencing factors that affect Bangladeshi customers experience in mobile banking, transaction security in ATM booth cannot ignored at all, moreover technological issues also related with this term (Islam et al., 2019). With all these factors, Hai and Rahman (2016) discovered specialist organizations' dedication and truthfulness were a great concern to the conscious customer to deal with mobile financing system (MFS) in Bangladesh. But a study of SURVIQUAL model suggested that, all the influencing factors of mobile banking adoption were not equally important to consider as their influencing power were not equal on the people of Dhaka and Tangail district of Bangladesh (Khan et al., 2018). In that study, the authors found responsiveness was the strongest and tangibility was the weak factor and reliability, assurance and empathy are the factors that have moderate impact on customer satisfaction on mobile banking. The result was slightly different from the findings of Rahman et al. (2017), who found that assurance had no significant influence but the remaining four factors of SURVIQUAL model that is tangibility, reliability, responsiveness and empathy had significant positive impact on customer satisfaction for using mobile banking (Rahman et al., 2017). Khan et al. (2021) made a significant research work on use of mobile banking apps and found three factors of trustworthiness (ability, benevolence and integrity) can positively influence people of capital city of Bangladesh to adopt mobile banking.
Although mobile banking is not a very new issue in Bangladesh, there are few literature works in this field (Khan et al., 2018). Especially generation wise research is not available. But each generation has unique experiences and lifestyles that influence their satisfaction level and retention tendency (Chaney et al., 2017; Williams and Page, 2011). So, generation based research work in mobile banking sector can reveal appropriate and effective policy for companies and related authorities.
In Bangladesh, the 15–34 age group is the largest segment of mobile and Internet users accounting for approximate 91.8% of total market (ICT Survey, 2018–2019). Table 3 presents Internet and mobile subscribers by age level.
Age level of Internet and mobile users
| Age group | Internet subscriber (% of total) | Mobile subscriber (% of total) |
|---|---|---|
| 15–24 years | 80.7 | 91.4 |
| 25-34 years | 56.3 | 86.5 |
| 35–44 years | 29.3 | 70.2 |
Source(s): ICT Survey and Bangladesh Bureau of Statistics (BBSs)
From the table it is clear that the mobile banking customers are predominantly young between 15–34 years old. So, for segment marketing and for policy makers understanding of young customer's behavior is extremely important. The study about young customers' behavior and their perception is important not only for market size but also for their dynamic effect on marketing efforts design to sell products to them. In a research on “Marketing strategies for Generation Y” author found global manufacturer launched a variety of product designed mainly to attract the generation Y. Advertisers are also busy trying to find innovative ways to reach this group (Naumovska, 2017). Market researchers found it is the most challenging to satisfy the members of Gen-Y and Gen-Z. From earliest youth, they have been exposed to the Internet, to social network and to mobile system that has produced a hyper-cognitive generation very comfortable with collecting and cross-referencing many sources of information and with integrating virtual and offline experiences (Francis and Hoefel, 2018). So, adequate research is necessary to identify young customer's requirement and to decide how these requirements can fill up. Although young people are the most significant customer of mobile banking in Bangladesh, no research was found in existing literature about the measurement of young customer satisfaction and loyalty. So, there exists a clear gap of research about young generation's satisfaction. So, this study is an attempt to make up this gap and enrich the present literature by measuring how strongly factors influence young customer satisfaction and loyalty in mobile banking in Bangladesh.
Hypothesis development and conceptual model
For evaluating the factors affecting customer satisfaction, partial least square-structural equation model (PLS-SEM) is used and a conceptual model designed that expressed the relationship between endogenous and exogenous latent variables. By using SEM technique a model of total 16 factors, finalized from literature, was developed and these 16 factors categorized into five groups namely expense, security, relative advantage, responsiveness and convenience. These five groups are called exogenous latent variable. Satisfaction and loyalty are the endogenous variable each of which consists of three indicators (presented in Table 2).
Primary list of factors
| Code | Factor | Reference |
|---|---|---|
| Sec-1 | Monetary safety | Laforet and Li (2005), Boonsiritomachai and Pitachyadejanant (2017), Achieng and Ingari (2015) |
| Sec-2 | Safety of personal information | Ghosh and Barua (2014), Achieng and Ingari (2015), Kabir (2013) |
| Exp-1 | Transaction fee | Achieng and Ingari (2015) |
| Exp-2 | Transportation cost | Jannat and Ahmed (2015) |
| Exp-3 | Discount | Focus group |
| R-Adv-1 | Time savings | Kabir (2013) |
| R-Adv-2 | Social image | Mattila (2003) |
| R-Adv-3 | Retrieval of account balance and history | Kahandawa and Wijayanayake (2014) |
| Res-1 | Customer care | Ghosh and Barua (2014) |
| Res-2 | Agent and helpline | BB & DU (2017) |
| Res-3 | Prompt correction of error | BB & DU (2017) |
| Conv-1 | Accessibility | Islam and Himel (2015) |
| Conv-2 | Continuous update | Boonsiritomachai and Pitachyadejanant (2017) |
| Conv-3 | Reduce physical and mental effort | Achieng and Ingari (2015) |
| Conv-4 | Easy function | Jannat and Ahmed (2015) |
| Conv-5 | Proper instruction | Leiva et al. (2017) |
| Sat-1 | Choice preference | Ghosh and Barua (2014) |
| Sat-2 | Pleased feelings | Islam and Himel (2015), Kheng et al. (2010) |
| Sat-3 | Satisfying experience | Kabir (2013) |
| Loyal-1 | Continuity | Lam and Burton (2006) |
| Loyal-2 | Objection | Ghosh and Barua (2014) |
| Loyal-3 | Recommend | Wong (2013) |
Source(s): Literature review
For a long duration, customer satisfaction is the focal point of marketing research. Customer satisfaction indicates positive and happy feelings of a consumer after consuming the product or service (Kheng et al., 2010). The customer satisfaction is treated as the necessary premise for the retention of customers. Lam and Burton (2006) identified satisfaction as the main determinants of loyalty. Actually loyalty is the degree to which a customer exhibit repeats purchasing behavior from the vendor (Kotler et al., 1999). So, like many other services, in case of mobile banking, customer loyalty also associated with customer satisfaction in Bangladesh.
Satisfaction influence loyalty.
Cost of mobile banking include transaction fee, bank charge and mobile network charge (Achieng and Ingari, 2015). Although mobile banking require some transaction cost, it may reduce transportation cost. Sometimes, it is helpful to reduce total cost by providing the facility of utility bill payment, discount on shopping, discount on restaurant bill etc. Cost or expense is an important consideration for people in developing country.
Expense influence satisfaction
Not only to adopt but also to continue the use of mobile banking, perceived financial cost is the most influencing factor in Bangladesh (Siddik et al., 2014). Gomachab and Maseke (2018) made a research on the customers of below 25 years old, with high school level of education. The researchers found that, although customers adopted mobile banking getting influenced by advertisement, 75% people were satisfied and retained the use of mobile banking because of cost effectiveness. Similarly, Hanif et al. (2010) argued that price fairness had a great impact on customer satisfaction and high cost is the key factor that can stop people from using mobile banking. So, for the Bangladeshi young customers, being the people of developing country, cost effectiveness and reduction of expense can be an influencing factor of customer loyalty.
Expense influence loyalty
Security is the vital issue to customer for virtual transaction. Ghosh and Barua (2014) defined security as the safety and protection of information. But in practice not only information but also monetary issue is closely related with security because of fraud and hacking (Kabir, 2013). Ensuring security will result in assurance. So assurance should have positive impact on satisfaction.
Security influence satisfaction
Relative advantage means comparative benefits that a user gets from mobile banking. This benefit can be expressed by social prestige, savings in time etc. (Mattila, 2003). Relative advantages have positive relation with any service quality and satisfaction.
Relative advantages influence satisfaction
Responsiveness is the customer's perception of getting help when needed (Achieng and ingari, 2015). Feedback and response encourage any activities. Immediate response from mobile operator and bank or agent can be an important influencing factor in customer satisfaction.
Responsiveness influence satisfaction
Conveyance is the extent to which mobile banking can serve users' needs. It may include ease of use, usefulness etc. (Kabir, 2013) (see Figure 1).
Convenience influence satisfaction
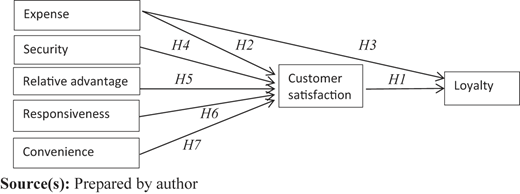
Research mythology
- (1)
Questionnaire design and data collection:
For this study, quantitative research methodology was followed and both primary and secondary data were collected. For the collection of primary data, a questionnaire was designed, pre-tested and then administered. The questionnaire was developed to obtain the responses from young users of mobile banking to test the research variables. The seven research variables are expense (three items), security (two items), relative advantage (three items), responsiveness (three items), convenience (five items), customer satisfaction (three items) and loyalty (three items). All the items regarding the measurement of variables were totally adopted from previous research and carefully rephrased so that all items can applied to mobile banking adoption in Bangladesh. The questionnaire organized into two segments. The first section was designed to collect basic demographic information of respondents and the second section consists of twenty two questions to evaluate seven constructs on five-point Likert scale ranging from 1 (strongly disagree) to 5 (strongly agree). A pilot study was conducted for testing effectiveness of the questionnaire. Following the feedback of pilot study, the questionnaire was slightly edited to strengthen the clarity and completeness. The sources of secondary data include website, Internet, different working papers and published articles. Secondary data were analyzed to find out research gap and variables for the study. Analysis of secondary data also enriches literature review.
- (2)
Population and sample:
The population of this study is the young people (18–25 years old) using mobile banking services for at least six months. This study adopts convenient sampling method to select potential participants in this study. This sampling method is a non-probability sampling technique where subjects are selected because of their convenient accessibility and proximity to the researcher. Distribution of the questionnaires was done through personal administration. A total of 300 respondents were chosen as sample. The target respondents were basically students of graduation and under-graduation level. The valid respondents were 279 covering 93% of original sample.
- (3)
Research technique:
For calculating the effect of observed variables and their indicators on satisfaction and loyalty, PLS-SEM was used. Data analysis has done through Smart_PLS, Version-3.2.7. Smart_PLS is a prominent software application for PLS-SEM which was initially developed by Ringle et al. (2005). SEM consist of two sub model; one is outer model that specifies the relationship between latent variable and their manifest variables and another one is inner model which specifies the relationship between endogenous (dependent) and exogenous (independent) latent variable.
Data analysis and interpretation
PLS-SEM is analyzed and evaluated in a systematic process which consists of two stages:
Outer measurement model analysis
Inner structural model analysis
The analysis of outer model involves determining indicator reliability, internal consistency, discriminant validity and convergent validity (Petera et al., 2017)
Indicator reliability is the square value of outer loading of the items (Wong, 2013). This reliability describes the percentage of variance extracted from the indicators (Hair et al., 2017). The result of indicator reliability of 0.70 or higher is preferable (Hussain, 2018) and greater than or equal 0.5 is acceptable (Wong, 2013) but for exploratory research 0.4 can be accepted (Hulland, 1999). The indicators reliability of this study (presented in Table 4) is all in the acceptable range.
Result summery of outer measurement model
| Latent variable | Indicators | Outer loading | Indicator reliability =(Loading)2 | Composite reliability | Convergent Validity = AVE |
|---|---|---|---|---|---|
| Expense | Exp-1 | 0.771 | 0.594 | 0.829 | 0.617 |
| Exp-2 | 0.801 | 0.642 | |||
| Exp-3 | 0.784 | 0.615 | |||
| Security | Sec-1 | 0.817 | 0.667 | 0.828 | 0.706 |
| Sec-2 | 0.863 | 0.745 | |||
| Relative advantage | R-Adv-1 | 0.703 | 0.494 | 0.783 | 0.546 |
| R-Adv-2 | 0.718 | 0.516 | |||
| R-Adv-3 | 0.792 | 0.627 | |||
| Responsiveness | Res-1 | 0.752 | 0.566 | 0.808 | 0.583 |
| Res-2 | 0.757 | 0.573 | |||
| Res-3 | 0.782 | 0.612 | |||
| Convenience | Conv-1 | 0.753 | 0.567 | 0.887 | 0.613 |
| Conv-2 | 0.714 | 0.510 | |||
| Conv-3 | 0.858 | 0.736 | |||
| Conv-4 | 0.728 | 0.530 | |||
| Conv-5 | 0.849 | 0.721 | |||
| Satisfaction | Sat-1 | 0.764 | 0.584 | 0.815 | 0.595 |
| Sat-2 | 0.735 | 0.540 | |||
| Sat-3 | 0.813 | 0.661 | |||
| Loyalty | Loyal-1 | 0.711 | 0.506 | 0.757 | 0.509 |
| Loyal-2 | 0.717 | 0.514 | |||
| Loyal-3 | 0.714 | 0.510 |
Source(s): Authors own findings
To measure Internal Consistency, Cronbach's alpha is traditionally used but literatures suggest using composite reliability can be the best substitute in this regard (Bagozzi and Yi, 1988; Hair et al., 2012; Wong, 2013). Table 4 presents a higher level of internal consistency among all five reflective latent variables as all the values are larger than the minimum threshold level of 0.7.
Average Variable Extracted (AVE) is used to check convergent validity and according to the rules of thumb the minimum acceptable value is greater than 0.5 in order to confirm convergent validity. Table 4 presents acceptable values of AVE of this study.
According to Fornell and Larcker (1981) criterion, the square root of AVE of each latent variable should be greater than the variables correlation with any other variables in the model to ensure discriminant validity. Another discriminant method is cross loading of the indicators outer loading. All loadings of a variable on its assigned variables must be higher than all other cross loadings of other variables. This study ensure validity in both measures (Table 5 and Appendix 2)
Fornell-larcker criterion analysis for checking discriminant validity
| Conveyance | Expense | Loyalty | Relative advantage | Responsiveness | Satisfaction | Security | |
|---|---|---|---|---|---|---|---|
| Conveyance | 0.783 | ||||||
| Expense | 0.647 | 0.786 | |||||
| Loyalty | 0.576 | 0.580 | 0.714 | ||||
| Relative advantage | 0.649 | 0.592 | 0.588 | 0.739 | |||
| Responsiveness | 0.642 | 0.560 | 0.563 | 0.591 | 0.764 | ||
| Satisfaction | 0.767 | 0.768 | 0.736 | 0.753 | 0.749 | 0.771 | |
| Security | 0.698 | 0.556 | 0.592 | 0.599 | 0.602 | 0.729 | 0.840 |
Source(s): Authors own findings
After analyzing the measurement model and confirming reliability, consistency and validity, the next step is to analyze the inner structural model which includes measurement of path coefficient, explanation of endogenous variables variance (R2), multi-collinearity check (VIF) and measurement of effect size (f2).
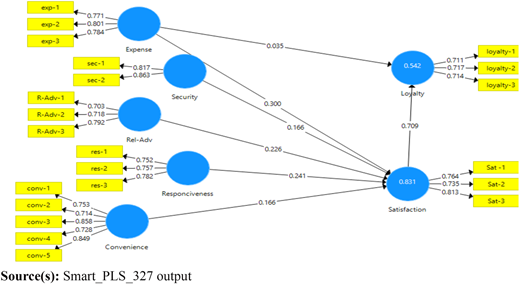
The key criteria for assessing the structural model in PLS-SEM are the measurement of significance of path co efficient. The inner model suggest that expense has the strongest effect on satisfaction (0.300) followed by responsiveness (0.241), relative advantage (0.226), security (0.166) and convenience (0.166). The hypothesized path relationship between expense and loyalty (0.035) is not significant since the value is lower than 0.1. In this model, the path coefficient of satisfaction to loyalty (0.709) is the most significant relation (Figure 2). In PLS_SEM, the alternative way to test the significance of structural path is the bootstrap procedure using t statistics. As per rules of thumb, for two tailed test at 5% significance level the value of t-test is significant if it is higher than 1.96. If p-value is considered, it must be smaller than 0.05(at 5% significance level) (Wong, 2013). In this model, Table 6 confirms the significance of all hypothesized path except the relation between expense and loyalty. It indicates expense does not predict loyalty directly.
Path co efficient
| Relationship | t-statistics | p-value |
|---|---|---|
| Expense → Satisfaction | 4.254 | 0.000 |
| Responsiveness → Satisfaction | 2.881 | 0.004 |
| Relative advantage → Satisfaction | 2.938 | 0.003 |
| Security → Satisfaction | 2.387 | 0.017 |
| Convenience → Satisfaction | 2.155 | 0.031 |
| Expense → Loyalty | 0.238 | 0.812 |
| Satisfaction → Loyalty | 4.450 | 0.000 |
Sources(s): Authors own findings
The amount of variance in endogenous variable explained by the exogenous variables linked to it is termed as coefficient of determination (R2). It is the measure of predictive value of the model. In this study the value of R2 is 0.831 for customer satisfaction and 0.542 for loyalty. It means five independent variables substantially explain 83.1% variance in the satisfaction but satisfaction and responsiveness together can change only 54.2% of loyalty. According to Wong (2013), R2 = 0.75 is substantial, R2 = 0.50 is moderate and R2 = 0.25 is weak. So this study indicates a substantial and moderate variance of satisfaction and loyalty respectively (Figure 2).
A detailed PLS_SEM analysis includes multicollinearity assessment. As the rules of thumb, the Variance Inflation Factor (VIF) need to have a value of 5 or less in order to avoid potential collinearity problem (Hair et al., 2011). Since the VIF values of all the indicators are less than five ( Apendix 2), it ensures that in this model there is no issue of multi collinearity problem.
Effect size (f2) is the measurement of contribution of an exogenous variable to the endogenous variables R2 value. The effect size helps to assess the overall contribution of a research study (Hussain et al., 2018). According to Barclay (1995), the f2 value of 0.35 indicates very strong effect 0.15 means moderate effect and 0.02 means weak effect. Table 7 shows a moderate effect of expense, responsiveness and relative advantage and weak effect of security and convenience on customer satisfaction. In case of loyalty, satisfactions effect is very strong, but responsiveness has no effect.
Findings and managerial implementation
On the basis of the above analysis and their interpretation, the following table is prepared as the result of the study (see Table 8).Table 9,Table 10
Result of the study
| Hypothesis | Path coefficient | Support | |
|---|---|---|---|
| t-test | p-value | ||
| H1: Satisfaction influence loyalty | 4.450 | 0.000 | Yes |
| H2: Expense influence satisfaction | 4.254 | 0.000 | Yes |
| H3: Expense influence loyalty | 0.238 | 0.812 | No |
| H4: Security influence satisfaction | 2.387 | 0.017 | Yes |
| H5: Relative advantages influence satisfaction | 2.938 | 0.003 | Yes |
| H6: Responsiveness influence satisfaction | 2.881 | 0.004 | Yes |
| H7: Convenience influence satisfaction | 2.155 | 0.031 | Yes |
Source(s): Authors own findings
| Items | VIF |
|---|---|
| Sec-1 | 1.207 |
| Sec-2 | 1.207 |
| Exp-1 | 1.337 |
| Exp-2 | 1.430 |
| Exp-3 | 1.298 |
| R-Adv-1 | 1.186 |
| R-Adv-2 | 1.148 |
| R-Adv-3 | 1.274 |
| Res-1 | 1.246 |
| Res-2 | 1.274 |
| Res-3 | 1.255 |
| Conv-1 | 1.697 |
| Conv-2 | 1.453 |
| Conv-3 | 1.231 |
| Conv-4 | 1.737 |
| Conv-5 | 1.341 |
| Sat-1 | 1.231 |
| Sat-2 | 1.326 |
| Sat-3 | 1.324 |
| Loyal-1 | 1.139 |
| Loyal-2 | 1.167 |
| Loyal-3 | 1.094 |
| Convenience | Expense | Loyalty | Rel-Adv | Responsiveness | Satisfaction | Security | |
|---|---|---|---|---|---|---|---|
| Rel-Adv-1 | 0.445 | 0.332 | 0.380 | 0.703 | 0.449 | 0.514 | 0.349 |
| Rel-Adv-2 | 0.583 | 0.518 | 0.423 | 0.718 | 0.434 | 0.567 | 0.522 |
| Rel-Adv-3 | 0.412 | 0.455 | 0.496 | 0.792 | 0.429 | 0.585 | 0.449 |
| Sat-1 | 0.599 | 0.588 | 0.448 | 0.568 | 0.586 | 0.764 | 0.571 |
| Sat-2 | 0.535 | 0.481 | 0.627 | 0.475 | 0.544 | 0.735 | 0.398 |
| Sat-3 | 0.658 | 0.694 | 0.619 | 0.685 | 0.603 | 0.813 | 0.698 |
| Conv-1 | 0.753 | 0.598 | 0.601 | 0.575 | 0.528 | 0.666 | 0.614 |
| Conv-2 | 0.714 | 0.530 | 0.436 | 0.563 | 0.509 | 0.599 | 0.514 |
| Conv-3 | 0.858 | 0.482 | 0.408 | 0.500 | 0.510 | 0.607 | 0.541 |
| Conv-4 | 0.729 | 0.407 | 0.351 | 0.373 | 0.466 | 0.540 | 0.518 |
| Conv-5 | 0.849 | 0.492 | 0.428 | 0.503 | 0.489 | 0.612 | 0.527 |
| Exp-1 | 0.579 | 0.771 | 0.439 | 0.586 | 0.484 | 0.588 | 0.460 |
| Exp-2 | 0.487 | 0.801 | 0.427 | 0.463 | 0.426 | 0.591 | 0.427 |
| Exp-3 | 0.463 | 0.784 | 0.496 | 0.356 | 0.411 | 0.629 | 0.426 |
| Loyalty-1 | 0.441 | 0.446 | 0.711 | 0.434 | 0.458 | 0.518 | 0.497 |
| Loyalty-2 | 0.339 | 0.323 | 0.717 | 0.356 | 0.253 | 0.491 | 0.332 |
| Loyalty-3 | 0.446 | 0.462 | 0.714 | 0.461 | 0.478 | 0.561 | 0.432 |
| Res-1 | 0.521 | 0.321 | 0.446 | 0.400 | 0.752 | 0.557 | 0.385 |
| Res-2 | 0.466 | 0.418 | 0.402 | 0.392 | 0.757 | 0.543 | 0.474 |
| Res-3 | 0.485 | 0.533 | 0.441 | 0.551 | 0.782 | 0.612 | 0.515 |
| Sec-1 | 0.600 | 0.495 | 0.454 | 0.495 | 0.445 | 0.571 | 0.817 |
| Sec-2 | 0.576 | 0.445 | 0.537 | 0.512 | 0.560 | 0.651 | 0.863 |
From the study it is clear that, satisfaction has strong influence on loyalty in mobile banking in Bangladesh. There are several factors influencing satisfaction of Young customers of this country in the use of mobile banking. Among those factors, the most influencing factor is expense. Although this factor does not directly influence loyalty, it has significant influence on satisfaction. Some other research both in Bangladesh and in some other countries regarding mobile banking also mentions cost as one of the most significant influencing factors (Yu, 2012; Islam and Himel, 2015; Achieng and Ingari, 2015). Moreover, in Bangladesh, being a developing country, it is very obvious that at the young age the earning level is not much high. That's why Expense is the main concern for them in case of satisfaction.
The study also discovers the influencing power of responsiveness and relative advantage. Relative advantages mainly arise from a comparison of traditional banking and mobile banking. Mobile banking gain continuous popularity because of its time flexibility and operational simplicity. No office time need to maintain. So banking is available at every time. Moreover the Ability to retrieve account, View transaction history and usability of mobile apps make the mobile banking fascinating to the young generation.
Security and convenience are comparatively weak factors because their relation with satisfaction is insignificant. The f2 value shows these factors have weak effect on the variance of satisfaction. It means young customers satisfaction from mobile banking is not much fluctuating for these two factors. There may have several reasons behind this. For example with the passes of time people became use to with mobile security code and account pin number. Although at the initial level it was a great concern for people, now it has no significant role in satisfaction. Similarly, factors that make mobile banking convenient are not very strong factor in satisfaction. But in the age of step competition, not a single factor should ignore. Although today they are not much influencing, but by taking proper steps banks can increase the number of mobile banking customers through proper security system and convenient banking policy.
Mobile banking in Bangladesh has still a long way to go. So, for banking industry, mobile operators, regulatory authority and all other concern bodies should move forward with a positive approach to ensure customer satisfaction with mobile banking. The finding of this research has a differential concept that basically indicates the unique perception of young customer. Because this study finds that cost is the most influencing factor but security and conveyance has low influencing power, whereas most of the researches on mobile banking in Bangladesh reveal security, trust and assurance as the domination factor of determining customer satisfaction (Kabir, 2013; Jannat and Ahmed, 2015; Islam et al., 2019). Low income but adequate knowledge of Internet and mobile technology is the main feature of young generation that is the reason of this unique perception. In this regard, the following policy measures can be suggested to ensure the satisfaction and retention of not only young generation but also all levels of Bangladeshi people.
Banks should concentrate on the way of reducing transaction cost to ensure more people into adopting mobile banking technology. This high adoption and large volume of transaction will compensate the loss of price reduction.
Banks can take initiative to ensure proper training program for the agent that will provide them up-to-date technical knowledge and able them to deal with sensitive/criminal type of monetary transactions. Moreover, agent point should make available wherever customer want.
Hi-speed and smooth network have to ensure.
Among 61 scheduled banks in Bangladesh, only 15 banks are currently provide mobile financial services (Bangladesh Bank, 2021). So, mobile banking market is not fully competitive. Moreover, the market is concentrated to some particular company. As a result, the service providers are less attractive and creative. In this circumstance, in one side the new competitors have the opportunity to enter in the market with innovative and attractive service, and on the other side, the existing banks can expand market share through new features in mobile banking services.
Banks should design and implement mobile banking services and apps in such a way that will ensure proper safety, security and confidentiality of money and information
In this competitive world, product segment and customize service are very important to attract different categories of customer. So, banks can offer mobile banking services that allow flexibility and customization based on user profile and requirements.
Limitation and future research direction
This study has some limitation. First, this research focuses only on five independent factors. But there may have many other factors that can influence customer satisfaction. Moreover, this study does not analyze demographic factors such as gender, age and race that may have relation with mobile banking adoption and satisfaction. Not only demographic, but also geographic factors can influence customer expectation and satisfaction. These phenomena require investigation on a wide scale. A potential future research can be done by investigating how the demographic variables, such as culture and socioeconomic conditions moderate the effect of service quality on customer satisfaction. Second, the sample size is very small as compared to large population. Since the number of mobile banking users increase day by day, a longer duration of study is required to find the trend of customer behaviors and work on the further development of service quality of mobile banking.
Conclusion
This study successfully identified the factors influencing satisfaction of young users of mobile banking service. The result reveals expense, responsiveness and relative advantage strongly influence customer satisfaction but security and convenience are the insignificant factors in this regard. Although they have relation with customer satisfaction, not have proper exploratory power. In spite of having some limitation, this study provides valuable knowledge and information to the software engineer, service provider and banks to design and implement mobile banking service in such a way that will result in more customer satisfaction and loyalty. Being a densely populated country, Bangladesh is now a good market for mobile banking because of large number of mobile phone users. So, with proper guideline and policy, mobile banking can lead Bangladesh to a different level of prosperity.
The authors are grateful to the editor, Dr. Jayantha N. Dewasiri, and the anonymous reviewers of the journal for their extremely useful suggestions to improve the quality of the article.

