Skip to Main Content
Purpose

Education emerges as a driving force capable of shaping transformative change in a century challenged by the pressure of ensuring long-term human survival while preserving the planet. This study aims to empirically investigate the interrelationships between education, environmental performance and economic welfare within the European Union (EU).

Design/methodology/approach

The authors use a structured and multidimensional methodological approach that embeds three advanced modeling techniques, namely, robust regression, modern quantile on-quantile regression and network analysis through Gaussian graphical models. The analysis is based on a balanced selection of indicators that reflect each of this study’s three pillars – education, environmental sustainability and socioeconomic well-being – across the 27 EU Member States, focusing on variables such as government spending on education, renewable energy usage and CO2 emission levels.

Findings

The main findings reveal patterns and connections that inform tailored strategies and policy decisions, contributing to a more resilient and environmentally responsible socioeconomic model. There is a strong connection between educational investment and improvements in environmental and socioeconomic indicators, emphasizing education’s strategic role in advancing sustainability.

Originality/value

By offering a comprehensive analysis, this study reinforces the value of education as a foundational element for achieving the sustainable development goals and guiding societies toward a greener, more equitable future.

Sustainable economic well-being brings together economic activity, social structure and the environment in a common development system (Alsabhan and Anas, 2025). The notion of “eco-social well-being” expresses the link between living standards, the use of natural resources and equity between generations (Hirvilammi and Koch, 2020). Political and economic factors must react to climate risks and include sustainability criteria in regulations and production processes (Wang et al., 2022; Moradian Daghigh and Mirzaee Ghazani, 2023; Bozdog et al., 2025). In this framework, education has a central role, strengthening human capital, promoting the circulation of knowledge and shaping behaviors at the individual and institutional levels (Georgiou et al., 2021, p. 5). These effects are transposed through labor markets, public institutions and policy implementation channels (Iwińska et al., 2023).

Within the European Union (EU), one of the main challenges in development policies is to maintain the interdependence between education, economic growth and environmental performance, and in response, the efforts made by the EU are capitalized on through the European Commission (2019) and the European Commission (2020). These action plans have laid the real foundations for human capital formation for a green, low-carbon and resource-efficient economy (Cifuentes-Faura, 2022; Panzaru et al., 2025). However, even though policies are becoming increasingly anchored in societal issues, empirical evidence on the contribution of education to economic and environmental sustainability in EU Member States is still insufficient.

Previous studies have highlighted a distinct approach to these areas, focusing either solely on human development or solely on environmental policy, without fully exploring their interdependence. The proposed study fills this gap, extending recent interdisciplinary research regarding the integration of socioeconomic and environmental systems (Tao et al., 2024; Ye et al., 2024) by including education as a central factor of sustainable performance. At the same time, the existing literature generally offers perspectives related to the influence of education on economic development and environmental attitudes; however, very few studies have managed to integrate these dimensions into a common sustainability framework. Building upon recent interdisciplinary approaches (Wang et al., 2022; Li et al., 2023; Wu et al., 2023), this research contributes by connecting investments and participation in education with economic and environmental outcomes at the European level. Moreover, the present study advances existing knowledge by extending previous findings on the connections between human development and sustainability (Opoku et al., 2022) and on the interactions between renewable energy consumption, economic growth and life expectancy (Wang et al., 2023a).

Within this complex framework, this research examines the impact of education on the development of environmental performance and economic well-being in the EU countries (EU-27). The study explores whether higher investment in education and wider participation across different levels of schooling are linked to better environmental and socioeconomic outcomes. It examines the stability of these links across member states and throughout the observed period. The analysis is based on the interaction between three policy and analytical dimensions – education systems, environmental indicators and socioeconomic outcomes – and aims to answer the following research question: To what extent does education contribute to achieving sustainable economic well-being across EU Member States, by linking human capital formation with environmental and socioeconomic performance?

The originality of the paper resides in methodological innovation, as it systematically applies three advanced econometric models (robust regression [RREG], quantile-on-quantile regression models [QoQRM], founded on simultaneous quantile regression [SQR] designs, and Gaussian graphical models [GGMs]) to the interdisciplinary study of the education–environment–welfare nexus, offering new EU-level evidence. Through the combination of distributional analysis and models of conditional dependence, this research overpasses existing work on average effects in the relationship between education, environment and well-being in the EU-27 by going beyond simple single-equation models. Through this complex methodological framework, the study highlights the role of education in achieving sustainability outcomes and provides accurate empirical evidence on the quantitative parameters associated with resource use patterns and quality of life in EU Member States. This approach is directly related to recent studies examining the relationships between carbon emissions, economic efficiency and the environment (Ding and Zhang, 2023; Yang et al., 2024) and innovates by including education as a catalyst in the field of sustainability.

The paper has four main sections. In Section 1, we examine the literature review, focusing on key theories and research on the connections between education, environmental outcomes and economic development. In addition, in the subsections, we present a bibliometric analysis, conducted using VOSviewer, which highlights the main trends and thematic links in research on similar topics. Section 3 explains how the indicators were selected, where the data come from and which statistical methods are used. Section 4 presents the primary empirical outcomes for the EU-27. Section 5 reflects on the implications of the findings for policy and future research directions.

The interplay between education and environmental performance represents a topical subject in literature, with both academics and public discourse highlighting the global need to strengthen the understanding in this scientific field. Despite extensive work on environmental education and sustainability awareness, few studies have empirically connected educational processes with socioeconomic and environmental outcomes, particularly in the European context.

At the EU level, the role of education is increasingly defined in terms of its capacity to develop human capital, which encompasses the skill set necessary to enhance productivity, facilitate social inclusion and support the green transition (European Commission, 2025a). However, the outcome is context-dependent. For the EU-27, there are considerable disparities in the relationship between education, innovation and sustainable development (old member states versus new member states), thereby confirming the need to diversify the policy mixes in the context of cohesion and welfare, which cannot be followed in the same way, i.e. through the adoption of the “one-size-fits-all” strategy (Andrade et al., 2018; Makkonen and Mitze, 2019). Furthermore, in the context of competitiveness, the qualitative nature of human capital, along with the constraints on overall capability because of the innovation deficit, is an issue that policymakers need to account for (Istvan et al., 2025). However, the role of educational spending in the dynamics of the ecological footprint, along with its interaction in the context of renewable energy, is also documented in the EU scenario (Çütcü et al., 2023). Simultaneously, the role of governance quality in establishing the CO2-based environmental performance, along with educational spending, is a key credential in sustainability strategies (Dinca et al., 2022; Lobonț et al., 2024).

Also, at the level of the EU, the framing of education for sustainability can be described as increasingly informed by the competence-based paradigm in relation to the green transition and the well-being of society. In this context, the GreenComp model can be considered the key reference in relation to the framing of sustainability competencies in the following four domains: “Embodying sustainability values,” “Embracing complexity in sustainability,” “Envisioning sustainable futures” and “Acting for sustainability” (European Commission, 2022; European Commission, 2025b).

Environmental education enables many groups to work together on research projects by emphasizing local knowledge, experiences, attitudes and practices, often within place-based contexts. Environmental educators draw on concepts from learning sciences, marketing, sociology, behavioral psychology, welfare and education (Heimlich and Ardoin, 2008; Jacobson et al., 2015). These initiatives foster communal bonds that uphold common prosocial and environmental values, creating community and belonging among participants (Wu et al., 2023). In recent years, an increasing trend has been noted among networks of researchers who have begun to conduct in-depth investigations into potential solutions to the challenges posed by environmental degradation. This can help strengthen environmental awareness and support the integration of ecological and economic practices through sustainable finance and responsible corporate behavior (Li et al., 2024; Dou et al., 2025).

On the other hand, there is a gap in the specialized literature on environmental sustainability and welfare issues. To deepen our understanding of this current topic and to analyze how specific aspects have been addressed in the specialized literature, we have conducted a bibliometric analysis on a sample of 531 scientific articles extracted from Web of Science, from top journals in the fields of Business, Management and Accounting; Computer Science; Economics, Econometrics and Finance; and Environmental Science.

Bibliometric analysis underscores the importance of integrating ecological and economic sustainability into education systems to develop ecological skills and support employment (Nademi and Sedaghat Kalmarzi, 2025). These studies emphasize the importance of including education in broader sustainability frameworks, a perspective that we adopt in the present research to capture its structural role throughout EU member states.

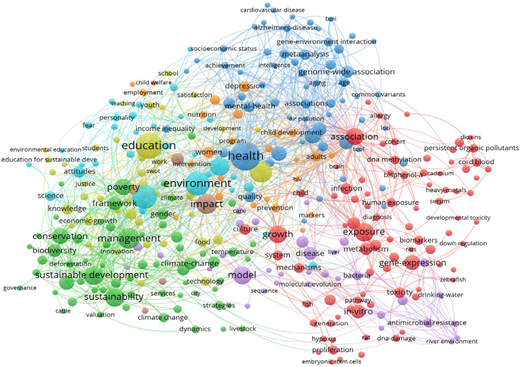
Figure 1 reflects a network that highlights interdisciplinary connections between keywords researched with the VOSviewer software, such as “Welfare,” “Education” and “Environment,” suggesting an upward trend of interest in transdisciplinary research to address global challenges. For example, the significant clusters emphasize topics such as “Sustainable Development” and “Mental Health,” highlighting their importance in recent policy and research (Li et al., 2023). The size of the nodes indicates a high increase in academic interest for sustainability and environmental impact over the past decade, as evidenced by existing research on emission reduction and green financial innovation (Xie et al., 2023).

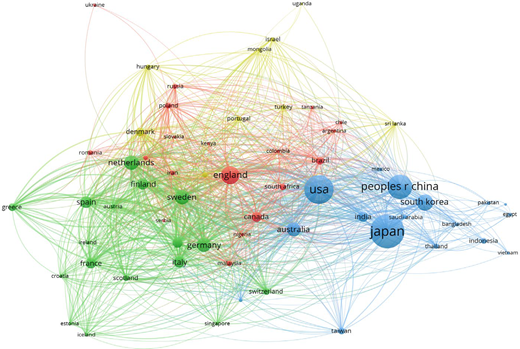
Figure 2, designed based on VOSviewer, highlights the international collaboration among nations studying “Welfare,” “Education” and “Environment,” with the USA, China and Japan identified as major contributors. Other relevant connections include the linkage between Europe and North America, with Asia serving as a key collaboration node. The importance of local and community-led sustainability practices and methods is currently a developing focus of recent studies, showing the importance of local and community-led sustainability methods within these areas of study (Dushkova and Ivlieva, 2024). The importance of the linking role of education and learning is highlighted regarding behavioral change for well-being (Cai et al., 2023).

Analyzing recent studies, most articles highlighted that to promote ecological practices, which in turn will improve the quality of life of the community, one of the main steps is to carry out daily, industrial, social and personal activities in a sustainable manner. In our study, we can validate this idea, noting that this brings benefits not only to the environment but also takes into account economic aspects (Rong et al., 2023). People involved in these campaigns, whose behaviors were monitored over a certain period, included those informing and raising awareness among the public about the risks of climate change and the actions they could take to be more environmentally conscious and resource-efficient, especially regarding natural resources (Dou et al., 2025). The results suggested that people’s involvement in such projects and campaigns had a positive impact on sustainability, which was immediately noticeable.

These aspects must also be followed in the case of companies, corporations and multinationals, whose contribution to the damage and deterioration of the environment is increasing from year to year, which are periodically involved in information and development actions of environmentally friendly activities, but, subsequently, the specific activities carried out remain just as harmful (Wu et al., 2023; Dou et al., 2025). Education, therefore, remains central in reinforcing sustainable behaviors and environmental responsibility (Cai et al., 2023; Nademi and Sedaghat Kalmarzi, 2025). These models demonstrate that educators’ values align with sustainable governance, underscoring the role of education in shaping environmental responsibility (Leal et al., 2024).

To examine the interplay between education, environmental performance and economic welfare in EU countries, we used a structured approach that combines several analytical methods, focusing on analyzing the correlations between indicators and applying various modern econometric techniques to observe developments over time and differences between EU countries. The analysis relies on a specific set of indicators covering three areas, namely, education, environmental sustainability and socioeconomic well-being, across the EU-27 Member States during 2002–2023. The data is extracted from official sources such as Eurostat, OECD and the World Bank and captures the following sets of indicators:

  1. Educational indicators:

    • Public expenditure on education, percentage of GDP (Exp_EDU): reflects the degree of involvement of governments in the development of human capital.

    • Early childhood enrollment rate (PPrimary_SE): shows children’s access to early childhood education.

    • Primary education enrollment rate (Primary_SE): measures participation in basic education.

    • Secondary education enrollment rate (Second_SE): indicates continuation of studies beyond the primary level and preparation for higher education or the labor market.

    • Tertiary education enrollment rate (Tert_SE): reflects access to universities and the role of advanced education in innovation and economic competitiveness.

  2. Environmental performance indicators:

    • CO2 emissions (CO2_E): measure environmental impact and progress in reducing carbon footprint.

    • Renewable energy consumption, percentage of total consumption (Renew_EC): shows the share of clean energy in each country’s energy mix.

    • Water productivity (Water_P): indicates the efficiency of water resource use in relation to economic output.

    • Agricultural methane emissions (Agri_P): tracks emissions from agricultural activities.

    • Electric power consumption (Electric_PC): reflects energy demand and can signal industrial development or energy efficiency.

  3. Welfare indicators:

    • GDP growth (annual %) (GDP_gr): measures the annual increase in economic output.

    • Human Development Index (HDI): a composite index evaluating health, education and standard of living.

    • Life expectancy in years (LE): indicates overall population health and living conditions.

The first stage of data analysis involves descriptive statistical analysis of all selected indicators to understand how education variables interact with environmental and well-being outcomes. In this analysis, we segmented the first step of the quantitative distribution of the data, the variability and the main developments and trends of each variable across the 27 EU Member States over the last decade. These results served as a filter for irrelevant values and allowed us to prepare for the subsequent inferential modeling.

Descriptive statistics are presented in Table 1 and provide an overview of the distribution and variation of the indicators analyzed across the EU countries. Education data generally shows high enrollment rates at the primary and secondary levels, but tertiary education exhibits greater differences between countries. In terms of public expenditure on education, there is considerable variation and this corresponds to the differing national commitments. However, as a cumulative indicator, it measures financial effort but not quality of education, results of learning or sustainability-oriented competence. Education spending by public bodies varies substantially, reflecting differing national commitments. Environmental indicators, such as CO2 emissions and renewable energy use, show high dispersion, suggesting structural differences in energy policies and environmental impacts. In contrast, well-being indicators, such as Human development index (HDI) and life expectancy, are more evenly distributed, indicating a generally high level of quality of life across the EU area.

Furthermore, we configured the Pearson/Spearman correlation matrix, and the results are presented in  Appendix 5, Table A1, showing notable linkages between education, environmental performance and economic well-being. Tertiary education enrollment correlates negatively with CO2 emissions and positively with renewable energy use, suggesting a link between education and sustainability. Public spending on education is closely tied to enrollment and human development.

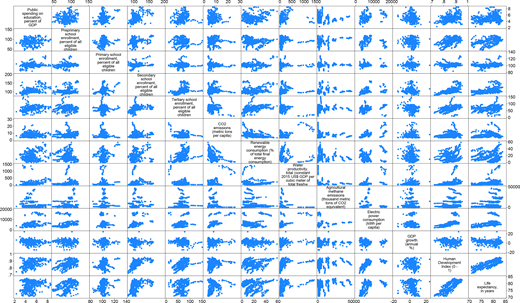
A scatterplot matrix of education, environmental and welfare credentials (Figure 3) was used to further explore these links, allowing for the observation of relationships between variables. This tool helps identify linear trends, clusters and outliers, giving a clearer view of data connections. From the scatter plot matrix, it is possible to identify connections similar to those found in the correlation analysis. A higher level of education is coupled with lower emissions of CO2 and the use of renewable sources, matching advances in human development. Education is also linked with life expectancy, reflecting the influence of education on overall well-being. Agricultural CO2 emissions and water productivity, on the other hand, display less obvious connections.

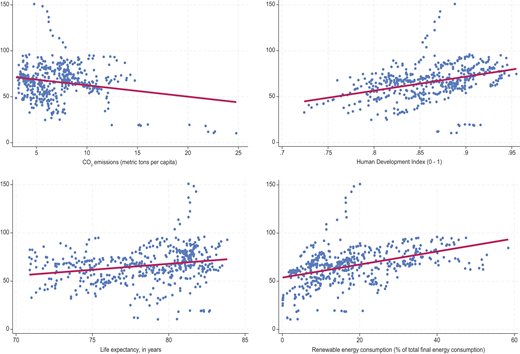
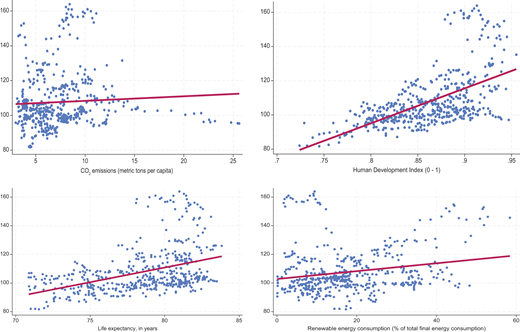
To complement this methodological step, we designed two sets of scatter diagrams to illustrate the relationship between tertiary (Figure 4) and secondary (Figure 5) educational enrollments and measures of sustainability, thereby demonstrating the impact of education on the environment and welfare. The diagrams entail the direction, strength and form of the relationship between the selected variables.

From the first four scatter diagrams presented in Figure 4, it can be observed that an inverse correlation exists between tertiary enrollment and the emission of CO2, which implies that a country with better accessibility to tertiary education expresses high sensitivity to the environment. Positive linear correlation can be seen among tertiary education, HDI and life expectancy.

The second series of scatter plots in Figure 5 shows that secondary education enrollment corresponds to dispersed CO2 emissions and rises along with HDI, life expectancy and the use of renewable energy. Though the trend is less steep compared to the one for tertiary education enrollment, it still indicates a correlation with the development indicators. This means that secondary education plays an important role in reaching sustainability goals, but perhaps its effectiveness relies more on the connection to higher education.

Summarizing, both education levels are connected to sustainability and welfare measures, but tertiary enrollment exhibits stronger and more consistent relationships, primarily in reducing environmental harm and promoting human development. Secondary education shows weaker patterns, which implies that wider higher education access may drive progress toward environmental and socioeconomic sustainability.

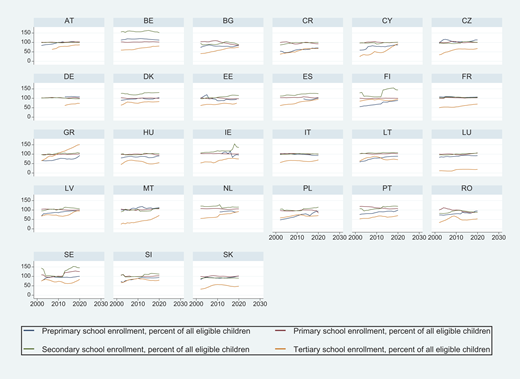
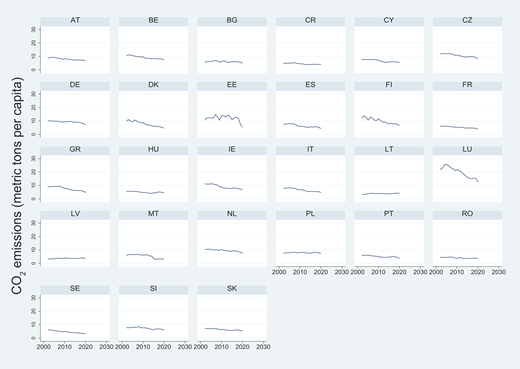
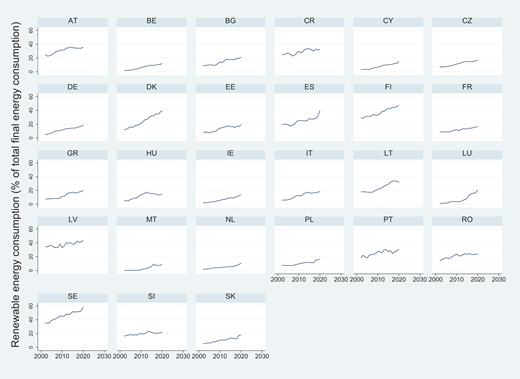
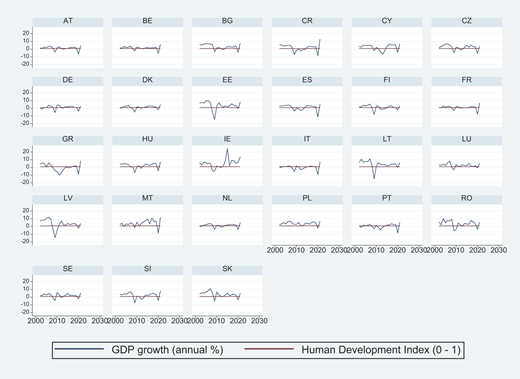
The patterns over time of the main indicators used in the empirical analysis ( Appendix 1Figure A1,  Appendix 2Figure A2,  Appendix 3Figure A3 and  Appendix 4Figure A4) show changes in indicators across the 27 EU Member States from 2002 to 2023. These visuals capture national patterns in education, environmental outcomes and welfare, reinforcing the empirical model. The figures show variation among countries and movement in the main indicators used for analysis. Enrollment patterns reveal unequal access to tertiary education. CO2 emissions drop in line with EU decarbonization goals, and renewable energy use expands among member states. GDP growth shifted around the 2008 crisis and the COVID-19 pandemic, while the HDI continues to rise.

The methodology adopted in the research aligns with the main aim of investigating the relationship between education, environmental sustainability and economic welfare in EU countries. We selected three advanced econometric modeling techniques, applied to a balanced panel data set comprising EU-27 countries and spanning the years 2002–2023, namely, robust regression (RREG) models QoQRM, founded on SQR designs and Bayesian network analysis based on GGMs. These methods can handle intricate data, such as data on economic and environmental aspects, while also addressing variations in the data, interdependence across countries and time and potential endogeneity.

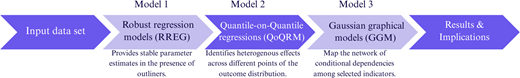
The rationale behind this threefold methodological framework lies in the fact that relying on a single statistical model may yield results that do not fully capture the real impact of these factors on the national well-being of EU economies. In this sense, regulatory changes regarding the financing of educational programs or those aimed at environmental protection may have varying effects on the sustainability of economic welfare, having the potential to either increase it or generate opposite effects. Aiming to fully capture the direct and overall connections between each of our selected variables and to interpret them from different points of view, we proposed the above-stated threefold methodological framework that includes, first, a set of RREG models that provides a standard to evaluate the average effects from our data set, focusing on the influence of education on the environmental performance and economic welfare of EU countries. Second, QoQRM, founded on SQR, allows us to determine how each of these factors contributes to economic and sustainable growth, considering that the effects may differ for small, medium, or large values. Finally, GGMs show the network of connections to assess the impact of the proposed indicators. This framework embeds advanced econometric modeling techniques and illustrates the effects of educational and environmental performance on the economic welfare of EU member states. The diagram illustrating the methodological framework appears in Figure 6.

RREG models were used to obtain consistent estimations in the presence of data heterogeneity and outliers in cross-country comparisons of EU Member States. Models such as Huber and biweight were applied to reduce the effect of anomalous data that could distort OLS results. The Huber method adjusts the loss function according to residual distribution irregularities, while the biweight method limits the influence of extreme deviations, allowing a clearer understanding of how educational investments and environmental outcomes relate to socioeconomic welfare.

The robust regression models are designed as in equations (1) and (2):

(1)

where CO2_E – CO2 emissions; Renew_EC – renewable energy consumption; Water_P – water productivity; Agri_P – agricultural methane emissions; Electric_PC – electric power consumption; PPrimary_SE – preprimary school enrollment; Primary_SE – primary school enrollment; Second_SE – secondary school enrollment; Tert_SE – tertiary school enrollment; Exp_EDU – public spending on education; GDP_gr – GDP growth; HDI – Human Development Index; ε – error term (residual variable):

(2)

where HDI – Human development index; LE – life expectancy in years; GDP_gr – GDP growth; PPrimary_SE – preprimary school enrollment; Primary_SE – primary school enrollment; Second_SE – secondary school enrollment; Tert_SE – tertiary school enrollment; Exp_EDU – public spending on education; CO2_E – CO2 emissions; Renew_EC – renewable energy consumption; Water_P – water productivity; Electric_PC – electric power consumption; ε – error term (residual variable).

Second, to examine whether the relationships vary across levels of the outcome distribution, we apply QoQRM, founded on SQR designs. This method evaluates how conditional quantiles of economic welfare respond to changes in the quantiles of education and environmental indicators, moving beyond the conditional mean. Within this approach, the effect of renewable energy adoption on welfare may appear stronger in higher welfare quantiles, while education spending may influence lower or median levels. This helps identify asymmetric effects and interactions that standard regression models may overlook.

The study then uses GGMs to map connections among selected indicators through conditional associations, revealing links between education, environmental performance and economic welfare. In this approach, a GGM for a random vector X = (X1, …, Xn) is represented by a graph G with n nodes (Crăciun et al., 2023).

Two methods were used for GGM estimation: the Extended Bayesian Information Criterion (EBIC) with the graphical least absolute shrinkage and selection operator (glasso), which constructs sparse networks that retain only the most significant links, and the partial correlation approach (PCOR), which isolates direct conditional relationships by removing spurious correlations (Crăciun et al., 2023). However, GGM has some methodological limitations, particularly regarding its correlational nature and potential endogeneity and detects conditional associations rather than causal effects among the variables involved. Therefore, the complementary use of robust and quantile-based approaches increases the reliability of the results and covers the risks of endogeneity, reverse causality and unobserved cross-country heterogeneity.

Several sets of RREG and QoQRMs, founded on SQR designs, have been processed to capture causal inferences and direct influence of specific variables, complemented by Bayesian network analysis through GGM models designed to encompass direct and indirect connections between all variables used in the empirical analysis. Stata 18 and JASP econometric packages were used for technical processing of all models. Main findings and detailed results are presented in the following sub-sections.

We first designed and estimated five RREG models to capture causal linkages and the direct influence of specific indicators considered in the empirical analysis. The results obtained under the RREG models are centralized in Table 2. To validate the stability of the estimated relationships and mitigate potential biases arising from heteroskedasticity and outliers, RREG techniques were used as part of the robustness check. Unlike conventional OLS estimations, RREG down-weights influential observations and provides consistent parameter estimates even in the presence of non-normal error distributions or data irregularities. This method ensures that the estimated coefficients are not overly influenced by outliers or heterogeneous error variances, which are common in cross-country data sets. The results for alternative dependent variables – CO2 emissions (Model 1), renewable energy consumption (Model 2), water productivity (Model 3), agriculture (Model 4) and electricity per capita (Model 5) – were used to verify the consistency of the estimated effects across different aspects of environmental and development outcomes.

The estimates from Model 1 (Table 2) reveal a strong association between education and carbon dioxide emissions. The signs of the coefficients for the enrollment rates in preschool, primary and tertiary levels (PPrimary_SE, Primary_SE and Tert_SE, respectively) are negative, being also statistically significant (p < 0.01; p < 0.001), indicating that more investments in these areas of education may lead to a reduced carbon footprint and low level of emissions, specifically with a less negative impact on the environment. However, the role of the level of education (early childhood, basic education, higher education) as a direct cause of the level of environmental performance remains uncertain. Perhaps the actual issue is that it may be driven by the fact that countries that have a high level of educated and skill-oriented human capital are considered as predisposed to governments that pay a high level of attention to implementing high-quality environmental policies. Indeed, spending on education (Exp_EDU) and GDP growth (GDP_gr) are also negatively related to carbon emissions (CO2_E) (negative estimated coefficients, statistically significant at the 0.1% threshold). At least, this suggests an “economic maturity” related effect, whereby countries that are more industrialized have the capacity to afford more “green spending.” The HDI has a statistically significant and positive effect on carbon emissions (CO2_E), suggesting that, in some contexts, high levels of human development can continue to go hand-in-hand with energy-intensive production and consumption patterns. This might be explained by transitional phases, wherein structural change has progressed beyond absolute decoupling.

By contrast, Model 2 (Table 2) highlighted a more evident connection to current reality and debates, as higher levels of tertiary education attainment (Tert_SE) lead to increased use of renewable energy sources (Renew_EC) (positive estimated coefficient, statistically significant at 0.1% level). This can be expected by the fact that education, through teaching and offering high-quality specialized skills and expertise, also induces an attuned mindset toward sustainability. But whether education drives the energy transformation itself or merely correlates with it through current trends becomes hard to distinguish. This could be because of the fact that in countries that have set themselves more far-reaching goals for their society, both findings could represent synchronization toward overall development. This is because expenditures on education (Exp_EDU) at an institution level turned out to have a positive impact on the share of clean energy, a fact sustained by the countries oriented toward green transition.

The results obtained in Model 3 (Table 2) suggest that, although both primary education (Primary_SE) and public investment in education (Exp_EDU) are generally understood to have a positive impact on water productivity (Water_P), tertiary educational advancement (Tert_SE) has a negative effect. It may be inferred that there is a link between elementary educational attainment and a rise in the development of human capital, while an expansion of university areas could increase urbanization and may lead to related effects on the environment, especially as regards the efficiency of water resources used in relation to economic output. It can also be observed that Second_SE is negatively affecting water productivity (Water_P), thereby stating that there is a distribution imbalance in these regions. HDI, characterized by good health, education attendance and quality standards of living, positively and significantly increased water productivity.

The results of Model 4 (Table 2) reveal that Second_SE and HDI appear to have a positive impact on reducing methane emissions generated from agricultural activities, considering that educated and healthy people, alongside a good living standard, have a more general awareness of the environmental impact of agricultural activities. Nevertheless, the rate of enrollment in secondary education (Second_SE) brings a new positive dynamic effect, possibly because rural schools are still tied to conventional models in agriculture. However, the positive HDI can be considered as a reminder that, in making progress, there are climate costs associated with this achievement, especially in those countries with a successful agricultural economy. The public spending on education (Exp_EDU) registered a significant negative effect on emissions as regards agricultural activities, suggesting that the development of human capital alongside their activities can generate negative effects on emissions even within the agricultural sector.

For Model 5 (Table 2), access to early childhood enrollment rate, primary and slightly secondary education has a positive impact on electric power consumption (Electric_PC), suggesting that growth in education is linked to more energy use. In this respect, this result is not negative at all but is simply linked to development. The paradox is that access to universities (Tert_SE) has the opposite (negative) effect on electric power consumption (Electric_PC), perhaps because university areas are more energy efficient or adopt sustainable practices. HDI, obviously, is one of the dominant variables. Overall, the obtained results, respectively, the identified relationship among variables, reflect trends that highlight how education interacts in unexpected ways with the economy and the environment. GDP growth (GDP_gr) has a negative coefficient, statistically significant at the 0.1% threshold, implying that rapid development does not always increase energy use proportionally, possibly because of technological progress or a shift toward low-carbon production.

Based on these estimations and to detect the causal relationships between education, environmental performance and welfare, three RREG models were performed, with results presented in Table 3, using the HDI (Model 1), life expectancy at birth (LE) (Model 2) and GDP growth rate (GDP_gr) (Model 3) as dependent variables.

The results of the models indicate that education remains the first element explaining variations in human development and life expectancy. In both estimates, schooling levels and public expenditure on education define the direction and intensity of social progress, confirming the interpretation of Barro and Lee (2013) on the role of education as a determinant of human development. This conclusion derives from the positive values of the coefficients for all forms of educational participation and for the associated public expenditure, which shows that the education system influences the structures that support access and institutional functioning.

In Model 1, the positive coefficients of the preschool (PPrimary_S), secondary (Second_SE) and tertiary (Tert_SE) education levels and educational expenditure (Exp_EDU) levels show that all these components contribute together to the increase in the HDI, however, with a limited magnitude than expected. The results entail that education supports development through human capital and institutions. Early education forms the needed competencies for human capital, which are transformed later into stages where skills take shape. The Exp_EDU variable has positive effects on HDI, as argued in Anand and Sen (2000), as public spending on education translates to capital formation. Electricity availability (Electric_PC) and clean water (Water_P) positively affect HDI, consistent with the results of Anand and Sen (2000), as infrastructure is connected with well-being. The adoption of renewable sources of energy (Renew_EC) is negatively associated with HDI, a sign of transition bottlenecks in infrastructure that is not yet ready to accommodate renewable sources of energy.

Model 2 tests life expectancy developments, and results show that education increases life expectancy. The effects of primary, secondary and tertiary education illustrate that education positively influences life expectancy, supporting Cutler and Lleras-Muney (2006), who explained that education leads to better life expectancy, welfare knowledge and health care, and education also shapes habits and health behavior.

Early learning (PPrimary_SE) involves health and nutrition practices that influence health outcomes directly. Secondary education (Second_SE) brings knowledge of disease prevention and health systems, while higher education offers paths of autonomy and income that extend life. In the same model, Exp_EDU has a negative but insignificant coefficient, showing that spending without institutions does not bring health gains. This suggests that governance and implementation determine the impact of public investment.

Pollution measured by CO2 emissions (CO2_E) is significantly and negatively associated with life expectancy, confirming the detrimental effects of pollution on population health. In Model 3, in contrast to the previous models (Model 1 and Model 2), the explanatory power of the model for economic growth is low (R2 = 0.045), and most of the coefficients are not significant. However, a significant negative coefficient is observed for tertiary school enrollment (Tert_SE) and public spending on education (Exp_EDU). These results are consistent with the existing literature that critiques the automatic link between education and economic growth. Thus, Pritchett (2001) argues that, in the absence of real demand for highly skilled labor or a functioning economic system, education does not yield direct effects on economic growth.

Furthermore, to complement the results obtained by applying RREG models and to enforce the robustness of estimations, we designed QoQRMs, and the results obtained are presented in Tables 4 and 5.

The patterns obtained by applying RREG are further supported by the QoQRM results presented in Tables 4 and 5.

QoQRM estimations in Table 4 indicate that Exp_EDU consistently has adverse and significant effects on agricultural productivity (Agri_P) at higher quantiles, while its influence on access to electricity or renewable energy appears to be mixed. These results align with Pritchett’s (2001) critique, indicating that the economic returns to education are highly contingent on institutional quality, labor market conditions and the effective integration of skilled human capital into the economy.

Tertiary education enrollment (Tert_SE) shows a negative relation with CO2 emissions, meaning that populations with higher education levels produce less environmental impact. It is also found to have a positive connection with renewable energy use, suggesting that education will help promote the shift to green energy. On the other hand, negative coefficients found in areas such as water productivity or agricultural emissions can imply a tendency to overuse resources as more resources are applied to education.

In addition, the results in Table 4 highlight the influence of each education level. Primary and secondary education have mixed effects: they positively contribute to renewable energy consumption and basic infrastructure but have a negative impact on agricultural emissions and water productivity at higher quantiles. This indicates that the impact of education is not uniform, but it depends on the level of economic development and the capacity of each state to capitalize on human capital. In addition, GDP and HDI have positive and significant effects on most indicators; however, GDP has presented a negative relationship with emissions and electricity consumption at higher quantiles, illustrating the development paradox: more dynamic economies do not automatically imply energy efficiency. Thus, the quantile models indicate the need for education policies to be adapted to the specific context, promoting the integration of education with innovation and green infrastructure to maximize environmental benefits and economic sustainability.

The results from Table 5 show that education, measured by the various levels of scholar enrollment, has consistent positive effects on human welfare (HDI) and longevity (LE) across all analyzed quantiles. Thus, participation in primary (Primary_SE), secondary (Second_SE) and tertiary (Tert_SE) education has positive and significant coefficients across the distribution, supporting the hypothesis that investments in human capital bring cumulative benefits for population development and quality of life. The availability of water productivity (Water_P) and electric power consumption (Electricity_PC) improves HDI and life expectancy (LE), making the function and use of these resources beneficial to the well-being of a population. Environmental conditions, such as the use of CO2 (CO2_E) and renewable energies (Renew_EC), on the other hand, impact life expectancy. As related to economic growth (GDP_gr), the findings are mixed. In contrast with the HDI and LE, the educational terms rarely show any positive effects or even a negative relationship in primary (Primary_SE) and tertiary education (Tert_SE). This suggests that more education attendance and economic growth do not necessarily directly or indirectly interact. Our findings are also confirmed by Pritchett (2001), stating that the gains in growth experienced in the educational background primarily depend on the functionality of the systems and the existing markets for labor. The results of QoQRMs show unequal effects: at the lower end, education has no or a negative impact, while in higher quantiles (q90), tertiary education and access to water/electricity can increase growth. This variation confirms that the benefits of education on economic performance are context-dependent and emphasizes the need for policies that more closely link education to market needs and structural innovation.

The quantile-on-quantile regression estimates support the suitability of our modeling strategy by revealing pronounced distributional heterogeneity in environmental and welfare outcomes across EU Member States, indicating that mean-based specifications would conceal relevant cross-country differences. This is in line with EU-focused evidence showing that quantile approaches are well-suited to settings where educational and structural factors interact with energy–environment indicators in non-linear and group-specific ways (Borozan, 2019; Han et al., 2023). Our results are also consistent with recent findings, which reveal that the linkages between CO2 emissions, renewable energy and growth vary systematically across quantiles (Adebayo et al., 2022; Takyi et al., 2024). Overall, the estimates indicate a consistent association between educational expansion and welfare improvements (HDI and life expectancy), whereas growth and environmental effects remain conditional in national contexts.

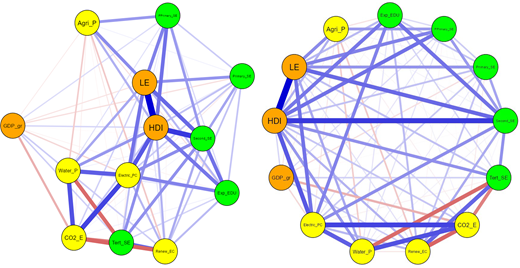
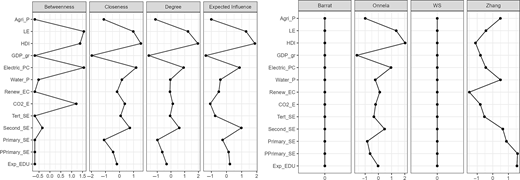
GGMs represented in Figure 7 and detailed in  Appendix 5Table A1,  Appendix 6Table A2 and  Appendix 7Table A3, as well as  Appendix 8Figure A5, are estimated through two different methods, namely, the EBICglasso – extended Bayesian Information Criteria with graphical least absolute shrinkage and selection operator – and PCOR – partial correlations – and are used to identify the interlinkages and dependency relationships between the selected indicators.

Considering network analysis, this technique allows us to perceive how (positive or negative influence) and to what extent the variables impact each other. Furthermore, this method forms a visual representation of these connections, shaping clusters (variables that are represented closer together) and different colors according to the directions of these relationships (blue indicates a positive correlation and red a negative correlation). The model captures strong global interlinkages between the studied variables, according to the width and intensity of the connections. The HDI and LE show a positive relationship in the network analysis. HDI connects with secondary school enrollment (Second_SE), electric power consumption (Electric_PC), preprimary school enrollment (PPrimary_SE) and public spending on education (Exp_EDU). Stoian et al. (2022) state that HDI measures welfare through education, health and living standards. Maharda and Aulia (2020) also argue that government investment in education intensifies HDI growth. The estimated networks are interpreted as conditional dependency structures, allowing us to identify central nodes and clustered pathways linking education, welfare and environmental indicators. Prior EU research studies indicate that education-related variables often occupy structurally important positions in network representations of welfare and labor-market outcomes, supporting the interpretation of centrality patterns in our results (Marcu et al., 2018). Complementary EU evidence shows that education/intellectual capital and development indicators form differentiated clusters across member-state groupings, which is consistent with the heterogeneity observed in our network links (Cristea et al., 2020).

LE presents a positive and strong correlation within the network with secondary school enrollment (Second_SE), electric power consumption (Electric_PC), preprimary school enrollment (PPrimary_SE), agriculture (Agri_P) and water productivity (Water_P). These results are in line with the findings of Mariani et al. (2010) that reveal a positive connection between life expectancy and environmental quality. In addition, Wang et al. (2023b) indicate a positive interlinkage between the use of renewable energy and life expectancy.

Public spending on education (Exp_EDU) is positively associated with most of our considered variables that capture environmental performance, such as CO2 emissions (CO2_E), renewable energy consumption (Renew_EC), water productivity (Water_P) and electric power consumption (Electric_PC). Furthermore, we can identify in our network analysis that education, especially pre-primary (PPrimary_SE), primary (Primary_SE) and secondary school (Secondary_SE), plays a decisive role in shaping positive environmental outcomes, presenting mostly positive connections with indicators that captured the performance of EU countries in terms of environmental effects. Similar results can be found in the literature, with authors Opoku et al. (2022) suggesting that an increase in human development, measured by HDI, education and human capital, contributes to achieving environmental sustainability. In addition, Sun et al. (2019) state that education plays a crucial role in shaping economically sustainable development. Therefore, education seems to promote the sustainability of environmental performance alongside supporting sustainable welfare within an economy.

This study explored the interplay among education, environmental performance and economic well-being in the EU-27 countries, using more refined econometric techniques. The outcome of this research highlights the profound impact of education on human development outcomes and environmental performance. The growth of both education and the economy is dependent on certain structural factors. Investment in education at primary, secondary and tertiary levels, supported by adequate public spending, influences the HDI. Thus, education becomes the basis of human capital and supports social inclusion. However, investments do not bring results if governance is not participatory and education does not respond to labor market demands (Drăcea et al., 2024; Zhao et al., 2023).

The results for EU-27 countries show that the effects of education on development vary between governments. States with strong institutions make better use of human capital, while others struggle to connect education with the economy. These differences reflect the quality of public policies, the degree of digitalization, openness to innovation and the capacity to implement educational and environmental reforms. Education connects institutional and structural elements that shape well-being and sustainability. The relationship between education, welfare and environment forms a cycle: education influences sustainable policies, while the environment affects welfare and productivity. Future studies will explore these relations across time and regions to explain national differences in sustainable development.

Quantile regression results show the need to link education with labor market needs and innovation capacity to preserve competitiveness. Education promotes sustainable economic prosperity through human capital formation and the establishment of sustainable norms. However, as our results show, the enhancement and effect on the environment vary according to national frameworks, thereby warranting the use of diverse policy packages in each EU Member State. In less advanced welfare countries, the key priorities would be to sustain education, invest in basic infrastructure (electricity supply, clean water) and optimize the match between education programs and the demands of the labor market. For advanced-welfare countries, priorities would include advanced skills in “green” areas and innovation-driven higher education, as well as specific incentive tools to encourage firms to expand their “circular economy” or “green entrepreneurship” to minimize their footprints. Our results also provide evidence of a health-environmental channel, as, all other things being equal, exposure to pollutants is negatively correlated with life expectancy, thereby supporting comprehensive policies that can holistically integrate education, environment and welfare. For non-academic stakeholders, our study implies the following. Firstly, with regard to sustainability education in early childhood, it should be acknowledged that this form of education has the potential to foster long-term pro-environmental behaviors and should be furthered through concerted efforts by schools, local authorities and curriculum developers. Secondly, with regard to internal firm-level education programs on ESG-related business practices, these should be targeted at particular groups depending on implementation requirements and organizational priorities, such as management, human resources and training units and the general workforce. For academic/research communities, this study can provide robust interdisciplinary evidence on education, the environment and advanced forms of human welfare, also warranting further academic efforts on mechanisms of interplay between education, environment and human welfare, especially in the context of the whole EU.

The study, while offering important contributions to existing literature, also identifies several scope conditions that can guide future research. First, the use of country-level aggregate data may mask heterogeneity in institutional quality, regional disparities and sectoral labor market structures across the EU-27. Future studies could therefore rely on more granular data to better capture the mechanisms linking education with environmental performance and economic well-being. Second, to strengthen causal inference and account for dynamic adjustment processes, further research may combine quasi-experimental approaches with dynamic panel models to analyze bidirectional feedback effects associated with green transition policies and institutional reforms.

Adebayo
,
T.S.
,
Altuntaş
,
M.
,
Goyibnazarov
,
S.
,
Agyekum
,
E.B.
,
Zawbaa
,
H.M.
and
Kamel
,
S.
(
2022
), “
Dynamic effect of disintegrated energy consumption and economic complexity on environmental degradation in top economic complexity economies
”,
Energy Reports
, Vol.
8
, pp.
12832
-
12842
, doi: .
Alsabhan
,
T.H.
and
Anas
,
M.
(
2025
), “
Environmental sustainability in the Gulf cooperation council (GCC) countries: the role of digitalization and planetary adjusted human development
”,
Sustainable Futures
, Vol.
9
, p.
100630
, doi: .
Anand
,
S.
and
Sen
,
A.
(
2000
), “
The income component of the human development index
”,
Journal of Human Development
, Vol.
1
No.
1
, pp.
83
-
106
, doi: .
Andrade
,
J.A.S.
,
Duarte
,
A.P.S.
and
Simões
,
M.C.N.
(
2018
), “
Education and health: welfare state composition and growth across country groups
”,
Eastern Journal of European Studies
, Vol.
9
No.
2
, pp.
111
-
144
.
Barro
,
R.J.
and
Lee
,
J.W.
(
2013
), “
A new data set of educational attainment in the world, 1950–2010
”,
Journal of Development Economics
, Vol.
104
, pp.
184
-
198
, doi: .
Borozan
,
D.
(
2019
), “
Unveiling the heterogeneous effect of energy taxes and income on residential energy consumption
”,
Energy Policy
, Vol.
129
, pp.
13
-
22
, doi: .
Bozdog
,
L.-Ș.
,
Glovațchi
,
B.
,
Mircea
,
G.
,
Noja
,
G.G.
,
Dorożyński
,
T.
and
Imperia
,
A.
(
2025
), “
From theory to action: what motivates consumers to purchase IoT sustainable products
”,
Journal of Business Economics and Management
, Vol.
26
No.
3
, pp.
889
-
909
, doi: .
Cai
,
G.
,
Deng
,
W.
and
Li
,
X.
(
2023
), “
Student leadership experience and job accessibility: an experiment from China
”,
China Economic Review
, Vol.
78
, p.
101938
, doi: .
Cifuentes-Faura
,
J.
(
2022
), “
European Union policies and their role in combating climate change over the years
”,
Air Quality, Atmosphere and Health
, Vol.
15
No.
8
, pp.
1333
-
1340
, doi: .
Crăciun
,
A.
,
Tăran
,
A.
,
Noja
,
G.G.
,
Pirtea
,
M.
and
Răcătăian
,
R.
(
2023
), “
Advanced modelling of the interplay between public governance and digital transformation: new empirical evidence from structural equation modelling and gaussian and mixed-Markov graphical models
”,
Mathematics
, Vol.
11
No.
5
, p.
1168
, doi: .
Cristea
,
M.
,
Noja
,
G.G.
,
Marcu
,
N.
,
Siminica
,
M.
and
Tîrcă
,
D.-M.
(
2020
), “
Modelling EU bioeconomy credentials in the economic development framework: the role of intellectual capital
”,
Technological and Economic Development of Economy
, Vol.
26
No.
6
, pp.
1139
-
1164
, doi: .
Çütcü
,
Özkök
,
Y.
and
Golpek
,
F.
, İ (
2023
), “
Environment, education, and economy nexus: evidence from selected EU countries
”,
Environmental Science and Pollution Research
, Vol.
30
No.
3
, pp.
7474
-
7497
, doi: .
Cutler
,
D.M.
and
Lleras-Muney
,
A.
(
2006
),
Education and Health: Evaluating Theories and Evidence
,
National Bureau of Economic Research (NBER)
,
Cambridge, MA
, doi: .
Dinca
,
G.
,
Barbuta
,
M.
,
Negri
,
C.
,
Dinca
,
D.
and
Model
,
L.-S.
(
2022
), “
The impact of governance quality and educational level on environmental performance
”,
Frontiers in Environmental Science
, Vol.
10
, p.
950683
, doi: .
Ding
,
S.
and
Zhang
,
H.
(
2023
), “
Forecasting chinese provincial CO2 emissions: a universal and robust new-information-based grey model
”,
Energy Economics
, Vol.
121
, p.
106685
, doi: .
Dou
,
J.
,
Su
,
C.W.
,
Li
,
W.
and
Dou
,
J.
(
2025
), “
Green finance and artificial intelligence: catalysts for promoting sustainability?
”,
Economic Analysis and Policy
, Vol.
88
, pp.
13
-
25
, doi: .
Drăcea
,
R.M.
,
Pirtea
,
M.G.
,
Cristea
,
M.
,
Noja
,
G.G.
and
Ciobanu
,
L.
(
2024
), “
Budget transparency and good governance for human development and citizens’ well-being: new empirical evidence from the European Union
”,
Engineering Economics
, Vol.
35
No.
3
, pp.
328
-
347
, doi: .
Dushkova
,
D.
and
Ivlieva
,
O.
(
2024
), “
Empowering communities to act for a change: a review of the community empowerment programs towards sustainability and resilience
”,
Sustainability
, Vol.
16
No.
19
, p.
8700
, doi: .
European Commission
(
2019
), “
The european green deal, communication from the commission, COM(2019)640 final
”,
Publications Office of the European Union
,
Brussels
,
available at:
Link to The european green deal, communication from the commission, COM(2019)640 finalLink to the cited article. (
accessed
10 January 2026).
European Commission
(
2020
), “
European skills agenda for sustainable competitiveness, social fairness and resilience, communication from the commission, COM(2020)274 final
”,
Publications Office of the European Union
,
Brussels
,
available at:
Link to European skills agenda for sustainable competitiveness, social fairness and resilience, communication from the commission, COM(2020)274 finalLink to the cited article. (
accessed
10 January 2026).
European Commission
(
2022
), “
GreenComp: the european sustainability competence framework
”,
Publications Office of the European Union
,
Luxembourg
,
available at:
Link to GreenComp: the european sustainability competence frameworkLink to the cited article. (
accessed
10 January 2026).
European Commission
(
2025a
), “
Learning for the green transition
”,
available at:
Link to Learning for the green transitionLink to the cited article. (
accessed
10 January 2026).
European Commission
(
2025b
), “
Proposal for a council recommendation on human capital development to enhance EU productivity and competitiveness, with emphasis on strategic sectors including the green transition
”,
available at:
Link to Proposal for a council recommendation on human capital development to enhance EU productivity and competitiveness, with emphasis on strategic sectors including the green transitionLink to the cited article. (
accessed
5 January 2026).
Georgiou
,
Y.
,
Hadjichambis
,
A.C.
and
Hadjichambi
,
D.
(
2021
), “
Teachers’ perceptions on environmental citizenship: a systematic review of the literature
”,
Sustainability
, Vol.
13
No.
5
, p.
2622
, doi: .
Han
,
V.
,
Öcal
,
O.
and
Aslan
,
A.
(
2023
), “
Is energy poverty of Eastern european countries a threat or opportunity in the european union’s fight against climate change?
”,
Environmental Science and Pollution Research
, Vol.
30
No.
51
, pp.
111570
-
111581
, doi: .
Heimlich
,
J.E.
and
Ardoin
,
N.M.
(
2008
), “
Understanding behavior to understand behavior change: a literature review
”,
Environmental Education Research
, Vol.
14
No.
3
, pp.
215
-
237
, doi: .
Hirvilammi
,
T.
and
Koch
,
M.
(
2020
), “
Sustainable welfare beyond growth
”,
Sustainability
, Vol.
12
No.
5
, p.
1824
, doi: .
Istvan
,
A.
,
Mate
,
L.
,
Szabo Istvan
,
A.
and
Toth Orsolya
,
E.
(
2025
), “
Competitiveness of the European Union in the light of human capital what the draghi report leaves out
”,
Public Finance Quarterly-Hungary
, Vol.
71
No.
1
, pp.
9
-
31
, doi: .
Iwińska
,
K.
,
Bieliński
,
J.
,
Calheiros
,
C.S.C.
,
Koutsouris
,
A.
,
Kraszewska
,
M.
and
Mikusiński
,
G.
(
2023
), “
The primary drivers of private-sphere pro-environmental behaviour in five european countries during the covid-19 pandemic
”,
Journal of Cleaner Production
, Vol.
393
, p.
136330
, doi: .
Jacobson
,
S.K.
,
McDuff
,
M.
and
Monroe
,
M.
(
2015
),
Conservation Education and Outreach Techniques
,
Oxford University Press
.
Leal
,
S.
,
Azeiteiro
,
U.M.
and
Aleixo
,
A.M.
(
2024
), “
Sustainable development in portuguese higher education institutions from the faculty perspective
”,
Journal of Cleaner Production
, Vol.
434
, p.
139863
, doi: .
Li
,
Y.
,
Zhao
,
Y.
,
Ye
,
C.
,
Li
,
X.
and
Tao
,
Y.
(
2024
), “
ESG ratings and the cost of equity capital in China
”,
Energy Economics
, Vol.
136
, p.
107685
, doi: .
Li
,
Z.
,
Wang
,
M.
and
Wang
,
Q.
(
2023
), “
Job destruction and creation: labor reallocation entailed by the clean air action in China
”,
China Economic Review
, Vol.
79
, p.
101945
, doi: .
Lobonț
,
O.R.
,
Criste
,
C.
,
Bovary
,
C.
,
Moț
,
A.D.
and
Vătavu
,
S.
(
2024
), “
Goals and pathways of public governance contribution to achieve progress in the quality of life
”,
Sustainability
, Vol.
16
No.
17
, p.
7860
, doi: .
Maharda
,
J.B.
and
Aulia
,
B.Z.
(
2020
), “
Government expenditure and human development in Indonesia
”,
Jambura Equilibrium Journal
, Vol.
2
No.
2
, pp.
81
-
94
, doi: .
Makkonen
,
T.
and
Mitze
,
T.
(
2019
), “
Deconstructing the education-innovation-development nexus in the EU-28 using panel causality and poolability tests
”,
Journal of the Knowledge Economy
, Vol.
10
No.
2
, pp.
516
-
549
, doi: .
Marcu
,
N.
,
Siminica
,
M.
,
Noja
,
G.G.
,
Cristea
,
M.
and
Dobrota
,
C.E.
(
2018
), “
Migrants’ integration on the European labor market: a spatial bootstrap, SEM and network approach
”,
Sustainability
, Vol.
10
No.
12
, p.
4543
, doi: .
Mariani
,
F.
,
Pérez-Barahona
,
A.
and
Raffin
,
N.
(
2010
), “
Life expectancy and the environment
”,
Journal of Economic Dynamics and Control
, Vol.
34
No.
4
, pp.
798
-
815
, doi: .
Moradian Daghigh
,
A.H.
and
Mirzaee Ghazani
,
M.
(
2023
), “
Analyzing the drivers of CO2 allowance prices in EU ETS under the COVID-19 pandemic: considering MEMD approach with a novel filtering procedure
”,
Journal of Cleaner Production
, Vol.
427
, p.
139043
, doi: .
Nademi
,
Y.
and
Sedaghat Kalmarzi
,
H.
(
2025
), “
Breaking the unemployment cycle using the circular economy: sustainable jobs for sustainable futures
”,
Journal of Cleaner Production
, Vol.
488
, p.
144655
, doi: .
Opoku
,
E.E.O.
,
Dogah
,
K.E.
and
Aluko
,
O.A.
(
2022
), “
The contribution of human development towards environmental sustainability
”,
Energy Economics
, Vol.
106
, p.
105782
, doi: .
Panzaru
,
C.
,
Belea
,
S.
and
Jianu
,
L.
(
2025
), “
Delayed taxation and macroeconomic stability: a dynamic IS–LM model with memory effects
”,
Economies
, Vol.
13
No.
7
, p.
208
, doi: .
Pritchett
,
L.
(
2001
), “
Where has all the education gone?
”,
The World Bank Economic Review
, Vol.
15
No.
3
, pp.
367
-
391
, doi: .
Rong
,
Z.
,
Zhang
,
F.
and
Chen
,
S.
(
2023
), “
Short-term loans and firms’ high-quality innovation: Evidence from the access to patent-backed loans in China
”,
China Economic Review
, Vol.
78
, p.
101918
, doi: .
Stoian
,
M.
,
Brad
,
L.
and
Zaharia
,
A.
(
2022
), “
Drivers of the european union’s environmental performance
”,
Frontiers in Environmental Science
, Vol.
10
, p.
954612
, doi: .
Sun
,
H.P.
,
Sun
,
W.F.
,
Geng
,
Y.
,
Yang
,
X.
and
Edziah
,
B.K.
(
2019
), “
How does natural resource dependence affect public education spending?
”,
Environmental Science and Pollution Research
, Vol.
26
No.
4
, pp.
3666
-
3674
, doi: .
Takyi
,
K.N.
,
Gavurova
,
B.
,
Charles
,
O.
,
Mikeska
,
M.
and
Sampene
,
A.K.
(
2024
), “
Assessing the role of circular economy and green innovation in mitigating carbon emissions in the visegrad countries
”,
International Journal of Renewable Energy Development
, Vol.
13
No.
6
, pp.
1149
-
1161
, doi: .
Tao
,
Y.
,
You
,
S.
,
Zhu
,
J.
and
You
,
F.
(
2024
), “
Energy, climate, and environmental sustainability of trend toward occupational-dependent hybrid work: overview, research challenges, and outlook
”,
Journal of Cleaner Production
, Vol.
442
, p.
141083
, doi: .
Wang
,
Q.
,
Wang
,
L.
and
Li
,
R.
(
2023a
), “
Does renewable energy help increase life expectancy? Insight into the linking renewable energy, economic growth, and life expectancy in 121 countries
”,
Energy Strategy Reviews
, Vol.
50
, p.
101185
, doi: .
Wang
,
X.
,
Bian
,
Y.
and
Zhang
,
Q.
(
2023b
), “
The effect of cooking fuel choice on the elderly’s well-being: evidence from two non-parametric methods
”,
Energy Economics
, Vol.
125
, p.
106826
, doi: .
Wang
,
Y.
,
Hang
,
Y.
and
Wang
,
Q.
(
2022
), “
Joint or separate? An economic–environmental comparison of energy-consuming and carbon emissions permits trading in China
”,
Energy Economics
, Vol.
109
, p.
105949
, doi: .
Wu
,
S.
,
Zhou
,
X.
and
Zhu
,
Q.
(
2023
), “
Green credit and enterprise environmental and economic performance: the mediating role of eco-innovation
”,
Journal of Cleaner Production
, Vol.
382
, p.
135248
, doi: .
Xie
,
Q.
,
Ma
,
D.
,
Raza
,
M.Y.
,
Tang
,
S.
and
Bai
,
D.
(
2023
), “
Toward carbon peaking and neutralization: the heterogeneous stochastic convergence of CO2 emissions and the role of digital inclusive finance
”,
Energy Economics
, Vol.
125
, p.
106841
, doi: .
Yang
,
Z.
,
Zhou
,
J.
,
Zhu
,
H.
and
Wang
,
S.
(
2024
), “
Decoupling and decomposition of emissions and economic growth in Guangdong: a perspective of embodied carbon flow
”,
Journal of Cleaner Production
, Vol.
459
, p.
142518
, doi: .
Ye
,
F.
,
Zheng
,
J.
,
Li
,
Y.
,
Li
,
L.
and
Linghu
,
D.
(
2024
), “
Exploring the fusion of greening and digitalization for sustainability
”,
Journal of Cleaner Production
, Vol.
442
, p.
141085
, doi: .
Zhao
,
Q.
,
Ding
,
L.
,
Pirtea
,
M.G.
and
Vǎtavu
,
S.
(
2023
), “
Does technological innovation bring better air quality?
”,
Economic Analysis and Policy
, Vol.
80
, pp.
978
-
990
, doi: .
Published by Emerald Publishing Limited. This article is published under the Creative Commons Attribution (CC BY 4.0) licence. Anyone may reproduce, distribute, translate and create derivative works of this article (for both commercial and non-commercial purposes), subject to full attribution to the original publication and authors. The full terms of this licence maybe seen at Link to the terms of the CC BY 4.0 licenceLink to the terms of the CC BY 4.0 licence.

Data & Figures

Figure 1.
A keyword co-occurrence network showing major research themes and relationships among Health, Environment, Sustainability, Exposure, Education, and Management.The keyword co-occurrence network displays interconnected research themes represented by nodes of varying sizes linked through collaboration and conceptual relationships. Major labels include Health, Environment, Impact, Education, Exposure, Sustainability, Sustainable Development, Management, Framework, Poverty, Conservation, Growth, Model, Association, Gene-expression, Metabolism, Infection, Mental-health, Genome-wide Association, Metaanalysis, Child Development, Climate-change, Biodiversity, and Toxicity. Several thematic clusters are visible, including health and medical research, environmental sustainability and conservation, education and social development, exposure and toxicology, and biological mechanisms. Larger nodes indicate higher prominence within the network, while dense connecting lines illustrate strong relationships among themes across multiple disciplines.

Co-occurrence of keywords specific to the themes “Welfare,” “Education” and “Environment”

Source: Authors’ research in VOSviewer

Close modal
Figure 2.
A country collaboration network showing research connections among Japan, U S A, Peoples R China, England, Germany, Spain, and other nations.The international collaboration network presents countries as interconnected nodes linked by collaborative research relationships. Prominent labels include Japan, U S A, Peoples R China, England, Germany, Spain, Netherlands, Sweden, Finland, France, Italy, Australia, Canada, Denmark, Switzerland, South Korea, India, Brazil, South Africa, Israel, Portugal, Hungary, Poland, Russia, Mexico, Taiwan, Indonesia, Thailand, Pakistan, Bangladesh, Saudi Arabia, and Egypt. Japan, U S A, Peoples R China, and England appear as the largest and most connected nodes, indicating extensive international collaboration. Numerous links connect countries across Europe, Asia, North America, South America, Africa, and Oceania, demonstrating a highly interconnected global research network.

International collaborations in interdisciplinary research on education as a catalyst in promoting sustainability and economic welfare

Source: Authors’ research in VOSviewer

Close modal
Figure 3.
Table Summary:** This table presents a matrix of scatter plots that depict various relationships among multiple indicators. The column headers include “Public spending on education, percent of GDP,” “Preprimary school enrollment, percent of all eligible children,” “Primary school enrollment, percent of all eligible children,” “Secondary school enrollment, percent of all eligible children,” “Tertiary school enrollment, percent of all eligible children,” “CO2 emissions (metric tons per capita),” “Renewable energy consumption (% of total final energy consumption),” “Water productivity, total constant 2015 US dollars per cubic meter of total fresh water,” “Agricultural methane emissions (thousand metric tons of CO2 equivalent),” “Electric power consumption (kWh per capita),” “GDP growth (annual %),” “Human Development Index (zero to one),” and “Life expectancy (in years).” The data flows in a two-dimensional layout, arranged with rows and columns corresponding to the various indicators, allowing for visual comparisons between pairs of these indicators across the scatter plots within the cells. Each cell contains a scatter plot with blue points, facilitating the visual analysis of potential correlations between the respective variables represented in each row and column pairing. **:** Scatter plot matrix showing relationships between various indicators including education spending, CO2 emissions, and life expectancy, with blue data points.This image displays a scatter plot matrix featuring multiple indicators such as public spending on education as a percentage of GDP, various school enrollment rates,

Scatterplot matrix of education, environmental and welfare indicators (EU-27, 2002–2023)

Source: Authors’ research in Stata 18

Close modal
Figure 4.
A set of 4 scatter plots comparing outcome values with carbon dioxide emissions, Human Development Index, life expectancy, and renewable energy consumption.The set of 4 scatter plots examines relationships between an outcome variable and selected socioeconomic and environmental indicators. The upper-left plot compares the outcome variable with carbon dioxide emissions measured in metric tons per capita and shows a negative trend. The upper-right plot compares the outcome variable with the Human Development Index on a scale from 0 to 1 and shows a positive trend. The lower-left plot compares the outcome variable with life expectancy in years and indicates a modest positive relationship. The lower-right plot compares the outcome variable with renewable energy consumption expressed as a percentage of total final energy consumption and also shows a positive relationship. Each plot contains individual data points and a fitted trend line summarising the overall direction of association.

Bivariate relationships between tertiary school enrollment and key sustainability indicators

Source: Authors’ research in Stata 18

Close modal
Figure 5.
A set of 4 scatter plots comparing a second outcome variable with carbon dioxide emissions, Human Development Index, life expectancy, and renewable energy consumption.The set of 4 scatter plots presents relationships between a second outcome variable and selected socioeconomic and environmental indicators. The upper-left plot compares the outcome variable with carbon dioxide emissions measured in metric tons per capita and shows a slight positive trend. The upper-right plot compares the outcome variable with the Human Development Index on a scale from 0 to 1 and demonstrates a strong positive relationship. The lower-left plot compares the outcome variable with life expectancy in years and shows a positive association. The lower-right plot compares the outcome variable with renewable energy consumption expressed as a percentage of total final energy consumption and indicates a moderate positive relationship. Each plot contains numerous data points and a fitted trend line illustrating the overall correlation pattern across the dataset.

Bivariate relationships between secondary school enrollment and key sustainability indicators

Source: Authors’ research in Stata 18

Close modal
Figure 6.
A workflow showing Input Data Set, Model 1, Model 2, Model 3, and Results and Implications.The workflow presents the research framework as a sequence of connected stages. The first stage is labelled Input Data Set. Model 1 is labelled Robust Regression Models, R R E G, with the description Provides stable parameter estimates in the presence of outliers. Model 2 is labelled Quantile-on-Quantile Regressions, Q o Q R M, with the description Identifies heterogeneous effects across different points of the outcome distribution. Model 3 is labelled Gaussian Graphical Models, G G M, with the description Map the network of conditional dependencies among selected indicators. The final stage is labelled Results and Implications, indicating the progression from data input through analytical modelling to interpretation of findings.

Methodological framework

Source: Authors’ own configuration in Canva Create 2025, Visual Suite 2.0

Close modal
Figure 7.
A pair of network maps showing relationships among H D I, L E, G D P growth, education, energy, emissions, water, and agriculture indicators.The pair of network maps compares conditional dependency relationships among socioeconomic, educational, environmental, and economic indicators. Labels include H D I, L E, G D P Growth, Agri P, Water P, Electric P C, C O 2 E, Renew E C, Exp E D U, P Primary S E, Primary S E, Second S E, and Tert S E. Nodes are connected by lines of varying thickness that represent the strength of associations. H D I and L E occupy central positions with strong links to educational and environmental variables. Connections among Electric P C, Water P, C O 2 E, Renew E C, and school enrolment indicators form prominent clusters, highlighting interdependencies between development, education, energy use, emissions, and resource consumption.

Gaussian graphical models estimated through EBICglasso (left) and PCOR (right) designed to assess the interlinkages between education, environmental outcomes and sustainable economic welfare

Source: Authors’ research in JASP

Close modal
Figure A1.
A panel of country trend charts showing preprimary, primary, secondary, and tertiary school enrolment from 2000 to 2023.The panel contains multiple country-specific trend charts labelled A T, B E, B G, C R, C Y, C Z, D E, D K, E E, E S, F I, F R, G R, H U, I E, I T, L T, L U, L V, M T, N L, P L, P T, R O, S E, S I, and S K. The x-axis spans approximately 2000 to 2030, while the y-axis represents enrolment percentages. Four lines are plotted in each country panel and correspond to Preprimary School Enrolment, Percent of All Eligible Children; Primary School Enrolment, Percent of All Eligible Children; Secondary School Enrolment, Percent of All Eligible Children; and Tertiary School Enrolment, Percent of All Eligible Children. The charts enable comparison of enrolment trends over time across countries and educational levels, showing varying patterns of growth, stability, and fluctuation.

Trends in school enrollment by education level across EU countries (preprimary, primary, secondary and tertiary education enrollment)

Source: Authors’ research in Stata 18

Close modal
Figure A2.
A panel of country trend charts showing carbon dioxide emissions per capita from 2000 to 2023.The panel contains country-specific line charts labelled A T, B E, B G, C R, C Y, C Z, D E, D K, E E, E S, F I, F R, G R, H U, I E, I T, L T, L U, L V, M T, N L, P L, P T, R O, S E, S I, and S K. The x-axis spans approximately 2000 to 2030, and the y-axis is labelled Carbon Dioxide Emissions, Metric Tons Per Capita. Each chart displays a single trend line showing changes in carbon dioxide emissions over time. Most countries exhibit declining emissions, with notable decreases in countries such as L U, S E, D K, and G R, while some countries show relatively stable or modestly changing trends. The figure enables comparison of long-term emissions patterns across the selected countries.

Evolution of CO2 emissions per capita across the EU during 2000–2023 (metric tons per capita)

Source: Authors’ research in Stata 18

Close modal
Figure A3.
A panel of country trend charts showing renewable energy consumption as a percentage of total final energy consumption from 2000 to 2023.The panel contains country-specific line charts labelled A T, B E, B G, C R, C Y, C Z, D E, D K, E E, E S, F I, F R, G R, H U, I E, I T, L T, L U, L V, M T, N L, P L, P T, R O, S E, S I, and S K. The x-axis spans approximately 2000 to 2030, and the y-axis is labelled Renewable Energy Consumption, Percent of Total Final Energy Consumption. Each chart shows a single line representing the evolution of renewable energy use over time. Most countries display increasing trends, with particularly strong growth visible in D K, E S, F I, L T, and S E. The figure highlights the expansion of renewable energy adoption across the selected countries during the study period.

Growth in renewable energy consumption across EU countries (% of total final energy consumption)

Source: Authors’ research in Stata 18

Close modal
Figure A4.
A panel of country trend charts comparing gross domestic product growth and human development index values from 2000 to 2023.The panel contains country-specific charts labelled A T, B E, B G, C R, C Y, C Z, D E, D K, E E, E S, F I, F R, G R, H U, I E, I T, L T, L U, L V, M T, N L, P L, P T, R O, S E, S I, and S K. The x-axis spans approximately 2000 to 2030. A blue line represents Gross Domestic Product Growth, Annual Percent, and a red horizontal reference line represents the Human Development Index, 0 to 1. Gross domestic product growth fluctuates around the reference level, with periods of positive and negative growth across countries. Some countries, including E E, I E, and L T, show pronounced variations, while others display comparatively stable growth patterns. The figure facilitates comparison of economic growth dynamics alongside the human development reference measure.

GDP growth and human development index in the EU (annual % change in GDP and HDI)

Source: Authors’ research in Stata 18

Close modal
Figure A5.
A multi-panel line chart comparing Barrat, Onnela, W S, and Zhang centrality measures for development indicators.The multi-panel chart compares four centrality measures labelled Barrat, Onnela, W S, and Zhang across a set of development indicators. The y-axis lists Agri P, L E, H D I, G D P gr, Electric P C, Water P, Renew E C, C O 2 E, Tert S E, Second S E, Primary S E, P Primary S E, and Exp E D U. Each panel displays points connected by lines showing the relative centrality values of the indicators under the corresponding method. The Barrat and W S panels show values concentrated around zero, whereas the Onnela and Zhang panels reveal greater variation among indicators. Higher values are observed for indicators such as H D I, L E, Water P, Primary S E, and Exp E D U under selected measures, indicating stronger network importance relative to other variables.

Centrality plot (left) and clustering plot (right) of the Gaussian graphical models

Source: Authors’ research in JASP

Close modal
Table 1.

Descriptive statistics of the indicators used in the empirical analysis

VariablesNMeanSDMinMaxSkewKurt
Exp_EDU5005.061.102.328.560.683.36
PPrimary_SE46889.6715.1445.87120.61−0.403.03
Primary_SE504101.635.2084.13128.641.309.94
Second_SE505107.6715.9581.66163.931.685.76
Tert_SE48365.9918.6510.33150.880.285.79
CO2_E5137.453.502.9725.612.089.65
Renew_EC51317.6111.790.0958.40.833.09
Water_P513134.22221.155.071,420.314.0520.51
Agri_P5138,203.5910,769.3156.1546,781.401.905.95
Electric_PC3516,508.443,540.812,079.7917,215.031.695.16
GDP_gr5402.273.96−14.8324.37−0.456.69
HDI5320.860.040.720.95−0.372.62
LE54078.523.2470.8783.83−0.602.28
Source(s): Authors’ research in Stata 18
Table 2.

Robust regression results

(1)(2)(3)(4)(5)
VariablesCO2_ERenew_ECWater_PAgri_PElectric_PC
PPrimary_SE−0.0242*** (0.00690)−0.0978** (0.0338)0.0582 (0.152)−30.47** (11.30)21.03*** (3.751)
Primary_SE−0.0509** (0.0159)0.207** (0.0776)0.963** (0.349)−66.85* (25.96)44.73*** (8.619)
Second_SE0.0154 (0.00795)0.0222 (0.0389)−0.603*** (0.175)83.05*** (13.03)10.73* (4.325)
Tert_SE−0.0413*** (0.00498)0.237*** (0.0244)−1.080*** (0.110)5.134 (8.160)−9.399*** (2.709)
Exp_EDU−0.284** (0.0938)0.938* (0.459)8.388*** (2.066)−928.4*** (153.6)94.94 (51.00)
GDP_gr−0.105*** (0.0128)0.141* (0.0626)0.524 (0.282)−6.117 (20.96)−33.30*** (6.957)
HDI24.26*** (2.801)5.009 (13.71)755.3*** (61.70)13,812.7** (4,587.8)15,187.4*** (1,523.1)
_cons−4.115 (2.313)−21.54 (11.32)−584.0*** (50.94)−3,310.2 (3,788.1)−15,084.2*** (1,257.6)
N594594594594594
R20.2600.2150.3620.1440.448
Note(s):

Standard errors in parentheses; *p < 0.05, **p < 0.01, ***p < 0.001

Source(s): Authors’ research in Stata 18
Table 3.

Robust regression results

Model (1)Model (2)Model (3)
VariableHDILEGDP_gr
PPrimary_SE0.000819*** (0.0000803)0.0524*** (0.00737)−0.0189 (0.00972)
Primary_SE0.000128 (0.000197)0.106*** (0.0180)−0.0435 (0.0238)
Second_SE0.000736*** (0.0000926)0.0257** (0.00850)0.00563 (0.0112)
Tert_SE0.000965*** (0.0000740)0.0577*** (0.00679)−0.0176* (0.00895)
Exp_EDU0.00321** (0.00117)−0.123 (0.107)−0.282* (0.141)
CO2_E−0.000608 (0.000606)−0.238*** (0.0556)−0.0268 (0.0733)
Renew_EC−0.000333* (0.000142)−0.0742*** (0.0130)0.0115 (0.0172)
Water_P0.0000709*** (0.00000689)0.00421*** (0.000633)0.000549 (0.000834)
Electric_PC0.00000367*** (0.000000616)0.000401*** (0.0000565)−0.0000849 (0.0000745)
_cons0.596*** (0.0210)57.28*** (1.924)11.24*** (2.537)
N594594594
R20.6390.4240.045
Note(s):

Standard errors in parentheses; *p < 0.05, **p < 0.01, ***p < 0.001

Source(s): Authors’ research in Stata 18
Table 4.

Results of quantile-on-quantile regression models

(1)(2)(3)(4)(5)
VariablesCO2_ERenew_ECWater_PAgri_PElectric_PC
q25
PPrimary_SE−0.0138 (0.0108)0.0441 (0.0428)−0.0923 (0.0624)12.24 (11.43)5.104 (5.698)
Primary_SE−0.0498 (0.0321)−0.110 (0.218)−0.126 (0.162)−4.061 (34.20)46.09*** (8.562)
Second_SE0.0124 (0.0163)−0.0876** (0.0339)−0.255** (0.0772)53.78** (18.56)13.15 (7.996)
Tert_SE−0.0405*** (0.0120)0.164*** (0.0362)−1.043*** (0.199)16.17** (6.115)−20.75*** (5.787)
Exp_EDU−0.164 (0.156)−0.0194 (0.517)5.271** (1.854)−380.7** (115.4)5.220 (77.10)
GDP_gr−0.0794*** (0.0112)0.0627 (0.128)−0.153 (0.325)−25.95 (20.98)−43.00*** (9.737)
HDI18.97*** (4.392)22.54 (17.92)663.3*** (76.33)−4,129.8 (3,911.8)20,336.3*** (2,310.8)
_cons−2.582 (4.408)−3.884 (25.28)−429.9*** (52.47)−218.7 (2,575.3)−18,017.2*** (1,793.9)
q50
PPrimary_SE−0.0323** (0.0123)−0.174*** (0.0488)−0.365 (0.344)19.93 (17.55)11.14* (5.003)
Primary_SE−0.0386* (0.0182)0.105 (0.0835)0.513 (0.407)−42.63 (44.01)33.98** (10.82)
Second_SE0.00722 (0.0160)0.0677 (0.131)−0.527* (0.257)41.38*** (10.92)13.18 (12.16)
Tert_SE−0.0504*** (0.0108)0.248*** (0.0266)−1.942*** (0.555)−9.047 (14.95)−18.98* (8.957)
Exp_EDU−0.272 (0.170)−0.258 (0.553)5.304 (6.014)−1,281.0*** (335.1)111.7 (192.6)
GDP_gr−0.118*** (0.0136)0.146** (0.0498)0.767 (0.720)−37.32 (25.10)−48.31*** (12.99)
HDI30.76*** (3.949)25.74* (10.97)1,098.4*** (197.3)30,935.2*** (7,899.2)22,284.2*** (2,554.2)
_cons−8.736*** (2.583)−22.52 (12.03)−731.8*** (121.9)−17,401.8*** (4,446.3)−18,822.4*** (2,055.2)
q75
PPrimary_SE−0.0385*** (0.00789)−0.268*** (0.0394)−0.754* (0.320)197.9** (76.11)−19.64 (17.67)
Primary_SE−0.112*** (0.0334)0.374*** (0.0973)0.846 (0.724)−92.88 (93.19)32.88 (30.65)
Second_SE0.0220 (0.0133)0.137* (0.0636)−1.869** (0.678)−211.7*** (52.36)12.11 (11.80)
Tert_SE−0.0694*** (0.0126)0.419*** (0.0506)−3.239*** (0.677)−157.3*** (25.26)−31.25* (13.49)
Exp_EDU−0.577* (0.231)−1.306 (0.772)9.553 (7.784)−2,950.6*** (586.2)472.0 (293.8)
GDP_gr−0.129*** (0.0159)0.312* (0.125)2.129* (0.896)−124.3 (79.31)−12.35 (28.82)
HDI33.61*** (4.970)38.48 (21.27)2,188.1*** (263.8)130,850.3*** (15,228.7)33,007.8*** (9,286.4)
_cons−0.163 (4.323)−56.88*** (17.14)−1,399.1*** (162.5)−60,273.4*** (14,634.8)−24,528.6*** (5,719.6)
q90
PPrimary_SE−0.0167 (0.0218)−0.235*** (0.0627)−2.873 (1.589)246.0*** (61.21)−95.01*** (23.51)
Primary_SE−0.233*** (0.0412)0.481*** (0.138)−4.062 (3.055)36.01 (145.8)−131.4** (43.30)
Second_SE−0.0236 (0.0220)0.0562 (0.0887)−6.153*** (1.083)−147.8 (113.0)−8.638 (19.49)
Tert_SE−0.0913*** (0.0180)0.386*** (0.0539)−6.579*** (1.984)−143.4** (48.69)−56.52*** (6.544)
Exp_EDU−0.164 (0.241)0.634 (1.350)1.956 (36.41)−2,111.8 (2,678.6)1,282.8*** (220.6)
GDP_gr−0.0548 (0.0641)0.435** (0.135)2.109 (2.532)−121.9 (150.1)41.13 (46.24)
HDI34.57* (14.45)55.38 (29.66)5,070.3*** (1,410.7)126,983.5*** (13,224.3)57,328.9*** (5,623.3)
_cons15.70 (12.94)−78.59** (24.65)−2,297.7*** (585.4)−79,343.5** (24,114.0)−19,384.6** (7,321.1)
N594594594594594
Note(s):

Standard errors in parentheses; *p < 0.05, **p < 0.01, ***p < 0.001

Source(s): Authors’ research in Stata 18
Table 5.

Results of quantile-on-quantile regression models

(1)(2)(3)
VariablesHDILEGDP_gr
q25
PPrimary_SE0.000798*** (0.000178)0.0647** (0.0225)0.00248 (0.0232)
Primary_SE−0.000253 (0.000213)0.105*** (0.0291)−0.0677 (0.0591)
Second_SE0.000571*** (0.000153)0.0425* (0.0174)0.0243 (0.0161)
Tert_SE0.000836*** (0.000124)0.0609** (0.0188)−0.0173 (0.0119)
Exp_EDU0.00549** (0.00173)−0.438* (0.182)−0.334* (0.154)
CO2_E−0.000206 (0.000664)−0.219** (0.0794)−0.0300 (0.113)
Renew_EC0.0000560 (0.000268)−0.0812*** (0.0182)0.0335 (0.0241)
Water_P0.0000654*** (0.00000732)0.00426*** (0.000725)0.00126 (0.00127)
Electric_PC0.00000390*** (0.000000886)0.000597*** (0.0000469)−0.000147 (0.0000824)
_cons0.619*** (0.0309)52.41*** (2.686)8.252 (6.029)
q50
PPrimary_SE0.000810*** (0.0000974)0.0540*** (0.0113)−0.00797 (0.00966)
Primary_SE0.0000304 (0.000113)0.106*** (0.00728)−0.0902* (0.0375)
Second_SE0.000561** (0.000208)0.0241* (0.00954)0.00521 (0.0115)
Tert_SE0.00105*** (0.000104)0.0599*** (0.00808)−0.0195 (0.0119)
Exp_EDU0.00458*** (0.00118)−0.164 (0.105)−0.316 (0.179)
CO2_E−0.000484 (0.000498)−0.239*** (0.0502)−0.123 (0.114)
Renew_EC−0.0000866 (0.000178)−0.0711*** (0.0138)0.0212 (0.0237)
Water_P0.0000705*** (0.00000866)0.00424*** (0.000539)0.00107 (0.00108)
Electric_PC0.00000304*** (0.000000423)0.000350*** (0.0000489)−0.0000238 (0.0000662)
_cons0.613*** (0.0110)57.85*** (1.724)15.70*** (4.083)
q75
PPrimary_SE0.000909*** (0.000128)0.0477*** (0.00392)0.0224 (0.0257)
Primary_SE0.000566*** (0.000134)0.125*** (0.0153)−0.140 (0.0788)
Second_SE0.000749*** (0.000141)0.0109** (0.00347)−0.0292 (0.0299)
Tert_SE0.00116*** (0.000176)0.0482*** (0.00428)0.0485 (0.0327)
Exp_EDU0.00277 (0.00146)−0.139 (0.0826)−0.384 (0.467)
CO2_E−0.00171* (0.000833)−0.212*** (0.0502)−0.304 (0.171)
Renew_EC−0.000935*** (0.000264)−0.0478*** (0.0102)0.0257 (0.0515)
Water_P0.0000734*** (0.0000107)0.00359*** (0.000299)0.00881*** (0.00245)
Electric_PC0.00000353*** (0.00000606)0.000227*** (0.0000345)−0.000161 (0.000156)
_cons0.570*** (0.0145)60.17*** (1.396)21.65** (8.237)
q90
PPrimary_SE0.00141*** (0.000227)0.0533*** (0.00751)0.0850* (0.0422)
Primary_SE0.000643* (0.000319)0.115** (0.0352)−0.226* (0.0977)
Second_SE0.000690*** (0.000156)0.0132** (0.00415)−0.0876 (0.0554)
Tert_SE0.000846*** (0.000192)0.0346*** (0.00549)0.179*** (0.0535)
Exp_EDU−0.00137 (0.00260)−0.109 (0.107)−0.217 (0.850)
CO2_E0.00198 (0.00166)−0.220** (0.0754)−0.561 (0.360)
Renew_EC−0.000693 (0.000359)−0.0450*** (0.0128)0.0342 (0.110)
Water_P0.0000602** (0.0000193)0.00306*** (0.000906)0.0209*** (0.00552)
Electric_PC0.00000289* (0.00000124)0.000167** (0.0000629)−0.000401 (0.000421)
_cons0.559*** (0.0288)62.34*** (3.747)28.34** (9.351)
N594594594
Note(s):

Standard errors in parentheses; *p < 0.05, **p < 0.01, ***p < 0.001

Source(s): Authors’ research in Stata 18
Table A1.

Pearson/Spearman correlation matrix

VariablesExp EDUPPrimary SEPrimary SESecond SETert SECO2 ERenew ECWater PAgri PElectric PCGDP grHDILE
Exp EDU1.0000.1280.0750.3890.2350.0830.0890.304−0.1170.375−0.1500.3900.209
0.0000.0020.0670.0000.0000.0440.0300.0000.0040.0000.0000.0000.000
PPrimary SE0.1091.0000.2610.2490.0340.028−0.0680.3330.2580.355−0.0050.4430.424
0.0080.0000.0000.0000.4080.4940.0960.0000.0000.0000.9000.0000.000
Primary SE0.1680.1471.0000.289−0.064−0.067−0.0120.1350.1810.154−0.0680.2040.321
0.0000.0000.0000.0000.1210.1040.7640.0010.0000.0000.0970.0000.000
Second SE0.4160.2930.2641.0000.4790.0680.2070.1820.2560.371−0.0890.6110.467
0.0000.0000.0000.0000.0000.0970.0000.0000.0000.0000.0310.0000.000
Tert SE0.1230.0300.0010.3221.000−0.1710.521−0.1050.1020.1240.0250.4340.273
0.0030.4620.9720.0000.0000.0000.0110.0130.0030.5500.0000.000
CO2 E0.043−0.014−0.0610.031−0.3711.000−0.5500.1170.0970.589−0.2260.2100.074
0.3000.7320.1390.4500.0000.0000.0040.0180.0000.0000.0000.071
Renew EC0.200−0.0300.1730.2440.452−0.4561.000−0.024−0.042−0.0530.0470.1480.070
0.0000.4690.0000.0000.0000.0000.0000.5550.3020.2000.2550.0000.091
Water P0.0810.0830.0620.042−0.4360.513−0.0731.000−0.1170.3310.0050.5410.367
0.0490.0420.1330.3060.0000.0000.0750.0000.0040.0000.9080.0000.000
Agri P−0.0870.2990.0410.039−0.028−0.048−0.158−0.1471.0000.111−0.1740.2580.295
0.0340.0000.3180.3430.5040.2480.0000.0000.0070.0000.0000.000
Electric PC0.3680.0760.1540.336−0.0460.5540.2110.473−0.0711.000−0.2030.6390.480
0.0000.0650.0000.0000.2620.0000.0000.0000.0850.0000.0000.000
GDP gr−0.0360.100−0.096−0.0140.138−0.2320.145−0.002−0.054−0.1141.000−0.056−0.181
0.3810.0150.0200.7380.0010.0000.0000.9670.1910.0050.1750.000
HDI0.4010.4160.1810.5860.3250.1690.2210.3050.2280.4890.1181.0000.745
0.0000.0000.0000.0000.0000.0000.0000.0000.0000.0000.0040.0000.000
LE0.2050.3690.3140.4440.1860.1340.0850.2540.3400.410−0.0790.7551.000
0.0000.0000.0000.0000.0000.0010.0380.0000.0000.0000.0550.0000.000
Source(s): Authors’ research in Stata 18
Table A2.

Summary of the network

Number of nodesNumber of non-zero edgesSparsity
1378/780.000
Centrality measures per variable
Network
VariableBetweennessClosenessStrengthExpected influence
Exp_EDU−0.693−0.191−0.3190.221
PPrimary_SE−0.693−0.460−0.6340.137
Primary_SE−0.693−1.100−0.987−0.259
Second_SE−0.3460.7300.6070.980
Tert_SE−0.6930.077−0.062−0.748
CO2_E1.2120.3720.133−1.073
Renew_EC−0.693−0.177−0.073−0.510
Water_P−0.5200.167−0.047−0.404
Electric_PC1.5591.1800.9220.858
GDP_gr−0.693−1.975−1.613−1.363
HDI1.3861.5181.9621.872
LE1.5590.9791.2421.291
Agri_P−0.693−1.120−1.132−1.003
Source(s): Authors’ research in JASP
Table A3.

Weights matrix

Network
VariableExp_EDUPPrimary_SEPrimary_SESecond_SETert_SECO2_ERenew_ECWater_PElectric_PCGDP_grHDILEAgri_P
Exp_EDU0.0000.1090.1680.4160.1230.0430.2000.0810.368−0.0360.4010.205−0.087
PPrimary_SE0.1090.0000.1470.2930.030−0.014−0.0300.0830.0760.1000.4160.3690.299
Primary_SE0.1680.1470.0000.2640.001−0.0610.1730.0620.154−0.0960.1810.3140.041
Second_SE0.4160.2930.2640.0000.3220.0310.2440.0420.336−0.0140.5860.4440.039
Tert_SE0.1230.0300.0010.3220.000−0.3710.452−0.436−0.0460.1380.3240.186−0.027
CO2_E0.043−0.014−0.0610.031−0.3710.000−0.4550.5130.554−0.2320.1690.134−0.047
Renew_EC0.200−0.0300.1730.2440.452−0.4550.000−0.0730.2110.1450.2210.085−0.158
Water_P0.0810.0830.0620.042−0.4360.513−0.0730.0000.473−0.0020.3050.254−0.147
Electric_PC0.3680.0760.1540.336−0.0460.5540.2110.4730.000−0.1140.4890.411−0.071
GDP_gr−0.0360.100−0.096−0.0140.138−0.2320.145−0.002−0.1140.0000.119−0.079−0.054
HDI0.4010.4160.1810.5860.3240.1690.2210.3050.4890.1190.0000.7550.228
LE0.2050.3690.3140.4440.1860.1340.0850.2540.411−0.0790.7550.0000.340
Agri_P−0.0870.2990.0410.039−0.027−0.047−0.158−0.147−0.071−0.0540.2280.3400.000
Source(s): Authors’ research in JASP

Supplements

References

Adebayo
,
T.S.
,
Altuntaş
,
M.
,
Goyibnazarov
,
S.
,
Agyekum
,
E.B.
,
Zawbaa
,
H.M.
and
Kamel
,
S.
(
2022
), “
Dynamic effect of disintegrated energy consumption and economic complexity on environmental degradation in top economic complexity economies
”,
Energy Reports
, Vol.
8
, pp.
12832
-
12842
, doi: .
Alsabhan
,
T.H.
and
Anas
,
M.
(
2025
), “
Environmental sustainability in the Gulf cooperation council (GCC) countries: the role of digitalization and planetary adjusted human development
”,
Sustainable Futures
, Vol.
9
, p.
100630
, doi: .
Anand
,
S.
and
Sen
,
A.
(
2000
), “
The income component of the human development index
”,
Journal of Human Development
, Vol.
1
No.
1
, pp.
83
-
106
, doi: .
Andrade
,
J.A.S.
,
Duarte
,
A.P.S.
and
Simões
,
M.C.N.
(
2018
), “
Education and health: welfare state composition and growth across country groups
”,
Eastern Journal of European Studies
, Vol.
9
No.
2
, pp.
111
-
144
.
Barro
,
R.J.
and
Lee
,
J.W.
(
2013
), “
A new data set of educational attainment in the world, 1950–2010
”,
Journal of Development Economics
, Vol.
104
, pp.
184
-
198
, doi: .
Borozan
,
D.
(
2019
), “
Unveiling the heterogeneous effect of energy taxes and income on residential energy consumption
”,
Energy Policy
, Vol.
129
, pp.
13
-
22
, doi: .
Bozdog
,
L.-Ș.
,
Glovațchi
,
B.
,
Mircea
,
G.
,
Noja
,
G.G.
,
Dorożyński
,
T.
and
Imperia
,
A.
(
2025
), “
From theory to action: what motivates consumers to purchase IoT sustainable products
”,
Journal of Business Economics and Management
, Vol.
26
No.
3
, pp.
889
-
909
, doi: .
Cai
,
G.
,
Deng
,
W.
and
Li
,
X.
(
2023
), “
Student leadership experience and job accessibility: an experiment from China
”,
China Economic Review
, Vol.
78
, p.
101938
, doi: .
Cifuentes-Faura
,
J.
(
2022
), “
European Union policies and their role in combating climate change over the years
”,
Air Quality, Atmosphere and Health
, Vol.
15
No.
8
, pp.
1333
-
1340
, doi: .
Crăciun
,
A.
,
Tăran
,
A.
,
Noja
,
G.G.
,
Pirtea
,
M.
and
Răcătăian
,
R.
(
2023
), “
Advanced modelling of the interplay between public governance and digital transformation: new empirical evidence from structural equation modelling and gaussian and mixed-Markov graphical models
”,
Mathematics
, Vol.
11
No.
5
, p.
1168
, doi: .
Cristea
,
M.
,
Noja
,
G.G.
,
Marcu
,
N.
,
Siminica
,
M.
and
Tîrcă
,
D.-M.
(
2020
), “
Modelling EU bioeconomy credentials in the economic development framework: the role of intellectual capital
”,
Technological and Economic Development of Economy
, Vol.
26
No.
6
, pp.
1139
-
1164
, doi: .
Çütcü
,
Özkök
,
Y.
and
Golpek
,
F.
, İ (
2023
), “
Environment, education, and economy nexus: evidence from selected EU countries
”,
Environmental Science and Pollution Research
, Vol.
30
No.
3
, pp.
7474
-
7497
, doi: .
Cutler
,
D.M.
and
Lleras-Muney
,
A.
(
2006
),
Education and Health: Evaluating Theories and Evidence
,
National Bureau of Economic Research (NBER)
,
Cambridge, MA
, doi: .
Dinca
,
G.
,
Barbuta
,
M.
,
Negri
,
C.
,
Dinca
,
D.
and
Model
,
L.-S.
(
2022
), “
The impact of governance quality and educational level on environmental performance
”,
Frontiers in Environmental Science
, Vol.
10
, p.
950683
, doi: .
Ding
,
S.
and
Zhang
,
H.
(
2023
), “
Forecasting chinese provincial CO2 emissions: a universal and robust new-information-based grey model
”,
Energy Economics
, Vol.
121
, p.
106685
, doi: .
Dou
,
J.
,
Su
,
C.W.
,
Li
,
W.
and
Dou
,
J.
(
2025
), “
Green finance and artificial intelligence: catalysts for promoting sustainability?
”,
Economic Analysis and Policy
, Vol.
88
, pp.
13
-
25
, doi: .
Drăcea
,
R.M.
,
Pirtea
,
M.G.
,
Cristea
,
M.
,
Noja
,
G.G.
and
Ciobanu
,
L.
(
2024
), “
Budget transparency and good governance for human development and citizens’ well-being: new empirical evidence from the European Union
”,
Engineering Economics
, Vol.
35
No.
3
, pp.
328
-
347
, doi: .
Dushkova
,
D.
and
Ivlieva
,
O.
(
2024
), “
Empowering communities to act for a change: a review of the community empowerment programs towards sustainability and resilience
”,
Sustainability
, Vol.
16
No.
19
, p.
8700
, doi: .
European Commission
(
2019
), “
The european green deal, communication from the commission, COM(2019)640 final
”,
Publications Office of the European Union
,
Brussels
,
available at:
Link to The european green deal, communication from the commission, COM(2019)640 finalLink to the cited article. (
accessed
10 January 2026).
European Commission
(
2020
), “
European skills agenda for sustainable competitiveness, social fairness and resilience, communication from the commission, COM(2020)274 final
”,
Publications Office of the European Union
,
Brussels
,
available at:
Link to European skills agenda for sustainable competitiveness, social fairness and resilience, communication from the commission, COM(2020)274 finalLink to the cited article. (
accessed
10 January 2026).
European Commission
(
2022
), “
GreenComp: the european sustainability competence framework
”,
Publications Office of the European Union
,
Luxembourg
,
available at:
Link to GreenComp: the european sustainability competence frameworkLink to the cited article. (
accessed
10 January 2026).
European Commission
(
2025a
), “
Learning for the green transition
”,
available at:
Link to Learning for the green transitionLink to the cited article. (
accessed
10 January 2026).
European Commission
(
2025b
), “
Proposal for a council recommendation on human capital development to enhance EU productivity and competitiveness, with emphasis on strategic sectors including the green transition
”,
available at:
Link to Proposal for a council recommendation on human capital development to enhance EU productivity and competitiveness, with emphasis on strategic sectors including the green transitionLink to the cited article. (
accessed
5 January 2026).
Georgiou
,
Y.
,
Hadjichambis
,
A.C.
and
Hadjichambi
,
D.
(
2021
), “
Teachers’ perceptions on environmental citizenship: a systematic review of the literature
”,
Sustainability
, Vol.
13
No.
5
, p.
2622
, doi: .
Han
,
V.
,
Öcal
,
O.
and
Aslan
,
A.
(
2023
), “
Is energy poverty of Eastern european countries a threat or opportunity in the european union’s fight against climate change?
”,
Environmental Science and Pollution Research
, Vol.
30
No.
51
, pp.
111570
-
111581
, doi: .
Heimlich
,
J.E.
and
Ardoin
,
N.M.
(
2008
), “
Understanding behavior to understand behavior change: a literature review
”,
Environmental Education Research
, Vol.
14
No.
3
, pp.
215
-
237
, doi: .
Hirvilammi
,
T.
and
Koch
,
M.
(
2020
), “
Sustainable welfare beyond growth
”,
Sustainability
, Vol.
12
No.
5
, p.
1824
, doi: .
Istvan
,
A.
,
Mate
,
L.
,
Szabo Istvan
,
A.
and
Toth Orsolya
,
E.
(
2025
), “
Competitiveness of the European Union in the light of human capital what the draghi report leaves out
”,
Public Finance Quarterly-Hungary
, Vol.
71
No.
1
, pp.
9
-
31
, doi: .
Iwińska
,
K.
,
Bieliński
,
J.
,
Calheiros
,
C.S.C.
,
Koutsouris
,
A.
,
Kraszewska
,
M.
and
Mikusiński
,
G.
(
2023
), “
The primary drivers of private-sphere pro-environmental behaviour in five european countries during the covid-19 pandemic
”,
Journal of Cleaner Production
, Vol.
393
, p.
136330
, doi: .
Jacobson
,
S.K.
,
McDuff
,
M.
and
Monroe
,
M.
(
2015
),
Conservation Education and Outreach Techniques
,
Oxford University Press
.
Leal
,
S.
,
Azeiteiro
,
U.M.
and
Aleixo
,
A.M.
(
2024
), “
Sustainable development in portuguese higher education institutions from the faculty perspective
”,
Journal of Cleaner Production
, Vol.
434
, p.
139863
, doi: .
Li
,
Y.
,
Zhao
,
Y.
,
Ye
,
C.
,
Li
,
X.
and
Tao
,
Y.
(
2024
), “
ESG ratings and the cost of equity capital in China
”,
Energy Economics
, Vol.
136
, p.
107685
, doi: .
Li
,
Z.
,
Wang
,
M.
and
Wang
,
Q.
(
2023
), “
Job destruction and creation: labor reallocation entailed by the clean air action in China
”,
China Economic Review
, Vol.
79
, p.
101945
, doi: .
Lobonț
,
O.R.
,
Criste
,
C.
,
Bovary
,
C.
,
Moț
,
A.D.
and
Vătavu
,
S.
(
2024
), “
Goals and pathways of public governance contribution to achieve progress in the quality of life
”,
Sustainability
, Vol.
16
No.
17
, p.
7860
, doi: .
Maharda
,
J.B.
and
Aulia
,
B.Z.
(
2020
), “
Government expenditure and human development in Indonesia
”,
Jambura Equilibrium Journal
, Vol.
2
No.
2
, pp.
81
-
94
, doi: .
Makkonen
,
T.
and
Mitze
,
T.
(
2019
), “
Deconstructing the education-innovation-development nexus in the EU-28 using panel causality and poolability tests
”,
Journal of the Knowledge Economy
, Vol.
10
No.
2
, pp.
516
-
549
, doi: .
Marcu
,
N.
,
Siminica
,
M.
,
Noja
,
G.G.
,
Cristea
,
M.
and
Dobrota
,
C.E.
(
2018
), “
Migrants’ integration on the European labor market: a spatial bootstrap, SEM and network approach
”,
Sustainability
, Vol.
10
No.
12
, p.
4543
, doi: .
Mariani
,
F.
,
Pérez-Barahona
,
A.
and
Raffin
,
N.
(
2010
), “
Life expectancy and the environment
”,
Journal of Economic Dynamics and Control
, Vol.
34
No.
4
, pp.
798
-
815
, doi: .
Moradian Daghigh
,
A.H.
and
Mirzaee Ghazani
,
M.
(
2023
), “
Analyzing the drivers of CO2 allowance prices in EU ETS under the COVID-19 pandemic: considering MEMD approach with a novel filtering procedure
”,
Journal of Cleaner Production
, Vol.
427
, p.
139043
, doi: .
Nademi
,
Y.
and
Sedaghat Kalmarzi
,
H.
(
2025
), “
Breaking the unemployment cycle using the circular economy: sustainable jobs for sustainable futures
”,
Journal of Cleaner Production
, Vol.
488
, p.
144655
, doi: .
Opoku
,
E.E.O.
,
Dogah
,
K.E.
and
Aluko
,
O.A.
(
2022
), “
The contribution of human development towards environmental sustainability
”,
Energy Economics
, Vol.
106
, p.
105782
, doi: .
Panzaru
,
C.
,
Belea
,
S.
and
Jianu
,
L.
(
2025
), “
Delayed taxation and macroeconomic stability: a dynamic IS–LM model with memory effects
”,
Economies
, Vol.
13
No.
7
, p.
208
, doi: .
Pritchett
,
L.
(
2001
), “
Where has all the education gone?
”,
The World Bank Economic Review
, Vol.
15
No.
3
, pp.
367
-
391
, doi: .
Rong
,
Z.
,
Zhang
,
F.
and
Chen
,
S.
(
2023
), “
Short-term loans and firms’ high-quality innovation: Evidence from the access to patent-backed loans in China
”,
China Economic Review
, Vol.
78
, p.
101918
, doi: .
Stoian
,
M.
,
Brad
,
L.
and
Zaharia
,
A.
(
2022
), “
Drivers of the european union’s environmental performance
”,
Frontiers in Environmental Science
, Vol.
10
, p.
954612
, doi: .
Sun
,
H.P.
,
Sun
,
W.F.
,
Geng
,
Y.
,
Yang
,
X.
and
Edziah
,
B.K.
(
2019
), “
How does natural resource dependence affect public education spending?
”,
Environmental Science and Pollution Research
, Vol.
26
No.
4
, pp.
3666
-
3674
, doi: .
Takyi
,
K.N.
,
Gavurova
,
B.
,
Charles
,
O.
,
Mikeska
,
M.
and
Sampene
,
A.K.
(
2024
), “
Assessing the role of circular economy and green innovation in mitigating carbon emissions in the visegrad countries
”,
International Journal of Renewable Energy Development
, Vol.
13
No.
6
, pp.
1149
-
1161
, doi: .
Tao
,
Y.
,
You
,
S.
,
Zhu
,
J.
and
You
,
F.
(
2024
), “
Energy, climate, and environmental sustainability of trend toward occupational-dependent hybrid work: overview, research challenges, and outlook
”,
Journal of Cleaner Production
, Vol.
442
, p.
141083
, doi: .
Wang
,
Q.
,
Wang
,
L.
and
Li
,
R.
(
2023a
), “
Does renewable energy help increase life expectancy? Insight into the linking renewable energy, economic growth, and life expectancy in 121 countries
”,
Energy Strategy Reviews
, Vol.
50
, p.
101185
, doi: .
Wang
,
X.
,
Bian
,
Y.
and
Zhang
,
Q.
(
2023b
), “
The effect of cooking fuel choice on the elderly’s well-being: evidence from two non-parametric methods
”,
Energy Economics
, Vol.
125
, p.
106826
, doi: .
Wang
,
Y.
,
Hang
,
Y.
and
Wang
,
Q.
(
2022
), “
Joint or separate? An economic–environmental comparison of energy-consuming and carbon emissions permits trading in China
”,
Energy Economics
, Vol.
109
, p.
105949
, doi: .
Wu
,
S.
,
Zhou
,
X.
and
Zhu
,
Q.
(
2023
), “
Green credit and enterprise environmental and economic performance: the mediating role of eco-innovation
”,
Journal of Cleaner Production
, Vol.
382
, p.
135248
, doi: .
Xie
,
Q.
,
Ma
,
D.
,
Raza
,
M.Y.
,
Tang
,
S.
and
Bai
,
D.
(
2023
), “
Toward carbon peaking and neutralization: the heterogeneous stochastic convergence of CO2 emissions and the role of digital inclusive finance
”,
Energy Economics
, Vol.
125
, p.
106841
, doi: .
Yang
,
Z.
,
Zhou
,
J.
,
Zhu
,
H.
and
Wang
,
S.
(
2024
), “
Decoupling and decomposition of emissions and economic growth in Guangdong: a perspective of embodied carbon flow
”,
Journal of Cleaner Production
, Vol.
459
, p.
142518
, doi: .
Ye
,
F.
,
Zheng
,
J.
,
Li
,
Y.
,
Li
,
L.
and
Linghu
,
D.
(
2024
), “
Exploring the fusion of greening and digitalization for sustainability
”,
Journal of Cleaner Production
, Vol.
442
, p.
141085
, doi: .
Zhao
,
Q.
,
Ding
,
L.
,
Pirtea
,
M.G.
and
Vǎtavu
,
S.
(
2023
), “
Does technological innovation bring better air quality?
”,
Economic Analysis and Policy
, Vol.
80
, pp.
978
-
990
, doi: .

Languages

or Create an Account

Close Modal
Close Modal