


This study aims to examine how the relationship between remote work intensity and heavy work investment varies across employee profiles defined by job crafting behaviors and work-related basic need satisfaction. By integrating self-determination theory and job crafting, we provide a nuanced understanding of how remote work shapes both work engagement and workaholism.
Using latent profile analysis on a sample of 727 employees, we identified distinct fulfillment-crafting profiles based on job crafting strategies and psychological need satisfaction. We then analyzed how remote work intensity relates to work engagement and workaholism across these profiles.
Three profiles emerged: satisfied proactive, challenged optimizers and dissatisfied reactive. The relationship between remote work intensity and heavy work investment varied across these profiles. For satisfied proactive employees, higher remote work intensity was linked to lower work engagement, suggesting that these employees may rely on in-person work environments for motivation. Challenged optimizers showed a more complex pattern: cognitive workaholism initially declined with increasing remote work intensity but then increased once it exceeded a certain threshold, while behavioral workaholism was linearly negatively associated with remote work intensity. Dissatisfied reactive employees exhibited a curvilinear relationship between remote work intensity and cognitive workaholism, initially increasing with remote work intensity before declining, whereas behavioral workaholism steadily increased with higher remote work intensity, indicating potential maladaptive coping mechanisms.
This study extends remote work and job crafting research by highlighting how individual differences in proactive job redesign and need satisfaction shape remote work experiences. Our findings underscore the need for tailored organizational strategies that enhance need satisfaction and promote job crafting behaviors to mitigate risks associated with heavy work investment in remote settings.
1. Introduction
Despite the belief that employees have fully returned to offices, hybrid and remote work arrangements continue to expand across industries (Wells, 2024). The pandemic accelerated the shift toward remote work, normalizing flexible work models across roles and industries, and this trend has not reversed, indicating that remote and hybrid work are not temporary phenomena but rather enduring aspects of modern work (Aleem et al., 2023; Haan and Main, 2024; Sherif, 2024). However, despite their growing adoption, many hybrid and remote work policies are not grounded in scientific evidence, raising concerns that organizations may be implementing suboptimal strategies (Yang et al., 2022). Even before the pandemic, research on the role of remote work on employees’ quality of work life was inconclusive, with mixed effects on well-being and engagement (Boell et al., 2016; Tavares, 2017; Vignoli et al., 2024). Thus, while remote work is here to stay, its relationship with key indicators of work-related well-being remains unclear.
A critical yet underexplored aspect of remote work is its relationship with different forms of heavy work investment, specifically work engagement and workaholism. These constructs represent contrasting patterns of motivation and energy investment, each with distinct implications for both employee well-being and organizational performance. Work engagement, characterized by vigor, dedication, and absorption, represents a positive, fulfilling state that is typically associated with improved performance and well-being (Schaufeli et al., 2006). In contrast, workaholism, defined as a compulsive drive to work excessively, is linked to burnout and deteriorating health (Taris and de Jonge, 2024). While both involve substantial work investment, their effects on well-being diverge significantly. Although research has explored the link between remote work and engagement (e.g. Adisa et al., 2023; Mäkikangas et al., 2022), workaholism remains a critical but often overlooked counterpart (Schaufeli, 2016; Taris et al., 2015). This omission is significant, as workaholism can undermine long-term performance and employee health (Reizer and Siegrist, 2022; Spagnoli et al., 2020; Taris and de Jonge, 2024). Furthermore, existing studies rarely examine engagement and workaholism together, making it unclear whether remote work fosters sustainable motivation or leads to harmful overcommitment (Gillet et al., 2023; McIlveene et al., 2024). Addressing this gap is crucial for organizations aiming to optimize remote and hybrid work policies that balance productivity and well-being, as motivation and energy investment are key drivers of work performance (Bakker and Demerouti, 2007; Taris and Schaufeli, 2018).
This study examines how remote work relates to both work engagement and workaholism. Specifically, we propose that these relationships are shaped by key psychological patterns, including work-related need satisfaction and proactive work redesign tendencies. By taking this approach, we not only explore the link between remote work and heavy work investment but also provide insight into for whom and under what conditions these outcomes emerge. To achieve this, we employ a person-centered approach to identify latent employee profiles based on psychological need satisfaction and job crafting behaviors, alongside a variable-centered approach to analyze how remote work intensity relates to work engagement and workaholism across these profiles.
This research makes three key contributions. First, we extend remote work research by examining its implications for both work engagement and workaholism, considering how these relationships change across employee profiles defined by work-related need satisfaction and proactive work behaviors. In doing so, we respond to calls for employee-centered research on how remote work is linked to psychological well-being (Aleem et al., 2023). Our findings offer a nuanced perspective, showing that the relationship between remote work intensity and heavy work investment depends on employees’ fulfillment of basic psychological needs and their proactive work adjustments. Second, we contribute to the job crafting literature (Wrzesniewski and Dutton, 2001) by empirically investigating how work-related need satisfaction and job crafting behaviors co-occur, shaping employees’ broader motivational and behavioral patterns. While prior research established that job crafting enhances need satisfaction (Bakker and Oerlemans, 2019) and vice versa (Pimenta de Devotto et al., 2022), it remains unclear how these two key motivational and behavioral aspects coexist within employees, shaping their general tendencies (Ryan and Deci, 2017). Our study addresses this gap by identifying distinct employee profiles based on work-related psychological need satisfaction and job redesign strategies and sheds light on how these profiles are key in shaping remote work outcomes. Third, we advance the proactive work redesign literature (Zhang and Parker, 2019) by investigating how positive and negative forms of heavy work investment are linked to employee profiles encompassing approach- and avoidance-oriented job redesign and need satisfaction. Prior studies emphasize job crafting’s role in enhancing engagement (Rudolph et al., 2017; Zhang and Parker, 2019), but its potential links to workaholism remain underexplored (Taris et al., 2015; Zeijen et al., 2018). By considering how employee motivational and behavioral tendencies shape both work engagement and workaholism, our study provides new insights into the roles and boundary conditions of proactive work design for work-related well-being. Beyond these theoretical contributions, our findings offer practical implications for employees, managers, and organizations. By identifying general psychological patterns related to work-related need satisfaction and proactive behaviors shaping remote work experiences, we provide actionable recommendations for fostering engagement while mitigating workaholism risks. This knowledge is essential for organizations designing evidence-based remote and hybrid work policies that support well-being and performance.
2. Theoretical background
2.1 Remote working and heavy work investment
Remote work is associated with a range of outcomes that can impact employees both positively and negatively, depending on various contextual and individual factors. The European Working Conditions Survey conducted by the European Agency for Safety and Health at Work (Capecchi, 2021) on 43,850 employees across 35 European countries found that teleworkers engage in work-related tasks during their free time more frequently than non-teleworkers. This suggests that remote work may intensify work investment, defined as the significant energy and time devoted to work, which can manifest in either adaptive (work engagement) or maladaptive (workaholism) forms (Di Stefano and Gaudino, 2019; Schaufeli, 2016; Taris et al., 2015; van Beek et al., 2012). While work engagement reflects a motivated, fulfilling involvement in work, workaholism is marked by an excessive and compulsive drive to work, often at the expense of well-being (Taris et al., 2015). However, despite growing research on remote work, it remains unclear under what conditions remote work fosters work engagement versus workaholism, particularly when considering individual differences in work-related psychological needs and behavioral tendencies.
2.1.1 Remote working and work engagement
Work engagement is a positive, work-related state of mind characterized by vigor, dedication, and absorption (Schaufeli et al., 2006). Engaged employees experience high energy levels, derive intrinsic motivation from their work, and feel a sense of alignment between their personal values and work goals. However, the relationship between remote work intensity and engagement remains inconclusive, with prior research reporting mixed findings. Some studies suggest that remote work fosters engagement (Delanoeije and Verbruggen, 2020) by increasing autonomy and reducing workplace distractions (Sardeshmukh et al., 2012). However, others highlight potential downsides, such as diminished social interaction, weakened professional support, and challenges in maintaining work motivation (Adisa et al., 2023; Galanti et al., 2021). These drawbacks may be particularly relevant when remote work intensity is high, as prolonged physical separation from colleagues and supervisors may limit access to resources such as formal and informal feedback, recognition, and professional development opportunities (Bakker et al., 2023). Additionally, remote work can blur the boundaries between professional and personal life, increasing role ambiguity, interruptions, work-life conflict, and difficulties in psychological detachment from work (Sardeshmukh et al., 2012; ten Brummelhuis et al., 2012). These factors can deplete employees’ motivation, making it harder for them to sustain work engagement over time.
Remote work intensity is negatively related to work engagement.
2.1.2 Remote working and workaholism
Workaholism is a multidimensional construct that encompasses compulsive work motivation, persistent work-related thoughts, negative emotions when not working, and excessive work behaviors (Clark et al., 2020; Huyghebaert et al., 2018). Unlike work engagement, which is driven by intrinsic motivation, workaholism is primarily fueled by external pressures, rigid work habits, and an inability to psychologically detach from work (van den Broeck et al., 2011). Research consistently links workaholism to negative outcomes, including burnout, poor well-being, and reduced job and life satisfaction (Clark et al., 2016). Remote work can intensify workaholic tendencies through various mechanisms. First, the blurring of work-life boundaries, particularly in high-intensity remote work settings, may encourage employees to remain constantly connected (ten Brummelhuis et al., 2012), increasing the likelihood of compulsive overworking (Golden et al., 2006). Second, when employees lack structural constraints such as clear working hours or direct managerial supervision, self-imposed work pressure may grow, fostering excessive work investment (Gillet et al., 2023). Third, remote work environments may introduce role ambiguity and reduced access to feedback, making employees feel uncertain about their performance. In such cases, employees may attempt to compensate by increasing their work effort, reinforcing workaholic tendencies (van den Broeck et al., 2011).
Remote work intensity is positively related to workaholism.
While the hypothesized relationships between remote work intensity and both work engagement and workaholism assume linear trends, emerging evidence suggests that these associations may be more complex. Specifically, the effects of remote work on self-regulation and psychological functioning can change over time and vary across individuals (Magrizos et al., 2023). For instance, at moderate levels, remote work may enhance autonomy and allow for better work-life integration, leading to higher engagement and reduced workaholism. However, when remote work intensity is too high, these benefits may diminish, giving way to social isolation, reduced support, and uncontrolled work-life spillover, which could ultimately increase workaholic tendencies and lower work engagement. Given the limited theoretical guidance on the potential non-linearity of these relationships, we adopt an exploratory approach (Morin et al., 2018) to assess whether remote work intensity exhibits curvilinear effects on work engagement and workaholism.
2.2 Work-related need satisfaction and proactivity in remote work: the role of need-fulfillment-crafting profiles
Employees differ in how they adapt to remote work, with some effectively leveraging autonomy to sustain engagement, while others struggle with self-regulation and motivation (Demerouti, 2023; Geldart, 2022). We propose that to understand these differences, it is important to consider both employees’ psychological need satisfaction and their proactive behaviors in shaping their work environment. However, these characteristics do not operate in isolation, rather, employees exhibit distinct psychological patterns that combine different levels of need fulfillment and job crafting behaviors. Taking a profile-based approach allows us to map these heterogeneous patterns and understand how different employees experience and navigate remote work.
Remote work, characterized by reduced direct supervision and increased autonomy (Allen et al., 2003), places greater responsibility on employees to regulate their energy, engagement, and work environment. The absence of traditional workplace structures requires individuals to adopt proactive strategies that sustain well-being and performance (Demerouti, 2023). One such strategy is job crafting, which refers to employees’ proactive efforts to modify their work tasks and conditions in alignment with their needs, abilities, and values (Tims and Bakker, 2010; Wrzesniewski and Dutton, 2001). Job crafting behaviors can be categorized into approach-oriented strategies (e.g. seeking additional resources, pursuing challenges, optimizing demands for efficiency) and avoidance-oriented strategies (e.g. reducing demands to prevent exhaustion) (Zhang and Parker, 2019). These behaviors are especially relevant in remote work, where individuals have greater control over their work structure but may also experience increased pressure to self-manage (Costantini and Weintraub, 2022; Mäkikangas et al., 2022). Research suggests that approach job crafting is linked to enhanced work-related well-being (Rudolph et al., 2017; Zhang and Parker, 2019), while avoidance crafting may have mixed effects, potentially reducing strain but also limiting growth opportunities.
A key mechanism through which job crafting influences well-being is by fulfilling fundamental psychological needs (Bakker and Oerlemans, 2019). According to self-determination theory (SDT; Deci and Ryan, 2000), individuals possess three core needs: autonomy (volition in one’s actions), competence (feeling effective and capable), and relatedness (meaningful connections with others). When these needs are satisfied, employees experience higher motivation and well-being; when frustrated, they face disengagement and job strain (Gagné and Vansteenkiste, 2013). The job crafting literature aligns with SDT by demonstrating that employees engage in crafting behaviors to maintain control over their work, reinforce their self-image, and enhance social connections (Wrzesniewski and Dutton, 2001). For instance, employees who actively craft their social resources experience greater relatedness at work, while those who seek structural resources and task variety report enhanced autonomy and competence (Bakker and Oerlemans, 2019; Slemp and Vella-Brodrick, 2014).
Importantly, research suggests a reciprocal relationship between job crafting and need satisfaction. While job crafting enhances need fulfillment (Toyama et al., 2022), baseline need satisfaction also influences job crafting tendencies (Pimenta de Devotto et al., 2022). These reciprocal relationships illustrate that employees’ work experiences and behaviors are interconnected, shaping stable patterns in need satisfaction and job crafting, as suggested by SDT’s premise that individuals are motivated by different forms of behavioral regulation (Ryan and Deci, 2017). For instance, employees who consistently feel competent may seek challenges that reinforce their competence, creating a positive feedback loop. Conversely, employees experiencing low need satisfaction may resort to avoidance crafting, which could lead to disengagement or workaholism. This dynamic suggests that stable patterns may exist in how employees engage with their work environment, forming distinct psychological profiles that integrate job crafting behaviors and need satisfaction levels.
Given this theoretical foundation, we propose the concept of fulfillment-crafting profiles, which reflect employees’ combined tendencies in work-related need satisfaction (autonomy, competence, and relatedness) and job crafting strategies (approach- and avoidance-oriented crafting). By examining these profiles, we can gain insights into how different workers experience and respond to remote work. This approach aligns with prior person-centered research on job crafting, which has identified distinct profiles combining approach crafting with demand reduction (Mäkikangas, 2018; Mäkikangas and Schaufeli, 2021; Toyama et al., 2024). However, existing studies often overlook optimizing demands, a crucial component of remote work adaptation (Mäkikangas et al., 2022), which involves strategically adjusting work processes to improve efficiency (Demerouti and Peeters, 2018; Costantini et al., 2021). Integrating the person-centered job crafting literature (e.g. Mäkikangas, 2018; Mäkikangas and Schaufeli, 2021; Toyama et al., 2022) with SDT, we propose that employees will exhibit distinct fulfillment-crafting profiles that capture meaningful differences in their general patterns of need satisfaction and job crafting behaviors:
At least two fulfillment-crafting profiles exist: (a) a profile characterized by high satisfaction of all three basic work-related psychological needs and approach job crafting, and (b) A profile characterized by low satisfaction of all three basic psychological needs and a predominant reliance on avoidance job crafting.
2.3 The moderating role of employee need-fulfillment-crafting profiles
While structural and social constraints (e.g. reduced feedback, role ambiguity) may explain why remote work intensity on average undermines engagement, individual differences in how employees proactively shape their work environment and fulfill their psychological needs could influence the extent to which they thrive or struggle in remote settings. Some employees may actively craft their tasks, social interactions, and job resources, allowing them to sustain engagement even in high-intensity remote work. Others, however, may passively experience remote work constraints without adjusting their work environment to meet their needs, making them more vulnerable to disengagement. Building on person-centered perspectives of job crafting (Mäkikangas, 2018; Mäkikangas and Schaufeli, 2021; Toyama et al., 2022), we propose that employees’ fulfillment-crafting profiles, which integrate their levels of psychological need satisfaction (autonomy, competence, relatedness) and proactive job crafting behaviors, determine how they respond to remote work intensity. Employees whose profiles reflect high need satisfaction and strong approach-oriented job crafting are better equipped to self-regulate, structure their work, and sustain meaningful interactions while working remotely (Costantini and Weintraub, 2022; Petrou et al., 2017). As a result, for them, remote work intensity may support engagement by leveraging autonomy, enhancing flexibility, and minimizing unnecessary workplace distractions. Conversely, employees with low need satisfaction and avoidance-oriented crafting tendencies may struggle with remote work, as they are less likely to take proactive steps to sustain motivation and job resources (Demerouti, 2023). The reduced structure of remote work may further frustrate their unmet needs, amplifying disengagement. By incorporating both need fulfillment and proactive behaviors, fulfillment-crafting profiles help explain why some employees experience remote work as an opportunity for engagement, while others experience it as a source of strain.
The relationship between remote work intensity and work engagement will be (a) positive for profiles characterized by higher need satisfaction and approach-oriented job crafting and (b) negative for profiles characterized by lower need satisfaction and avoidance-oriented job crafting.
While structural and environmental factors may contribute to workaholism in remote settings (H1b), individual differences in how employees regulate their motivation and shape their work environment may further determine who is most vulnerable to these effects. We propose that employees with high need satisfaction and strong approach-oriented job crafting may experience workaholism differently from those with low need satisfaction and avoidance-oriented crafting tendencies. Employees with high need satisfaction and strong approach crafting tendencies are autonomously motivated but may struggle with self-imposed work pressure in remote settings. Their tendency to optimize their work environment (e.g. increasing task variety, seeking challenges) can sustain performance at the cost of excessive work investment (Hakanen et al., 2018). Hence, the flexibility of remote work may reinforce this tendency, as they have greater control over their work structure but fewer external signals to stop working (Gillet et al., 2023). In contrast, employees with low need satisfaction and avoidance-oriented crafting tendencies may experience workaholism due to uncertainty and external pressures. With limited access to support, feedback, or clear expectations, they may feel compelled to overwork as a compensatory strategy to avoid failure or negative evaluation. Their lack of approach-oriented job crafting may leave them vulnerable to an “always-on” mentality, where they remain connected out of obligation rather than intrinsic drive (Taris et al., 2020). By considering both autonomous and controlled pathways to workaholism, H4 clarifies how employees’ self-regulation and proactive strategies shape their vulnerability to the effects described in H1b.
The positive relationship between remote work intensity and workaholism will be stronger when accounting for employees’ fulfillment-crafting profiles, particularly for those characterized by (a) higher need satisfaction and approach-oriented job crafting and (b) lower need satisfaction and avoidance-oriented job crafting.
3. Method
3.1 Participants and procedure
Bachelor’s students recruited the participants as a part of a course requirement and administered an anonymous, web-based survey. Participation was voluntary, with employees informed about the study’s aims and that responses were anonymous. To qualify, participants needed to be employed and meet specific criteria: a minimum of six months of work experience, at least 20 h of work per week, and employment status (not self-employed). Data collection occurred in Italy between February and March 2022. Out of 1,000 participants, 273 were excluded because they did not complete the entire survey, resulting in a final sample of 727 employees (60% women; Mage = 43.08; SDage = 13.35; Mtenure = 17.57; SDtenure = 12.67). 53% had a high school diploma, 39.6% held a bachelor’s degree or higher. Occupations varied, with 45% in administrative roles, 18% in education and research, 12% in healthcare, and 6% in wholesale. Additionally, 53% reported having at least one child.
3.2 Measures
Measures were administered in Italian, employing the back-translation method for scales lacking Italian versions. Responses were on a 5-point scale unless otherwise noted.
Work-related need satisfaction was measured using items from van den Broeck et al.'s (2010) scale, assessing autonomy (6 items, e.g. I feel like I can be myself at my job), competence (4 items, e.g. I really master my tasks at my job), and relatedness (6 items, e.g. At work, I feel part of a group). A CFA showed acceptable model fit after adding one intra-factor correlation between two items of need for relatedness: χ2(100) = 484.52, p < 0.001, CFI = 0.91, TLI = 0.89, RMSEA = 0.07 and SRMR = 0.06.
Job crafting behaviors were assessed using the Italian adaptation (Costantini et al., 2021) of two job crafting scales (Demerouti and Peeters, 2018; Petrou et al., 2012) covering increasing job resources (6 items, e.g. I ask others for feedback on my job performance), seeking challenges (3 items, e.g. I ask for more responsibilities), reducing demands (3 items, e.g. I make sure that my work is mentally less intense), and optimizing demands (6 items, e.g. I make sure that my work is mentally less intense). CFA results indicated acceptable model fit after adding three intra-factor correlations: χ2(126) = 546.17, p < 0.001, CFI = 0.91, TLI = 0.90, RMSEA = 0.07 and SRMR = 0.06.
Work engagement was assessed using the Italian version (Balducci et al., 2010) of the UWES (Schaufeli et al., 2006) encompassing vigor (3 items, e.g. At my work, I feel bursting with energy), dedication (3 items, e.g. I am enthusiastic about my job), and absorption (3 items, e.g. I feel happy when I am working intensely). Responses were on a 7-point scale, from 0 = never to 6 = always. A CFA showed acceptable model fit after adding two intra-factor correlations: χ2(22) = 108.80, p < 0.001, CFI = 0.98, TLI = 0.97, RMSEA = 0.07 and SRMR = 0.02.
Workaholism was measured using Clark et al.’s (2020) scale, comprising four subscales with four items each: motivational (e.g. I always have an inner pressure inside of me that drives me to work), cognitive (e.g. I feel like I cannot stop myself from thinking about working), emotional (e.g. I am almost always frustrated when I am not able to work), and behavioral (e.g. I tend to work beyond my job’s requirements). CFA results indicated acceptable model fit: χ2(98) = 365.98, p < 0.001, CFI = 0.96, TLI = 0.95, RMSEA = 0.06 and SRMR = 0.05.
Participants reported their remote work intensity by indicating the number of days worked remotely in the past month: 10.9% worked remotely 1 day, 10.3% worked 2 or 3 days, and 15.8% worked remotely for 4–30 days.
3.3 Statistical analyses
3.3.1 Descriptive statistics and measurement models
Reliability was assessed via McDonald’s Omega. CFA in Mplus utilized ML estimation, with model fit evaluated using CFI, TLI, RMSEA, and SRMR. Acceptable fit was indicated by TLI and CFI ≤0.90, and RMSEA and SRMR ≤0.08 (Hu and Bentler, 1999).
3.3.2 Latent profile analysis (LPA)
LPA was conducted to identify subgroups (Collins and Lanza, 2013; Howard and Hoffman, 2018) based on work-related need satisfaction and job crafting. LPA uses continuous variables to determine the optimal number of profiles, estimate individual assignment probabilities, and explore profile membership (Ferguson et al., 2019; Howard and Hoffman, 2018; Spurk et al., 2020). The best-fitting profile solution was determined using Mplus v.8.4 (Muthén and Muthén, 1998/2017), comparing models with two to eight profiles. Parameters were estimated via maximum likelihood with robust standard errors (MLR), and FIML addressed missing data. Model fit was assessed using AIC, BIC, sample-adjusted BIC (SABIC), Lo–Mendell–Rubin Test (LMR), Bootstrap Likelihood Ratio Test (BLRT), and entropy value (Ferguson et al., 2019; Howard and Hoffman, 2018; Nylund et al., 2007). Lower AIC, BIC, and SABIC values indicate better fit, while significant LMR and BLRT p-values favor models with k profiles over k+1 profiles. Higher entropy values (0.60–0.80) indicate better classification accuracy (Muthén, 2004; Spurk et al., 2020). After identifying the optimal number of profiles, we interpreted item means and named each profile.
Next, we analyzed how the relationship between remote work intensity and heavy work investment varied across profiles. Following the estimation of the 3-class model, BCH weights were saved to account for measurement error in latent class variables. An auxiliary model (Asparouhov and Muthén, 2021) assessed class-specific regressions of work engagement and workaholism on remote work days and squared remote work days, controlling for gender and parental status. Random starting values were increased to 250 as per current recommendations (Asparouhov and Muthén, 2021).
4. Results
4.1 Descriptive statistics
Descriptive statistics, reliabilities, and correlations are presented in Table 1. Remote work intensity was not significantly related to work engagement (r = −0.04, p = 0.30) or any dimension of workaholism (motivational: r = 0.01, p = 0.77; cognitive: r = 0.03, p = 0.48; emotional: r = −0.01, p = 0.77; behavioral: r = −0.02, p = 0.62). Therefore, Hypotheses 1a and 1b are rejected.
Descriptive statistics, reliabilities and correlations among participants’ demographics and study variables (N = 727)
| M | SD | ω | 1 | 2 | 3 | 4 | 5 | 6 | 7 | 8 | 9 | 10 | 11 | 12 | 13 | 14 | |
|---|---|---|---|---|---|---|---|---|---|---|---|---|---|---|---|---|---|
| 1. Gender | 1.42 | 0.54 | – | ||||||||||||||
| 2. RW | 1.83 | 4.39 | – | 0.01 | |||||||||||||
| 3. Kids | 0.53 | 0.50 | – | −0.07 | 0.05 | ||||||||||||
| 4. Autonomy | 3.35 | 0.82 | 0.80 | −0.01 | 0.02 | 0.16** | |||||||||||
| 5. Competence | 4.02 | 0.71 | 0.85 | −0.02 | 0.01 | 0.14** | 0.19** | ||||||||||
| 6. Relatedness | 3.69 | 0.85 | 0.81 | −0.06 | −0.05 | 0.09* | 0.45** | 0.18** | |||||||||
| 7. Increasing resources | 3.62 | 0.72 | 0.78 | −0.08* | −0.02 | −0.02 | 0.19** | 0.03 | 0.26** | ||||||||
| 8. Seeking challenges | 2.91 | 0.98 | 0.73 | −0.04 | 0.03 | −0.03 | 0.19** | 0.20** | 0.13** | 0.42** | |||||||
| 9. Reducing demands | 2.55 | 0.91 | 0.75 | 0.05 | −0.06 | 0.01 | −0.17** | 0.02 | −0.07 | 0.02 | −0.04 | ||||||
| 10. Optimizing demands | 3.73 | 0.78 | 0.87 | 0.09* | 0.03 | 0.11** | 0.10** | 0.36** | 0.08* | 0.24** | 0.27** | 0.20** | |||||
| 11. Motivational | 2.78 | 0.89 | 0.77 | 0.01 | 0.01 | −0.01 | −0.09* | 0.09* | −0.08* | 0.13** | 0.18** | 0.08* | 0.11** | ||||
| 12. Cognitive | 2.29 | 1.09 | 0.94 | −0.01 | 0.03 | −0.04 | 0.01 | −0.04 | −0.04 | 0.14** | 0.10** | −0.07 | −0.05 | 0.47** | |||
| 13. Emotional | 1.84 | 0.88 | 0.87 | 0.04 | −0.01 | −0.04 | 0.06 | −0.04 | −0.01 | 0.11** | 0.15** | 0.04 | 0.04 | 0.42** | 0.48** | ||
| 14. Behavioral | 2.72 | 0.97 | 0.82 | 0.02 | −0.02 | −0.01 | 0.06 | 0.10** | −0.01 | 0.13** | 0.24** | −0.04 | 0.16** | 0.39** | 0.45** | 0.37** | |
| 15. Work engagement | 4.55 | 1.26 | 0.93 | −0.07 | −0.04 | 0.10** | 0.56** | 0.27** | 0.39** | 0.36** | 0.33** | −0.09* | 0.21** | 0.15** | 0.20** | 0.29** | 0.29** |
Note(s): Gender: 1 = Female, 2 = Male. RW = number of remote-work days in the previous month. Kids: 0 = No kids; 1 = One or more kids. Autonomy, competence and relatedness refer to work-related basic need satisfaction. Motivational, cognitive, emotional, and behavioral refer to workaholism dimensions
**p < 0.01; *p < 0.05
Source(s): Authors’ own creation
4.2 Latent profiles
Table 2 displays fit indices for alternative profile solutions. The 3-profile model was the best fit, indicated by minimal improvement beyond this model in AIC and BIC elbow plots, a significant LMR p-value, and the absence of small-size profiles (Spurk et al., 2020).
Statistics for alternative profile solutions
| Number of profiles | LL | FP | AIC | BIC | SABIC | Entropy | Smallest class % | LMR (p) | BLRT (p) |
|---|---|---|---|---|---|---|---|---|---|
| 2 | −7044.15 | 22 | 14132.31 | 14233.27 | 14163.41 | 0.59 | 45% | 0.003 | 0.000 |
| 3 | −6977.24 | 30 | 14014.48 | 14152.15 | 14056.89 | 0.69 | 11% | 0.020 | 0.000 |
| 4 | −6935.39 | 38 | 13946.77 | 14121.15 | 14000.49 | 0.67 | 8% | 0.216 | 0.000 |
| 5 | −6900.91 | 46 | 13893.83 | 14104.92 | 13958.85 | 0.71 | 6% | 0.165 | 0.000 |
| 6 | −6875.29 | 54 | 13858.58 | 14106.38 | 13934.91 | 0.71 | 3% | 0.310 | 0.000 |
| 7 | −6854.80 | 62 | 13833.61 | 14118.12 | 13921.25 | 0.74 | 3% | 0.328 | 0.000 |
| 8 | −6839.29 | 70 | 13818.58 | 14139.80 | 13917.53 | 0.71 | 3% | 0.760 | 0.008 |
Note(s): N = 727. Italics indicate selected model. LL = log-likelihood; FP = free parameters; AIC = Akaike information criterion; BIC = Bayesian information criterion; SABIC = sample-size adjusted Bayesian information criterion; LMR = Lo-Mendell-Rubin test and BLRT = Bootstrapped likelihood ratio test
Source(s): Authors’ own creation
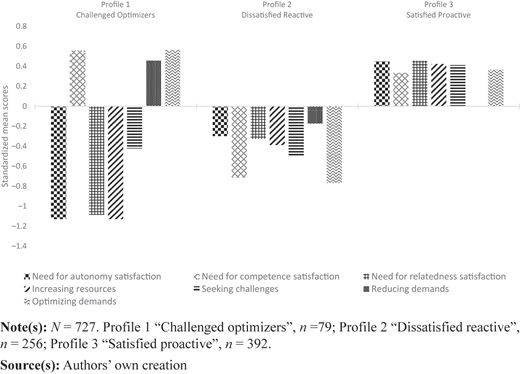
The 3-profile solution is illustrated in Figure 1, with standardized scores and univariate entropy in Table 3, highlighting optimizing demands and work-related need satisfaction as key indicators (Asparouhov and Muthén, 2018).
Parameter estimates for the three-profile model
| Profile | ||||
|---|---|---|---|---|
| Variable | Univariate entropy | 1 Challenged optimizers | 2 Dissatisfied reactive | 3 Satisfied proactive |
| Latent profile membership proportions | 11% (n = 79) | 35% (n = 256) | 54% (n = 392) | |
| Within-profile Z-standardized means | ||||
| Need for autonomy satisfaction | 0.29 | −1.13 | −0.30 | 0.45 |
| Need for competence satisfaction | 0.28 | 0.56 | −0.71 | 0.33 |
| Need for relatedness satisfaction | 0.29 | −1.09 | −0.33 | 0.46 |
| Increasing resources | 0.25 | −0.77 | −0.39 | 0.42 |
| Seeking challenges | 0.23 | −0.42 | −0.49 | 0.41 |
| Reducing demands | 0.14 | 0.46 | −0.17 | 0.00 |
| Optimizing demands | 0.30 | 0.56 | −0.77 | 0.36 |
Note(s): For a clear interpretation of which indicator values are above or below the sample means, we used the z-standardized mean scale scores
Source(s): Authors’ own creation
The first profile, labeled Challenged Optimizers, reported high competence satisfaction and frequent crafting of hindering job demands, low satisfaction of autonomy and relatedness, and low resource and challenge-seeking behaviors. The second profile exhibited generally low scores across variables, with the lowest in competence satisfaction and optimizing demand, resulting in its characterization as Dissatisfied Reactive. The third and largest profile displayed high need satisfaction and job crafting, except for average scores in reducing demands, thus being labeled Satisfied Proactive. Further profile description using the BCH method is detailed in Table 4. Overall, these findings partially support Hypothesis 2, revealing three distinct fulfillment-crafting profiles.
Descriptives of covariates and focal variables across profiles
| Means | Profile 1 vs. 2 | Profile 1 vs. 3 | Profile 2 vs. 3 | ||||||
|---|---|---|---|---|---|---|---|---|---|
| Variable | Challenged optimizers | Dissatisfied reactive | Satisfied proactive | χ2 | p | χ2 | p | χ2 | p |
| Gender | 1.50 | 1.37 | 1.38 | 2.60 | 0.11 | 2.41 | 0.12 | 0.09 | 0.77 |
| Children | 0.97 | 0.81 | 1.09 | 0.83 | 0.36 | 0.58 | 0.45 | 6.19 | 0.01 |
| Age | −0.01 | −0.07 | 0.05 | 0.16 | 0.69 | 0.10 | 0.76 | 1.09 | 0.30 |
| Work engagement | −1.06 | −0.57 | 0.61 | 7.67 | 0.006 | 105.56 | ≤0.001 | 171.69 | ≤0.001 |
| Motivational | 0.22 | −0.27 | 0.12 | 8.16 | ≤0.001 | 0.41 | 0.52 | 14.30 | ≤0.001 |
| Cognitive | −0.16 | −0.08 | 0.09 | 0.20 | 0.66 | 2.29 | 0.13 | 2.53 | 0.11 |
| Emotional | −0.49 | −0.08 | 0.16 | 10.37 | ≤0.001 | 29.32 | ≤0.001 | 5.06 | 0.03 |
| Behavioral | −0.13 | −0.28 | 0.21 | 0.81 | 0.37 | 4.41 | 0.04 | 22.20 | ≤0.001 |
| RW days | −0.10 | 0.05 | −0.01 | 0.74 | 0.39 | 0.42 | 0.52 | 0.21 | 0.65 |
Note(s): n= 727. Profile 1 “Challenged optimizers”, n = 79; Profile 2 “Dissatisfied reactive”, n = 256; Profile 3 “Satisfied proactive”, n = 392. For all focal variables we used the z-standardized scores. Gender: 1 = Female, 2 = Male. Children: Number of children and RW = number of remote-work days in the previous month
Source(s): Authors’ own creation
Employees with more children were more likely to belong to the Satisfied Proactive profile than the Dissatisfied Reactive. No significant differences emerged for gender, age, and remote work days across profiles.
4.3 Remote work and heavy work investment across profiles
Profile-specific regressions of heavy work investment on remote work intensity showed distinct patterns across profiles. Control variables included gender, due to its relationship with different remote work practices (Cannito and Scavarda, 2020), and the number of children since it was related to profile membership. We used a multi-step procedure to test curvilinear relations (Astakhova, 2015), introducing control variables in Step 1, remote work days in Step 2, and squared remote work days in Step 3.
4.3.1 Work engagement
Linear models outperformed quadratic ones across all profiles (Table 5). A negative association between remote work intensity and work engagement was observed only in Satisfied Proactive employees (B = −0.11, p = 0.03), rejecting Hypothesis 3.
Predictors of work engagement across profiles
| Step 1 | Step 2 | Step 3 | |||||||
|---|---|---|---|---|---|---|---|---|---|
| Profile | 1 | 2 | 3 | 1 | 2 | 3 | 1 | 2 | 3 |
| Control variables | B | B | B | ||||||
| Gender | −0.10 | −0.08 | 0.02 | −0.10 | −0.08 | 0.02 | −0.10 | −0.08 | 0.02 |
| Children | −0.04 | 0.05 | 0.07 | −0.04 | 0.05 | 0.07 | −0.04 | 0.05 | 0.07 |
| RW | −0.01 | −0.01 | −0.11* | 0.05 | −0.03 | −0.14 | |||
| RW2 | −0.01 | 0.01 | 0.01 | ||||||
| R2 | 0.02 | 0.02 | 0.01 | 0.02 | 0.02 | 0.02 | 0.02 | 0.02 | 0.03 |
| Adjusted R2 | −0.01 | 0.01 | 0.01 | −0.02 | 0.01 | 0.02 | −0.03 | 0.01 | 0.02 |
| Δ Adjusted R2 | −0.01 | – | 0.01 | −0.01 | - | – | |||
Note(s): Profile 1 “Challenged optimizers”, n = 79; Profile 2 “Dissatisfied reactive”, n = 256; Profile 3 “Satisfied proactive”, n = 392. For all variables we used the z-standardized scores. Unstandardized regression coefficients are reported. Gender: 1 = Female; 2 = Male. Children = Number of kids, with 0 indicating no kids and RW = number of remote-work days in the previous month
***p ≤ 0.001; **p < 0.01; *p < 0.05
Source(s): Authors’ own creation
4.3.2 Motivational and emotional workaholism
Linear models were a better fit compared to quadratic ones. Higher remote work intensity was related to higher motivational workaholism only in the Challenged Optimizers profile (B = 0.29, p = 0.001), while no significant relation was found in other profiles (Table 6). No significant relations with remote work were found for emotional workaholism in any profiles (Table 7).
Predictors of motivational and cognitive workaholism across profiles
| Motivational workaholism | Cognitive workaholism | |||||||||||||||||
|---|---|---|---|---|---|---|---|---|---|---|---|---|---|---|---|---|---|---|
| Step 1 | Step 2 | Step 3 | Step 1 | Step 2 | Step 3 | |||||||||||||
| Profile | 1 | 2 | 3 | 1 | 2 | 3 | 1 | 2 | 3 | 1 | 2 | 3 | 1 | 2 | 3 | 1 | 2 | 3 |
| Control variables | B | B | B | B | B | B | ||||||||||||
| Gender | −0.10 | −0.01 | 0.03 | −0.15 | −0.01 | 0.03 | −0.15 | −0.01 | 0.03 | −0.12 | −0.11 | 0.04 | −0.18 | −0.11 | 0.04 | −0.16 | −0.10 | 0.04 |
| Children | −0.06 | −0.15 | 0.03 | −0.08 | −0.15 | 0.03 | −0.07 | −0.15 | 0.03 | 0.10 | −0.05 | −0.05 | 0.09 | −0.05 | −0.05 | 0.13 | −0.05 | −0.05 |
| RW | 0.29** | −0.02 | 0.01 | 0.16 | 0.14 | −0.01 | 0.29** | 0.07 | −0.07 | −0.22 | 0.46** | −0.03 | ||||||
| RW2 | 0.03 | −0.04 | 0.01 | 0.11* | −0.09** | −0.01 | ||||||||||||
| R2 | 0.01 | 0.02 | 0.01 | 0.08 | 0.02 | 0.00 | 0.09 | 0.03 | 0.00 | 0.03 | 0.01 | 0.01 | 0.09 | 0.02 | 0.01 | 0.14 | 0.06 | 0.01 |
| Adjusted R2 | −0.01 | 0.01 | −0.01 | 0.05 | 0.01 | −0.01 | 0.04 | 0.01 | −0.01 | 0.01 | 0.01 | 0.00 | 0.06 | 0.01 | 0.00 | 0.09 | 0.04 | 0.00 |
| Δ Adjusted R2 | 0.06 | – | – | −0.01 | – | – | 0.05 | – | – | 0.03 | 0.03 | – | ||||||
Note(s): Profile 1 “Challenged optimizers”, n = 79; Profile 2 “Dissatisfied reactive”, n = 256; Profile 3 “Satisfied proactive”, n = 392. For all variables we used the z-standardized scores. Unstandardized regression coefficients are reported. Gender: 1 = Female; 2 = Male. Children = Number of kids, with 0 indicating no kids and RW = number of remote-work days in the previous month
***p ≤ 0.001; **p < 0.01; *p < 0.05
Source(s): Authors’ own creation
Predictors of emotional and behavioral workaholism across profiles
| Emotional workaholism | Behavioral workaholism | |||||||||||||||||
|---|---|---|---|---|---|---|---|---|---|---|---|---|---|---|---|---|---|---|
| Step 1 | Step 2 | Step 3 | Step 1 | Step 2 | Step 3 | |||||||||||||
| Profile | 1 | 2 | 3 | 1 | 2 | 3 | 1 | 2 | 3 | 1 | 2 | 3 | 1 | 2 | 3 | 1 | 2 | 3 |
| Control variables | B | B | B | B | B | B | ||||||||||||
| Gender | 0.16 | −0.11 | 0.15* | 0.16 | −0.11 | 0.15* | 0.16 | −0.11 | 0.15* | −0.21 | −0.13 | 0.21*** | −0.17 | −0.12 | 0.20*** | −0.17 | −0.12 | 0.21*** |
| Children | 0.05 | −0.07 | −0.08 | 0.05 | −0.08 | −0.08 | 0.04 | −0.08 | −0.07 | −0.11 | −0.03 | −0.01 | −0.10 | −0.04 | −0.01 | −0.10 | −0.04 | 0.01 |
| RW | −0.04 | 0.02 | −0.06 | 0.10 | 0.15 | −0.20 | −0.24*** | 0.11* | −0.08 | −0.32 | 0.36* | −0.23* | ||||||
| RW2 | −0.03 | −0.03 | 0.04 | 0.02 | −0.05 | 0.04 | ||||||||||||
| R2 | 0.03 | 0.02 | 0.03 | 0.03 | 0.02 | 0.04 | 0.03 | 0.02 | 0.04 | 0.06 | 0.02 | 0.05 | 0.11 | 0.04 | 0.05 | 0.11 | 0.05 | 0.06 |
| Adjusted R2 | 0.00 | 0.01 | 0.01 | −01 | 0.01 | 0.03 | −0.02 | 0.01 | 0.03 | 0.04 | 0.01 | 0.04 | 0.07 | 0.02 | 0.04 | 0.06 | 0.03 | 0.05 |
| Δ Adjusted R2 | −0.01 | – | 0.02 | −0.01 | – | – | 0.03 | 0.01 | – | −0.01 | 0.01 | 0.01 | ||||||
Note(s): Profile 1 “Challenged optimizers”, n = 79; Profile 2 “Dissatisfied reactive”, n = 256; Profile 3 “Satisfied proactive”, n = 392. For all variables we used the z-standardized scores. Unstandardized regression coefficients are reported. Gender: 1 = Female; 2 = Male. Children = Number of kids, with 0 indicating no kids and RW = number of remote-work days in the previous month
***p ≤ 0.001; **p < 0.01; *p < 0.05
Source(s): Authors’ own creation
4.3.3 Cognitive workaholism
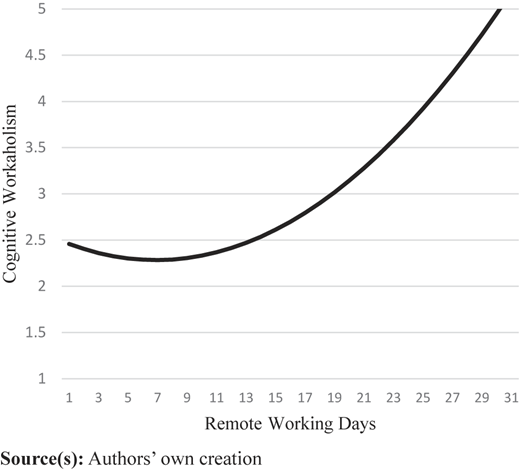
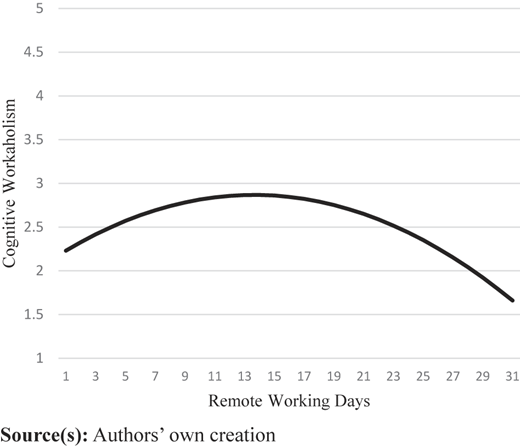
A quadratic model was superior across profiles, except for the Satisfied Proactive group, where no significant relations were found (Table 6). For Challenged Optimizers, cognitive workaholism decreased before increasing again at 5.9 remote work days [1] (B = 0.11, p = 0.04, see Figure 2). For Dissatisfied Reactive, it peaked at 12.63 days before declining (B = −0.09, p = 0.003, see Figure 3).
Curvilinear effects of remote working days on cognitive workaholism (challenged optimizers profile)
Curvilinear effects of remote working days on cognitive workaholism (challenged optimizers profile)
Curvilinear effects of remote working days on cognitive workaholism (dissatisfied reactive profile)
Curvilinear effects of remote working days on cognitive workaholism (dissatisfied reactive profile)
4.3.4 Behavioral workaholism
A linear model was superior for all profiles except Satisfied Proactive (Table 7). Higher remote work intensity was linked to lower behavioral workaholism in Challenged Optimizers (B = −0.24, p = 0.001) but higher behavioral workaholism in Dissatisfied Reactive employees (B = 0.11, p = 0.05). Overall, these results partially support Hypothesis 4.
Lastly, the number of children was not associated with any form of heavy work investment. Gender significantly predicted emotional and behavioral workaholism, with men scoring higher than women in the Satisfied Proactive group only.
5. Discussion
This study examined how the relationship between remote work intensity and heavy work investment varies according to employee fulfillment-crafting profiles, which reflect individual differences in psychological need satisfaction and job crafting tendencies. Analyzing data from 727 employees, we identified three distinct profiles, each displaying different patterns in the association between remote work intensity and heavy work investment (Table 8).
Summary of the results for the different fulfillment-crafting profiles
| Challenged optimizers | Dissatisfied reactive | Satisfied proactive | ||||
|---|---|---|---|---|---|---|
| In general … | In relation to remote work intensity … | In general … | In relation to remote work intensity … | In general … | In relation to remote work intensity … | |
| Work engagement Work-related state characterized by energy, dedication, and absorption | Lowest levels of work engagement | No effects | Low levels of work engagement | No effects | Highest levels of work engagement | Work engagement decreases as remote work becomes more frequent |
| Motivational workaholism Inner compulsion to work: “I work because it makes me feel like a worthy person.” | Highest levels of motivational workaholism | Motivational workaholism increases as remote work becomes more frequent | Lowest levels of motivational workaholism | No effects | High levels of motivational workaholism | No effects |
| Cognitive workaholism Persistent, uncontrollable work thoughts, even when not working | Lowest levels of cognitive workaholism | Cognitive workaholism decreases initially, then rises with more remote work | Cognitive workaholism increases initially, then declines with more remote work | Highest levels of cognitive workaholism | No effects | |
| Emotional workaholism Feeling negative emotions when not working or prevented from working | Lowest levels of emotional workaholism | No effects | Low levels of emotional workaholism | No effects | Highest levels of emotional workaholism | No effects |
| Behavioral workaholism Excessive working that goes beyond what is expected | Low levels of behavioral workaholism | Behavioral workaholism decreases as remote work becomes more frequent | Lowest levels of behavioral workaholism | Behavioral workaholism increases as remote work becomes more frequent | Highest levels of behavioral workaholism | Behavioral workaholism decreases as remote work becomes more frequent |
Source(s): Authors’ own creation
5.1 Theoretical implications
Our study offers three key contributions. First, we advance remote work research by highlighting how employee need fulfillment and proactive job crafting tendencies moderate the relationship between remote work intensity and work engagement and workaholism. Prior studies have emphasized the mixed effects of remote work on employee well-being (Boell et al., 2016), but research has rarely examined how employee with different psychological profiles experience these effects differently. Our findings reveal that employees with high competence satisfaction but lower autonomy and relatedness satisfaction, who engage in demand-optimizing job crafting, exhibit a non-linear association between remote work intensity and persistent work-related thoughts. Initially, remote work intensity is linked to a decrease in persistent work thoughts (up to approximately six days per month), likely because these employees can optimize their work environment. However, at higher remote work intensity, persistent work thoughts increase again. This suggests that highly frequent remote work may reinforce pre-existing tendencies toward overinvestment in work among these employees. In contrast, employees with low need satisfaction and low proactive tendencies report more persistent work thoughts as remote work intensity increases, though these thoughts start to decline at very high levels of remote work intensity (around 12 days per month). This suggests that these employees may struggle with boundary management, leading to longer working hours as a compensatory strategy. However, at very high levels of remote work, they may disengage rather than persist in overworking. For highly proactive employees with strong need satisfaction, greater remote work intensity is associated with lower work engagement, suggesting that these employees may benefit more from traditional work environments where they have greater access to social and professional resources. Collectively, these findings underscore that the relationship between remote work intensity and heavy work investment is contingent on individual differences in need satisfaction and proactive work behaviors. Without accounting for these differences, remote work policies may have unintended effects, influencing both motivation and work-related well-being.
Second, by integrating SDT (Ryan and Deci, 2017) with job crafting theory (Wrzesniewski and Dutton, 2001), we offer new insights into how job crafting behaviors and need satisfaction co-exist within employees and shape their broader work-related tendencies. While previous research has established that job crafting enhances need satisfaction (Bakker and Oerlemans, 2019) and vice versa (Pimenta de Devotto et al., 2022), it remained unclear how these motivational and behavioral aspects combine to form distinct employee profiles. Our findings indicate that employees who feel competent but lack autonomy and relatedness tend to engage in demand-optimizing behaviors rather than proactive job crafting strategies that could better address their unmet needs. This suggests that job crafting may not always serve a need-fulfilling function but may instead reinforce already-satisfied needs, limiting its broader effectiveness in addressing motivational deficits. Hence, while job crafting is often aimed at fulfilling psychological needs, employees may select crafting strategies that reinforce already-satisfied needs rather than actively addressing areas of need frustration, which may limit the broader effectiveness of job crafting in addressing motivational deficits.
Third, we advance the proactive work redesign literature (Zhang and Parker, 2019) by demonstrating that approach- and avoidance-oriented crafting tendencies are linked to both positive and negative forms of heavy work investment. Prior research has predominantly emphasized job crafting’s role in enhancing work engagement (Rudolph et al., 2017; Zhang and Parker, 2019), but its potential contribution to workaholism remains underexplored (Taris et al., 2015; Zeijen et al., 2018). Our results indicate that employees who experience high need satisfaction and frequently engage in job crafting tend to show high work engagement but may also develop excessive work-related thoughts and behaviors. This indicates that while proactive job redesign can enhance engagement, it may also contribute to unhealthy work investment patterns if not carefully managed. Additionally, employees whose autonomy and relatedness needs are unmet tend to engage in demand crafting while neglecting resource-seeking or challenge-seeking strategies. This suggests that demand crafting alone may reflect a maladaptive coping mechanism rather than a sustainable strategy for improving work experiences.
5.2 Limitations and future directions
Our profiles were estimated at a single time point, providing insights into individual differences but limiting conclusions about their stability over time. Future research should examine whether job crafting behaviors lead to profile transitions by altering job characteristics and long-term need satisfaction. While job crafting entails gradual adjustments (Tims and Bakker, 2010; Wrzesniewski and Dutton, 2001), it remains unclear if these changes are significant enough to shift individuals between profiles. Additionally, our results show that employees with children were more likely to belong to the Satisfied Proactive profile. This suggests that parenthood may shape proactive work approaches, though the mechanisms underlying this relationship require further investigation. Moreover, within the Satisfied Proactive group, men exhibited higher emotional and behavioral workaholism than women. This points to potential gender differences in the effects of proactive work behaviors that warrant further exploration, particularly given the limited attention to socio-demographic influences in job crafting research (Costantini, 2022). Furthermore, while our study focused on the association between remote work intensity and heavy work investment, we did not examine potential energy depletion effects, such as exhaustion. Given that employees who engage in high levels of avoidance crafting may be more susceptible to energy depletion (Bakker et al., 2023; Lichtenthaler and Fischbach, 2019), future research should explore the interplay between remote work, energy depletion, and fulfillment-crafting profiles.
5.3 Practical implications
As remote work continues to expand (Aleem et al., 2023), organizations must recognize that its effects on work engagement and workaholism are not uniform but are related to employees’ psychological need satisfaction and job crafting tendencies. Our findings suggest that while highly proactive employees with fulfilled psychological needs are less susceptible to workaholism, those with unmet needs or lower proactive tendencies may struggle with excessive work investment, particularly in remote settings. These insights highlight the importance of workplace strategies that support employees in maintaining motivation and well-being while preventing maladaptive work behaviors. To mitigate the risks associated with remote work and foster positive work investment, organizations should focus on enhancing need satisfaction, for example by providing greater flexibility in structuring their work while setting clear expectations and encouraging employees to set personal boundaries and promoting a culture that respects non-working hours, which can help reduce workaholic tendencies. To foster competence, organizations should offer developmental resources such as training, mentoring programs, and career growth discussions, ensuring employees feel capable and effective in their roles, also while working remotely. To strengthen relatedness, companies should encourage structured social interactions, such as virtual check-ins, mentorship programs, and team-based projects that create meaningful professional connections, reducing feelings of isolation in remote settings.
Similarly, organizations should actively promote job crafting behaviors by providing employees with tools and guidance on how to shape their roles in productive and sustainable ways, also during remote working (cf. Demerouti, 2023 Costantini et al., 2022). Workshops or coaching sessions can help employees recognize when they engage in maladaptive crafting behaviors (e.g. excessive demand crafting that reinforces workaholic tendencies) and encourage constructive crafting strategies, such as resource-seeking and challenge-seeking. Additionally, integrating job crafting interventions into performance development processes, such as guided reflection on how employees can increase their resources in remote work contexts, can help individuals proactively shape their work experiences in a way that sustains engagement while preventing excessive work investment.
To further mitigate the risks for workaholism in remote setting, organizations could intervene with primary and secondary prevention interventions (Taris and de Jonge, 2024). One example of primary intervention could be implementing training activities targeting leaders to make them aware of the behavior that they model, as this could influence their subordinates’ behaviors (such as not answering emails outside working hours). Secondary prevention strategies can help employees recognize and manage workaholic tendencies. Organizations could provide self-assessment tools, such as behavioral checklists, to increase awareness of excessive work investment patterns. Additionally, offering structured work schedules or providing recommendations for work-life boundary management could help employees regulate their remote work behaviors.
Notes
For the two significant quadratic terms, we re-run the regressions for separate profiles and then calculated the minimum (Profile 1) and maximum (Profile 2) values of the quadratic expressions when setting the derivative of the polynomial regression function equal to zero.

