Introduction
Education is one of the fields that has improved rapidly as a direct result for the development of information and communications technology (ICT), and stimulated to adopt e-learning. E-learning directly resulted from the integration of education and technology and is increasingly considered a powerful medium for learning.
E-learning has facilitated learning by delivering a learner-centered and interactive learning environment to anyone, anywhere, and anytime (Khan, 2005). In addition, it plays a significant role in shifting from teacher-centered to student-centered education (Taha, 2014, p. 2).
Despite e-learning’s successful implementation, a considerable number of e-learning projects fail to achieve their goals, and face slow progress and increasing dropout rate (Frimpon, 2012; Liaw, 2008). In addition, evaluating the success of e-learning systems is still an issue facing e-learning stakeholders.
ROA significant number of studies have focused on the issue of e-learning success. In fact, they fulfil the needs of e-learning stakeholders to a certain extent but do not meet all of the requirements. There remain disagreements about the factors that are most influential in measuring e-learning systems’ success. This direction of research has received little attention for developing an overarching model that can assess e-learning systems’ success from different perspectives.
This study aims to fill this void by proposing a comprehensive model for evaluating the success of e-learning. The significance of this study is in identifying the determinant factors and constructs impacting the success of e-learning systems and group these factors in a model that is believed to be holistic because different perspectives are considered in developing the model.
Evaluating the Success of E-Learning Systems
E-learning systems are multidisciplinary systems, for which consensus on their definition has not been achieved (Al Sabaway, 2011; Lee, Choi, & Kang, 2009; Ozkan & Koseler, 2009). Many researchers have evaluated e-learning systems from computer science, information systems, psychology, pedagogy, and technology perspectives.
Various methods, frameworks, and models have been introduced to measure e-learning systems’ success. The contributions to evaluating e-learning systems’ success can be categorized into four such approaches: technology acceptance model (TAM); the DeLone and McLean IS success model (D&M); user satisfaction models; and e-learning quality models.
Technology Acceptance Model (TAM)
TAM is a widely used model in the information system field. It was developed first in 1989 (Figure 1) to measure the success of a new technology in terms of the acceptance and use of this technology. The model presumes that there are factors that impact the users’ decisions when they face a new technology.
 The diagram shows a sequence of connected boxes with arrows. On the left a box labeled External Variables points to two boxes. The first box is Perceived Usefulness with the letter U. The second box is Perceived Ease of Use with the letter E. Perceived Ease of Use points upward to Perceived Usefulness. Both Perceived Usefulness and Perceived Ease of Use point to the next box labeled Attitude Toward Using with the letter A. This box points to the next box labeled Behavioral Intention to Use with the letters B I. Behavioral Intention to Use points to the final box labeled Actual System Use. An additional arrow goes directly from Perceived Usefulness to Behavioral Intention to Use.
TAM model (Davis, 1989).
The diagram shows a sequence of connected boxes with arrows. On the left a box labeled External Variables points to two boxes. The first box is Perceived Usefulness with the letter U. The second box is Perceived Ease of Use with the letter E. Perceived Ease of Use points upward to Perceived Usefulness. Both Perceived Usefulness and Perceived Ease of Use point to the next box labeled Attitude Toward Using with the letter A. This box points to the next box labeled Behavioral Intention to Use with the letters B I. Behavioral Intention to Use points to the final box labeled Actual System Use. An additional arrow goes directly from Perceived Usefulness to Behavioral Intention to Use.TAM model (Davis, 1989).
In the context of e-learning, many studies adopted TAM to evaluate the success of e-learning in the same manner as information systems success (Hayashi, Chen, Ryan, & Wu, 2004; Lee, Choi, et al., 2009; Liaw, 2001; Limayem & Cheung, 2008; Martins & Kellermanns, 2004; McFarland, 2001; Ngai, Poon, & Chan, 2007; Ong & Lai, 2006; Roca, Chiu, & Martínez, 2006; Sánchez & Hueros, 2010; Selim, 2003, 2007; Stoel & Lee, 2003; Wang & Chiu, 2011; Yi & Hwang, 2003). These studies vary between validating and testing the robustness of the model by providing empirical evidence on the existing relationships between model factors, to studies that have changed the model’s constructs and extended it to include factors applicable in the context of e-learning.
From the studies found in the literature, it is evident that TAM is a commonly used model. TAM has been adopted and/or extended to include other factors that influence the acceptance of e-learning. It is concluded from previous research that some factors are more outstanding than others and have a significant impact on the acceptance of e-learning systems, for example, self-efficacy, while others need more investigation, for instance, habit, gender, and perceived resources.
The Delone and Mclean is Success Model (D&M)
The D&M model is a common model that has been used for measuring the success of information systems. It has been extensively cited in academic papers, and reportedly used in over 300 (Delone & McLean, 2003). The D&M model is one of the most important models in information systems. It first appeared in 1992 and was updated in 2003 to include six constructs (Figure 2): system quality, information quality, service quality, use, user satisfaction, and net benefit.
 The diagram shows interconnected boxes with text. On the left three labeled lists connect to quality factors. The first list reads Information is clear, accurate, sufficient, up to date, and exact what is needed. This connects to a box labeled Information Quality. The second list reads Availability, Adaptability, Reliability, Response Time. This connects to a box labeled System Quality. The third list reads Assurance, Responsiveness, Empathy. This connects to a box labeled Service Quality. Information Quality, System Quality, and Service Quality each connect with arrows to two boxes in the center labeled Intention to Use and User Satisfaction. Intention to Use points to a box labeled Use. User Satisfaction also points to Use and connects to Net Benefits. Use connects upward to a box labeled Frequency, Duration, Intensity, Nature, then points to Net Benefits. Net Benefits connects back to User Satisfaction.
Delone and McLean (2003) model of information systems success.
The diagram shows interconnected boxes with text. On the left three labeled lists connect to quality factors. The first list reads Information is clear, accurate, sufficient, up to date, and exact what is needed. This connects to a box labeled Information Quality. The second list reads Availability, Adaptability, Reliability, Response Time. This connects to a box labeled System Quality. The third list reads Assurance, Responsiveness, Empathy. This connects to a box labeled Service Quality. Information Quality, System Quality, and Service Quality each connect with arrows to two boxes in the center labeled Intention to Use and User Satisfaction. Intention to Use points to a box labeled Use. User Satisfaction also points to Use and connects to Net Benefits. Use connects upward to a box labeled Frequency, Duration, Intensity, Nature, then points to Net Benefits. Net Benefits connects back to User Satisfaction.Delone and McLean (2003) model of information systems success.
The D&M model was applicable in the field of e-learning in the same manner (Adeyinka & Mutula, 2010; Almarashded, Noraidah, Azan, & Mukhtar, 2010; Hassanzadeh, Kanaani, & Elahi, 2012; Holsapple & Lee-Post, 2006; Hsieh & Cho, 2011; Klobas & McGill, 2010; Lee & Lee, 2008; Lin & Lee, 2006; Lin, 2007, 2008; Masrek, Jamaludin, & Mukhtar, 2010; Wang & Wang, 2009). The validity of the model has been tested by measuring the success of e-learning as a whole or partially and others have extended this model by including other factors that influence the success of e-learning. Other researchers have combined the model with other models and theories to explore widely the factors affecting the success of e-learning systems (Al Sabawy et al., 2011).
The D&M model has been successfully used for measuring the success of different e-learning systems and most of the studies empirically demonstrated its validity and reliability.
User Satisfaction Models
The user satisfaction approach has been used widely by researchers in the field of e-learning (Kang & Lee, 2010; Leclercq, 2007; Ong & Lai, 2007; Pike Tayles & Abu Mansor, 2010). Sun, Tsai, Finger, Chen, & Yeh (2008) developed a six-construct model to measure e-learning based on learner, instructor, course, technology, design, and environment (Figure 3). The results of the study revealed that learner computer anxiety, instructor attitude toward e-learning, e-learning course flexibility, e-learning course quality, perceived usefulness, perceived ease of use, and diversity in assessments are the critical factors affecting learners’ perceived satisfaction (Sun et al., 2008).
 The diagram shows six labeled boxes on the left, each with a list, all pointing with arrows to a box on the right labeled Perceived e learner satisfaction. The first box is Learner dimension with three items Learner attitude toward computers, Learner computer anxiety, Learner Internet self efficacy. The second box is Instructor dimension with two items Instructor response timeliness, Instructor attitude toward e learning. The third box is Course dimension with two items E learning course flexibility, E learning course quality. The fourth box is Technology dimension with two items Technology quality, Internet quality. The fifth box is Design dimension with two items Perceived usefulness, Perceived ease of use. The sixth box is Environmental dimension with two items Diversity in assessment, Learner perceived interaction with others. All six boxes have arrows pointing to Perceived e learner satisfaction.
Satisfaction model (Sun et al., 2008).
The diagram shows six labeled boxes on the left, each with a list, all pointing with arrows to a box on the right labeled Perceived e learner satisfaction. The first box is Learner dimension with three items Learner attitude toward computers, Learner computer anxiety, Learner Internet self efficacy. The second box is Instructor dimension with two items Instructor response timeliness, Instructor attitude toward e learning. The third box is Course dimension with two items E learning course flexibility, E learning course quality. The fourth box is Technology dimension with two items Technology quality, Internet quality. The fifth box is Design dimension with two items Perceived usefulness, Perceived ease of use. The sixth box is Environmental dimension with two items Diversity in assessment, Learner perceived interaction with others. All six boxes have arrows pointing to Perceived e learner satisfaction.Satisfaction model (Sun et al., 2008).
Ozkan and Koseler (2009) assessed the user’s satisfaction with learning management system (LMS) and proposed a multidimensional model via six dimensions (Figure 4): system quality, information quality, service quality, supportive factors, learner perspective, and instructor attitudes.
 The diagram is titled E Learning Hexagonal Model to evaluate modern training systems and shows a central hexagon connected to six surrounding labeled boxes. The top box is A Social Issues colon Supportive Factors with four items A1 Promotion of L M S comma A2 Trends social political comma A3 Ethical and legal issues comma A4 Cost. The left box is B Social Issues colon Learner Perspective with seven items B1 Learner attitudes toward L M S comma B2 Learner computer anxiety comma B3 Self efficacy comma B4 Enjoyable experience comma B5 Interaction with other students and teacher comma B6 Learner study habits comma B7 Student experience level with L M S. The bottom left box is C Social Issues colon Instructor Attitudes with seven items C1 Responsiveness comma C2 Informativeness comma C3 Fairness comma C4 Encouraging interaction between students comma C5 Courseware technology comma C6 Course management comma C7 Communication ability. The bottom right box is F Technical Issues colon Service Quality with four items F1 Student tracking comma F2 Course information authorization comma F3 Course management comma F4 Knowledgeable. The right box is D Technical Issues colon System Quality with eleven items D1 Easy to use comma D2 Security comma D3 Reliability comma D4 Usability comma D5 Maintainable comma D6 Rich options available comma D7 User friendly comma D8 Well organized comma D9 Availability comma D10 Personalization comma D11 Interactivity. The bottom box is E Technical Issues colon Information Content with nine items E1 Course content management comma E2 Course flexibility comma E3 Interactive content comma E4 Learner assessment quality comma E5 Sufficient content comma E6 Learner assessment material quality comma E7 Maintenance comma E8 Up to dateness comma E9 Well organized.
HELAM (hexagonal e-learning assessment model).
The diagram is titled E Learning Hexagonal Model to evaluate modern training systems and shows a central hexagon connected to six surrounding labeled boxes. The top box is A Social Issues colon Supportive Factors with four items A1 Promotion of L M S comma A2 Trends social political comma A3 Ethical and legal issues comma A4 Cost. The left box is B Social Issues colon Learner Perspective with seven items B1 Learner attitudes toward L M S comma B2 Learner computer anxiety comma B3 Self efficacy comma B4 Enjoyable experience comma B5 Interaction with other students and teacher comma B6 Learner study habits comma B7 Student experience level with L M S. The bottom left box is C Social Issues colon Instructor Attitudes with seven items C1 Responsiveness comma C2 Informativeness comma C3 Fairness comma C4 Encouraging interaction between students comma C5 Courseware technology comma C6 Course management comma C7 Communication ability. The bottom right box is F Technical Issues colon Service Quality with four items F1 Student tracking comma F2 Course information authorization comma F3 Course management comma F4 Knowledgeable. The right box is D Technical Issues colon System Quality with eleven items D1 Easy to use comma D2 Security comma D3 Reliability comma D4 Usability comma D5 Maintainable comma D6 Rich options available comma D7 User friendly comma D8 Well organized comma D9 Availability comma D10 Personalization comma D11 Interactivity. The bottom box is E Technical Issues colon Information Content with nine items E1 Course content management comma E2 Course flexibility comma E3 Interactive content comma E4 Learner assessment quality comma E5 Sufficient content comma E6 Learner assessment material quality comma E7 Maintenance comma E8 Up to dateness comma E9 Well organized.HELAM (hexagonal e-learning assessment model).
In 2010, Naveh, Tubin, and Pliskin conducted a study to investigate students’ use and satisfaction of LMS and the relation between these two factors and organizational factors. According to this study, use and satisfaction are significantly correlated with organizational variables: course content and size, instructor status, and the existence of interactive functionalities like forum showed significant correlation with LMS use. The study also reveals low correlation between course discipline and satisfaction.
E-Learning Quality Models
Different approaches and models have emerged to assess the overall quality of e-learning, for example, MacDonald, Stodel, Farres, Breithaupt, & Gabriel’s (2001) demand-driven learning model (DDLM) (Figure 5).
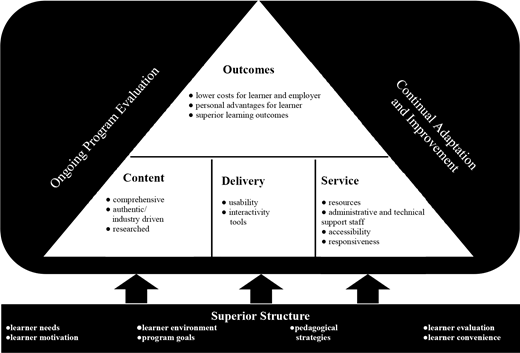
Demand-driven learning model (Macdonald et al., 2001).
Demand-driven learning model (Macdonald et al., 2001).
The demand-driven learning model was developed to evaluate the benefits of web-based learning. It has five main components: the quality standard of “superior structure,” three consumer demands (content, delivery, and service), and learner outcomes (MacDonald et al., 2001).
Another approach to measure the quality of e-learning was introduced by Ehler (2004) based on the learner’s perspective. This study was developed to identify the critical indicators adopted by learners to evaluate the quality of e-learning. The study identified seven main constructs used by learners for assessing the quality of e-learning: tutor support, cooperation and communication in the course, technology, cost-expectations-value, information transparency, course structure, and didactics.
In 2007, Ehlers provide a new model for e-learning quality based on the participation of educational stakeholders. The model identified four dimensions of quality: knowledge, experience, innovation, and analysis.
Pawlowski, Barker, and Okamoto (2007) presented ISO/IEC 19796-1 and compared it with existing approaches of e-learning quality. Abdellatief, Sultan, Jabar, and Abdullah (2011) proposed a model for e-learning quality based on developer’s view with four main measurement indicators service content, system functionality, information technology and system reliability and proposed 11 subcharacteristics with its attributes by following the structure of standard IOS/IEC 912.
Considerable research has focused on measuring e-learning quality and proposing models and indicators for this purpose. However, the complexity and generality of the “quality” concept is an issue encountered by researchers. In addition, the varied e-learning stakeholders put more pressure to identify the measurements most suitable for each group.
Methodology
In order to develop a model for evaluating the success of e-learning systems, we used the constructs of the four models: (D&M) model; TAM; User Satisfaction Models; and E-learning Quality Models. In spite of all their strengths, the four models still have defects (Hassanzadeh et al., 2012), they partially fulfil the needs of e-learning success assessment, and they need to be customized for e-learning areas. In addition, there is still room for improvements and extensions (Marangunic & Granic, 2013). In this article, to propose a more comprehensive model, a synthesis of these previous models is presented.
Conceptual Model
Based on the results and analysis of the literature review, a conceptual model is proposed. The model is believed to be comprehensive for measuring the success of e-learning system. The model is based on six perspectives: quality; usefulness; satisfaction; user attitude; social factors; and benefits of using the system.
The selection of the model constructs is based on the four approaches for evaluating the success of e-learning: DeLone and McLean, TAM, Satisfaction, and Quality approaches and based on their importance in measuring the success of e-learning systems field.
Approach 1: Delone and Mclean Model
In order to build a model for evaluating e-learning systems success we used, first, the D&M model measurements. Because this model was developed to measure information systems success and these systems have no pedagogy theme, it has to be customized for the e-learning area.
The technical quality is another important determinant of the quality of e-learning, and technical problems strongly influence the overall success and satisfaction of users. On the other hand, students are very concerned about the quality of the information (course content) to be clear, easily understandable, appropriate breadth, and has up-to-date content. As a result, a more customized version, to meet the specific needs of the students, is needed.
So we incorporated the Quality construct with four measures (Technical System Quality, Pedagogical System Quality, Information Content, and Service Quality). The System Quality was decomposed into two factors, technical and pedagogical system quality, as suggested by Hassanzadeh et al. (2012) and Ozkan and Koseler (2009) to be appropriate in the context of e-learning.
Technical System Quality is related to technical success of the issues related to the system (DeLone & McLean, 2003) and measured by the indicators in Table 1.
Pedagogical System Quality consists of the quality measures according to the educational functionalities and capabilities that facilitate teaching and learning (Lee 2010; Hassanzadeh et al., 2012), for example, existence of features like chats and forums that facilitate interactivity and communication with other students and instructors. The Table 2 summarized the pedagogical system quality factors.
| 1. Interactivity | Hasanzadeh et al. (2012); Ozkan and Koseler (2009); Lee (2010); Lim, Lee, and Nam (2007); Pituch and Lee (2006); Holsapple and Lee-Post (2006); Basak, Wotto, and Bélanger (2016) |
| 2. Learning styles | AbuSneineh and Zairi (2010); Fresen (2007); Bhuasiri et al. (2012); Khan (2005); Fetaji and Fetaji (2009) |
| 3. Assessment material | Fresen (2007); Cheawjindakarn et al. (2013); Zaiane (2002); Fetaji and Fetaji (2009); Phipps and Merisotis (2000); Basak et al. (2016); Khan (2005) |
Information Quality (Content) is the measure of system semantic success (Delone & McLean, 2003) that is related to the quality of the output (Wang & Wang, 2009) (see Table 3).
The last theme in the Quality construct is Service Quality. The quality of the service delivered through electronic media has received noteworthy attention in the context of e-learning (Al Sabawy, 2012). Four indicators were employed to gauge service delivery quality in e-learning (see Table 4).
Benefits of using the system, in a restricted sense, is the impact of using the e-learning system on an individual or group. This construct assesses the different benefits obtained from using the system. In a broader sense it is the benefit to the organization and community as a whole. For the purposes of developing our model, only benefits of using the system on individuals are considered with three determinants: achieving goals; system loyalty; learning benefits. The broader benefits of using the e-learning systems are beyond the scope of the present study, so it was excluded. Indicators of the benefits construct supported by related studies are presented.
Achieving Goals is one of the components that has a significant role in measuring the success of e-learning and has to be included in our model. It measures the acquisition of skills that influence achieving the personal goals and improving the academic development of students (see Table 5).
| 1. Individual achieving personal goals | Hassanzadeh et al. (2012); Law and Lee (2010); Lin (2008); Antonis, Daradoumis, Papadakis, and Simos (2011); AbuSneineh and Zairi (2010); |
| 2. Academic performance | Fresen (2007); Liaw (2008); Islam (2013); Law and Lee (2010); Lee and Lee (2008) |
System Loyalty is another factor included in our model, which is related to students’ involvement and dependence on the e-learning systems (see Table 6) (Hassanzadeh et al., 2012; Lin & Lee, 2006).
| 1. Dependence on the system | Wang and Liao (2008); Wang et al. (2007); Hassanzadeh et al. (2012); Hsiu-Fen Lin (2008); Lin and Lee (2006); Duan, He, Feng, Li, and Fu (2010); Holsapple and Lee-Post (2006); Lee (2010); Lin (2007) |
| 2. Return to use the system | |
| 3. Suggest to others to use the system |
Learning Benefits are used to measure the student’s performance improvement resulting from using the e-learning system and other benefits of learning in terms of saving students’ time in searching for the information and course materials (see Table 7).
| 1. Improve learning process | Lin (2008); Wang et al. (2007); Parker and Martin (2010); Ho and Dzeng (2010); Wang and Liao (2008); Duan et al. (2010); Sørum (2012) |
| 2. Save time | |
| 3. Systematically manage the learning process |
Approach 2: TAM
In respect to TAM, ease of use, perceived usefulness, and use are considered the major constructs in this model. The evidence presented by previous studies support the selection of the three constructs to measure e-learning system success. Consequently, it was included in this model.
Ease of Use was defined, according to Davis (1989), as “the degree to which an individual perceives using the e-learning system free of effort” (p. 319). In the e-learning era prior researchers adopted “ease of use” as a central determinate of student satisfaction and the success of e-learning systems. Indicators for ease of use are shown in Table 8.
| 1. Interaction is clear and understandable | Davis (1989); Hong, Thong, Tam (2006); Islam (2011); Yi and Hwang (2003); Selim (2003); Ngai et al. (2007); Limayem and Cheung (2008); Lee et al. (2009); Wang and Chiu (2011); Gong and Yu (2004) |
| 2. Interaction does not require a lot of mental effort | |
| 3. Ease in finding the information you want to | |
| 4. Overall, it is easy to use it |
Perceived Usefulness is a construct employed in this model to predict different factors. It was defined as “The degree to which a person believes that using a particular system would enhance his or her job performance” (Davis, 1989, p. 319). Empirical research has showed the reliability of this construct as a predictor of intention to use. Davis (1989), Joo, Lim, and Kim. (2011), Drennan, Kennedy, and Pisarski (2005), and Hsieh and Cho (2011) found that perceived usefulness had the strongest effect on student satisfaction among the factors that predicted this construct. Table 9 shows the determinants used to gauge this construct.
| 1. Using the model is of benefit to the student | Davis (1989); Limayem and Cheung (2007); (2006); Islam (2011); Toral, Barrero, and Martínez-Torres (2007); Roca et al. (2006); Martinez-Torres et al. (2008); Gong and Yu (2004) |
| 2. The advantages outweigh the disadvantages | |
| 3. Overall the system is advantageous |
Intention to Use is an attitude toward using the system (Davis, 1989; DeLone & McLean, 2003) and is defined as the users’ decision to use the system before actually doing so (Hassanzadeh et al., 2012). Table 10 lists details of some studies that targeted identifying the intention to use in the context of e-learning.
| 1. Belief that use of the system is worthwhile | Davis (1989); Lin (2008); Selim (2007); Hassanzadeh et al. (2012); Roca et al. (2006); Gong and Yu (2004). |
| 2. Tendency to use the system |
Approach 3: Satisfaction
User Satisfaction is a fundamental measurement in the success and acceptance of technology. Several studies considered satisfaction as a single construct to evaluate the success of an e-learning system (DeLone & McLean, 2003) or as multiple constructs; (Sun et al., 2008; Ozkan & Koseler, 2009). It was found that user satisfaction is a valuable learner’s attitude construct to incorporate in our model that was validated and supported by several studies (see Table 11).
| 1. Satisfaction with system performance | DeLone and McLean (2003); Wang et al. (2007); Wu, Tennyson, Hsia, and Liao (2010); Holsapple and Lee-Post (2006); Lee (2010); Bolliger et al. (2010); Sun et al. (2008); Ozkan and Koseler (2009); Chen and Jang (2010); Oztekin et al. (2010) |
| 2. Users being pleased with system |
Social Factors have been considered an important construct in measuring the success of e-learning. Ozkan and Koseler (2009) considered e-learning systems as a sociotechnical entities and the success of e-learning as a combination of “social issues” and “technical issues” and other circumstances. Previous research supported e-learning as social entity being an important indicator for successful systems (Liaw et al., 2007; Selim, 2007; Wang et al., 2007). The technical part in our model is covered in the quality construct adopted from the DeLone and McLean model. Accordingly, social factors with three major determinants (learners, instructors, and supportive issues) are added to our model (see Tables 12 and 13).
| Learners’ Perspective | |
|---|---|
| 1. Attitude toward e-learning | Selim (2007); Ozkan and Koseler (2009); Roca et al. (2006); Law and Lee (2010); Chen and Yeh (2008); Liaw et al. (2007); Piccoli et al. (2001); Ozkan and Koseler (2009) |
| 2. Computer anxiety | Bowdish, Chauvin, and Vigh (1998); Piccoli et al. (2001); Zaharias and Poulymenakou (2003); Hayashi, Chen, Ryan, and Wu (2004); Webster and Hackley (1997); Sun et al. (2008); Ozkan and Koseler (2009) |
| 3. Self-efficacy | Ozkan and Koseler (2009); Picolli et al. (2001); Zaharias and Poulymenakou (2003); Granic (2008); Hiltz and Johnson (1990); Sun et al. (2008) |
| 4. Experience with e-learning | Ozkan and Koseler (2009); Rosenberg (2006) |
| Instructors’ Perspective | |
|---|---|
| 1. Attitude toward e-learning | Sun et al. (2008); Ozkan and Koseler (2009) |
| 2. Responsiveness | Sun et al. (2008); Ozkan and Koseler (2009) |
| 3. Encouraging interaction between students | Liu and Cheng (2008); Wu et al. (2008); Ssemugabi and Villiers (2007); Ozkan and Koseler (2009) |
| 4. Teaching style | Selim (2007) |
| 5. Control over technology | Volery and Lord (2000); Webster and Hackley (1997) |
| 6. Course management | Dillon and Gunawardena (1995) |
| 7. Communication ability | Picolli et al. (2001); Levy (2007) |
Approach 4: Quality Models
As mentioned earlier in this article, quality of e-learning is a complicated concept and metrics for measuring the quality of e-learning are diverse based on different perspectives of different stakeholders. A significant contribution to measure the quality of e-learning, which has been presented by several researchers and has been tested and confirmed in studies, are the supportive issues which are incorporated in our model as “support factors” under social factors construct based on the model proposed by Ozkan and Koseler (2009) (see Table 14).
| Support Factors | |
|---|---|
| 1. Access to library materials | Selim (2007); Khan (2005); AbuSneineh and Zairi (2010); Govindasamy (2001); Oliver (2001); Antonis et al. (2011); Fetaji and Fetaji (2009); Cheawjindakarn et al. (2013) |
| 2. Support from technicians | |
| 3. Support from university | |
| 4. Infrastructure availability | |
| 5. Ethical-legal issues |
Another important factor presented under the fourth approach is Academic Performance, which was employed in the Lee and Lee (2008) model. Academic performance is included in our model under the Benefits as suggested by (Hassanzadeh et al., 2012; Lee & Lee, 2008).
Proposed Model
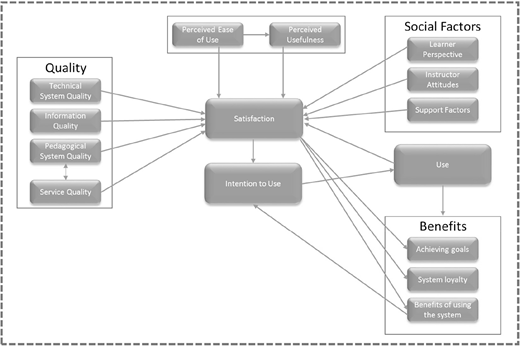
According to previous studies on e-learning and the performed analysis, the constructs, factors, and relations between model constructs were identified. As a result, a model for evaluating the e-learning systems success EESS is presented (Figure 6).
Conclusion and Future Research Direction
This study has proposed a model for evaluating e-learning systems success (EESS) encompassing a collective set of measures associated with e-learning systems. In this article, we have proposed a comprehensive model based on different perspectives in relation to quality, usefulness, social factors, user satisfaction, attitude, and benefits of using the e-learning systems. However, several researchers confirmed, “the success of e-learning is a multidimensional and interdependent construct” (Delone & McLean, 2003) and it is essential to examine the interrelationships between these constructs (Hassanzadeh et al., 2012; Ozkan & Koseler, 2009) in more detail. Therefore, future research efforts will be conducted to focus on and test the relationships between the proposed model constructs within the context of e-learning. Another future endeavor will be to check the validity of the model on learning management systems.
The EESS model is not a fixed and unchanged model and is subject to further and continuous developments. Future research may extend this model through adding the organizational perspective and other indicators to cope with the continuous development and changes in the e-learning field. In this regards, the EESS model is composed of the major constructs and factors which are basics for successful evaluation of e-learning. In conclusion, 52 measures grouped under 7 constructs for measuring the success of e-learning systems will be of great benefit to those involved in e-learning as a guidance to gain a better understanding of the issues related to evaluating the success of e-learning systems.
The EESS model has 52 measures grouped under 7 constructs for measuring the success of e-learning systems.
About the authors