This study aims to develop a technology acceleration model for fuel cell electric vehicle (FCEV) adoption that aligns with the diffusion of electric vehicle (EV) technology and to formulate integrated policy recommendations and development strategies to optimize the roles of EVs and FCEVs within Indonesia’s transportation energy transition framework.
This study adopts a system dynamics approach, combining qualitative and quantitative methods. A causal loop diagram is developed using a qualitative approach, drawing on insights from focus group discussions and interviews with stakeholders, including government, universities, associations and technology providers, to capture feedback structures and dynamic hypotheses. The model is then formalized as a stock-flow diagram to represent the system’s quantitative structure, incorporating interactions among the policy and regulatory, market and economic, technological and infrastructural and environmental dimensions.
The findings indicate that Indonesia’s transportation energy transition follows a gradual and managed technological coexistence pathway rather than an immediate substitution process. Internal combustion engine (ICE) vehicles progressively decline due to increasing regulatory, environmental, economic, market and technological pressures, while EVs become the key bridging technology in the short to medium term, supported by experience effects, cost reductions and charging infrastructure development. Meanwhile, FCEVs emerge as a complementary long-term low-carbon option, particularly for specific passenger transport segments, although their adoption depends on the simultaneous growth of hydrogen production and refueling infrastructure. The scenario analysis demonstrates that increasing the attractiveness of EVs and FCEVs through incentives, tax policies and infrastructure support, combined with reducing ICE competitiveness through higher fuel prices, subsidy reductions and carbon policies, can accelerate the transition process between 2020 and 2035. As a result, ICE vehicle dominance decreases to approximately 15%–20%, while EVs become the dominant technology with a share of around 60%–75%, and FCEVs gradually expand as supporting technologies. This transition is highly influenced by financial and policy mechanisms, including subsidies, tax reductions, import duty exemptions, preferential financing, hydrogen infrastructure investment, carbon pricing and fuel tax reforms that collectively enhance the competitiveness of low-emission transportation technologies and reduce fossil fuel dependency.
Several limitations should be acknowledged. First, the model is designed for conceptual exploration and policy learning rather than precise forecasting. Parameter values are based on literature synthesis, expert judgment and stylized assumptions, which may not fully capture future technological breakthroughs or disruptive policy shifts. Second, the analysis operates at a national aggregate level, potentially obscuring regional heterogeneity in infrastructure availability, consumer behavior and industrial structure across Indonesia. Third, social dimensions such as equity impacts, behavioral heterogeneity and distributional effects are represented in a simplified manner. Finally, international dynamics – including hydrogen trade, technology spillovers and geopolitical influences – are not explicitly modeled, despite their potential relevance for long-term hydrogen development.
From a policy and managerial perspective, the findings underscore the structural fragility of technology-exclusive transition strategies. Policymakers should avoid prematurely locking the transportation system into a single dominant pathway and instead adopt portfolio-based governance that aligns EV and hydrogen deployment with application-specific needs and infrastructure readiness. Key leverage points identified by the model include coordinated infrastructure co-development, credible long-term policy signaling and technology-neutral yet use-case-specific regulation. For instance, prioritizing hydrogen deployment in freight corridors, public transport fleets and long-haul logistics can maximize system efficiency while avoiding redundant investment in charging infrastructure. For industry actors, the results emphasize the importance of ecosystem coordination among vehicle manufacturers, energy suppliers and infrastructure providers, as isolated investments are unlikely to overcome systemic barriers. For developing countries such as Indonesia, where capital constraints and institutional capacity shape transition pathways, strategic sequencing emerges as a pragmatic approach. Leveraging EVs to deliver early emission reductions while simultaneously preparing hydrogen ecosystems for future deployment can enhance transition resilience and reduce the risk of stranded assets or policy reversals.
This study contributes to the literature by introducing a dynamic multitechnology framework that integrates ICE, EV and FCEV within a unified system dynamics model. From a theoretical perspective, it advances the understanding of sociotechnical transitions by extending system dynamics applications to a multitechnology context, explicitly capturing feedback loops, path dependency and interactions among technology, policy, market and environmental dimensions. Unlike prior studies that focus on single-technology transitions, this research emphasizes the importance of coexistence and interaction among technologies and key system components, namely, technology and infrastructure, policy and regulation, economy and markets and environmental factors – and can be generalized, particularly in developing-country contexts. The findings provide policy-relevant insights for designing resilient, adaptive and diversified energy transition strategies in Indonesia.
1. Introduction
The global energy transition is a structural transformation of energy systems aimed at reducing greenhouse gas emissions by shifting from fossil fuels to low-carbon and renewable energy sources (Jaccard, 2020). Within this transition, the transportation sector plays a critical role, as it remains a major contributor to global emissions (Nicholas and Hall, 2018). Decarbonization of transport is therefore increasingly pursued through the transition from internal combustion engine (ICE) vehicles to low-emission alternatives, particularly battery-electric vehicles (BEVs) and hydrogen fuel cell electric vehicles (FCEVs) (Intergovernmental Panel on Climate Change, 2022). This shift has been driven by regulatory pressure, technological progress, infrastructure development and growing environmental awareness (Hawkins et al., 2013).
Despite global momentum toward vehicle electrification, the pace of transition varies significantly across countries (International Energy Agency, 2023). In Indonesia, ICE vehicles continue to dominate the automotive market, accounting for more than 95% of light-vehicle sales in the early 2020s. While EV adoption has increased since 2023–2024, growth has primarily occurred through gradual market share erosion rather than a substantial decline in absolute ICE sales (Association of Indonesian Automotive Industries, 2024). This slower transition reflects structural barriers, including high EV purchase prices, limited charging infrastructure, strong consumer preference for established ICE technologies and cautious energy transition policies (Rezvani et al., 2015). Consequently, Indonesia’s transportation sector remains in an intermediate transition phase, characterized by an ICE market plateau rather than rapid displacement.
Although EV deployment aligns with Indonesia’s Net Zero Emissions 2060 commitment, EVs increasingly function as a transitional or bridging technology rather than a complete decarbonization solution (Miotti et al., 2017). Life-cycle assessments indicate that EVs can significantly reduce greenhouse gas emissions and local air pollution, particularly in urban environments (Hawkins et al., 2013). However, their environmental benefits depend heavily on electricity generation mixes that remain partially fossil-based, as well as on unresolved challenges related to battery production, critical mineral extraction and end-of-life waste management (Elgowainy et al., 2010). These limitations suggest that relying solely on EVs may not fully achieve long-term transport decarbonization in emerging economies.
Within this context, FCEVs have emerged as a complementary low-emission pathway. Compared to BEVs, FCEVs offer advantages in driving range, refueling time and suitability for long-distance and high-utilization applications (International Energy Agency, 2021). Hydrogen can be produced from diverse pathways, including renewable electricity, enabling integration with broader low-carbon energy systems (Balat, 2008). Moreover, FCEVs require smaller battery capacities than BEVs, potentially reducing environmental pressures associated with battery material supply chains (Dincer and Acar, 2015). Nevertheless, their overall environmental performance depends critically on the availability of low-carbon hydrogen, as fossil-based hydrogen production undermines emission reduction benefits (Dincer and Acar, 2015).
The transition toward sustainable mobility in developing countries has become a major focus of global research, alongside the increasing integration of BEVs and hydrogen fuel cell technologies (Sarasi et al., 2025). The application of a system dynamics (SD) modeling approach is considered crucial for understanding this energy transition because it can capture the complex interactions among government policies, supporting infrastructure and the limitations of primary resources (Gamboa-Rosales, 2023). Previous studies have demonstrated that SD models can map the causal relationships among fiscal subsidies, infrastructure expansion and technology adoption to identify strategic leverage points within the electric vehicle (EV) ecosystem (Pamungkas and Setiawan, 2025).
Despite increasing scholarly attention to EVs and FCEVs, most existing studies remain concentrated in developed economies such as the USA, Germany, Japan and South Korea, where charging infrastructure, electricity reliability, industrial capabilities and policy incentives are relatively mature (Liu et al., 2020). In contrast, developing countries such as Indonesia face different structural conditions, including uneven infrastructure availability, continued dependence on fossil fuels, limited domestic manufacturing capacity and greater sensitivity to investment costs and energy subsidies. Consequently, findings from developed-country contexts may not be fully applicable to emerging economies with distinct institutional, economic and energy system characteristics (Steele and Heinzel, 2001). In addition, previous studies generally evaluate transportation technologies from a single-technology perspective (Sarasi et al., 2025), with limited attention to the interaction and complementary roles of EVs and FCEVs within broader transportation energy transition pathways (International Renewable Energy Agency (IRENA), 2022). These gaps are particularly relevant for Indonesia, where transportation energy demand continues to grow alongside commitments to emission reduction and net-zero targets. Although hydrogen has increasingly entered national energy discussions, hydrogen mobility policies remain fragmented and largely conceptual, with limited analytical assessment of infrastructure readiness, market formation and technological deployment pathways (Ball and Weeda, 2015). Such conditions may hinder the effectiveness and timing of hydrogen development strategies in developing-country contexts.
To address these issues, this study develops an endogenous SD model that integrates ICE, EV and FCEV technologies within a unified analytical framework. The model captures dynamic interactions among policy, market, technological and environmental factors to understand transportation energy transitions in Indonesia. Specifically, the study aims to: analyze the interactions among ICE, EV and FCEV technologies; evaluate how key drivers influence hydrogen vehicle adoption; and assess the complementary potential of EVs and FCEVs in supporting low-carbon mobility transitions. Unlike prior studies that primarily focus on single-technology transitions (Sarasi et al., 2025), the proposed framework emphasizes the coexistence and interaction of multiple technologies, stakeholders, market conditions and policy interventions. By integrating stakeholder-based modeling with policy-oriented analysis, this study contributes a broader perspective on transportation decarbonization in developing-country contexts, where infrastructure constraints, investment priorities and institutional conditions differ from those of developed economies. Furthermore, the framework may apply to other developing countries with comparable socioeconomic, infrastructural and policy characteristics, thereby extending the study’s relevance beyond the Indonesian case.
2. Literature review
Literature on transportation energy transitions in developing countries indicates that the decline of ICE vehicles rarely occurs through rapid or absolute technological replacement (Gnann et al., 2018). Constraints related to affordability, fuel availability and refueling infrastructure, as well as perceptions of technological reliability, slow the adoption of alternative vehicle technologies compared to those in developed economies (Rezvani et al., 2015). As a result, transitions away from ICE in countries such as Indonesia tend to unfold through gradual erosion of market share rather than abrupt substitution, leading to prolonged periods of technological coexistence.
Research on EVs has expanded rapidly over the past decade, with EV adoption often framed as a response to policy incentives, declining battery costs and environmental pressures (Plötz et al., 2017). However, much of this literature continues to position EVs primarily as substitutes for ICE vehicles, with limited attention to the medium-term dynamics of multiple technologies coexisting within the same transportation system (Sovacool et al., 2020). Sociotechnical transition theory emphasizes that transportation system change is a multilevel process shaped by interactions among niche innovations, dominant regimes and broader landscape pressures (Geels, 2002; Geels and Schot, 2007). Within this framework, ICE represents a relatively stable, dominant regime, while EVs and more advanced technologies, such as FCEVs, remain niche technologies that depend heavily on policy support and infrastructure readiness (Holladay et al., 2009; Association of Indonesian Automotive Industries, 2024).
SD studies further demonstrate that transitions in vehicle technologies are governed by feedback mechanisms linking policy intervention, technology costs, consumer behavior and market penetration. Reinforcing feedback loops can accelerate the diffusion of new technologies, while balancing loops – such as infrastructure constraints or cost barriers – may slow adoption and delay transition outcomes (Lin et al., 2013). These dynamics reinforce the view that low-carbon transportation transitions are better understood as processes of gradual system reconfiguration rather than instantaneous technological substitution (Geels et al., 2017).
Energy transition literature broadly characterizes transitions as complex structural transformations shaped by interactions among technological innovation, policy frameworks, market structures and actor behavior (Markard et al., 2012). In the transportation sector, the long-standing dominance of ICE vehicles has produced a deeply embedded technological regime, resulting in extended coexistence with emerging alternatives (Shepherd et al., 2012). Within this context, recent studies increasingly position FCEVs as complementary technologies rather than direct competitors to EVs. FCEVs offer advantages for long-distance travel, heavy-duty transport and applications requiring fast refueling, thereby addressing limitations of EVs and contributing to greater system resilience (Ogden et al., 2016)
Policy and regulation are consistently identified as critical determinants in enabling early-stage low-carbon transportation technologies (International Energy Agency, 2023). Without strong and sustained policy intervention, emerging technologies tend to remain confined to niche markets due to high costs, market uncertainty and insufficient infrastructure (Geels et al., 2017). In developing country contexts, narrowly focused policies that prioritize a single technology risk create new forms of technological lock-in and systemic imbalance (Sovacool, 2021). Diversified policy strategies that include FCEVs alongside EVs are therefore increasingly viewed as essential for enhancing transition resilience under conditions of infrastructure and investment constraints (McKinsey and Company, 2021).
From a market perspective, technological adoption depends on the interaction between technology-push and demand-pull mechanisms, with consumer acceptance playing a central role (Yeh et al., 2021). Adoption decisions are influenced not only by economic considerations but also by perceived technological compatibility, environmental awareness, social norms and evolving consumer identities (Axsen et al., 2016; Sovacool et al., 2018). Technological and infrastructural readiness further shape adoption trajectories. While EV competitiveness has benefited from advances in technology performance and cost reductions (Rogers, 2003), FCEV development remains constrained by challenges across the hydrogen value chain, including low-carbon hydrogen production, fuel cell efficiency and the availability of refueling infrastructure (Ogden et al., 2016). Together, these factors underscore that successful FCEV development depends not only on technology and policy readiness but also on the alignment of market structures, infrastructure systems and societal acceptance within a broader energy transition framework (Gaines, 2018). Tax incentives play a significant role in accelerating technology adoption and expanding the market penetration of new products (Supriyatin et al., 2019).
From an environmental perspective, environmental awareness plays a vital role in shaping social acceptance of clean technologies. Sociotechnical studies indicate that sustainable adoption depends on aligning with societal values and promoting behavioral change (Geels et al., 2017). Pro-environmental behavior is affected by awareness, moral values and perceived effectiveness. In practice, environmental concerns often serve as an initial trigger for EV adoption, but final decisions are still influenced by economic and practical factors (Hardman et al., 2016).
Building on the existing literature, this study introduces a novel shift in analytical focus from single-technology substitution to a dynamic, multitechnology coexistence framework for transportation energy transitions in developing countries. While prior studies largely examine EVs as direct replacements for ICE vehicles (Hardman et al., 2016), this research explicitly incorporates the ICE, EV and FCEV ecosystems within a unified SD model, capturing endogenous interactions among policy, market forces, technology readiness, infrastructure constraints and consumer behavior. By positioning hydrogen-based mobility as a complementary component of the transition rather than a standalone substitute, the study addresses a critical gap in the literature and provides policy-relevant insights for managing prolonged technological coexistence and enhancing transition resilience in contexts such as Indonesia.
Several studies have used SD approaches to analyze the interactions and transitions among ICE, EV and FCEV transportation systems. SD is particularly well-suited to studying transportation energy transitions because it captures nonlinear interactions, feedback loops, infrastructure dependencies, policy interventions and long-term behavioral changes within complex socio-technical systems (Sterman, 2000). Past research has used this method to examine EV adoption driven by charging infrastructure availability, reductions in battery costs, fuel prices and government incentives (Zhan et al., 2024; Shepherd et al., 2012). More recent work extends this view by incorporating hydrogen pathways and FCEV development into comprehensive transportation transition models, emphasizing the interdependence among adoption, hydrogen production capacity, refueling infrastructure and policy support (Li et al., 2022). In developing countries, SD modeling has also been used to explore how competing and complementary relationships among ICE, EV and FCEV technologies evolve amid infrastructure challenges, market uncertainty and institutional constraints (Wang et al., 2019). Overall, these studies indicate that transportation energy transitions are dynamic, path-dependent processes, where multiple technologies may coexist for long periods before a low-carbon dominant emerges (Vikström et al., 2013).
3. Research methodology
3.1 Research stages
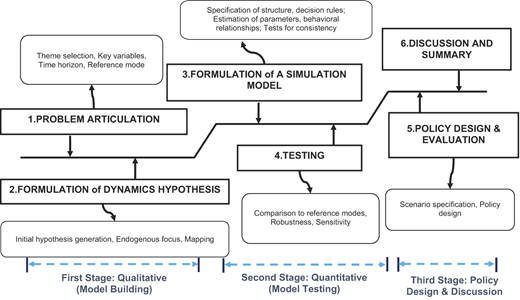
This research uses a mixed-method SD approach to analyze the long-term dynamics of transportation energy transitions. The study is conducted in three stages: model building, model testing and policy design and discussion.
In model building: the first stage of SD, problem articulation defines the research problem, identifies key variables, establishes the time horizon and analyzes historical behavior patterns. The second stage, formulation of a dynamic hypothesis, develops an initial explanation of system behavior by identifying endogenous factors, causal relationships and feedback mechanisms. These stages provide the conceptual foundation for defining system boundaries and developing a simulation model that explains dynamic changes over time.
In model testing: the third stage, formulation of simulation model, translates the conceptual hypothesis into a quantitative model by defining structures, equations, parameters and assumptions. The fourth stage, testing, evaluates model validity and reliability through comparison with historical data, extreme-condition testing and sensitivity analysis. These stages ensure that the simulation model accurately represents system behavior and produces reliable insights for decision-making.
In policy design and discussion, the stage emphasizes model interpretation and policy scenario discussion, deriving policy-relevant insights. This framework enables a structured analysis of transportation energy transition pathways while maintaining analytical rigor and capturing system complexity. The overall framework is illustrated in Figure 1.
A qualitative system-oriented perspective is adopted, supported by data, methodological and theoretical triangulation to enhance validity and reduce bias (Denzin, 2017; Creswell and Clark, 2018). A 360-degree approach is also applied to capture perspectives from multiple stakeholders across the transportation energy value chain (Denzin and Lincoln, 2011). Primary data are collected through focus group discussions (FGDs) and in-depth interviews, complemented by secondary data and a literature review. The quantitative analysis uses a stock flow diagram (SFD) within an SD framework, where variables from the causal loop diagram (CLD) are translated into stocks, flows and auxiliary variables to simulate system behavior over time. The model incorporates feedback loops, policy interventions, infrastructure availability, cost dynamics and environmental factors that affect technology adoption, while diffusion functions and learning-curve mechanisms capture nonlinear adoption patterns and cost reductions (Sterman, 2000).
Model parameters were estimated from secondary data, literature and stakeholder inputs, with historical data used for calibration and expert input applied where empirical data were limited. The model was validated through structure, dimensional consistency, behavior reproduction and extreme-condition tests by comparing simulations with historical behavior and assessing logical responses under boundary conditions, ensuring model consistency and validity before scenario analysis.
3.2 Qualitative method
3.2.1 Problem articulation and model boundary diagram.
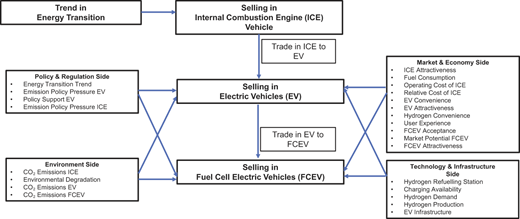
Consistent with the literature on gradual technological coexistence and multiphase energy transitions, accelerating EV adoption not only increases electrification but also creates enabling conditions for the diffusion of more advanced technologies such as FCEVs in subsequent phases (Geels et al., 2017). As FCEVs expand, market dynamics may shift, with hydrogen vehicles partially suppressing new EV sales while increasing the supply of used EVs, reflecting technology substitution and market cannibalization before full saturation (Nykvist and Nilsson, 2015). These nonlinear interactions among technology, policy, consumer behavior and vehicle life cycles motivate the use of an SD approach, operationalized through a model boundary diagram Figure 2, to define endogenous structures and exogenous drivers shaping FCEV development (Forrester, 1961; Sterman, 2000).
3.2.2 Focus group discussion and stakeholder engagement.
The research was conducted during 2025–2026 through a series of in-person stakeholder engagement sessions in Jakarta, Indonesia, aimed at identifying the key variables, causal relationships, feedback structures and leverage points influencing the transportation energy transition. Approximately 20 participants representing government, industry, academia, renewable energy associations, consumer communities, media and the PERTAMINA Group contributed to the study through FGDs and in-depth interviews, as shown in Table 1. These engagements supported the development of a CLD that captures the interactions among policy, technology, market, infrastructure and environmental dimensions within the transportation energy system. Each stakeholder group provided domain-specific insights, including regulatory perspectives, investment and market dynamics, technological readiness, infrastructure development, environmental sustainability and consumer behavior.
Prior to the FGD, stakeholder mapping was conducted to ensure balanced representation across eight stakeholder groups. The research team prepared facilitation materials, including preliminary frameworks, guiding questions and discussion templates to support the identification of system variables and feedback mechanisms. The FGD, held in Jakarta in September 2025, applied a structured participatory approach beginning with an introduction to the research objectives, system boundaries and key concepts in SD, such as reinforcing and balancing loops.
The discussion process focused first on identifying major variables affecting the transportation energy transition, including policy frameworks, technology readiness, infrastructure availability, market conditions, environmental targets and user behavior. Participants then explored causal relationships among these variables by identifying the direction of influence and feedback interactions. Through an interactive mapping process, the initial CLD was collaboratively constructed to illustrate the system’s dynamic structure.
Following the FGD, the CLD underwent a collaborative review and refinement process to verify causal directions, improve variable definitions and identify missing relationships. Outputs from the discussions were documented through notes and visual mapping, after which the research team synthesized overlapping variables and clarified ambiguities. A thematic coding approach was applied to categorize findings into four dimensions: policy, technology, market and environment. The refined CLD was subsequently validated by selected experts representing different stakeholders to ensure the completeness and accuracy of the causal relationships. This iterative validation process strengthened the credibility and robustness of the conceptual model, which later served as the foundation for the SD model used in the subsequent analysis.
3.2.3 Dynamics hypothesis development.
In this study, the dynamic hypothesis posits that the development of hydrogen mobility and FCEVs is driven by dynamic interactions among policy and regulatory frameworks, hydrogen technology and infrastructure readiness, environmental pressures and consumer behavior and perceptions (Wilson, 2012). These interacting forces jointly shape the pace and direction of hydrogen mobility acceleration within the transportation energy transition, as shown in Table 2 below.
3.2.4 Causal loop diagram.
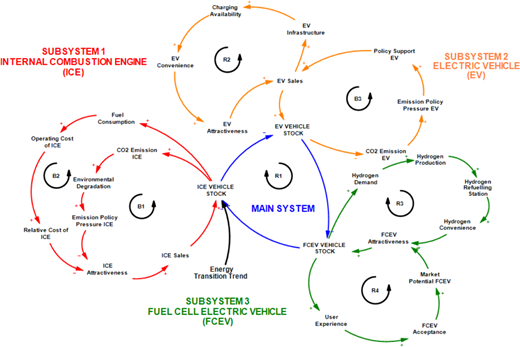
Based on the formulated dynamic hypothesis, the transportation energy transition system is represented using a CLD to capture the causal structure and feedback mechanisms governing system behavior over time. Within the SD framework, CLDs are used to test the internal coherence of dynamic hypotheses, identify reinforcing and balancing feedback loops and explain observed system behavior as the outcome of endogenous interactions rather than exogenous drivers (Forrester, 1961; Sterman, 2000). In this study, as shown in Table 3 and Figure 3, the CLD provides a conceptual foundation for subsequent stock-and-flow formulation by clarifying how interactions among political and regulatory frameworks, technology and infrastructure readiness, market responses and consumer behavior collectively shape the evolution of the FCEV ecosystem within the broader transportation energy transition. As emphasized by Vennix et al. (1996) and Sterman (2000), CLDs also function as analytical and communicative tools that facilitate shared understanding among stakeholders and validate model structure prior to quantitative simulation.
3.2.4.1. Main system loop.
The main system loop (R1) captures the interaction among ICE, EV and FCEV stocks. As the energy transition progresses, a decline in ICE stock weakens historical lock-in effects and reduces the dominance of incumbent technologies, thereby enabling the expansion of EVs and FCEVs. This transition is mediated by interrelated political and regulatory, market and economic, technological and infrastructure and environmental factors that jointly influence consumer preferences, investment decisions and technology diffusion.
3.2.4.2. Subsystem 1 – internal combustion engine subsystem.
The ICE subsystem represents a dominant but declining technological regime characterized by strong path dependency and increasing exposure to transition pressures. Loop B1 captures environmental pressure, where increased ICE stock raises CO2 emissions and environmental degradation, triggering stricter emission standards and fiscal disincentives that reduce ICE attractiveness. Loop B2 represents economic pressure arising from higher fossil fuel consumption, price volatility and external costs, increasing operating costs relative to electric alternatives.
3.2.4.3. Subsystem 2 – electric vehicle subsystem.
The EV subsystem functions as a bridging regime that expands rapidly during the early-to-mid phases of the transition, particularly in urban and light-duty vehicle segments. Loop R2 illustrates the co-evolution of EV adoption and charging infrastructure development: increased EV sales stimulate infrastructure investment, reducing range anxiety and improving convenience. However, EV growth is moderated by balancing loop B3, in which declining transport emissions reduce policy pressure and incentives as environmental targets are approached, potentially slowing adoption in later phases.
3.2.4.4. Subsystem 3 – fuel cell electric vehicle subsystem.
The FCEV subsystem is positioned as a long-term complementary regime, particularly suited to long-distance travel and heavy-duty transport applications. Reinforcing loop R3 captures the classic hydrogen ecosystem chicken-and-egg dynamic: growth in FCEV stock increases hydrogen demand, stimulating hydrogen production and the deployment of hydrogen refueling stations (HRS), which improves convenience and attractiveness. Reinforcing loop R4 reflects market acceptance and perception effects, where higher FCEV stock enhances user experience and strengthens its association with advanced green lifestyles.
3.3 Quantitative method
3.3.1 Stock and flow diagram.
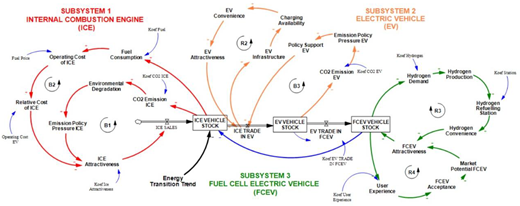
Based on the previously developed CLD, the research model is formalized as a stock and flow diagram (SFD) to represent the system’s quantitative structure. The SFD explicitly defines stocks, flows and functional relationships governing dynamic behavior over time, enabling transparent simulation analysis. Stocks represent key accumulative states, such as FCEV adoption, hydrogen infrastructure capacity and technology readiness, while flows capture adoption, deployment and capacity-expansion processes. All relationships remain consistent with the CLD, allowing the model to reproduce reference modes and serve as the analytical basis for simulation and policy scenario evaluation, as shown in Figure 4 and Table 4 below.
The model’s fundamental structure follows the standard SD formulation, in which changes in stock variables are determined by the net difference between inflows and outflows over time. All model parameters and variables are quantified using secondary data obtained from reliable sources, such as government statistics, international databases and relevant literature. The model will be simulated over a defined time horizon, using discrete steps to capture system evolution and long-term trends.
The SFD offers a quantitative view of the dynamic interactions driving the transportation energy transition system. It translates the conceptual structure in the CLD into a formal simulation framework. The model tracks the accumulation of stocks for ICE, EV and FCEV, which change over time through inflows such as vehicle sales and technology adoption and outflows such as technology switching and market substitution. The results emphasize that system behavior is controlled by interconnected feedback loops linking policy actions, cost changes, infrastructure growth and consumer acceptance. Reinforcing loops tied to EV learning effects and infrastructure expansion speed up early adoption, while balancing mechanisms such as cost constraints and reduced policy incentives slow down long-term growth. Likewise, the FCEV subsystem exhibits strong path dependence, in which hydrogen demand, production capacity and refueling infrastructure must develop together to overcome initial barriers. The SFD framework further shows that transitions are not straightforward but arise from cumulative interactions among subsystems, resulting in phased, overlapping diffusion patterns across ICE, EV and FCEV technologies. This quantitative structure provides a solid foundation for simulation and scenario analysis, allowing for the assessment of alternative policy options and supporting more informed decision-making in Indonesia’s transportation energy transition.
3.4 Model testing and analysis
According to Sterman (2000), testing is the process of evaluating and validating a simulation model to ensure it accurately represents real-world systems. Sterman (2000) emphasized that model testing must be conducted systematically to examine the validity of the model’s structure, underlying assumptions and resulting behavior. Several approaches can be used to perform model testing.
3.4.1 Stage 1: structure validation test.
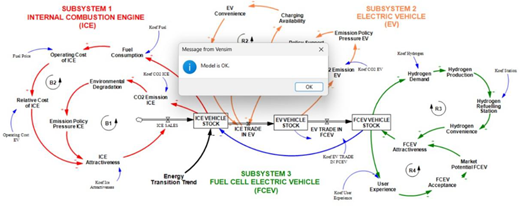
The structure validation test is conducted to ensure that the model structure, including stock–flow relationships, causal loops and the equations used, is consistent with established theory, empirical evidence and expert knowledge of the real-world system. This stage aims to validate that the constructed model accurately reflects the underlying mechanisms and causal relationships before proceeding to further quantitative testing. As shown in Figure 5, the results indicate that the model structure is valid and acceptable (model is OK).
3.4.2 Stage 2: Dimensional consistency test.
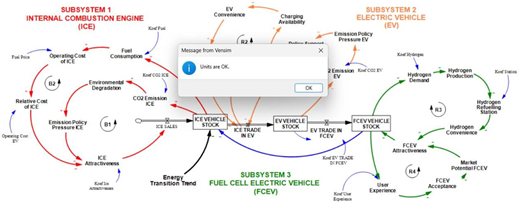
The dimensional consistency test is conducted to ensure that all equations in the model maintain unit consistency. Every mathematical relationship must preserve dimensional alignment between input and output variables. This test serves as a minimum requirement for the model’s mathematical validity, helping prevent calculation errors and ensuring that the model formulation is logically and scientifically sound before use for simulation and further analysis. As shown in Figure 6, the results indicate that the units are consistent (unit is OK).
3.4.3 Stage 3: Behavior reproduction test.
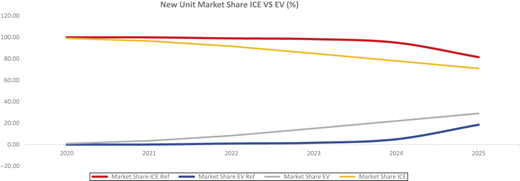
The behavior reproduction test is conducted to evaluate the model’s ability to replicate historical behavior patterns or key dynamics observed in the real-world system. This test compares simulation outputs with available historical data or empirical trends as a reference mode to assess how accurately the model represents actual system behavior. The results of this test serve as a critical indicator of the model’s reliability before it is used for scenario analysis or policy formulation, as shown in Figure 7.
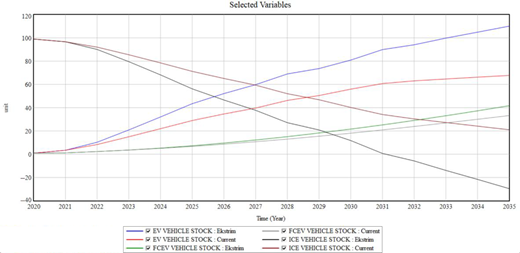
3.4.4 Stage 4: Extreme condition test.
The extreme condition test is conducted to evaluate model behavior under extreme scenarios (e.g. zero values, very high values or logical limits) and ensure it remains logically consistent and behaves rationally. In Figure 8, EV attractiveness is reduced by 100%. The results show a sharp decline in ICE sales, accompanied by a significant increase in EV and FCEV sales. This indicates that the model responds dynamically and consistently to extreme changes in key variables, reflecting logical system behavior under boundary conditions. From Figure 8, EV vehicle stock will decrease by 100% in 2031.
4. Result and discussion
4.1 Scenario analysis
To improve consistency and comparability, all scenario results have used a uniform simulation period and consistent vehicle-share reporting. The policy roadmap timelines have also been aligned with the simulation horizon, while additional numerical comparisons between scenarios have been included to clearly demonstrate the differences in the effects of each policy intervention on ICE, EV and FCEV adoption.
Four scenario analyses can be explored for future research, as presented in Table 5 below. These scenarios include one for Subsystem 1 (ICE), two for Subsystem 2 (EV) and one for Subsystem 3 (FCEV) in 2020–2035.
4.1.1 Scenario 1: ICE attractiveness (fuel subsidy and fuel price) decreased 10%–20%.
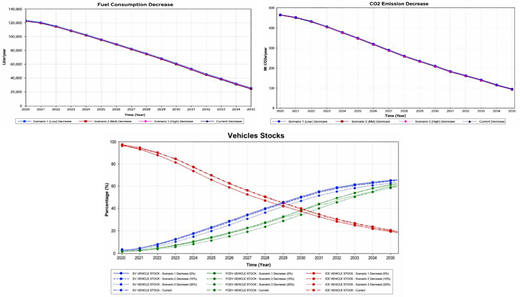
Scenario 1, a 10%–20% reduction in the attractiveness of ICE vehicles, such as a decrease in fuel subsidy, drives a significant transition in the transportation system during 2020–2035. Fuel consumption and CO2 emissions decline sharply in the early years and continue decreasing more gradually toward 2035, indicating sustained environmental improvement. Simultaneously, the dominance of ICE vehicles falls substantially to around 20% by the end of the period, while EVs grow rapidly and become the dominant technology with a share exceeding 60%. FCEVs also increase gradually, particularly in the later years, serving as a complementary clean transportation option. Overall, the scenario reflects a clear shift from fossil-fuel-based transportation toward cleaner and more sustainable vehicle technologies, as shown in Figure 9.
4.1.2 Scenario 2: EV attractiveness (EV incentive) increased 10%–30%.
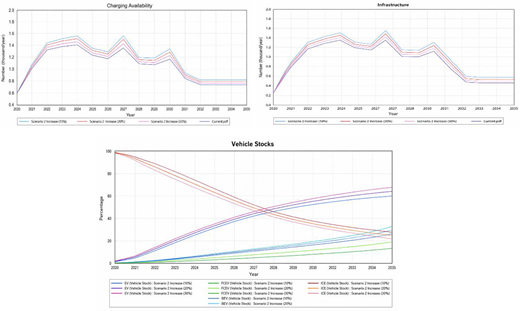
Scenario 2 shows that increasing EV attractiveness, such as EV incentives, accelerates the development of charging infrastructure and EV adoption during 2020–2035. EV infrastructure and charging availability grow rapidly in the early years, peak around 2024–2027 and later fluctuate before stabilizing after 2030, indicating system adjustment and eventual infrastructure saturation. Despite different levels of EV attractiveness (10%–30%), the long-term infrastructure patterns remain relatively similar, suggesting limited structural sensitivity of the system. At the same time, the vehicle composition changes significantly, with ICE vehicles declining from nearly full market dominance to around 20% by 2035. Conversely, EVs grow rapidly to become the dominant technology, accounting for approximately 65%–70% of total vehicles, while FCEVs increase more moderately to around 30%. Overall, the scenario reflects a strong transition toward low-emission transportation, led primarily by EV expansion and supported by the gradual adoption of FCEVs, as shown in Figure 10.
4.1.3 Scenario 3: Emission policy pressure (CO2 tax) increased 10%–30%.
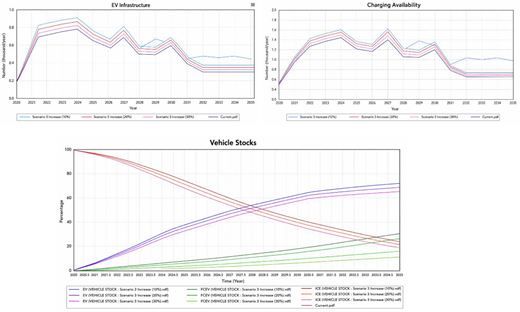
Scenario 3 demonstrates that stronger policy pressure for EV adoption, such as a CO2 tax, accelerates the expansion of charging infrastructure and charging availability during 2020–2035. Infrastructure growth accelerates in the early years, peaking around 2024 and 2027, before becoming more volatile and gradually declining after 2030, suggesting challenges in sustaining long-term infrastructure development. Charging availability follows a similar trend, with strong early growth driven by aggressive infrastructure expansion, followed by a noticeable decline and stabilization at lower levels toward 2035, suggesting structural limitations and market saturation. In terms of vehicle composition, ICE vehicles decline significantly from near total dominance to around 15%–20% by 2035. Conversely, EVs grow rapidly and become the dominant technology after 2028, reaching approximately 70%–75% of the vehicle stock, while FCEVs increase more gradually to around 30%–35%. Overall, the scenario reflects a strong transition toward low-emission transportation, led primarily by EVs and supported by the complementary growth of FCEVs, although long-term infrastructure expansion appears constrained, as shown in Figure 11.
4.1.4 Scenario 4: FCEV attractiveness (FCEV incentive) increased 10%–30%.
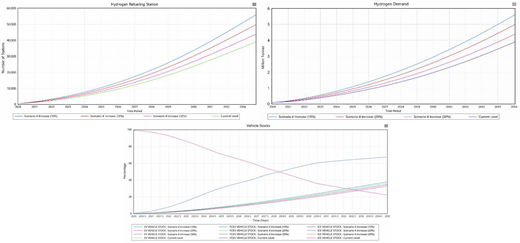
Scenario 4 demonstrates that increasing the attractiveness of FCEVs, such as incentives for FCEVs, stimulates hydrogen demand and accelerates the development of hydrogen refueling infrastructure during 2020–2035. Hydrogen demand rises steadily from a very low initial level and accelerates after 2022, increasing more than fivefold by 2035, particularly under higher-growth scenarios. Similarly, HRS expand consistently across all scenarios, with infrastructure growth accelerating over time and becoming significantly larger in the 20% and 30% attractiveness scenarios after 2025. In terms of vehicle composition, ICE vehicles decline substantially from near total dominance to around 20% by 2035, while EVs experience the fastest growth and become the dominant technology after 2028. FCEVs also grow steadily, although at a more moderate pace, strengthening their role as a complementary clean transportation technology. Overall, the scenario highlights that greater FCEV attractiveness supports the expansion of hydrogen infrastructure and contributes to the broader transition toward low-emission transportation systems, as shown in Figure 12.
4.2 Discussion
The policy design, analysis and evaluation results from the SD model demonstrate that energy transition in the transportation sector is a complex and nonlinear process, influenced by the interaction of policy, technology, infrastructure, market, economic and environmental factors. The simulation results indicate an S-shaped growth pattern in EV and FCEV adoption, where new technologies gradually replace ICE vehicles through a structural substitution process. Increasing the attractiveness of EV and FCEV through stronger incentives, tax benefits and infrastructure support, while reducing the attractiveness of ICE vehicles through higher fuel costs and reduced subsidies, can accelerate the transition pathway and advance the technology shift by approximately 2–3 years.
The scenario analysis highlights that EVs function as a bridging technology, while FCEV adoption requires early hydrogen infrastructure investment to activate reinforcing feedback loops and overcome initial barriers. However, the main challenge lies in determining the level of government commitment to expand incentives, as higher policy support requires greater fiscal allocation and long-term policy consistency. Therefore, an integrated policy approach combining emission regulations, targeted incentives, hydrogen infrastructure development and clean energy support is required to achieve a faster and more sustainable transportation transition.
5. Research summary
The section is divided into conclusions, managerial and policy implications, limitations and future research.
5.1 Conclusions
This study advances the understanding of transportation energy transitions by developing an SD framework that captures the co-evolution of ICE, EV and FCEV ecosystems in Indonesia. Rather than framing the transition as a process of linear technological substitution, the findings demonstrate that it unfolds as a nonlinear, path-dependent process of managed coexistence, shaped by endogenous feedback mechanisms, infrastructure lock-in and policy alignment.
The results confirm that ICE vehicles do not disappear abruptly but decline gradually due to the combined effects of environmental regulation, economic pressures and technological saturation. At the same time, EVs emerge as an effective bridging technology, driven by reinforcing dynamics related to learning effects, infrastructure expansion and social acceptance. However, their long-term dominance is constrained by balancing mechanisms, including diminishing policy incentives and infrastructural limitations.
A key contribution of this study is the identification of intertechnology coupling mechanisms, particularly through transition pathways from ICE to EV and from EV to FCEV. These interactions demonstrate that technology diffusion is interdependent, where the acceleration of one pathway can both enable and constrain others. As a result, single-technology policy approaches risk creating inefficiencies or long-term lock-in.
From a strategic perspective, the findings suggest that EVs and FCEVs should be positioned as complementary rather than competing solutions. EVs play a critical role in delivering near- to medium-term emission reductions and facilitating market transformation, while FCEVs provide a long-term pathway for decarbonizing transport.
From a financial perspective, this transition is strongly influenced by policy-driven incentives and fiscal instruments. Government support – such as purchase subsidies, tax reductions, import duty exemptions and value-added tax incentives – plays a critical role in improving the relative affordability of EVs and accelerating market uptake. In addition, operational incentives, including reduced vehicle registration fees, lower charging electricity tariffs and preferential financing schemes, further enhance their economic attractiveness compared to conventional vehicles.
For FCEVs, targeted financial mechanisms – such as capital subsidies for hydrogen production facilities, tax holidays for infrastructure investments and public–private partnership schemes – are essential to offset high initial costs and technological uncertainties. Carbon pricing mechanisms and fuel taxation reforms also help internalize environmental externalities and gradually reduce the competitiveness of fossil-fuel-based vehicles.
Overall, this study contributes to the literature by shifting the analytical lens from technology substitution toward dynamic system reconfiguration, offering a more realistic representation of energy transitions in developing-country contexts. The framework provides a foundation for future simulation-based research and supports more integrated, adaptive and resilient policy design for low-carbon mobility transitions in Indonesia.
5.2 Managerial and policy implications
From a policy and managerial perspective, the findings underscore the structural fragility of technology-exclusive transition strategies. Policymakers should avoid prematurely locking the transportation system into a single dominant pathway and instead adopt portfolio-based governance that aligns EV and hydrogen deployment with application-specific needs and infrastructure readiness.
The practical implications further consider the economic and financial costs associated with policy incentives and hydrogen infrastructure investment, as well as the social and environmental implications of technology adoption. The discussion also emphasizes that the long-term environmental benefits of EVs and FCEVs depend on the availability of low-carbon electricity and hydrogen, highlighting the importance of aligning transportation policies with broader clean energy development.
Key leverage points identified by the model include coordinated infrastructure co-development, credible long-term policy signaling and technology-neutral yet use-case-specific regulation. For instance, prioritizing hydrogen deployment in passenger cars can maximize system efficiency while avoiding redundant investment in charging infrastructure. For industry actors, the results emphasize the importance of ecosystem coordination among vehicle manufacturers, energy suppliers and infrastructure providers, as isolated investments are unlikely to overcome systemic barriers.
For developing countries such as Indonesia, where capital constraints and institutional capacity shape transition pathways, strategic sequencing emerges as a pragmatic approach. Leveraging EVs to deliver early emission reductions while simultaneously preparing hydrogen ecosystems for future deployment can enhance transition resilience and reduce the risk of stranded assets or policy reversals.
Based on the results of the SD model, this study proposes a policy implementation roadmap that is conceptual, operational and measurable, organized into three phases: initiation, acceleration and maturity. The roadmap illustrates the transition of FCEV technology from early to mass adoption while accounting for SD, policy interdependencies and the nonlinear and uncertain nature of technological transitions.
5.2.1 Initiation phase (2020–2025).
This phase focuses on establishing the foundation of the hydrogen ecosystem. The government acts as a market creator and risk absorber, addressing high costs and limited infrastructure. Key policies include developing comprehensive hydrogen regulations, initiating pilot HRS, providing fiscal incentives (subsidies and tax exemptions) and supporting green hydrogen production. The goal is to achieve a critical mass, not large-scale adoption.
5.2.2 Acceleration phase (2025–2035).
The focus shifts to scaling up adoption and strengthening the ecosystem. The government transitions into a market enabler, expanding hydrogen infrastructure, tightening emission regulations and promoting domestic industry development (fuel cells and hydrogen storage). Market incentives are gradually reduced as competitiveness improves. Ensuring green hydrogen production becomes critical to maintain environmental benefits.
5.2.3 Maturity phase (above 2035).
This phase emphasizes system optimization and integration, during which FCEVs are expected to achieve a significant market share. The government acts as a regulator and system optimizer, reducing incentives, strengthening market mechanisms and integrating transport with energy systems. Continuous policy evaluation and innovation (e.g. smart grids and circular economy) become key priorities.
5.3 Limitations
Several limitations should be recognized. First, the model is intended for conceptual exploration and policy learning. Parameter values are derived from literature synthesis, expert judgment and stylized assumptions, which may not fully account for future technological breakthroughs or disruptive policy shifts. Second, the analysis is conducted at a national aggregate level, which could obscure regional differences in infrastructure availability, consumer behavior and industrial structure across Indonesia. Third, social factors such as equity impacts, behavioral diversity and distributional effects are simplified. Fourth, international dynamics – including hydrogen trade, technology spillovers and geopolitical influences – are not explicitly modeled, despite their potential importance for long-term hydrogen development.
5.4 Future research directions
Spatially explicit or regionalized models could capture urban–rural differences and support more granular planning for hydrogen infrastructure. Further extensions may explicitly integrate electricity SD and renewable energy deployment, strengthening the coupling between transport and power sector transitions. Incorporating heterogeneous consumer segments, firm-level strategies and equity considerations would enhance realism and policy relevance. Comparative studies across developing countries could also test the generalizability of the managed coexistence framework beyond the Indonesian context.