Skip to article sections
Purpose

This paper investigates the effects of childbirth on female employment in Vietnam from 1989 to 2019.

Design/methodology/approach

Using Vietnam census data from 1989 to 2019, this study constructs a pseudo-event panel by matching parents at different stages of the parenting lifecycle with demographically similar counterparts without children.

Findings

The results show a sharp and persistent decline in female employment following childbirth, with no comparable effect on men. This paper further documents significant variations in the magnitude of the child penalty across regions and over time and finds that women who are married, live in urban areas, belong to the ethnic majority, are more educated or have migrated face a significantly greater child penalty. In contrast, women who co-reside with their child's grandparents or work in agriculture or the public sector appear to have a lower child penalty.

Originality/value

This study is among the few to measure and analyze the child penalty in a developing country. In particular, it provides the first systematic province-level analysis of the child penalty in Vietnam. Moreover, this study has policy implications for a developing country during a period of economic transformation amid rising gender inequality.

Women often face disadvantages in the labor market compared with men after the birth of a child (Kleven et al., 2025). This phenomenon is known as the “child penalty” or “motherhood penalty” (Angelov et al., 2016). The child penalty has received a great deal of attention from scholars (Lebedinski et al., 2023) as addressing it is essential not only for closing the gender wage gap but also for stimulating greater social equity (Jin et al., 2024). Most previous studies have explored the child penalty in advanced countries. For the USA, Jee et al. (2019) show that the child penalty remained persistent from 1986 to 2014. Zamberlan and Barbieri (2023) find that the child penalty is the main cause of the gender wage gap in Germany and the UK. The recent and novel global atlas of the child penalty in employment created by Kleven et al. (2025) reveals that the child penalty systematically correlates with economic development and structural transformation. However, there is still a lack of extensive studies on developing countries.

This study contributes to the literature by estimating the child penalty in a developing country – Vietnam – that has undergone significant structural economic changes in recent decades (Doan et al., 2025a, b). With its distinctive cultural and institutional context, Vietnam represents a particularly interesting case for studying the child penalty. As a socialist nation, Vietnam has implemented one- or two-child policies since the 1960s to manage population growth, and these policies may have contributed to social pressures, job losses and the emergence of the child penalty (Goodkind, 1995). This background is different from that of China, where the one-child policy was strictly implemented and coincided with a reduction in public kindergartens, leading to a persistent child penalty (Zhou et al., 2022). Additionally, shifts in institutional frameworks in Vietnam – such as the “Doi Moi” reforms of the 1980s – and the expansion of labor market opportunities driven by recent industrialization may have further contributed to the increase in the child penalty (White et al., 2001). Along with industrialization, Vietnam has witnessed a high rate of economic openness over recent decades through trade openness and foreign direct investment (FDI), which is much higher than that observed in most developing countries (Nguyen et al., 2022). Economic openness has led to changes in the division of labor within households and to increases in the gender pay gap (Vo and Truong, 2023). However, limited attention has been paid to the child penalty by both scholars and policymakers in Vietnam.

Our empirical analysis measures the child penalty across 63 Vietnamese provinces under different public policy conditions. We use the pseudo-event approach for cross-sectional data proposed by Kleven (2022), following the pioneering work of Kleven et al. (2019b). This study estimates the effects of childbirth on parent labor force participation in each province, rather than simply estimating it at a national level, using data from the Vietnam Population and Housing Census, 1989 to 2019. That is, the model builds on the identification strategies of Kleven et al. (2019b) and Kleven (2022) and relocates the design to explore what appears to be highly significant subnational variation, rather than focusing solely on averages.

This study differs from previous work in three main ways. First, it extends the recent research by measuring the child penalty in a developing country with high economic openness that has undergone significant structural economic changes. Some studies have systematically examined the determinants of the child penalty in developing countries (Kleven, 2022), which differ from those in developed countries in their institutional settings, economic structures and labor market dynamics (Lebedinski et al., 2023). However, most of the literature focuses on large developing countries, such as China or Russia (e.g. Lebedinski et al. (2023) and Zhang et al. (2024)). Among the few studies on other developing countries, Fajardo-Gonzalez et al. (2024) document a significant child penalty in Indonesia. Moreover, existing evidence indicates that women in developing countries face labor market disadvantages after childbirth, not only because of institutional and economic factors but also because of prevailing traditions and social norms (Zhang et al., 2024). Thus, it is important to analyze the child penalty in a wide range of developing countries and across diverse institutional and socioeconomic contexts.

Second, the study examines variations in the child penalty at both the country and regional levels. The literature suggests that the child penalty varies between countries, largely reflecting each country's distinct socio-economic and institutional contexts (de Linde Leonard and Stanley, 2020). In particular, the variations in the child penalty between countries could depend on institutional support and social acceptance, as well as labor market structures (Cukrowska-Torzewska, 2017). However, it is important to understand how the child penalty varies within a country and within a consistent institutional context. This issue is highlighted in the study by Fajardo-Gonzalez et al. (2024) on Indonesia, which shows that women in urban areas and those with higher education levels experience larger and more persistent penalties. Our study measures the child penalty over three decades, from 1989 to 2019, providing a comprehensive view of how it has evolved over time. Overall, this work is likely the first systematic, province-level analysis of Vietnam carried out over such an extended period.

Third, the study applies the pseudo-event study method from Kleven (2022) to examine the long-term child penalty, providing an appropriate identification strategy. Several sources of endogeneity and selection issues are involved in measuring the child penalty, given the complexity of this phenomenon (Kleven et al., 2025). Jee et al. (2019) suggest that the child penalty is not merely a short-term effect but can have long-lasting implications for a woman's career, lifetime employment and earnings. This long-lasting child penalty might be even more pronounced in a developing country like Vietnam, where women often find it more difficult to return to the labor market after giving birth due to a lack of specific initiatives to support women returning to work, such as career training or flexible working arrangements (Vo and Truong, 2023). Thus, this study uses the pseudo-event study method to estimate the long-lasting child penalty.

The study is organized as follows. The next section presents the literature review. The method and data are in Section 3. Section 4 reports the results, while Section 5 discusses the findings. Section 6 concludes the paper.

The child penalty is ubiquitous: mothers of young children are less likely to work, work fewer hours and earn lower wages (Blau and Kahn, 2017). In contrast, having children tends to have little or no effect, or a modest positive effect, on men's work participation and earnings (Kleven et al., 2019a). Among the various dimensions of the child penalty, the impact on employment is particularly significant. Changes in labor supply, especially whether mothers participate in the workforce, largely account for the reduced labor market outcomes that mothers experience (Cukrowska-Torzewska and Matysiak, 2020). The child penalty has become an increasingly important topic in labor economics (Duletzki and Lim, 2026; Sundberg, 2024; Udayanga, 2024), not only in advanced economies (Andresen and Nix, 2026; Di Leo et al., 2026) but also in developing countries (Zhang et al., 2024). Sundberg (2024) shows that the child penalty declined in Sweden from the 1960s to the 1980s, but this trend has slowed in recent decades. Duletzki and Lim (2026) add that the child penalty is also decreased in Germany. In contrast, Zhang et al. (2024) highlight the problem of child penalty as a new issue arising from socioeconomic changes in China. This topic is particularly significant in the context of sustainable development and profound changes in working arrangements, especially following the COVID-19 pandemic (Harrington and Kahn, 2026).

One of the most common arguments in the literature regarding the child penalty centers on the unique biological aspects of women, specifically childbearing and breastfeeding (AEA, 2021). These biological processes often result in women losing valuable work experience during the period of motherhood (Mincer and Polachek, 1974). Because of the demands of childcare, women often opt for jobs that offer greater mobility or flexibility; however, these choices can result in lower wages than less flexible positions (Felfe, 2012). It is important to note that the empirical findings on this aspect remain mixed (Cukrowska-Torzewska and Lovasz, 2020). Moreover, discrimination by employers may also contribute to the child penalty. Employers may perceive that mothers are less committed to their careers, which can lead to fewer employment opportunities for women (Budig and Hodges, 2010). Despite these explanations, the recent research suggests that the child penalty cannot be fully understood solely through the lens of biology (Kleven et al., 2021).

The literature emphasizes variations in the child penalty across countries (Cukrowska-Torzewska and Matysiak, 2020), which may originate from different socioeconomic conditions. Other potential determinants of the child penalty include gender norms (Zhang et al., 2024), differences in working styles (Harrington and Kahn, 2026), public policy interventions (Duletzki and Lim, 2026) and wage-institutional settings (Badaoui and Matteazzi, 2026). Generally, women in countries with institutional support and social acceptance of motherhood appear to have greater motivation to participate in the labor market and attain higher levels of achievement (Cukrowska-Torzewska, 2017).

While a growing body of literature highlights the child penalty in developing countries, the evidence remains limited to a few countries. For instance, Kang et al. (2024) compare Finland, Germany and the USA (i.e. Western countries) with South Korea and Taiwan (i.e. East Asian countries) and show that the child penalty is greater for married mothers in the latter. Notably, Kleven et al. (2025) document a sharp decline in female employment immediately after the first birth, with employment falling by around 10% points in the first year. However, the Child Penalty Atlas reports only national average values and does not examine how the child penalty varies across provinces or changes over time. Structural changes in developing countries, such as economic restructuring, are highlighted as potential determinants of labor market dynamics and the gender pay gap (Doss and Gottlieb, 2025; Marjit et al., 2026; Rodrigues-Silveira, 2025), as well as the child penalty (Kong and Dong, 2024). This raises an interesting question about the dynamics of the child penalty in developing countries undergoing structural socioeconomic change.

In the case of Vietnam, there are still relatively few studies on the child penalty in the literature. The study by Goodkind (1995) briefly mentions the effects of the one- or two-child policies in Vietnam and suggests that these policies might have resulted in social pressures and job losses. Hoa et al. (1996) examine reproductive patterns in rural Vietnam and find that women with lower education levels are less likely to adhere to the one- or two-child policies. However, Hoa et al. (1996) did not explore the reasons for their findings. One possible explanation is that less well-educated women face a lower child penalty and are thus more willing to have additional children despite the one- or two-child policies. White et al. (2001) argue that the Doi Moi reforms of the late 1980s appeared to have reinforced women's preference for smaller families. Although they do not explain this pattern, it may also be related to the child penalty as women in the post-Doi Moi period had greater opportunities in the labor market, particularly in salaried employment. This change is strongly related to the process of economic structural change in Vietnam.

In fact, Vietnam's transition from an agricultural economy to one dominated by industrial and service activities has driven a substantial reallocation of labor from agriculture to the industrial and service sectors over recent decades (Liu et al., 2020; McCaig and Pavcnik, 2013). At the same time, the Doi Moi reforms were accompanied by the withdrawal of state support for childcare, which significantly affected women and their employment (Tuyen, 1999) in a way that is similar to the case of China (Zhou et al., 2022). These changes in the sectoral structure of the economy and in childcare support are likely to have increased the child penalty because jobs in the industrial and service sectors are less compatible with childcare than jobs in the agricultural sector. Furthermore, the gender pay gap appears to have emerged in Vietnam as women's employment in the service sectors has risen (Liu, 2004). Meanwhile, Vietnam has a sizable informal sector with a large number of informal jobs (Buckley, 2023; Castel and To, 2012). Consequently, women often sort into occupations with better non-monetary characteristics, reflecting their preference for service and informal work (Chowdhury et al., 2019). This pattern suggests that women have to manage the trade-off between employment and childcare or homecare (Carmichael et al., 2023; Vo et al., 2007) and that they may face a child penalty.

Nonetheless, some studies on gender inequality in wages in Vietnam have given only limited consideration to the child penalty. Vu and Yamada (2018) analyze the gender pay gap in Vietnam from 2002 to 2014 and conclude that the gap exists and that skills are the main determinant. Obermann et al. (2021) analyze the determinants and dynamics of the gender pay gap in Vietnam from 2010 to 2016 and conclude that gender income inequality remains substantial, although it has declined over time. They identify occupation, education level and economic sector as the main determinants, while unobservable factors are also important. However, they do not address the child penalty in the context of economic structural change or the existence of a large informal sector in Vietnam.

This paper aims to contribute to the literature by (1) extending the pseudo-event analysis for the child penalty in a country undergoing rapid transition and (2) shedding light on how the child penalty evolves across regions, e.g. with differences in the shift from agriculture to waged work and in the availability of grandparental assistance.

This study uses data from the Vietnam Population and Housing Censuses conducted in 1989, 1999, 2009 and 2019. These censuses are nationally representative cross-sectional individual data for households in Vietnam and include detailed information on demographics, household interrelationships, employment, education and fertility histories. Given the absence of large panel household data in Vietnam for a traditional event study, the authors estimate the dynamic effects of childbirth on the employment of women and men in Vietnam using the pseudo-event study method proposed by Kleven (2022). The fundamental idea is to adopt a canonical event study design, which tracks changes in labor market outcomes relative to the timing of the first childbirth. Kleven et al. (2019b) establish models identifying the impact of childbirth on the employment of men and women, with event time t=0 at the year of the first birth. Let Yitg represent the employment outcome for individual i of gender g observed at event time t:

(1)

where the indicator function 1k=t explicitly denotes the event-time dummies. This specification estimates one coefficient per event year and sets t=2, the year prior to pregnancy, as the omitted event-time dummy. Following Kleven et al. (2025), the base year is chosen due to the absence of any pre-trend disparity in outcomes in the data. Other studies, such as Kleven et al. (2019a) and AEA (2021), omit the event-time dummy at t=1, meaning that the event-time coefficients are interpreted relative to the year immediately before the first childbirth. This approach is suitable for household panel survey data where annual observations are available. In contrast, using t=2 as the reference period is more appropriate for cross-sectional data as censuses typically collect information on an individual's status during the previous calendar year. This timing better aligns the event study framework with the retrospective nature of census variables. The fixed effects for age δag and year λyg are denoted as a set of dummies to non-parametrically control for lifecycle and time trends. The estimated event-time coefficients, βkg, measure the gap in labor market outcomes between women and men relative to the base year.

This specification isolates the treatment effect of parenthood by differencing out pre-existing gender gaps in employment. Causal identification in this event study design relies on the assumption of parallel trends. Short-run effects are credible under the assumption that counterfactual employment outcomes change smoothly in the absence of childbirth, while long-run effects require parallel counterfactual trends between women and men. Empirically, these assumptions are supported by flat pre-trends in the estimated event coefficients and the consistency of post-birth effects. As shown in a previous work (Kleven et al., 2025), the absence of heterogeneous treatment effects across time and cohorts improves the credibility of staggered event designs.

To interpret the child penalty, the authors compute the following measure in percentage terms: Ptg=βtgˆE(Yitg~|t) where Ptg represents the effect of children in year t expressed as a percentage decrease in employment from the counterfactual outcome had the individual not had children. Yitg~​ is the predicted average counterfactual employment rate outcome excluding the contribution of the event dummy, specifically, Yitg~=aδagˆ1(·)+yλygˆ1(·). Accordingly, the child penalty is the difference between the average male–female employment gap after childbirth and the average gap before childbirth. Child Penalty=E[PtwPtm|t[0,T]]E[PtwPtm|t<0] where Ptw and Ptm is the dynamic effect of the birth of a child on employment in percentage terms for women and men, respectively. A negative value implies that childbirth increases the gender employment gap.

With the large sample size from the censuses, synthetic cohorts of women and men are constructed based on birth timing and observable characteristics. The analysis restricted the sample to parents aged 20–45 years at the time of the census. This is the main working age, especially in a developing country with a young population like Vietnam, and within the reproductive age range for women. For parents, event time t is defined by the age of the child. For example, a mother whose first child is two years old is assigned event time t=2. For non-parents, since the event is not observed, to construct pre-treatment periods t<0, the authors generate synthetic pre-birth observations by matching them to future parents in the same census year based on gender, age, marital status, education level and urban status. In particular, for each parent observed at childbirth – that is, when the oldest child is age zero – the first step is to identify the parent's actual age, gender, marital status, urban status and education level. The second step is to construct pre-childbirth event times by identifying non-parents who are observed in the same census year and share the same gender, marital status, urban status and education level, but who are between one and five years younger. For example, a parent observed at age a when the child is born is matched to non-parents aged a1,a2,...,a5. These matched non-parents are used to represent the parents’ labor supply before childbirth.

After this matching step, each parent is assigned pseudo-observations for the pre-childbirth period, while actual parents with children aged zero to eight are used for the post-childbirth period. The event time is therefore defined by the age of the oldest child for parents and by the assigned negative event time for matched non-parents. Hence, the pre-childbirth comparison group is constructed from individuals who are similar to future parents in basic demographic characteristics, except that they have not yet had children. We estimate dynamic treatment effects of parenthood for men and women, comparing changes in labor market outcomes at each event year t[5,+8], relative to two years before childbirth, with the baseline year t=2. The analysis is limited to eight years after the first birth; extending the analysis further may capture the cumulative impact of later births rather than the first birth alone.

Appendix Table A1 presents statistics for key demographic variables from the Vietnamese censuses of 1989, 1999, 2009 and 2019. These data are used to construct pseudo-event panels for analysis. Table 1 reports summary statistics for the main variables in the analysis. The sample included 70,234 women and 69,628 men between the ages of 20 and 45 years.

The first subsection presents descriptive evidence on the evolution of employment among women and men using Vietnamese census data. Panel (a) of Figure 1 shows male and female employment rates by age across the four census waves: 1989, 1999, 2009 and 2019. Men's employment remains consistently high and stable, exceeding 90% across nearly all ages and cohorts, whereas women’s employment declines steadily after their early 30s. However, in the more recent samples, from 2009 to 2019, the decline in women's employment is less pronounced, especially after their 40s.

Panel (b) shows employment patterns by age at the first childbirth. There is a negative association between female employment and age at the first childbirth, with steeper slopes for women who delay childbearing until their 30s. This pattern is consistent with the larger opportunity costs of exiting the labor market later in life, as discussed by Chu et al. (2023). In contrast, male employment was relatively stable across all fertility timing groups. These stylized patterns are consistent with findings from high- and middle-income countries, where late motherhood is associated with greater work-oriented disruption due to greater opportunity costs and weaker labor market opportunities (Chu et al., 2023).

Figure 2 explores the relationship between the characteristics of parenthood and employment outcomes. Panel (a) shows an inverse relationship between female employment and the age of the youngest child. For women with children aged 0 to 3 years, the employment rate is much lower than that of men, by around 20–30% points. This trend likely indicates that caregiving duties extend well beyond infancy and continue to constrain women from participating in the labor market. Intriguingly, although overall female employment rates have increased, the employment gap surrounding the early years of parenthood appears to have widened in more recent samples for 2009–2019 compared to 1989–1999. This pattern is even more pronounced than that observed in developed countries, as documented by Kleven et al. (2025).

Panel (b) of Figure 2 illustrates the association between employment and the number of children per woman. Moving from one child to two is associated with an increase in employment of about 10–20% points. This is likely because the income effect dominates and motivates women in a developing country with a young population, like Vietnam, to work. However, beyond two children, additional births appear to constrain women's ability to work. This pattern is especially evident in the 1989–1999 samples, likely due to the one- or two-child policies implemented during that period. These trends are quite similar to those observed among men, whose employment rates are stable across all numbers of children. The descriptive patterns show the disproportionate parental burden borne by women and align with evidence on how fertility-related responsibilities drive women's labor supply in both developed and developing countries (Chu et al., 2021).

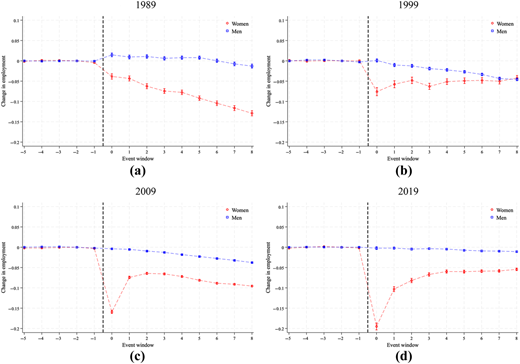
Figure 3 presents pseudo-event study estimates, where t=0 denotes the year of the first childbirth for each census from 1989 to 2019. Across all panels (a), (b), (c) and (d) of Figure 3, women experience a significant decline in employment after childbirth, with a gap extending up to eight years, while the male employment pattern is flat. Importantly, the employment outcome does not return to the pre-childbirth period, indicating a long-term displacement from the labor market. Consistent with prior findings (Kleven et al., 2025), this study finds no significant employment response to childbirth among men. Quantitatively, the magnitude of the initial drop in female employment at the time of the first childbirth increases over the decades from less than 5% in 1989 to almost 20% in 2019. Unlike the study of Kleven et al. (2025), which estimated the child penalty for Vietnam using census data over the period 1989–2009, this analysis highlights the importance of investigating the magnitude and trend in the child penalty within a country, particularly one with a relatively young population like Vietnam, where childcare and work are driven by Eastern family norms that disproportionately affect women's careers.

Table 2 provides estimates from the event study regressions for different sample categories. In Model 1 of Table 2 with the full sample, the child penalty at year 0 is 12.1%, with an overall effect of 5.6% on average over the post-childbirth period. As a robustness check, we excluded Ho Chi Minh City and Hanoi from the estimates. These two metropolitan areas could bias national-level results as both are highly urbanized and economically dynamic, with concentrations of service-sector work and, consequently, potentially higher levels of informal employment. This exercise re-estimates the results excluding these influential areas to assess whether the main findings are driven by capital-region effects or instead reflect general patterns across Vietnam. The results show that excluding Ho Chi Minh City and Hanoi slightly reduces the point estimates of the child penalty to around 11.4% in year 0 and 5.2% following childbirth. Model 3 of Table 2 shows that Ho Chi Minh City experiences the largest child penalty, with a 26.1% reduction in year 0 and an overall post-childbirth effect of 16.4%. By contrast, Model 4 indicates that Hanoi faces a more moderate child penalty of 11.8% in year 0 and 5.0% overall, which is slightly below the national level.

The relatively high child penalty in Ho Chi Minh City and Hanoi, compared with the national average, likely reflects the combined effects of several socioeconomic factors. As Vietnam's main economic centers, these cities have undergone rapid structural change, with strong growth in industry, especially services, and an influx of migrants from other provinces. While these changes have made their economies dynamic and labor markets highly competitive, migrant families often lack parental support for childcare and housework. As a result, women in these cities may face higher child penalties, as indicated by the estimates.

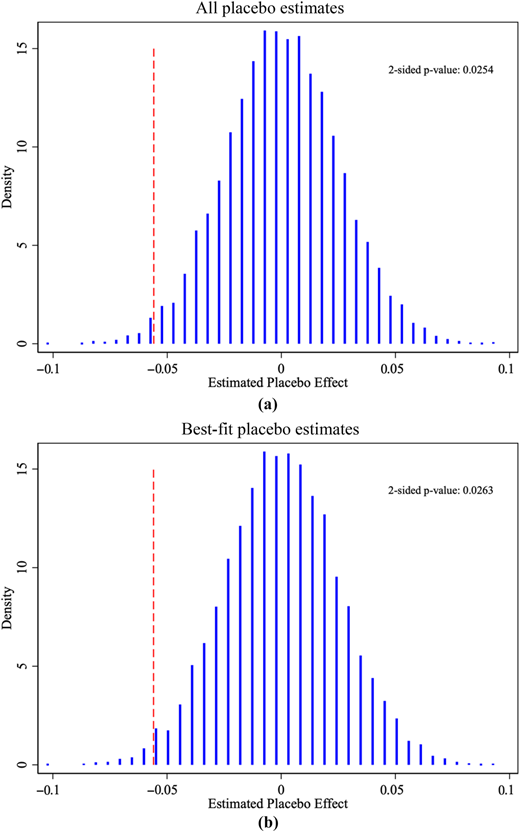
Kleven et al. (2025) demonstrated that the difference in estimated child penalty between the pseudo-event design and the event study design is negligible. However, we are not able to validate the pseudo-event study estimates against a conventional event study with panel data, as in Kleven (2022), which compares pseudo-event estimates from the Current Population Survey and the American Community Survey with event study estimates based on the Panel Study of Income Dynamics and the National Longitudinal Survey of Youth. Instead of such validation, we use an alternative robustness check based on simulation. Figure 4 presents the results of a placebo test to validate the interpretation of the estimated child penalty on employment. The placebo test applies the treatment to units or periods where no actual event occurs and then repeats the estimation process. If the specification is credible, these placebo estimates would center around zero and the estimation process should not generate spurious child penalties when treatment is randomly assigned. In other words, the placebo analysis was used as a falsification test of credibility for the pseudo-event study design. Panel (a) of Figure 4 displays the full distribution of placebo estimates, with the vertical dashed red line indicating the actual estimate from Model 1 of Table 2. The symmetric placebo distribution around zero confirms the absence of systematic bias in the estimates when treatment is randomly assigned. As the actual child penalty estimates fall into the left tail of the distribution, the effect is unlikely to be observed by chance. This exercise provides a nonparametric test of the null hypothesis of no true effect, assuming that treatment assignment is effectively random and that the test is robust to unknown error distributions (Abadie et al., 2022; Miller, 2023).

Panel (b) of Figure 4 restricts the placebo distribution to the 75% of placebo samples with the lowest root mean square percentage error (RMSPE) in the pre-treatment period. By doing so, only well-matched placebo samples are used to evaluate the validity of the actual estimates. This approach further alleviates concerns that the observed child penalty is likely driven by poor pre-match quality. The associated two-sided p-value for this restricted distribution is 0.0263, which is nearly identical to that in Panel (a). Overall, the placebo tests suggest that the observed child penalty is unlikely to result from random treatment assignment and instead reflects genuine labor market changes surrounding childbirth.

Besides differences in the child penalty over time, the analysis investigates regional changes in the child penalty across three 10-year time intervals: 1989–1999, 1999–2009 and 2009–2019. The Red River Delta and Mekong Delta experienced substantial decreases in the motherhood employment penalty during the first period, 1989–1999. However, both regions exhibited a rebound in the subsequent decades, 1999–2009 and 2009–2019, with the child penalty increasing by 0.066 and 0.054% points, respectively. Similarly, regions such as the Central Coast and Central Highlands experienced moderate declines in the child penalty in the early 1990s, followed by stabilization or slight recovery. Thus, these regions seem to experience relatively slow economic transformation and shifts in local labor demand. The Southeast region, the most economically dynamic area in Vietnam, stands out as having greater barriers for working mothers, with a consistent upward trend in the child penalty, increasing by 0.057% points from 2009 to 2019. Overall, the temporal change in the child penalty indicates that some areas may experience a reduction in the child penalty, while others have widening gender employment gaps. Therefore, the regional variations align with the hypothesis that local institutional environments and cultural norms determine the extent to which childbearing constrains the female labor supply. These findings agree with earlier work that highlights the role of subnational factors in shaping the motherhood employment penalty (Kleven, 2022).

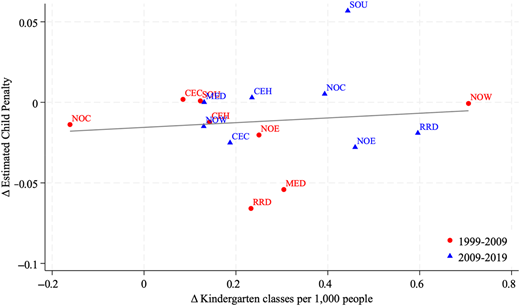
Moreover, in Figure 5, the authors plot the unconditional relationship between child penalty and the number of pre-kindergarten classes. Because data on the number of kindergarten classes collected from the General Statistics Office of Vietnam (GSO) are available only since 2002, the authors match the 2002 values to the closest census year, which is 1999. The results suggest that regions with fewer kindergarten classes per capita tend to have higher penalties. However, when looking at within-region changes over time in Figure 6, there is no clear relationship between changes in kindergarten availability and changes in child penalty. These stylized facts support the validity of the emphasis on within-region variation analysis [1].

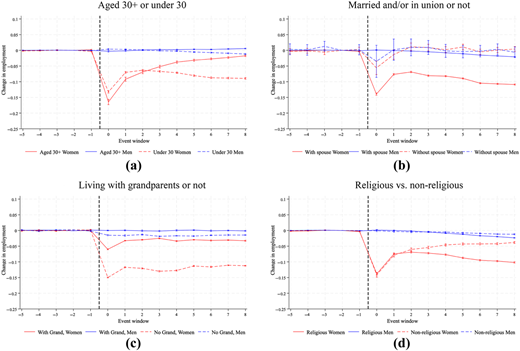
The magnitude of the child penalty may also vary substantially by parental characteristics due to differential constraints and opportunity costs across demographic groups. Meng et al. (2023) and Huang et al. (2025) show that the motherhood penalty in China is not uniform but is heterogeneous by education, hukou status, sectoral employment, family structure and access to informal childcare. In Figure 7, Panel (a) shows that women who give birth at 30 years or above experience a larger employment penalty than younger mothers. However, after childbirth, the child penalty for young mothers is more persistent, probably because they are less career-oriented. Panel (b) of Figure 7 shows that the penalty is smaller for women who are single mothers. Single mothers have a greater burden of sole caregiving, so it may be supposed that their child penalty is higher. However, contrary to common belief, the income effect has a greater impact than the effect of single parenthood. Women who are single parents tend to work more than married women to sustain a basic standard of living, resulting in a smaller child penalty. Panel (c) of Figure 7 shows a penalty of around 7–9 percentage points lower among women who co-reside with their child's grandparents, implying that intergenerational support plays a beneficial role in preserving maternal labor supply, as also highlighted in Chinese society (Meng et al., 2023). Lastly, Panel (d) of Figure 7 shows that women with religious affiliation experience a slightly greater penalty, possibly due to stronger expectations around maternal roles and less economic rationality compared to non-religious women.

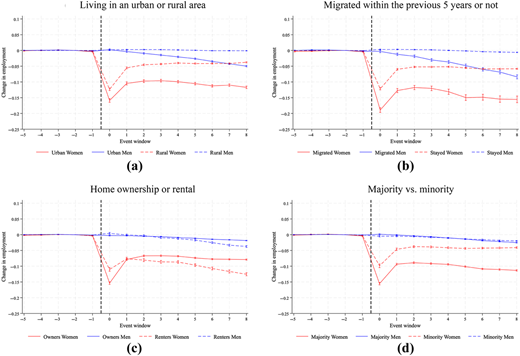
Figure 8 examines differences by place of residence, migration history, housing status and ethnicity. In Panel (a) of Figure 8, urban women tend to have a greater child penalty relative to their rural counterparts. In urban areas, formal sector jobs often require fixed working hours with limited flexibility and long travel times, making it more difficult for women to accommodate motherhood and caregiving. As a result, urban women face steeper trade-offs between work and maternal roles, i.e. higher opportunity costs of childbearing. In Panel (b) of Figure 8, migrants who moved within the previous five years often encounter unstable employment and a greater penalty, in line with the findings of Huang et al. (2025). In Panel (c) of Figure 8, homeowners have a larger penalty compared to renters in the year of childbirth, but then recover from the second year. Panel (d) of Figure 8 shows that Kinh women experience higher penalties than ethnic minority women. This finding aligns with previous research that identifies differences in financial constraints and opportunity costs associated with having a child (Huang et al., 2025).

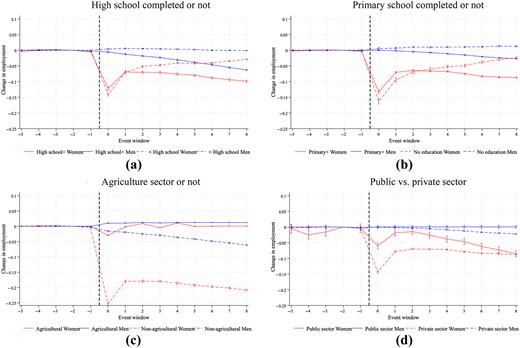
Figure 9 presents a subsample analysis by education level and employment sector. The analysis in Panel (a) of Figure 9 shows that women with less than a high school education experience a larger initial employment shock, likely because the opportunity cost of leaving salaried work is lower for them, meaning that they may be more willing to withdraw from employment to care for a child. However, child penalties for these women also tend to recover more quickly. In contrast, women with at least a high school education suffer a more persistent long-term penalty, given their strong career-oriented employment. Similarly, the disaggregation by at least primary education versus no education in Panel (b) of Figure 9 confirms that women with better education may face a smaller immediate effect in the year of childbirth, while they seem to experience a more prolonged child penalty over time. In Panel (c) of Figure 9, women working in agriculture have a smaller child penalty due to greater work flexibility. Lastly, Panel (d) of Figure 9 shows that women working in the private sector face a greater penalty than those working in the public sector, where maternity leave benefits are commonly applied strictly in line with labor regulations (Vu and Glewwe, 2022).

Generally, the increase in child penalty with economic development and institutional changes aligns with previous studies in large developing countries, such as China (Meng et al., 2023; Zhou et al., 2022) and Russia (Lebedinski et al., 2023). However, few studies have considered smaller developing countries like Vietnam, and this study thus contributes evidence of a child penalty in such countries. The findings are in line with studies by Fajardo-Gonzalez et al. (2024) on Indonesia and Villanueva and Lin (2019) on five Latin American developing countries. However, there are some differences from previous studies. Fajardo-Gonzalez et al. (2024) show that the child penalty lasts for six years, whereas this study indicates that the child penalty might last longer and even increase over time. This difference underscores the challenges faced by governments in developing countries in measuring and monitoring the child penalty and in formulating effective policies.

This study reveals an interesting finding: the child penalty rose much more rapidly over the period 1989 to 2019, from a relatively low level (around 5% in 1989 to nearly 20% in 2019). This pattern appears to differ from the case of China, where the child penalty is persistent and rising, although not at a steady rate (Zhou et al., 2022). Meanwhile, China and Vietnam share similar socioeconomic conditions and have undergone structural changes in recent decades. There are two notable differences: (1) China has implemented a one-child policy, whereas Vietnam has applied one- or two-child policies; and (2) Vietnam exhibits a much higher degree of economic openness through trade and FDI. Accordingly, this study suggests that government policies and economic transformation may play an important role in explaining the child penalty. This question should be examined further in future research.

The regional heterogeneity documented in Section 4 suggests that at an early stage of the economic transition in Vietnam, labor demand increases in a way that is relatively compatible with women's labor supply after childbirth (Gaddis and Klasen, 2014). There was initial progress in labor market structures with increased job opportunities when Vietnam shifted toward a more open economy, with pro-market reforms being implemented by the government. Later economic transformation, including industrialization and formalization, may have increased job demand in terms of time commitment or job stability and could disproportionately affect mothers (Olivetti and Petrongolo, 2014; Petrongolo and Ronchi, 2020).

It is worth emphasizing that regional heterogeneity in child penalty may be explained by underlying factors such as changes in economic structure, access to childcare services, maternity leave policies or social and cultural gender norms. For instance, the Mekong Delta is characterized by rural areas and agricultural employment. Meanwhile, the economic structural changes from agricultural to an industrial economy in Vietnam from the 1990s stimulated a huge flow of labor from the Mekong Delta to central cities like Ho Chi Minh City and industrial provinces such as Binh Duong and Dong Nai for salaried jobs. (These provinces are located in the Southeast region.) As such, the child penalty in developed areas such as Binh Duong, Dong Nai and Ho Chi Minh City is much higher than the child penalty in the Mekong Delta, where the agricultural sector is still the main economic activity. This situation is comparable to that of the Red River Delta, where economic development in Hanoi and the industrialization of nearby provinces are much more advanced than in other areas, particularly in terms of industrial and service activities; thus, the child penalty in Hanoi is much higher. By contrast, regions like the Central Highlands, Central Coast and Northwest have also experienced increases in child penalty since the 1990s, but these changes have been less pronounced (see Figure 10). As mentioned, there is a greater son-preference culture in the north of Vietnam (Guilmoto, 2012), which might mean that women in regions like the Red River Delta may face higher child penalties when entering industrial jobs as they often need to devote more time and energy to caring for their children, particularly sons, after giving birth.

Moreover, the findings of this study support those of Fajardo-Gonzalez et al. (2024) regarding the child penalty in small developing countries. We document substantial variation in the child penalty across regions and demographic groups, and in particular, a markedly higher child penalty in the major urban areas of Ho Chi Minh City and Hanoi. In addition, our evidence indicates that the child penalty in Vietnam is more persistent than in Indonesia. While Fajardo-Gonzalez et al. (2024) show that the child penalty in Indonesia lasts for almost six years, our results suggest that in Vietnam, it lasts for more than eight years and has increased over time.

This study documents the existence of a substantial and persistent motherhood employment penalty in Vietnam over the last three decades, and the magnitude of the penalty has increased over time. Notably, this is the first study to our knowledge to estimate the child penalty systematically at the provincial level in a developing country, Vietnam. In addition, the child penalty is estimated for eight regions, allowing for a wide range of subgroup comparisons.

The findings of an increasing child penalty with economic development and institutional changes align with previous studies in large developing countries, such as China (Meng et al., 2023) and Russia (Lebedinski et al., 2023). The results advocate for a new direction in the child penalty literature, suggesting that there are significant variations in the penalty according to demographic and institutional characteristics in developing countries, with important policy implications. From a theoretical background, the decline in fertility rates can be partially attributed to the increasing opportunity costs faced by women, particularly those with stronger labor market orientation and higher returns to human capital. Moreover, variations in the child penalty are not merely a function of preferences but also structural economic incentives. In particular, women who work under regulated labor conditions, such as those in the public sector, face fewer employment losses.

From a practical perspective, the results of this paper highlight the relevance of both gendered social norms and labor market segmentation in shaping post-childbirth employment trajectories. Addressing the motherhood employment penalty and declining fertility in Vietnam requires policy responses, such as expanding affordable childcare services, increasing flexibility in employment and strengthening formal labor protections for women, particularly in urban and informal labor markets. Providing childcare and employment support for women with children is therefore considered important. Moreover, cities and provinces in Vietnam experiencing significant economic restructuring toward industrial or service sectors should implement targeted policies to address the problem of the child penalty. In particular, current labor regulations in Vietnam allow mothers to take maternity leave for six months, and this study recommends extending this period to 12 months as children at this age are generally considered ready for kindergarten, and mothers may be prepared to return to work. Additionally, more public kindergartens should be built or renovated in areas with high population density, particularly near industrial zones. Given the link between persistent gender gaps and fertility (Cortés and Pan, 2023), understanding and mitigating the child penalty is essential for promoting inclusive and sustainable growth.

While the pseudo-event approach is suitable for studying the child penalty across regions and over time, this approach is not without limitations. The specification assumes that similar non-parents provide an appropriate counterfactual for parents, which may not always be valid if there is time-varying unobserved heterogeneity. It may also fail to account for selection effects, such as when women with strong career preferences delay childbirth. However, given the large census sample, any resulting downward bias is likely to be small. Future research could extend this approach to other developing countries as the availability of panel data improves. Furthermore, it is worth considering the mechanisms underlying the child penalty, such as whether larger penalties for highly educated women are driven by human capital loss, discrimination or limited job flexibility. It is also important to consider how the nature of employment, particularly formal versus informal employment among women, shapes the dynamics of the child penalty. This is especially relevant given that the informal sector is large in Vietnam, a transition economy, and that women's employment is largely concentrated in service jobs. However, this paper is currently constrained by the lack of a reliable data set on the informal sector in Vietnam.

1.

Appendix Figures A1–A4 show consistent patterns when substituting the number of kindergarten classes with the number of kindergarten teachers and students.

The supplementary material for this article can be found online.

Abadie
,
A.
,
Athey
,
S.
,
Imbens
,
G.W.
and
Wooldridge
,
J.M.
(
2022
), “
When should you adjust standard errors for clustering?
”,
Quarterly Journal of Economics
, Vol. 
138
No. 
1
, pp. 
1
-
35
, doi: .
AEA
(
2021
), “
Understanding the child penalty
”,
Emerican economic association, available at:
 Link to the website (
accessed
 28 August 2024).
Andresen
,
M.E.
and
Nix
,
E.
(
2026
), “
You cannot force me into caregiving: paternity leave and the child penalty
”,
The Economic Journal
, Vol. 
136
No. 
674
, pp. 
780
-
797
, doi: .
Angelov
,
N.
,
Johansson
,
P.
and
Lindahl
,
E.
(
2016
), “
Parenthood and the gender gap in pay
”,
Journal of Labor Economics
, Vol. 
34
No. 
3
, pp. 
545
-
579
, doi: .
Badaoui
,
E.
and
Matteazzi
,
E.
(
2026
), “
Cultural-policy framework and mothers' earnings penalty: a European comparison
”,
Kyklos
, Vol. 
79
No. 
1
, pp. 
53
-
69
, doi: .
Blau
,
F.D.
and
Kahn
,
L.M.
(
2017
), “
The gender wage gap: extent, trends, and explanations
”,
Journal of Economic Literature
, Vol. 
55
No. 
3
, pp. 
789
-
865
, doi: .
Buckley
,
J.
(
2023
), “
Formalising and informalising labour in Vietnam
”,
Journal of Contemporary Asia
, Vol. 
53
No. 
2
, pp. 
207
-
232
, doi: .
Budig
,
M.J.
and
Hodges
,
M.J.
(
2010
), “
Differences in disadvantage: variation in the motherhood penalty across white women's earnings distribution
”,
American Sociological Review
, Vol. 
75
No. 
5
, pp. 
705
-
728
, doi: .
Carmichael
,
F.
,
Darko
,
C.
,
Kanji
,
S.
and
Vasilakos
,
N.
(
2023
), “
The contribution of girls' longer hours in unpaid work to gender gaps in early adult employment: evidence from Ethiopia, India, Peru and Vietnam
”,
Feminist Economics
, Vol. 
29
No. 
1
, pp. 
1
-
37
, doi: .
Castel
,
P.
and
To
,
T.-T.
(
2012
), “
Informal employment in the formal sector: wages and social security tax evasion in Vietnam
”,
Journal of the Asia Pacific Economy
, Vol. 
17
No. 
4
, pp. 
616
-
631
, doi: .
Chowdhury
,
I.
,
Johnson
,
H.C.
,
Mannava
,
A.
and
Perova
,
E.
(
2019
), “
Gender gap in earnings in Vietnam: why do Vietnamese women work in lower paid occupations?
”,
Journal of Southeast Asian Economies
, Vol. 
36
No. 
3
, pp. 
400
-
423
.
Chu
,
Y.-W.L.
,
Cuffe
,
H.E.
and
Doan
,
N.
(
2021
), “
Motherhood employment penalty and gender wage gap across countries: 1990-2010
”,
School of Economics and Finance · Te Kura Ohaoha Pūtea: Working Paper Series. Wellington, New Zealand, Victoria University of Wellington
,
Chu
,
Y.-W.L.
,
Cuffe
,
H.E.
and
Doan
,
N.
(
2023
), “
Gender wage gap and child employment penalty across countries
”,
SSRN 3584920
, doi: .
Cortés
,
P.
and
Pan
,
J.
(
2023
), “
Children and the remaining gender gaps in the labor market
”,
Journal of Economic Literature
, Vol. 
61
No. 
4
, pp. 
1359
-
1409
, doi: .
Cukrowska-Torzewska
,
E.
(
2017
), “
Cross-country evidence on motherhood employment and wage gaps: the role of work–family policies and their interaction
”,
Social Politics: International Studies in Gender, State and Society
, Vol. 
24
No. 
2
, pp. 
178
-
220
, doi: .
Cukrowska-Torzewska
,
E.
and
Lovasz
,
A.
(
2020
), “
The role of parenthood in shaping the gender wage gap – a comparative analysis of 26 European countries
”,
Social Science Research
, Vol. 
85
, 102355, doi: .
Cukrowska-Torzewska
,
E.
and
Matysiak
,
A.
(
2020
), “
The motherhood wage penalty: a meta-analysis
”,
Social Science Research
, Vols
88-89
, 102416,
88-89 102416
doi: .
de Linde Leonard
,
M.
and
Stanley
,
T.D.
(
2020
), “
The wages of mothers' labor: a meta-regression analysis
”,
Journal of Marriage and Family
, Vol. 
82
No. 
5
, pp. 
1534
-
1552
, doi: .
Di Leo
,
R.
,
Epifanio
,
M.
,
Scotto
,
T.J.
and
Troeger
,
V.E.
(
2026
), “
The motherhood penalties: insights from women in UK academia
”,
Community, Work and Family
, pp. 
1
-
23
, doi: .
Doan
,
N.
,
Nguyen
,
C.P.
and
Dinh Su
,
T.
(
2025a
), “
Does fiscal decentralization reduce energy poverty? Evidence from Vietnam
”,
Energy Policy
, Vol. 
207
, 114845, doi: .
Doan
,
N.
,
Nguyen
,
C.P.
,
Su
,
T.D.
,
Nguyen
,
B.Q.
and
Le Tran
,
D.T.
(
2025b
), “
Multi-dimensional energy poverty and inequality in Vietnam
”,
Quality and Quantity
, Vol. 
59
No. 
6
, pp. 
5179
-
5210
, doi: .
Doss
,
C.
and
Gottlieb
,
C.
(
2025
), “
Gendered patterns of labor in agriculture
”,
Agricultural Economics
, Vol. 
56
No. 
3
, pp. 
431
-
445
, doi: .
Duletzki
,
L.-M.
and
Lim
,
N.
(
2026
), “
Can early public childcare reduce child penalties? Evidence from Germany
”,
Journal of Public Economics
, Vol. 
258
, 105651, doi: .
Fajardo-Gonzalez
,
J.
,
Hasanbasri
,
A.
and
Rios-Avila
,
F.
(
2024
),
Is There a Gendered Parenthood Penalty in Indonesian Labor Markets?
,
World Bank
,
Washington, DC
.
Felfe
,
C.
(
2012
), “
The motherhood wage gap: what about job amenities?
”,
Labour Economics
, Vol. 
19
No. 
1
, pp. 
59
-
67
, doi: .
Gaddis
,
I.
and
Klasen
,
S.
(
2014
), “
Economic development, structural change, and women's labor force participation
”,
Journal of Population Economics
, Vol. 
27
No. 
3
, pp. 
639
-
681
, doi: .
Goodkind
,
D.M.
(
1995
), “
Vietnam's one-or-two-child policy in action
”,
Population and Development Review
, Vol. 
21
No. 
1
, pp. 
85
-
111
, doi: .
Guilmoto
,
C.Z.
(
2012
), “
Son preference, sex selection, and kinship in Vietnam
”,
Population and Development Review
, Vol. 
38
No. 
1
, pp. 
31
-
54
, doi: .
Harrington
,
E.
and
Kahn
,
M.E.
(
2026
), “
Has the rise of work from Home reduced the motherhood penalty in the labor market?
”,
National Tax Journal
, Vol. 
79
No. 
2
, pp. 
507
-
527
, doi: .
Hoa
,
H.T.
,
Toan
,
N.V.
,
Johansson
,
A.
,
Hoa
,
V.T.
,
Hojer
,
B.
and
Persson
,
L.A.
(
1996
), “
Child spacing and two child policy in practice in rural Vietnam: cross sectional survey
”,
BMJ
, Vol. 
313
No. 
7065
, pp. 
1113
-
1116
, doi: .
Huang
,
W.
,
Wang
,
Y.
,
Wu
,
H.
and
Zhou
,
Y.
(
2025
), “
The motherhood penalty and low fertility in China: a pseudo-event study
”,
Journal of Population Economics
, Vol. 
38
No. 
1
, p.
28
, doi: .
Jee
,
E.
,
Misra
,
J.
and
Murray-Close
,
M.
(
2019
), “
Motherhood penalties in the U.S., 1986-2014
”,
Journal of Marriage and Family
, Vol. 
81
No. 
2
, pp. 
434
-
449
, doi: .
Jin
,
M.
,
Landais
,
C.
,
Sevilla Sanz
,
A.S.
and
Dodds
,
A.
(
2024
), “
The ‘child penalty’ creates most of the gender earnings gaps in rich countries
”,
LSE Business Review
,
available at
: Link to the website (
accessed 04 December, 2025
).
Kang
,
J.Y.
,
Lee
,
W.
,
Ham
,
S.
and
Wang
,
J.S.-H.
(
2024
), “
Motherhood or marriage penalty? A comparative perspective on employment and wage in East Asia and Western countries
”,
Family Relations
, Vol. 
73
No. 
1
, pp. 
223
-
246
, doi: .
Kleven
,
H.
(
2022
),
The Geography of Child Penalties and Gender Norms: A Pseudo-event Study Approach
,
National Bureau of Economic Research
,
Cambridge, MA
.
Kleven
,
H.
,
Landais
,
C.
,
Posch
,
J.
,
Steinhauer
,
A.
and
Zweimüller
,
J.
(
2019a
), “
Child penalties across countries: evidence and explanations
”,
AEA Papers and Proceedings
, Vol. 
109
, pp. 
122
-
126
, doi: .
Kleven
,
H.
,
Landais
,
C.
and
Søgaard
,
J.E.
(
2019b
), “
Children and gender inequality: evidence from Denmark
”,
American Economic Journal: Applied Economics
, Vol. 
11
No. 
4
, pp. 
181
-
209
, doi: .
Kleven
,
H.
,
Landais
,
C.
and
Søgaard
,
J.E.
(
2021
), “
Does biology drive child penalties? Evidence from biological and adoptive families
”,
The American Economic Review: Insights
, Vol. 
3
No. 
2
, pp. 
183
-
198
, doi: .
Kleven
,
H.
,
Landais
,
C.
and
Leite-Mariante
,
G.
(
2025
), “
The child penalty atlas
”,
The Review of Economic Studies
, Vol. 
92
No. 
5
, pp. 
3174
-
3207
, doi: .
Kong
,
S.
and
Dong
,
H.
(
2024
), “
The doubly disadvantaged: the motherhood penalty for internal migrants in China
”,
Journal of Marriage and Family
, Vol. 
86
No. 
1
, pp. 
199
-
218
, doi: .
Lebedinski
,
L.
,
Perugini
,
C.
and
Vladisavljević
,
M.
(
2023
), “
Child penalty in Russia: evidence from an event study
”,
Review of Economics of the Household
, Vol. 
21
No. 
1
, pp. 
173
-
215
, doi: .
Liu
,
A.Y.C.
(
2004
), “
Gender wage gap in Vietnam: 1993 to 1998
”,
Journal of Comparative Economics
, Vol. 
32
No. 
3
, pp. 
586
-
596
, doi: .
Liu
,
Y.
,
Barrett
,
C.B.
,
Pham
,
T.
and
Violette
,
W.
(
2020
), “
The intertemporal evolution of agriculture and labor over a rapid structural transformation: lessons from Vietnam
”,
Food Policy
, Vol. 
94
, 101913, doi: .
Marjit
,
S.
,
Gupta
,
K.
,
Nag
,
R.N.
,
Mahata
,
S.
and
Basak
,
S.
(
2026
), “
Transcending boundaries: navigating structural shifts and labor market transitions through global value chains
”,
Review of Development Economics
, Vol. 
30
No. 
1
, pp. 
662
-
678
, doi: .
McCaig
,
B.
and
Pavcnik
,
N.
(
2013
), “
Moving out of agriculture: structural change in Vietnam
”,
NBER Working Paper, Cambridge, MA, US, National Bureau of Economic Research
, doi: .
Meng
,
L.
,
Zhang
,
Y.
and
Zou
,
B.
(
2023
), “
The motherhood penalty in China: magnitudes, trends, and the role of grandparenting
”,
Journal of Comparative Economics
, Vol. 
51
No. 
1
, pp. 
105
-
132
, doi: .
Miller
,
D.L.
(
2023
), “
An introductory guide to event study models
”,
The Journal of Economic Perspectives
, Vol. 
37
No. 
2
, pp. 
203
-
230
, doi: .
Mincer
,
J.
and
Polachek
,
S.
(
1974
), “
Family investments in human capital: earnings of women
”,
Journal of Political Economy
, Vol. 
82
No. 
2
,
Part 2
, pp. 
S76
-
S108
, doi: .
Nguyen
,
A.-T.
,
Anwar
,
S.
,
Alexander
,
W.R.J.
and
Lu
,
S.-H.
(
2022
), “
Openness to trade, foreign direct investment, and economic growth in Vietnam
”,
Applied Economics
, Vol. 
54
No. 
29
, pp. 
3373
-
3391
, doi: .
Obermann
,
G.
,
Hoang Oanh
,
N.
and
Hong Ngoc
,
N.
(
2021
), “
Gender pay gap in Vietnam: a propensity score matching analysis
”,
Journal of Economics and Development
, Vol. 
23
No. 
3
, pp. 
238
-
253
, doi: .
Olivetti
,
C.
and
Petrongolo
,
B.
(
2014
), “
Gender gaps across countries and skills: demand, supply and the industry structure
”,
Review of Economic Dynamics
, Vol. 
17
No. 
4
, pp. 
842
-
859
, doi: .
Petrongolo
,
B.
and
Ronchi
,
M.
(
2020
), “
Gender gaps and the structure of local labor markets
”,
Labour Economics
, Vol. 
64
, 101819, doi: .
Rodrigues-Silveira
,
R.
(
2025
), “Structural changes in Brazilian employment (2002-2021)”, in
Torrejón Pérez
,
S.
,
Fernández-Macías
,
E.
and
Hurley
,
J.
(Eds),
Global Trends in Job Polarisation and Upgrading: A Comparison of Developed and Developing Economies
,
Springer Nature Switzerland
,
Cham
, pp. 
201
-
230
, doi: .
Sundberg
,
A.
(
2024
), “
The child penalty in Sweden: evidence, trends, and child gender
”,
IFAU working paper, Uppsala, Sweden, IFAU-Institute for Evaluation of Labour Market and Education Policy
.
Tuyen
,
N.N.
(
1999
), “
Transitional economy, technological change and women's employment: the case of Vietnam
”,
Gender, Technology and Development
, Vol. 
3
No. 
1
, pp. 
43
-
64
, doi: .
Udayanga
,
S.
(
2024
), “
Motherhood penalty and labour market integration of immigrant women: a review on evidence from four OECD countries
”,
Societies
, Vol. 
14
No. 
9
, p.
162
, doi: .
Villanueva
,
A.
and
Lin
,
K.-H.
(
2019
), “
Motherhood wage penalties in Latin America: the significance of labor informality
”,
Social Forces
, Vol. 
99
No. 
1
, pp. 
59
-
85
, doi: .
Vo
,
T.T.
and
Truong
,
T.-H.
(
2023
), “
Gender division of household workforce in Vietnam: role of international trade and fertility
”,
Economic Analysis and Policy
, Vol. 
80
, pp. 
1696
-
1718
, doi: .
Vo
,
P.H.
,
Penrose
,
K.
and
Jody Heymann
,
S.
(
2007
), “
Working to exit poverty while caring for children's health and development in Vietnam
”,
Community, Work and Family
, Vol. 
10
No. 
2
, pp. 
179
-
199
, doi: .
Vu
,
K.
and
Glewwe
,
P.
(
2022
), “
Maternity benefits mandate and women's choice of work in Vietnam
”,
World Development
, Vol. 
158
, 105964, doi: .
Vu
,
T.M.
and
Yamada
,
H.
(
2018
), “
Decomposing Vietnamese gender equality in terms of wage distribution
”,
Pacific Economic Review
, Vol. 
23
No. 
5
, pp. 
705
-
731
, doi: .
White
,
M.J.
,
Djamba
,
Y.K.
and
Anh
,
D.N.
(
2001
), “
Implications of economic reform and spatial mobility for fertility in Vietnam
”,
Population Research and Policy Review
, Vol. 
20
No. 
3
, pp. 
207
-
228
, doi: .
Zamberlan
,
A.
and
Barbieri
,
P.
(
2023
), “
A ‘potential motherhood’ penalty? A longitudinal analysis of the wage gap based on potential fertility in Germany and the United Kingdom
”,
European Sociological Review
, Vol. 
39
No. 
6
, pp. 
920
-
934
, doi: .
Zhang
,
M.
,
Wang
,
Y.
and
Hou
,
L.
(
2024
), “
Gender norms and the child penalty in China
”,
Journal of Economic Behavior and Organization
, Vol. 
221
, pp. 
277
-
291
, doi: .
Zhou
,
X.
,
Ye
,
J.
,
Li
,
H.
and
Yu
,
H.
(
2022
), “
The rising child penalty in China
”,
China Economic Review
, Vol. 
76
, 101869, doi: .
Published in Journal of Economics, Finance and Administrative Science. Published by Emerald Publishing Limited. This article is published under the Creative Commons Attribution (CC BY 4.0) licence. Anyone may reproduce, distribute, translate and create derivative works of this article (for both commercial and non-commercial purposes), subject to full attribution to the original publication and authors. The full terms of this licence maybe seen at Link to the terms of the CC BY 4.0 licence.

Supplementary data

Data & Figures

Figure 1
Two line graphs depict employment rates by age and age at first childbirth for women and men across different years.Two line graphs depict employment rates by age and age at first childbirth for women and men across different years. Panel A shows employment rates by age. The x-axis represents age ranging from 20 to 60, and the y-axis represents employment rates ranging from 0.4 to 1. The graph includes data for women and men from the years 1989, 1999, 2009, and 2019. Solid lines represent female employment rates, while dashed lines represent male employment rates. Panel B shows employment rates by age at the first childbirth. The x-axis represents age at first childbirth ranging from 18 to 44, and the y-axis represents employment rates ranging from 0.2 to 1. Similar to Panel A, this graph also includes data for women and men from the years 1989, 1999, 2009, and 2019, with solid lines for female employment rates and dashed lines for male employment rates.

Parents' employment and demographic characteristics. Notes: This figure presents female and male employment rates across different censuses: 1989, 1999, 2009 and 2019. Panel (a) illustrates employment rates by age, while Panel (b) shows employment rates by age at the first childbirth. Female employment rates (solid lines) and male employment rates (dashed lines) are shown separately for each cohort. Source: Authors’ illustration

Figure 1
Two line graphs depict employment rates by age and age at first childbirth for women and men across different years.Two line graphs depict employment rates by age and age at first childbirth for women and men across different years. Panel A shows employment rates by age. The x-axis represents age ranging from 20 to 60, and the y-axis represents employment rates ranging from 0.4 to 1. The graph includes data for women and men from the years 1989, 1999, 2009, and 2019. Solid lines represent female employment rates, while dashed lines represent male employment rates. Panel B shows employment rates by age at the first childbirth. The x-axis represents age at first childbirth ranging from 18 to 44, and the y-axis represents employment rates ranging from 0.2 to 1. Similar to Panel A, this graph also includes data for women and men from the years 1989, 1999, 2009, and 2019, with solid lines for female employment rates and dashed lines for male employment rates.

Parents' employment and demographic characteristics. Notes: This figure presents female and male employment rates across different censuses: 1989, 1999, 2009 and 2019. Panel (a) illustrates employment rates by age, while Panel (b) shows employment rates by age at the first childbirth. Female employment rates (solid lines) and male employment rates (dashed lines) are shown separately for each cohort. Source: Authors’ illustration

Close modal
Figure 2
Two line graphs showing employment rates by age of youngest child and number of children for men and women across different years.Two line graphs compare employment rates by age of youngest child and number of children for men and women across different years. The first graph shows employment rates by age of the youngest child, with solid lines representing women and dashed lines representing men. The second graph shows employment rates by the number of children, again with solid lines for women and dashed lines for men. Each line represents data from different years: 1989, 1999, 2009, and 2019. The x-axis of the first graph represents the age of the youngest child, while the y-axis represents employment rates. The x-axis of the second graph represents the number of children, while the y-axis represents employment rates. The graphs illustrate trends and differences in employment rates over time and across different family structures.

Parents’ employment and demographic characteristics. Notes: This figure presents female and male employment rates across different censuses: 1989, 1999, 2009 and 2019. Panel (a) illustrates employment rates by age of the youngest child, while Panel (b) shows employment rates by the number of children. Female employment rates (solid lines) and male employment rates (dashed lines) are shown separately for each cohort. Source: Authors’ illustration

Figure 2
Two line graphs showing employment rates by age of youngest child and number of children for men and women across different years.Two line graphs compare employment rates by age of youngest child and number of children for men and women across different years. The first graph shows employment rates by age of the youngest child, with solid lines representing women and dashed lines representing men. The second graph shows employment rates by the number of children, again with solid lines for women and dashed lines for men. Each line represents data from different years: 1989, 1999, 2009, and 2019. The x-axis of the first graph represents the age of the youngest child, while the y-axis represents employment rates. The x-axis of the second graph represents the number of children, while the y-axis represents employment rates. The graphs illustrate trends and differences in employment rates over time and across different family structures.

Parents’ employment and demographic characteristics. Notes: This figure presents female and male employment rates across different censuses: 1989, 1999, 2009 and 2019. Panel (a) illustrates employment rates by age of the youngest child, while Panel (b) shows employment rates by the number of children. Female employment rates (solid lines) and male employment rates (dashed lines) are shown separately for each cohort. Source: Authors’ illustration

Close modal
Figure 3
Four line graphs showing change in employment around first childbirth for men and women in Vietnam across 1989, 1999, 2009, and 2019.Four line graphs compare the change in employment around the time of the first childbirth for men and women in Vietnam across four censuses: 1989, 1999, 2009, and 2019. Each graph has two lines: one for women represented by red circles and one for men represented by blue squares. The x-axis represents the event window, ranging from -5 to 8 years around childbirth, while the y-axis shows the change in employment, ranging from -0.2 to 0.1. The vertical dashed line at 0 marks the year of childbirth. The graphs show that women consistently experience a greater drop in employment after childbirth compared to men across all years. The decline for women is most pronounced in 2009 and 2019. Men's employment remains relatively stable across all years.

Change in child penalty in Vietnam over 1989–2019. Notes: This figure presents event study estimates of the change in employment around the time of the first childbirth for men and women in Vietnam across four censuses: 1989, 1999, 2009 and 2019. Panels a–d show the average change in employment before and after childbirth, with separate trends for women (red circles) and men (blue squares). The estimates reflect changes relative to the year before childbirth and include 95% confidence intervals. Source: Authors’ illustration

Figure 3
Four line graphs showing change in employment around first childbirth for men and women in Vietnam across 1989, 1999, 2009, and 2019.Four line graphs compare the change in employment around the time of the first childbirth for men and women in Vietnam across four censuses: 1989, 1999, 2009, and 2019. Each graph has two lines: one for women represented by red circles and one for men represented by blue squares. The x-axis represents the event window, ranging from -5 to 8 years around childbirth, while the y-axis shows the change in employment, ranging from -0.2 to 0.1. The vertical dashed line at 0 marks the year of childbirth. The graphs show that women consistently experience a greater drop in employment after childbirth compared to men across all years. The decline for women is most pronounced in 2009 and 2019. Men's employment remains relatively stable across all years.

Change in child penalty in Vietnam over 1989–2019. Notes: This figure presents event study estimates of the change in employment around the time of the first childbirth for men and women in Vietnam across four censuses: 1989, 1999, 2009 and 2019. Panels a–d show the average change in employment before and after childbirth, with separate trends for women (red circles) and men (blue squares). The estimates reflect changes relative to the year before childbirth and include 95% confidence intervals. Source: Authors’ illustration

Close modal
Figure 4
Two histograms depict the distribution of placebo child penalty estimates.Two histograms depict the distribution of placebo child penalty estimates. Panel A shows the histogram of all placebo estimates. The x-axis represents the estimated placebo effect ranging from -0.1 to 0.1, and the y-axis represents the density. A red dashed line indicates the actual estimate at approximately -0.05. The 2-sided p-value is 0.0254. Panel B shows the histogram of best-fit placebo estimates. The x-axis represents the estimated placebo effect ranging from -0.1 to 0.1, and the y-axis represents the density. A red dashed line indicates the actual estimate at approximately -0.05. The 2-sided p-value is 0.0263.

Placebo estimates. Notes: Distribution of placebo child penalty estimates. The blue lines represent histograms of placebo estimates of the overall effect of childbirth on employment, while the red dashed line represents the actual estimate in Model 1 of Table 2. In Panel (a), all placebos are used, whereas in Panel (b), only 75% of the placebos with the least RMSPE are used; 2-sided p-values are calculated using these placebo estimates. Source: Authors’ elaborations

Figure 4
Two histograms depict the distribution of placebo child penalty estimates.Two histograms depict the distribution of placebo child penalty estimates. Panel A shows the histogram of all placebo estimates. The x-axis represents the estimated placebo effect ranging from -0.1 to 0.1, and the y-axis represents the density. A red dashed line indicates the actual estimate at approximately -0.05. The 2-sided p-value is 0.0254. Panel B shows the histogram of best-fit placebo estimates. The x-axis represents the estimated placebo effect ranging from -0.1 to 0.1, and the y-axis represents the density. A red dashed line indicates the actual estimate at approximately -0.05. The 2-sided p-value is 0.0263.

Placebo estimates. Notes: Distribution of placebo child penalty estimates. The blue lines represent histograms of placebo estimates of the overall effect of childbirth on employment, while the red dashed line represents the actual estimate in Model 1 of Table 2. In Panel (a), all placebos are used, whereas in Panel (b), only 75% of the placebos with the least RMSPE are used; 2-sided p-values are calculated using these placebo estimates. Source: Authors’ elaborations

Close modal
Figure 5
A scatter plot showing the relationship between the estimated child penalty and the number of kindergarten classes per 1,000 people across different regions in Vietnam for the years 1999, 2009, and 2019.A scatter plot showing the relationship between the estimated child penalty and the number of kindergarten classes per 1,000 people across different regions in Vietnam for the years 1999, 2009, and 2019. The horizontal axis represents the number of kindergarten classes per 1,000 people, ranging from 0.5 to 2.5. The vertical axis represents the estimated child penalty, ranging from -0.15 to 0.05. Each data point corresponds to a region-year estimate with 95 percent confidence intervals. The data points are color-coded by year: blue circles for 1999, red triangles for 2009, and green diamonds for 2019. The plot includes a regression line indicating a correlation between the number of kindergarten classes and the estimated child penalty. The regions are labeled as Central Coast (CEC), Central Highlands (CEH), Mekong Delta (MED), North Central (NOC), Northeast (NOE), Northwest (NOW), Red River Delta (RRD), and Southeast (SOU).

Relationship between child penalty and kindergarten classes by region. Notes: This figure plots the relationship between the estimated child penalty against the availability of kindergarten classes across regions in Vietnam, for the census years 1999, 2009 and 2019. The y-axis shows the estimated child penalty, while the x-axis shows the number of kindergarten classes per 1,000 people in each region, with data collected from GSO. Each marker corresponds to a region-year estimate with 95% confidence intervals. Source: Authors’ illustration

Figure 5
A scatter plot showing the relationship between the estimated child penalty and the number of kindergarten classes per 1,000 people across different regions in Vietnam for the years 1999, 2009, and 2019.A scatter plot showing the relationship between the estimated child penalty and the number of kindergarten classes per 1,000 people across different regions in Vietnam for the years 1999, 2009, and 2019. The horizontal axis represents the number of kindergarten classes per 1,000 people, ranging from 0.5 to 2.5. The vertical axis represents the estimated child penalty, ranging from -0.15 to 0.05. Each data point corresponds to a region-year estimate with 95 percent confidence intervals. The data points are color-coded by year: blue circles for 1999, red triangles for 2009, and green diamonds for 2019. The plot includes a regression line indicating a correlation between the number of kindergarten classes and the estimated child penalty. The regions are labeled as Central Coast (CEC), Central Highlands (CEH), Mekong Delta (MED), North Central (NOC), Northeast (NOE), Northwest (NOW), Red River Delta (RRD), and Southeast (SOU).

Relationship between child penalty and kindergarten classes by region. Notes: This figure plots the relationship between the estimated child penalty against the availability of kindergarten classes across regions in Vietnam, for the census years 1999, 2009 and 2019. The y-axis shows the estimated child penalty, while the x-axis shows the number of kindergarten classes per 1,000 people in each region, with data collected from GSO. Each marker corresponds to a region-year estimate with 95% confidence intervals. Source: Authors’ illustration

Close modal
Figure 6
A scatter plot showing the relationship between changes in child penalty and kindergarten classes by region per decade.A scatter plot showing the relationship between changes in child penalty and kindergarten classes by region per decade. The x-axis represents the change in kindergarten classes per 1,000 people, ranging from negative 0.2 to 0.8. The y-axis represents the change in estimated child penalty, ranging from negative 0.1 to 0.05. The data points are color-coded: red circles for the period 1999-2009 and blue triangles for the period 2009-2019. The plot includes a regression line indicating a weak correlation. Notable data points include regions like NOC, CEC, MED, CEH, SOU, and RRD. All values are approximated.

Relationship between changes in child penalty and kindergarten classes by region per decade. Notes: This figure depicts the relationship between changes in the estimated child penalty and changes in the availability of kindergarten classes across regions in Vietnam. The y-axis shows the change in the estimated employment penalty for women after childbirth, while the x-axis shows the change in the number of kindergarten classes per 1,000 people in each region. Source: Authors’ illustration

Figure 6
A scatter plot showing the relationship between changes in child penalty and kindergarten classes by region per decade.A scatter plot showing the relationship between changes in child penalty and kindergarten classes by region per decade. The x-axis represents the change in kindergarten classes per 1,000 people, ranging from negative 0.2 to 0.8. The y-axis represents the change in estimated child penalty, ranging from negative 0.1 to 0.05. The data points are color-coded: red circles for the period 1999-2009 and blue triangles for the period 2009-2019. The plot includes a regression line indicating a weak correlation. Notable data points include regions like NOC, CEC, MED, CEH, SOU, and RRD. All values are approximated.

Relationship between changes in child penalty and kindergarten classes by region per decade. Notes: This figure depicts the relationship between changes in the estimated child penalty and changes in the availability of kindergarten classes across regions in Vietnam. The y-axis shows the change in the estimated employment penalty for women after childbirth, while the x-axis shows the change in the number of kindergarten classes per 1,000 people in each region. Source: Authors’ illustration

Close modal
Figure 7
Multiple line graphs depict changes in employment across different demographic and household groups.Four line graphs depict changes in employment across different demographic and household groups. Panel A shows the change in employment for men and women aged 30+ and under 30 around the time of childbirth. The x-axis represents the event window in years, ranging from -5 to 8, and the y-axis represents the change in employment, ranging from -0.25 to 0.1. The graph indicates that women aged 30+ experience a significant drop in employment around the time of childbirth, while men and women under 30 show minimal change. Panel B illustrates the change in employment for men and women with and without a spouse or union around the time of childbirth. The x-axis and y-axis are the same as in Panel A. Women with a spouse experience a notable drop in employment, whereas those without a spouse and men show less pronounced changes. Panel C presents the change in employment for men and women living with or without grandparents around the time of childbirth. Panel D shows the variation by religious status. The x-axis and y-axis remain the same.

Child penalty across age, marriage, grandparental support and religious groups. Notes: This figure shows differences in the employment impact of childbirth for men and women across demographic and household groups. Each panel compares employment trends for men and women by subgroup: (a) age at childbirth (under 30 vs. 30+), (b) marital or union status, (c) living with a child's grandparents or not and (d) religious status. The estimates reflect changes relative to the year before childbirth and include 95% confidence intervals. Source: Authors’ illustration

Figure 7
Multiple line graphs depict changes in employment across different demographic and household groups.Four line graphs depict changes in employment across different demographic and household groups. Panel A shows the change in employment for men and women aged 30+ and under 30 around the time of childbirth. The x-axis represents the event window in years, ranging from -5 to 8, and the y-axis represents the change in employment, ranging from -0.25 to 0.1. The graph indicates that women aged 30+ experience a significant drop in employment around the time of childbirth, while men and women under 30 show minimal change. Panel B illustrates the change in employment for men and women with and without a spouse or union around the time of childbirth. The x-axis and y-axis are the same as in Panel A. Women with a spouse experience a notable drop in employment, whereas those without a spouse and men show less pronounced changes. Panel C presents the change in employment for men and women living with or without grandparents around the time of childbirth. Panel D shows the variation by religious status. The x-axis and y-axis remain the same.

Child penalty across age, marriage, grandparental support and religious groups. Notes: This figure shows differences in the employment impact of childbirth for men and women across demographic and household groups. Each panel compares employment trends for men and women by subgroup: (a) age at childbirth (under 30 vs. 30+), (b) marital or union status, (c) living with a child's grandparents or not and (d) religious status. The estimates reflect changes relative to the year before childbirth and include 95% confidence intervals. Source: Authors’ illustration

Close modal
Figure 8
Four line graphs compare employment changes after childbirth across different groups.The image contains four line graphs comparing employment changes after childbirth across different groups. Each graph shows trends for men and women in different categories: urban versus rural residence, migration status in the past five years, housing tenure, and ethnicity. The x-axis represents the event window, while the y-axis shows the change in employment. Each line represents a different subgroup, with solid lines for women and dashed lines for men. The graphs indicate that women generally experience a more significant drop in employment after childbirth compared to men, with variations across the different groups.

Child penalty across residence, migration, tenure and ethnicity groups. Notes: This figure shows differences in the employment impact of childbirth for men and women across residential, migration, housing and ethnicity groups. Each panel compares employment trends for men and women by subgroup: (a) urban vs. rural residence, (b) migration status in the past five years, (c) housing tenure (ownership vs. rental) and (d) ethnicity (majority vs. minority). The estimates reflect changes relative to the year before childbirth and include 95% confidence intervals. Source: Authors’ illustration

Figure 8
Four line graphs compare employment changes after childbirth across different groups.The image contains four line graphs comparing employment changes after childbirth across different groups. Each graph shows trends for men and women in different categories: urban versus rural residence, migration status in the past five years, housing tenure, and ethnicity. The x-axis represents the event window, while the y-axis shows the change in employment. Each line represents a different subgroup, with solid lines for women and dashed lines for men. The graphs indicate that women generally experience a more significant drop in employment after childbirth compared to men, with variations across the different groups.

Child penalty across residence, migration, tenure and ethnicity groups. Notes: This figure shows differences in the employment impact of childbirth for men and women across residential, migration, housing and ethnicity groups. Each panel compares employment trends for men and women by subgroup: (a) urban vs. rural residence, (b) migration status in the past five years, (c) housing tenure (ownership vs. rental) and (d) ethnicity (majority vs. minority). The estimates reflect changes relative to the year before childbirth and include 95% confidence intervals. Source: Authors’ illustration

Close modal
Figure 9
Four line graphs showing employment impact of childbirth by education level and sector.The image contains four line graphs comparing the employment impact of childbirth for men and women across different education levels and employment sectors. Each graph has an event window on the x-axis ranging from -5 to 8 and a change in employment on the y-axis ranging from -0.25 to 0.1. The first graph (a) compares high school completion for women and men, showing a notable dip in employment for women around the event window. The second graph (b) compares primary school completion for women and men, also showing a significant drop in employment for women around the event window. The third graph (c) compares employment in the agriculture sector for women and men, indicating a sharp decline in employment for women around the event window. The fourth graph (d) compares employment in the public versus private sector for women and men, showing a decrease in employment for women around the event window.

Child penalty by education level and employment sector. Notes: This figure shows differences in the employment impact of childbirth for men and women with education levels and industry sectors. Each panel compares employment trends by subgroup: (a) high school completion, (b) primary school completion, (c) employment in the agriculture sector and (d) employment in the public vs. private sector. The estimates reflect changes relative to the year before childbirth and include 95% confidence intervals. Source: Authors’ illustration

Figure 9
Four line graphs showing employment impact of childbirth by education level and sector.The image contains four line graphs comparing the employment impact of childbirth for men and women across different education levels and employment sectors. Each graph has an event window on the x-axis ranging from -5 to 8 and a change in employment on the y-axis ranging from -0.25 to 0.1. The first graph (a) compares high school completion for women and men, showing a notable dip in employment for women around the event window. The second graph (b) compares primary school completion for women and men, also showing a significant drop in employment for women around the event window. The third graph (c) compares employment in the agriculture sector for women and men, indicating a sharp decline in employment for women around the event window. The fourth graph (d) compares employment in the public versus private sector for women and men, showing a decrease in employment for women around the event window.

Child penalty by education level and employment sector. Notes: This figure shows differences in the employment impact of childbirth for men and women with education levels and industry sectors. Each panel compares employment trends by subgroup: (a) high school completion, (b) primary school completion, (c) employment in the agriculture sector and (d) employment in the public vs. private sector. The estimates reflect changes relative to the year before childbirth and include 95% confidence intervals. Source: Authors’ illustration

Close modal
Figure 10
A bar graph showing changes in the child penalty across different regions in Vietnam over three time periods.A horizontal bar graph compares changes in the child penalty across different regions in Vietnam over three time periods: 1989-1999, 1999-2009, and 2009-2019. The horizontal axis represents the change in effect size, ranging from -0.15 to 0.10. The vertical axis lists the regions: Mekong Delta, Southeast, Central Highlands, Central Coast, North Central, Northwest, Northeast, and Red River Delta. The graph uses three colors to represent different time periods: blue for 1989-1999, beige for 1999-2009, and black for 2009-2019. Each region has three horizontal bars, one for each time period, showing the change in effect size. Specific values for each bar are visible and indicate the magnitude of change in effect size for each region and time period.

Child penalty changes by region and year. Notes: This figure illustrates changes in the child penalty across regions in Vietnam over three time periods: 1989–1999, 1999–2009 and 2009–2019. Bars represent the change in effect size of the child penalty by region, comparing female employment outcomes before and after childbirth. Source: Authors’ illustration

Figure 10
A bar graph showing changes in the child penalty across different regions in Vietnam over three time periods.A horizontal bar graph compares changes in the child penalty across different regions in Vietnam over three time periods: 1989-1999, 1999-2009, and 2009-2019. The horizontal axis represents the change in effect size, ranging from -0.15 to 0.10. The vertical axis lists the regions: Mekong Delta, Southeast, Central Highlands, Central Coast, North Central, Northwest, Northeast, and Red River Delta. The graph uses three colors to represent different time periods: blue for 1989-1999, beige for 1999-2009, and black for 2009-2019. Each region has three horizontal bars, one for each time period, showing the change in effect size. Specific values for each bar are visible and indicate the magnitude of change in effect size for each region and time period.

Child penalty changes by region and year. Notes: This figure illustrates changes in the child penalty across regions in Vietnam over three time periods: 1989–1999, 1999–2009 and 2009–2019. Bars represent the change in effect size of the child penalty by region, comparing female employment outcomes before and after childbirth. Source: Authors’ illustration

Close modal
Table 1

Summary statistics

Women (N = 70234)Men (N = 69628)
VariableMean[SD]Mean[SD]
Age25.50[4.44]27.69[4.78]
Currently employed (1 = yes)0.75[0.43]0.97[0.18]
First birth is a boy (1 = yes)0.52[0.50]0.52[0.50]
Married or in a union (1 = yes)0.98[0.13]0.98[0.05]
Grandparent in household (1 = yes)0.07[0.25]0.07[0.25]
Has a religion (1 = has any religion)0.14[0.34]0.14[0.35]
Living in an urban area (1 = yes)0.36[0.48]0.33[0.47]
Moved within the last 5 years (1 = yes)0.21[0.41]0.15[0.36]
Dwelling owned by household (1 = yes)0.84[0.37]0.85[0.35]
Ethnic majority (1 = Kinh)0.82[0.39]0.81[0.39]
Completed high school or more (1 = yes)0.35[0.48]0.30[0.46]
Completed at least primary level (1 = yes)0.83[0.38]0.82[0.39]
Employed in agriculture (1 = yes)0.36[0.48]0.45[0.50]
Employed in public sector (1 = yes)0.02[0.15]0.03[0.17]

Note(s): This table presents the summary statistics of employment outcomes and demographic variables used in the analysis. The data are derived from the Vietnam Population and Housing Censuses in 1989, 1999, 2009 and 2019. Means and standard deviations (in brackets) are shown for each group. The employed in public sector variable is based on the IPUMS Census sector of employment variable. The indicator equals one for individuals classified as employed in the public sector (code 10) and zero otherwise

Source(s): Authors’ calculations
Table 2

Dynamic effects of childbirth on female employment

Full sampleExcluding Ho Chi Minh City and HanoiHo Chi Minh CityHanoi
(1)(2)(3)(4)
Overall effect−0.0559***(0.0004)−0.0523***(0.0004)−0.1644***(0.0030)−0.0501***(0.0030)
Year 0−0.1214***(0.0017)−0.1141***(0.0018)−0.2612***(0.0094)−0.1179***(0.0074)
Year 1−0.0558***(0.0014)−0.0501***(0.0014)−0.1953***(0.0086)−0.0413***(0.0059)
Year 2−0.0461***(0.0012)−0.0416***(0.0013)−0.1728***(0.0084)−0.0328***(0.0054)
Year 3−0.0451***(0.0011)−0.0414***(0.0012)−0.1506***(0.0080)−0.0356***(0.0048)
Year 4−0.0438***(0.0011)−0.0406***(0.0011)−0.1482***(0.0079)−0.0375***(0.0046)
Year 5−0.0475***(0.0010)−0.0453***(0.0011)−0.1328***(0.0075)−0.0362***(0.0044)
Year 6−0.0488***(0.0010)−0.0460***(0.0010)−0.1450***(0.0075)−0.0481***(0.0043)
Year 7−0.0481***(0.0010)−0.0463***(0.0010)−0.1342***(0.0076)−0.0449***(0.0042)
Year 8−0.0469***(0.0009)−0.0450***(0.0010)−0.1397***(0.0078)−0.0563***(0.0042)
R-squared0.07550.07410.21210.0650

Note(s): This table reports the dynamic effects of childbirth on female employment from year 0 to year 8 using a pseudo-event study design based on Equation (1). Each coefficient represents the change in employment probability relative to the year before childbirth (event year t=2). The overall effect is the average employment penalty across event years 0–8. Robust standard errors clustered at the age-by-gender level are in parentheses. *, ** and *** are statistical significance levels at 10%, 5% and 1%, respectively

Source(s): Authors’ elaborations

Supplements

Supplementary data

References

Abadie
,
A.
,
Athey
,
S.
,
Imbens
,
G.W.
and
Wooldridge
,
J.M.
(
2022
), “
When should you adjust standard errors for clustering?
”,
Quarterly Journal of Economics
, Vol. 
138
No. 
1
, pp. 
1
-
35
, doi: .
AEA
(
2021
), “
Understanding the child penalty
”,
Emerican economic association, available at:
 Link to the website (
accessed
 28 August 2024).
Andresen
,
M.E.
and
Nix
,
E.
(
2026
), “
You cannot force me into caregiving: paternity leave and the child penalty
”,
The Economic Journal
, Vol. 
136
No. 
674
, pp. 
780
-
797
, doi: .
Angelov
,
N.
,
Johansson
,
P.
and
Lindahl
,
E.
(
2016
), “
Parenthood and the gender gap in pay
”,
Journal of Labor Economics
, Vol. 
34
No. 
3
, pp. 
545
-
579
, doi: .
Badaoui
,
E.
and
Matteazzi
,
E.
(
2026
), “
Cultural-policy framework and mothers' earnings penalty: a European comparison
”,
Kyklos
, Vol. 
79
No. 
1
, pp. 
53
-
69
, doi: .
Blau
,
F.D.
and
Kahn
,
L.M.
(
2017
), “
The gender wage gap: extent, trends, and explanations
”,
Journal of Economic Literature
, Vol. 
55
No. 
3
, pp. 
789
-
865
, doi: .
Buckley
,
J.
(
2023
), “
Formalising and informalising labour in Vietnam
”,
Journal of Contemporary Asia
, Vol. 
53
No. 
2
, pp. 
207
-
232
, doi: .
Budig
,
M.J.
and
Hodges
,
M.J.
(
2010
), “
Differences in disadvantage: variation in the motherhood penalty across white women's earnings distribution
”,
American Sociological Review
, Vol. 
75
No. 
5
, pp. 
705
-
728
, doi: .
Carmichael
,
F.
,
Darko
,
C.
,
Kanji
,
S.
and
Vasilakos
,
N.
(
2023
), “
The contribution of girls' longer hours in unpaid work to gender gaps in early adult employment: evidence from Ethiopia, India, Peru and Vietnam
”,
Feminist Economics
, Vol. 
29
No. 
1
, pp. 
1
-
37
, doi: .
Castel
,
P.
and
To
,
T.-T.
(
2012
), “
Informal employment in the formal sector: wages and social security tax evasion in Vietnam
”,
Journal of the Asia Pacific Economy
, Vol. 
17
No. 
4
, pp. 
616
-
631
, doi: .
Chowdhury
,
I.
,
Johnson
,
H.C.
,
Mannava
,
A.
and
Perova
,
E.
(
2019
), “
Gender gap in earnings in Vietnam: why do Vietnamese women work in lower paid occupations?
”,
Journal of Southeast Asian Economies
, Vol. 
36
No. 
3
, pp. 
400
-
423
.
Chu
,
Y.-W.L.
,
Cuffe
,
H.E.
and
Doan
,
N.
(
2021
), “
Motherhood employment penalty and gender wage gap across countries: 1990-2010
”,
School of Economics and Finance · Te Kura Ohaoha Pūtea: Working Paper Series. Wellington, New Zealand, Victoria University of Wellington
,
Chu
,
Y.-W.L.
,
Cuffe
,
H.E.
and
Doan
,
N.
(
2023
), “
Gender wage gap and child employment penalty across countries
”,
SSRN 3584920
, doi: .
Cortés
,
P.
and
Pan
,
J.
(
2023
), “
Children and the remaining gender gaps in the labor market
”,
Journal of Economic Literature
, Vol. 
61
No. 
4
, pp. 
1359
-
1409
, doi: .
Cukrowska-Torzewska
,
E.
(
2017
), “
Cross-country evidence on motherhood employment and wage gaps: the role of work–family policies and their interaction
”,
Social Politics: International Studies in Gender, State and Society
, Vol. 
24
No. 
2
, pp. 
178
-
220
, doi: .
Cukrowska-Torzewska
,
E.
and
Lovasz
,
A.
(
2020
), “
The role of parenthood in shaping the gender wage gap – a comparative analysis of 26 European countries
”,
Social Science Research
, Vol. 
85
, 102355, doi: .
Cukrowska-Torzewska
,
E.
and
Matysiak
,
A.
(
2020
), “
The motherhood wage penalty: a meta-analysis
”,
Social Science Research
, Vols
88-89
, 102416,
88-89 102416
doi: .
de Linde Leonard
,
M.
and
Stanley
,
T.D.
(
2020
), “
The wages of mothers' labor: a meta-regression analysis
”,
Journal of Marriage and Family
, Vol. 
82
No. 
5
, pp. 
1534
-
1552
, doi: .
Di Leo
,
R.
,
Epifanio
,
M.
,
Scotto
,
T.J.
and
Troeger
,
V.E.
(
2026
), “
The motherhood penalties: insights from women in UK academia
”,
Community, Work and Family
, pp. 
1
-
23
, doi: .
Doan
,
N.
,
Nguyen
,
C.P.
and
Dinh Su
,
T.
(
2025a
), “
Does fiscal decentralization reduce energy poverty? Evidence from Vietnam
”,
Energy Policy
, Vol. 
207
, 114845, doi: .
Doan
,
N.
,
Nguyen
,
C.P.
,
Su
,
T.D.
,
Nguyen
,
B.Q.
and
Le Tran
,
D.T.
(
2025b
), “
Multi-dimensional energy poverty and inequality in Vietnam
”,
Quality and Quantity
, Vol. 
59
No. 
6
, pp. 
5179
-
5210
, doi: .
Doss
,
C.
and
Gottlieb
,
C.
(
2025
), “
Gendered patterns of labor in agriculture
”,
Agricultural Economics
, Vol. 
56
No. 
3
, pp. 
431
-
445
, doi: .
Duletzki
,
L.-M.
and
Lim
,
N.
(
2026
), “
Can early public childcare reduce child penalties? Evidence from Germany
”,
Journal of Public Economics
, Vol. 
258
, 105651, doi: .
Fajardo-Gonzalez
,
J.
,
Hasanbasri
,
A.
and
Rios-Avila
,
F.
(
2024
),
Is There a Gendered Parenthood Penalty in Indonesian Labor Markets?
,
World Bank
,
Washington, DC
.
Felfe
,
C.
(
2012
), “
The motherhood wage gap: what about job amenities?
”,
Labour Economics
, Vol. 
19
No. 
1
, pp. 
59
-
67
, doi: .
Gaddis
,
I.
and
Klasen
,
S.
(
2014
), “
Economic development, structural change, and women's labor force participation
”,
Journal of Population Economics
, Vol. 
27
No. 
3
, pp. 
639
-
681
, doi: .
Goodkind
,
D.M.
(
1995
), “
Vietnam's one-or-two-child policy in action
”,
Population and Development Review
, Vol. 
21
No. 
1
, pp. 
85
-
111
, doi: .
Guilmoto
,
C.Z.
(
2012
), “
Son preference, sex selection, and kinship in Vietnam
”,
Population and Development Review
, Vol. 
38
No. 
1
, pp. 
31
-
54
, doi: .
Harrington
,
E.
and
Kahn
,
M.E.
(
2026
), “
Has the rise of work from Home reduced the motherhood penalty in the labor market?
”,
National Tax Journal
, Vol. 
79
No. 
2
, pp. 
507
-
527
, doi: .
Hoa
,
H.T.
,
Toan
,
N.V.
,
Johansson
,
A.
,
Hoa
,
V.T.
,
Hojer
,
B.
and
Persson
,
L.A.
(
1996
), “
Child spacing and two child policy in practice in rural Vietnam: cross sectional survey
”,
BMJ
, Vol. 
313
No. 
7065
, pp. 
1113
-
1116
, doi: .
Huang
,
W.
,
Wang
,
Y.
,
Wu
,
H.
and
Zhou
,
Y.
(
2025
), “
The motherhood penalty and low fertility in China: a pseudo-event study
”,
Journal of Population Economics
, Vol. 
38
No. 
1
, p.
28
, doi: .
Jee
,
E.
,
Misra
,
J.
and
Murray-Close
,
M.
(
2019
), “
Motherhood penalties in the U.S., 1986-2014
”,
Journal of Marriage and Family
, Vol. 
81
No. 
2
, pp. 
434
-
449
, doi: .
Jin
,
M.
,
Landais
,
C.
,
Sevilla Sanz
,
A.S.
and
Dodds
,
A.
(
2024
), “
The ‘child penalty’ creates most of the gender earnings gaps in rich countries
”,
LSE Business Review
,
available at
: Link to the website (
accessed 04 December, 2025
).
Kang
,
J.Y.
,
Lee
,
W.
,
Ham
,
S.
and
Wang
,
J.S.-H.
(
2024
), “
Motherhood or marriage penalty? A comparative perspective on employment and wage in East Asia and Western countries
”,
Family Relations
, Vol. 
73
No. 
1
, pp. 
223
-
246
, doi: .
Kleven
,
H.
(
2022
),
The Geography of Child Penalties and Gender Norms: A Pseudo-event Study Approach
,
National Bureau of Economic Research
,
Cambridge, MA
.
Kleven
,
H.
,
Landais
,
C.
,
Posch
,
J.
,
Steinhauer
,
A.
and
Zweimüller
,
J.
(
2019a
), “
Child penalties across countries: evidence and explanations
”,
AEA Papers and Proceedings
, Vol. 
109
, pp. 
122
-
126
, doi: .
Kleven
,
H.
,
Landais
,
C.
and
Søgaard
,
J.E.
(
2019b
), “
Children and gender inequality: evidence from Denmark
”,
American Economic Journal: Applied Economics
, Vol. 
11
No. 
4
, pp. 
181
-
209
, doi: .
Kleven
,
H.
,
Landais
,
C.
and
Søgaard
,
J.E.
(
2021
), “
Does biology drive child penalties? Evidence from biological and adoptive families
”,
The American Economic Review: Insights
, Vol. 
3
No. 
2
, pp. 
183
-
198
, doi: .
Kleven
,
H.
,
Landais
,
C.
and
Leite-Mariante
,
G.
(
2025
), “
The child penalty atlas
”,
The Review of Economic Studies
, Vol. 
92
No. 
5
, pp. 
3174
-
3207
, doi: .
Kong
,
S.
and
Dong
,
H.
(
2024
), “
The doubly disadvantaged: the motherhood penalty for internal migrants in China
”,
Journal of Marriage and Family
, Vol. 
86
No. 
1
, pp. 
199
-
218
, doi: .
Lebedinski
,
L.
,
Perugini
,
C.
and
Vladisavljević
,
M.
(
2023
), “
Child penalty in Russia: evidence from an event study
”,
Review of Economics of the Household
, Vol. 
21
No. 
1
, pp. 
173
-
215
, doi: .
Liu
,
A.Y.C.
(
2004
), “
Gender wage gap in Vietnam: 1993 to 1998
”,
Journal of Comparative Economics
, Vol. 
32
No. 
3
, pp. 
586
-
596
, doi: .
Liu
,
Y.
,
Barrett
,
C.B.
,
Pham
,
T.
and
Violette
,
W.
(
2020
), “
The intertemporal evolution of agriculture and labor over a rapid structural transformation: lessons from Vietnam
”,
Food Policy
, Vol. 
94
, 101913, doi: .
Marjit
,
S.
,
Gupta
,
K.
,
Nag
,
R.N.
,
Mahata
,
S.
and
Basak
,
S.
(
2026
), “
Transcending boundaries: navigating structural shifts and labor market transitions through global value chains
”,
Review of Development Economics
, Vol. 
30
No. 
1
, pp. 
662
-
678
, doi: .
McCaig
,
B.
and
Pavcnik
,
N.
(
2013
), “
Moving out of agriculture: structural change in Vietnam
”,
NBER Working Paper, Cambridge, MA, US, National Bureau of Economic Research
, doi: .
Meng
,
L.
,
Zhang
,
Y.
and
Zou
,
B.
(
2023
), “
The motherhood penalty in China: magnitudes, trends, and the role of grandparenting
”,
Journal of Comparative Economics
, Vol. 
51
No. 
1
, pp. 
105
-
132
, doi: .
Miller
,
D.L.
(
2023
), “
An introductory guide to event study models
”,
The Journal of Economic Perspectives
, Vol. 
37
No. 
2
, pp. 
203
-
230
, doi: .
Mincer
,
J.
and
Polachek
,
S.
(
1974
), “
Family investments in human capital: earnings of women
”,
Journal of Political Economy
, Vol. 
82
No. 
2
,
Part 2
, pp. 
S76
-
S108
, doi: .
Nguyen
,
A.-T.
,
Anwar
,
S.
,
Alexander
,
W.R.J.
and
Lu
,
S.-H.
(
2022
), “
Openness to trade, foreign direct investment, and economic growth in Vietnam
”,
Applied Economics
, Vol. 
54
No. 
29
, pp. 
3373
-
3391
, doi: .
Obermann
,
G.
,
Hoang Oanh
,
N.
and
Hong Ngoc
,
N.
(
2021
), “
Gender pay gap in Vietnam: a propensity score matching analysis
”,
Journal of Economics and Development
, Vol. 
23
No. 
3
, pp. 
238
-
253
, doi: .
Olivetti
,
C.
and
Petrongolo
,
B.
(
2014
), “
Gender gaps across countries and skills: demand, supply and the industry structure
”,
Review of Economic Dynamics
, Vol. 
17
No. 
4
, pp. 
842
-
859
, doi: .
Petrongolo
,
B.
and
Ronchi
,
M.
(
2020
), “
Gender gaps and the structure of local labor markets
”,
Labour Economics
, Vol. 
64
, 101819, doi: .
Rodrigues-Silveira
,
R.
(
2025
), “Structural changes in Brazilian employment (2002-2021)”, in
Torrejón Pérez
,
S.
,
Fernández-Macías
,
E.
and
Hurley
,
J.
(Eds),
Global Trends in Job Polarisation and Upgrading: A Comparison of Developed and Developing Economies
,
Springer Nature Switzerland
,
Cham
, pp. 
201
-
230
, doi: .
Sundberg
,
A.
(
2024
), “
The child penalty in Sweden: evidence, trends, and child gender
”,
IFAU working paper, Uppsala, Sweden, IFAU-Institute for Evaluation of Labour Market and Education Policy
.
Tuyen
,
N.N.
(
1999
), “
Transitional economy, technological change and women's employment: the case of Vietnam
”,
Gender, Technology and Development
, Vol. 
3
No. 
1
, pp. 
43
-
64
, doi: .
Udayanga
,
S.
(
2024
), “
Motherhood penalty and labour market integration of immigrant women: a review on evidence from four OECD countries
”,
Societies
, Vol. 
14
No. 
9
, p.
162
, doi: .
Villanueva
,
A.
and
Lin
,
K.-H.
(
2019
), “
Motherhood wage penalties in Latin America: the significance of labor informality
”,
Social Forces
, Vol. 
99
No. 
1
, pp. 
59
-
85
, doi: .
Vo
,
T.T.
and
Truong
,
T.-H.
(
2023
), “
Gender division of household workforce in Vietnam: role of international trade and fertility
”,
Economic Analysis and Policy
, Vol. 
80
, pp. 
1696
-
1718
, doi: .
Vo
,
P.H.
,
Penrose
,
K.
and
Jody Heymann
,
S.
(
2007
), “
Working to exit poverty while caring for children's health and development in Vietnam
”,
Community, Work and Family
, Vol. 
10
No. 
2
, pp. 
179
-
199
, doi: .
Vu
,
K.
and
Glewwe
,
P.
(
2022
), “
Maternity benefits mandate and women's choice of work in Vietnam
”,
World Development
, Vol. 
158
, 105964, doi: .
Vu
,
T.M.
and
Yamada
,
H.
(
2018
), “
Decomposing Vietnamese gender equality in terms of wage distribution
”,
Pacific Economic Review
, Vol. 
23
No. 
5
, pp. 
705
-
731
, doi: .
White
,
M.J.
,
Djamba
,
Y.K.
and
Anh
,
D.N.
(
2001
), “
Implications of economic reform and spatial mobility for fertility in Vietnam
”,
Population Research and Policy Review
, Vol. 
20
No. 
3
, pp. 
207
-
228
, doi: .
Zamberlan
,
A.
and
Barbieri
,
P.
(
2023
), “
A ‘potential motherhood’ penalty? A longitudinal analysis of the wage gap based on potential fertility in Germany and the United Kingdom
”,
European Sociological Review
, Vol. 
39
No. 
6
, pp. 
920
-
934
, doi: .
Zhang
,
M.
,
Wang
,
Y.
and
Hou
,
L.
(
2024
), “
Gender norms and the child penalty in China
”,
Journal of Economic Behavior and Organization
, Vol. 
221
, pp. 
277
-
291
, doi: .
Zhou
,
X.
,
Ye
,
J.
,
Li
,
H.
and
Yu
,
H.
(
2022
), “
The rising child penalty in China
”,
China Economic Review
, Vol. 
76
, 101869, doi: .

Languages

or Create an Account

Close Modal
Close Modal