Online learning communities on social media platforms can support peer learning, but educators often lack theoretically grounded and measurable approaches for monitoring how participation and discourse evolve across a semester. This study proposes an extended Community of Inquiry (CoI) evaluation framework that integrates Social, Teaching, and Cognitive Presence with a fourth behavioural dimension, Student Presence.
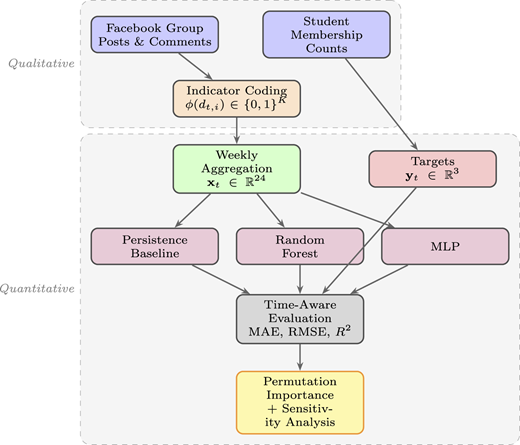
A sequential exploratory mixed-method design was adopted. Qualitative analysis of prior literature and semester-long observations of two large first-year engineering course Facebook groups (each enrolling 800–1000 students) informed an indicator-based coding scheme, applied quantitatively over Weeks 1–13. Predictive modelling used a persistence baseline, a multi-output Random Forest, and a multilayer perceptron under time-aware evaluation protocols.
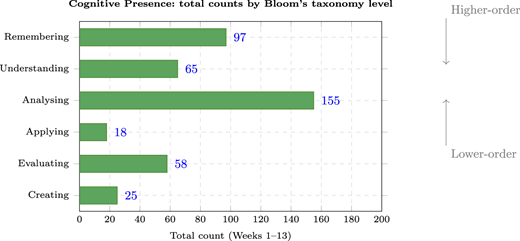
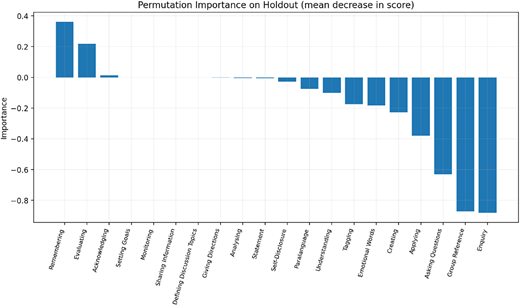
Social Presence was enquiry-driven and peaked in Weeks 3–4; Teaching Presence was frontloaded and primarily reactive; Cognitive Presence was shallow, dominated by remembering and analysing. Student participation was consumption-oriented, with observers consistently outnumbering posters. Random Forest achieved consistent poster prediction (R2 ˜ 0.48–0.49), while observers and non-members remained difficult to forecast due to structural interdependence. Permutation importance identified remembering and evaluating as the most influential cognitive predictors.
The dataset comprises 13 weekly observations from a single platform and institution, limiting generalisability. Future work should collect multi-cohort data, introduce lagged predictors, and explore individual-level modelling.
The framework provides instructors with an early-warning system for low poster activity, enabling timely, evidence-based interventions to support online peer learning communities.
This study makes three contributions: a multi-dimensional coding scheme grounded in the extended CoI framework; a data-driven analytics pipeline enabling descriptive monitoring and predictive modelling of participation roles; and an integrated evaluation framework that combines theory-grounded indicator coding with transparent machine learning to produce actionable insights from social media learning data.
1. Introduction
Digital technology has fundamentally transformed how students learn and collaborate. Online learning communities are now integral to higher education, offering flexible environments that extend classroom interaction beyond physical boundaries (Bruggeman et al., 2021). Within these environments, peer interaction is not incidental — it is foundational. Research consistently shows that both instructor–learner and peer-to-peer exchanges are essential for building knowledge, sustaining engagement, and fostering a sense of belonging (Freeman and Jarvie-Eggart, 2019; Garrison, 2022; Lai et al., 2019).
As online education expands, understanding what makes peer interactions effective has become a pressing concern. However, evaluating the quality and impact of these interactions in digital settings remains an open challenge (Babik et al., 2024). Most existing approaches assess isolated dimensions, such as cognitive gains, while privileging outcomes over the processes through which learning unfolds (Yu and Schunn, 2023). Peer learning is inherently dynamic. It evolves in response to shifting group dynamics, course milestones, and individual participation patterns — none of which static, outcome-focused measures adequately capture (Chen et al., 2024; Moon et al., 2024; Zhang et al., 2025). A unified, multi-dimensional framework that evaluates both the process and progress of peer learning over time is therefore lacking.
To address this gap, this study investigates effective methods for assessing peer learning in online learning environments. A mixed-methods investigation was conducted at an Australian university, where student and instructor interactions were analysed across a full semester. The study context comprised two compulsory first-year engineering courses at The University of Queensland, using Facebook-based course discussion groups as the online platform. This setting provided a rich, naturalistic dataset spanning thirteen weeks, enabling analysis of both the processes and outcomes of student participation.
The proposed solution is a comprehensive evaluation framework with two integrated components. The first is a theory-grounded coding scheme informed by the Community of Inquiry (CoI) model (Garrison et al., 1999) and extended through the inclusion of student presence (Dokhanchi et al., 2018). It operationalises four dimensions of peer learning discourse — student, cognitive, teaching, and social presences — into measurable weekly indicators. The second is a data-driven analytics pipeline that couples with the coding scheme to support descriptive monitoring of engagement patterns and exploratory prediction of student participation roles over time. Together, these components equip instructors and researchers with a practical tool for tracking how online peer learning communities develop and identifying which discourse patterns are associated with active, meaningful participation.
The contributions of this study are as follows:
A multi-dimensional coding scheme grounded in the CoI framework and extended with student presence, operationalising four dimensions of peer learning discourse into measurable weekly indicators for systematic evaluation.
A data-driven analytics pipeline coupled with the coding scheme to enable descriptive monitoring of weekly engagement patterns and predictive modelling of student participation roles over time.
A practical, integrated evaluation framework that empowers instructors and researchers to analyse learner–learner and learner–instructor interactions, inform instructional design, and identify opportunities for improving online learning communities.
2. Related work
Researchers have previously highlighted the importance of interaction in online learning environments (Freeman and Jarvie-Eggart, 2019; Lai et al., 2019). Collaboration emerging from learner–learner and learner–instructor interactions is the key contributor to successful learning (Palloff and Pratt, 1999), as such interactions help learners test ideas, receive feedback, and refine their understanding (Wagner, 1997). While interactions positively influence students' satisfaction and engagement (Liu et al., 2017), they must be structured and cohesive to enable higher levels of critical thinking and knowledge construction (Garrison and Cleveland-Innes, 2005).
Multiple scholars have attempted to categorise types of interaction. For example, Wagner (1997) focused on learners' achievement, whereas Hare et al. (1994) distinguished between task-driven and socio-emotional interactions. Task-driven interactions emphasise completing assigned work and tend to be instructor-oriented, while socio-emotional interaction focuses on relationships between learners (Rovai, 2002) and incorporates individual factors such as personality and emotions (Delahunty et al., 2014).
There are four types of interactions in online learning: learner–learner, learner–instructor (Moore, 1989, 1993), learner–content (Liu and Kaye, 2016), and learner–interface (Hillman et al., 1994). Table 1 summarises these four widely recognised types of interactions in online learning environments.
Given the focus of this study on peer learning, the review now turns to the two dimensions most relevant to peer learning: learner–learner and learner–instructor interactions.
2.1 Learner–learner interaction
Learner–learner interactions in online learning communities play a critical role in fostering a sense of community (Xie and Yen, 2011), supporting cognitive development (Lin et al., 2017), and strengthening interpersonal skills (Lee, 2002). Although active contributors positively shape collaborative learning, a high proportion of passive participants or “lurkers” can negatively impact group interaction dynamics.
Several frameworks have been proposed to analyse learner–learner online interactions. Bravo et al. (2008) introduced a three-stage model consisting of observation, abstraction, and intervention, where interaction data are first observed and collected then analysed, and finally used to design improvements to collaboration. Similarly, Ke and Xie (2009) developed a framework based on Cercone (2008) deep learning model incorporating social interaction, knowledge construction, and regulation of learning. Vuopala et al. (2016) created a coding scheme distinguishing between task-related and group-related interactions to assess collaborative learning processes.
These frameworks highlight the multidimensional nature of learner–learner interaction, reinforcing the need for evaluation models that capture both social and cognitive aspects of peer learning.
2.2 Learner–instructor interaction
Instructor involvement is essential in online peer learning communities because peer interaction alone does not always lead to productive outcomes (Kanuka and Garrison, 2004; Xie et al., 2018; Zhu, 2006). Instructors structure discussions, guide inquiry, and sustain engagement through feedback (Shute, 2008). Majeski and Stover (2007) show that instructor facilitation shapes the depth of discourse, moving students from surface-level exchange toward higher-order reflection. This study therefore analyses instructor and student interactions in parallel rather than treating them as separate phenomena.
2.3 Dimensions for evaluating interactions in online learning communities
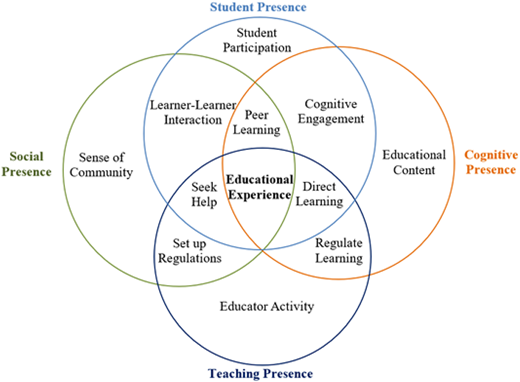
This study adopts the extended Community of Inquiry (CoI) framework, which provides a multidimensional lens for analysing interactions in online learning environments. Garrison et al. (1999) originally identified three interrelated presences—cognitive, social, and teaching—as overlapping processes that shape the quality of the learning experience and determine student engagement in online education. Cognitive presence reflects the extent to which learners develop meaningful understanding through inquiry and reflection. Social presence refers to the learners' ability to present themselves authentically and build connections within the learning community. Teaching presence encompasses the design, facilitation, and instructional direction provided by the instructor. Later extensions to the model introduced Student Presence, which emphasises learners' self-regulation, agency, and active participation in managing their learning (Dokhanchi et al., 2018). A study conducted by Dokhanchi et al. (2018) found that student presence, cognitive presence, teaching presence, and social presence affect peer learning in online learning environments. These four dimensions collectively provide a holistic framework for evaluating the complexity of interactions within online peer learning environments.
2.3.1 Cognitive presence
Garrison et al. (1999) categorised students' cognitive engagements as triggering events, exploration, integration, and resolution. Building on this work, Zhu (2006) examined student cognitive engagement processes in online learning communities, identifying processes such as seeking, interpreting, analysing, summarising information, and making decisions. More recently, Fiock (Fiock (2020) provided a comprehensive review of strategies to enhance cognitive presence in online learning environments, aligning instructional design with the Community of Inquiry framework to support deeper engagement and critical thinking.
2.3.2 Social presence
To measure social presence in online learning communities, Rourke et al. (1999) coded students' messages into affective, interactive, and cohesive categories. Swan and Shih (2005) expanded these categories by adding indicators such as expressing values and social expression. Similarly, Vuopala et al. (2016) analysed students' social interactions by including expressing cohesion, decreasing tension, and accompanying indicators in their coding scheme. Borup et al. (2012) used emotional expressions, open communication, and cohesion categories to analyse social presence. According to Borup et al. (2012), the presence of group cohesiveness indicators in online learning communities indicates the existence of a sense of community among members.
2.3.3 Teaching presence
Teaching presence has been conceptualised in various ways. Berge (1995) coded instructor posts into managerial, social, pedagogical, and technical indicators, while Anderson et al. (2001) organised teachers' presence around instructional design and organisation, facilitating discourse, and direct instruction. More recently, Stenbom (Stenbom (2018) reviewed empirical research on teaching presence in online environments and proposed a refined model highlighting the dynamic and context-dependent nature of instructional roles. Teaching presence is particularly relevant in peer learning contexts, as instructors play a crucial role in structuring discussions, guiding inquiry, and sustaining student engagement.
2.3.4 Student presence
Beyond the original three dimensions of the CoI framework, scholars have increasingly recognised the importance of a fourth dimension, often referred to as Student Presence. Early work by Shea and Bidjerano (2009) introduced the idea of Learner Presence as an extension of the model, emphasising the role of self-regulation and learner agency in online education. Their subsequent study (Shea and Bidjerano, 2012) further positioned Learning Presence as a moderating factor within the CoI framework and provided empirical evidence of its significance. Building on this perspective, Redmond (2014) highlighted the centrality of learner agency and self-directed effort in shaping meaningful engagement. More recently, studies identified Student Presence as the missing presence in the CoI framework, formally proposing it as a distinct and essential dimension (Ng et al., 2021). Similarly, Dokhanchi et al. (2018) adopted Student Presence as the fourth presence, framing it as a reflection of students' active participation and responsibility within online learning communities.
Figure 1 shows the theoretical relationships among the four presences, and situates the extended CoI dimensions within the analytical pipeline of the proposed framework. End-to-end pipeline of the proposed framework is shown in Figure 2. The qualitative phase produces the coding scheme and indicator definitions. The quantitative phase aggregates coded indicators into weekly feature vectors, trains three competing models, and evaluates them under time-aware protocols before extracting interpretability results.
3. The proposed framework
To address the research question and meet the study objectives, a mixed-method research design was adopted (Creswell and Creswell, 2017). This approach was selected to capture both the interpretive depth of peer-learning discourse and the measurable breadth of behavioural participation in online learning environments. Importantly, the choice of mixed methods aligns with the multi-dimensional nature of the proposed evaluation framework, which integrates Social Presence, Teaching Presence, Cognitive Presence, and Student Presence. The study followed a sequential exploratory strategy in which qualitative insights were used to construct the coding scheme and quantitative analysis was then used to apply, validate, and summarise the resulting indicators at scale.
In the qualitative phase, an extensive review of relevant literature was conducted alongside systematic observation of student and instructor interactions within the online learning communities across the semester. This stage provided an in-depth understanding of how peer learning unfolded over time and guided the iterative development of coding categories and indicators grounded in the extended CoI framework. In particular, qualitative analysis supported the refinement of indicator definitions, the clarification of boundary cases, and the alignment of the coding scheme with the communicative practices typical of social media environments. Building on this foundation, the quantitative strand operationalised the developed evaluation scheme to measure weekly interaction patterns. This enabled the research team to quantify participation levels, characterise the distribution of the four presences, and examine how these dimensions manifested and co-evolved across the semester as part of the peer-learning process.
The study was conducted at the University of Queensland using two compulsory first-year engineering courses. These large, team-based courses, each enrolling approximately 800–1000 students annually, were selected because they rely heavily on collaboration and peer interaction, making them well-suited for investigating online peer learning at scale. Course Facebook groups served as the primary online discussion platforms, offering an authentic, student-driven setting for observing peer support, instructor facilitation, and knowledge construction behaviours. Ethical approval for the study was obtained from the University of Queensland (Approval No. 2018000264), and permission to collect and analyse data was granted by the respective course coordinators.
3.1 Theoretical positioning of the extended CoI model
The proposed framework integrates (1) a theory-grounded coding scheme based on the extended Community of Inquiry (CoI) model (Garrison et al., 1999) and (2) a data-driven modelling and validation layer to quantify, predict, and interpret student participation dynamics in online peer learning communities. The coding scheme was developed through an iterative process informed by the original CoI framework and its later extension incorporating student presence. The categories and indicators were designed to reflect the key factors that affect online peer learning—namely student, cognitive, teaching, and social presences (Dokhanchi et al., 2018)—through: (1) reviewing existing coding schemes in the literature and (2) analysing student and instructor interactions in course Facebook groups across Weeks 1–13. Table 2 summarises the parameters used to guide the development of the framework.
Beyond descriptive analytics, the proposed framework contributes a modelling component that learns relationships between weekly aggregates of Social/Teaching/Cognitive indicators (inputs) and Student Presence participation roles (outputs). Specifically, the modelling layer aims to predict weekly Student Presence role counts (Poster, Observer, Non-Member) from weekly aggregates of Social, Teaching, and Cognitive presence indicators. This predictive component serves two purposes: (1) evaluation of whether the coded indicators contain sufficient signal to forecast participation behaviour and (2) insight generation by identifying which indicators are most strongly associated with student role changes over time.
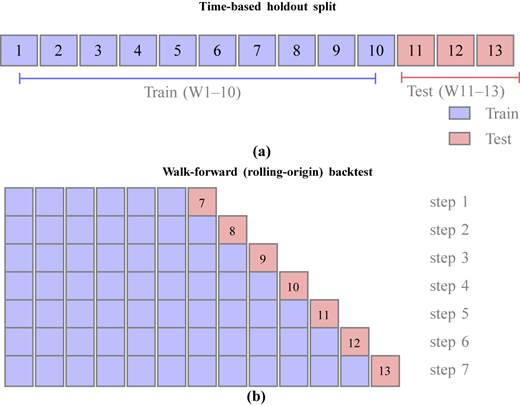
To ensure methodological rigour for time-ordered data, the evaluation uses (1) a time-based holdout split (train on Weeks 1–10; test on Weeks 11–13) and (2) a walk-forward (rolling-origin) backtest that repeatedly trains on early weeks and predicts the next unseen week. These protocols reduce temporal leakage and provide a more credible estimate of performance under realistic deployment settings.
Table 3 summarises how each presence dimension was extended in this study relative to its original formulation.
3.2 Mathematical formulation of the weekly coding process
Let t ∈ {1, …, T} index academic weeks, where T = 13. Each week contains a set of discourse artefacts (posts and comments) denoted , where nt is the count of artefacts in week t. A coding function maps each artefact to a K-dimensional binary indicator vector:
Where ϕk(dt,i) = 1 if indicator k is present in artefact dt,i and 0 otherwise. A single artefact can receive multiple indicators (multi-label coding). Weekly counts are obtained by summing across artefacts:
The weekly feature vector concatenates all indicator counts:
In this study, xt combines indicators from Social, Teaching, and Cognitive Presence, yielding K = 24 predictors.
3.3 Student presence as a multi-output response
Student Presence is represented by three weekly role counts:
Where , , and denote Poster, Observer, and Non-Member counts respectively. The full dataset is then the set of paired weekly observations:
Because the three targets sum to total enrolment in each week (modulo rounding due to joining and leaving), they are structurally coupled. Specifically:
Where Nenrol denotes total enrolment. This linear dependence means that an accurate prediction of any two targets almost determines the third, but it also means that errors in one target propagate to the others. This structural constraint is an important consideration when interpreting multi-output model performance.
3.4 Predictive modelling objective
The modelling layer learns a function fθ(⋅) that maps presence indicators to weekly participation roles:
Where θ denotes model parameters. Fitting is expressed as empirical risk minimisation:
3.5 Baselines and models
Three approaches were used.
3.5.1 Persistence baseline
The simplest reasonable baseline predicts next week's counts using the current week's values:
A model that cannot outperform this baseline provides no practical forecasting value.
3.5.2 Random Forest (multi-output regression)
Random Forest averages predictions from an ensemble of M decision trees:
Random Forest is well suited to small tabular datasets because it captures non-linear feature interactions without requiring large training samples, and it produces interpretable importance scores as a by-product of training.
3.5.3 Multilayer perceptron (MLP)
A deep multi-output regressor applies a composition of affine transformations and nonlinearities:
Where σ(⋅) is a nonlinear activation function (ReLU in this implementation) and are trainable parameters. The MLP was included to test whether a higher-capacity model improves performance relative to Random Forest when the training set is small.
3.6 Time-aware evaluation protocols
To prevent temporal leakage, two evaluation strategies were applied.
3.6.1 Time-based holdout split
The model was trained on Weeks 1–10 and tested on Weeks 11–13. This mirrors the situation where an instructor uses early-semester signals to forecast late-semester participation.
3.6.2 Walk-forward (rolling-origin) backtest
Given a minimum training size t0, the model is retrained on weeks {1, …, t − 1} and tested on week t for each t = t0 + 1, …, T:
Walk-forward evaluation is more conservative than a single holdout split because each prediction is made strictly from past data, and the model must generalise across multiple time points rather than just three.
Figure 3 illustrates both evaluation protocols.
3.7 Performance metrics
For each target q ∈ {P, O, N}, mean absolute error (MAE) and root mean squared error (RMSE) measure average and worst-case prediction error:
The coefficient of determination R2 expresses explained variance relative to a mean baseline:
Where is the mean of the true values on the test interval. A negative R2 indicates that the model performs worse than simply predicting the mean, which is itself a practically important finding in small-sample settings.
3.8 Interpretability: permutation importance and sensitivity analysis
To identify influential indicators, permutation importance is computed by measuring the degradation in predictive score after randomly permuting feature k:
Where s(⋅) is the model score (e.g. multi-output R2), and denotes the test matrix with the k-th feature permuted.
Additionally, a one-dimensional what-if sensitivity analysis visualises the effect of varying feature k while holding all other features fixed at a reference vector xref (e.g. training mean):
Where ek is the k-th canonical basis vector. This yields an interpretable curve relating feature values to predicted participation roles.
3.9 Coding scheme: presence indicators
3.9.1 Student presence
Student presence reflects the degree to which learners actively participate in the online community. Participation levels were observed and coded weekly across the semester, resulting in three categories: posters, observers, and non-members (Table 4). In addition to descriptive coding, these categories were operationalised as weekly target variables in the modelling layer, enabling the quantitative analysis of how Social/Teaching/Cognitive presence indicators relate to participation dynamics.
Posters are active participants who create posts in online learning communities. Observers or lurkers do not actively participate in discussions; however, they learn by observing the discussions. They are passive participants and may become active participants at any time during the semester. Non-members in online communities can join the community anytime and become observers or posters during the semester.
3.9.2 Cognitive presence
In this research, the cognitive presence section of the coding scheme was developed based on observation of students' course-related posts adopting Bloom's taxonomy framework (Anderson and Bloom, 2001). Indicators reflect six cognitive processes: remembering, understanding, applying, analysing, evaluating, and creating. Table 5 presents the categories, definitions, and representative examples drawn from course Facebook group discussions.
In the modelling layer, cognitive presence indicators form a subset of the predictor vector xt and quantify the cognitive depth of weekly discourse. This enables empirical testing of whether higher-order cognitive activity is associated with changes in participation roles, and supports interpretability analyses that identify which cognitive processes are most influential.
3.9.3 Social presence
Social presence captures how learners project themselves socially and emotionally within the online community. Students' course and non-course related posts in online discussions were observed. Table 6 presents the coding scheme that was developed in this research to analyse social presence in online learning communities. Students' posts and comments are categorised into group cohesiveness, conversational expression, and affective expression. Each category is divided further into different indicators.
In the modelling layer, social presence indicators represent interactional and affective signals and constitute a subset of xt. This supports quantitative evaluation of whether socio-emotional projection and group cohesion co-vary with participation roles (Poster/Observer/Non-Member), complementing the qualitative interpretation of discourse.
3.9.4 Teaching presence
Teaching presence was examined through course coordinators' and tutors' posts in online discussions. Indicators were organized into three categories: design and plan, facilitating discourse, and directing discourse. These categories capture instructors' roles in structuring learning activities, encouraging engagement, monitoring discussions, and providing clarification or guidance. Table 7 sets out the coding scheme developed to investigate teaching presence in online learning communities.
Teaching presence indicators are included in xt as contextual signals reflecting instructional design and facilitation. Their inclusion enables the modelling layer to assess whether instructor behaviours (e.g. clarifying, giving directions, and encouraging) relate to transitions between participation roles over time.
4. Discussion and experimental results
Based on the weekly interaction analysis (Table 8) and the predictive modelling outputs, this section synthesises (1) descriptive insights about Social, Teaching, Cognitive, and Student Presence dynamics over Weeks 1–13 and (2) quantitative evidence from exploratory analysis, forecasting experiments, and interpretability methods. Together, these results provide a multi-perspective understanding of online peer learning behaviour in the course Facebook group.
4.1 Dataset
The merged dataset contains 13 weekly observations and 27 variables: 24 predictors (Social, Teaching, and Cognitive Presence indicators) and three targets (Poster, Observer, Non-Member). The small sample size has two practical consequences. First, any individual performance metric is sensitive to a single anomalous week, so MAE, RMSE, and R2 must be interpreted cautiously and in combination. Second, complex models with many parameters (such as the MLP) are highly prone to overfitting. Because the dataset is small and time-ordered, model estimates and generalisation performance are highly sensitive to overfitting and to the chosen evaluation protocol. Therefore, the analysis combines descriptive statistics (Table 8), time-series visualisation, time-aware splits, walk-forward validation, and interpretability tools.
4.2 Presence dynamics across the semester
4.2.1 Social presence
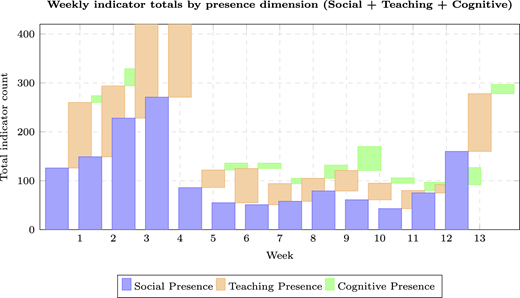
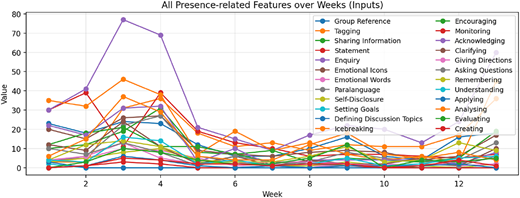
Social presence recorded robust interaction over the semester (Table 8), particularly through Enquiry, which peaks in Weeks 3 and 4. This pattern suggests alignment with demanding course content and/or assessment pressure points that triggered clarification-seeking and peer support. Sustained Statement and Tagging activity indicates an active conversational environment that supported informal collaboration. Emotional Icons and Emotional Words appear at moderate levels, while Self-Disclosure remains low, which is typical for formal academic contexts. Overall, the social presence evidence suggests that peer support for academic problem solving was prioritised over emotional bonding.
The dominance of Enquiry over Emotional Words and Self-Disclosure suggests that students used the Facebook group primarily for academic problem solving rather than social bonding. This is an important distinction for instructors: high Social Presence in an engineering course Facebook group does not necessarily imply community warmth; it may simply reflect high information-seeking activity around deadlines.
4.2.2 Teaching presence
Teaching Presence was highest in early weeks and concentrated in two indicators: Providing Information and Icebreaking. Setting Goals and Defining Discussion Topics occurred only in Week 1, and Monitoring was almost entirely absent. This pattern points to a reactive instructor role: instructors respond to student questions, but they do not proactively shape the discourse beyond establishing initial community norms.
A proactive Teaching Presence, in which instructors set discussion topics, prompt students with higher-order questions, and monitor discourse quality over time, may be a realistic lever for shifting Cognitive Presence from lower-order to higher-order processes. The data here do not allow a causal test of that hypothesis, but the pattern creates a testable implication for future studies.
4.2.3 Cognitive presence
Cognitive Presence was the least frequent dimension, and the discourse that was coded remained concentrated at the lower end of Bloom's taxonomy. Remembering and analysing together account for the majority of coded cognitive activity. Evaluating, Creating, and Applying each appeared infrequently, with weekly counts rarely exceeding five.
This finding is consistent with the informal nature of a social media discussion platform, where structured prompts that would support higher-order thinking (e.g. reflective tasks, case analyses) are absent. It also aligns with prior work showing that deeper cognitive engagement in online environments requires sustained instructional scaffolding (Fiock, 2020; Garrison and Cleveland-Innes, 2005).
4.2.4 Student presence
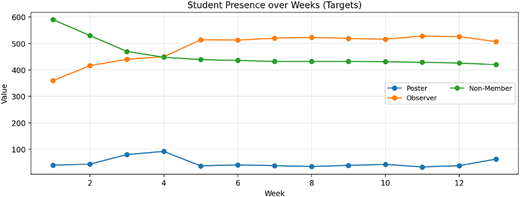
Observer counts dominated throughout the semester, ranging from 360 in Week 1 to a peak of 528 in Week 11. Poster counts were modest, peaking at 92 in Week 4 and then declining to a trough of 33 in Week 11. Non-Member counts declined monotonically from 590 in Week 1–420 in Week 13, indicating steady uptake of group membership. However, membership growth did not translate into posting: of the 170 students who joined between Weeks 1 and 13, virtually all became Observers rather than Posters.
The Week 4 Poster spike coincides with a peak in Enquiry (69), Analysing (29), Tagging (36), and Providing Information (76), suggesting that assessment pressure simultaneously raised the volume of discourse and the proportion of students who posted at least once. The Week 13 Poster spike (63) shows a similar but smaller pattern.
4.3 Exploratory data analysis
4.3.1 Temporal Trends
Figures 6–7 visualise weekly dynamics of (1) the targets and (2) the presence indicators. Abrupt changes can reduce the effectiveness of simple baselines and hinder model generalisation, while smoother patterns can be exploited more reliably by machine learning models.
4.3.2 Target distributions
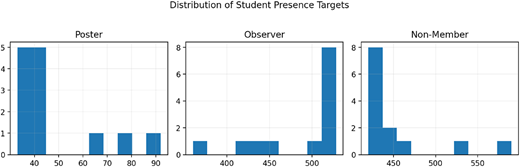
Figure 8 presents the empirical distribution of the targets. Differences in spread and skewness can explain discrepancies in predictive difficulty; highly variable targets are harder to forecast in small-sample settings.
4.3.3 Correlation structure
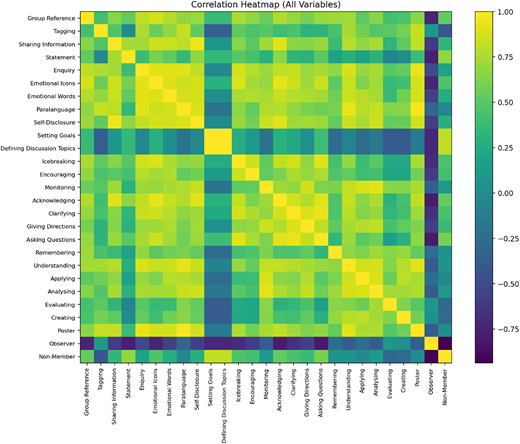
Figure 9 shows the correlation matrix over all variables, highlighting associations between presence indicators and student roles, predictor multicollinearity, and dependencies among targets.
Top associations with targets (association only; not causal):
Poster: Paralanguage (0.973), Enquiry (0.926), Understanding (0.915), Emotional Icons (0.873), Emotional Words (0.872), Self-Disclosure (0.862), Tagging (0.829), Sharing Information (0.826), Acknowledging (0.811), Analysing (0.765).
Observer: Non-Member (0.937), Asking Questions (0.798), Acknowledging (0.782), Statement (0.767), Emotional Icons (0.738), Group Reference (0.727), Setting Goals (0.717), Defining Discussion Topics (0.717), Icebreaking (0.691), Clarifying (0.665).
Non-Member: Observer (0.937), Setting Goals (0.816), Defining Discussion Topics (0.816), Statement (0.678), Asking Questions (0.605), Acknowledging (0.534), Group Reference (0.532), Emotional Icons (0.464), Icebreaking (0.458), Clarifying (0.444).
Interpretation: Poster correlates strongly with socio-emotional signals (paralanguage, emotional cues, self-disclosure), suggesting that active posters exhibit richer social presence. Observer and Non-Member are strongly coupled (r ≈ 0.94), indicating structural interdependence and complicating independent prediction.
4.4 Predictive modelling results
4.4.1 Evaluation protocol
A time-based split was adopted to reflect realistic forecasting conditions and prevent information leakage: models were trained on Weeks 1–10 and evaluated on unseen future weeks (Weeks 11–13). This setup mirrors how an instructor would predict upcoming participation from earlier signals. To strengthen reliability, a walk-forward (rolling-origin) backtest was also performed, repeatedly retraining on expanding histories and testing week-by-week.
4.4.2 Persistence baseline
The persistence baseline produced a negative R2 for all three targets on the holdout set (Table 9). Poster showed the largest error (MAE = 13.33), reflecting the sharp jump in Week 13 (from 38 to 63) that the baseline could not anticipate. The negative R2 values confirm that end-of-semester behaviour is not a simple continuation of mid-semester behaviour.
4.4.3 Random Forest.
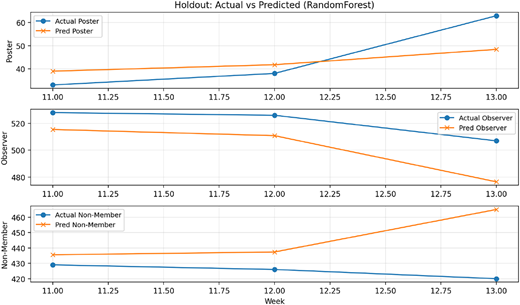
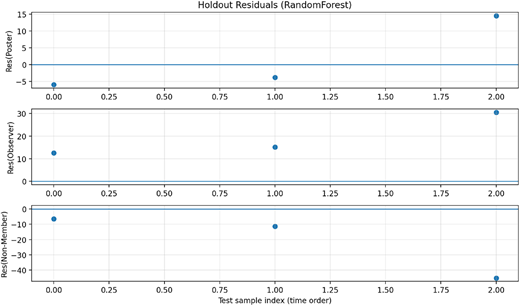
Holdout evaluation (Weeks 11–13): To assess out-of-sample generalisation in a realistic forecasting setting, the RandomForest model was trained on the first ten weeks (Weeks 1–10) and evaluated on the final three weeks (Weeks 11–13), ensuring that no future information leaked into the training stage. Table 10 reports the resulting error metrics (MAE and RMSE) together with R2 for each student-presence target and for the overall multi-output prediction. In addition to the tabulated metrics, Figures 10–11 provide complementary diagnostic views. Figure 10 plots the actual and predicted trajectories across the holdout weeks, allowing visual inspection of whether the model captures the direction and magnitude of changes near the end of the semester. Figure 11 displays residual errors in time order, which helps identify systematic bias (consistent over- or under-estimation) and potential regime changes that may occur in the final weeks (e.g. assessment-related shifts). Together, these results quantify predictive accuracy while also revealing whether errors are stable or concentrated in specific weeks or targets, thereby supporting a more reliable interpretation of model performance under time-ordered educational data.
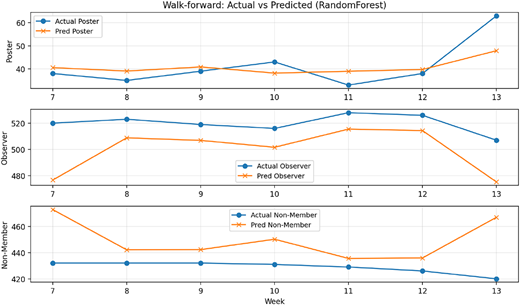
Walk-forward backtest: To obtain a more robust estimate of time-series generalisation, a walk-forward (rolling-origin) backtest was performed. In this setting, the model is repeatedly retrained on an expanding window of past weeks and evaluated on the next unseen week, better reflecting deployment conditions. Table 11 summarises aggregate performance across all tested weeks, while Figure 12 visualises predicted versus observed values over time (see Table 12).
Interpretation: RandomForest improves Poster prediction consistently, achieving positive R2 values that indicate meaningful predictive signal in the presence of indicators for active participation. In contrast, Observer and Non-Member remain difficult to model, likely due to their strong interdependence (changes in one often imply changes in the other), temporal non-stationarity across weeks, and the limited sample size, which amplifies variance and sensitivity to outliers.
4.4.4 MLP
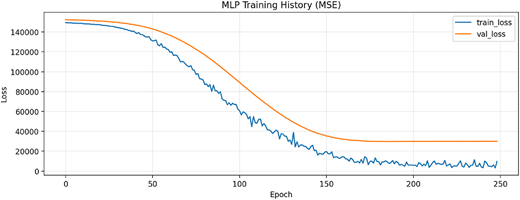
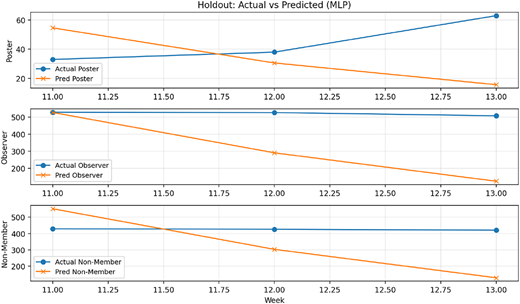
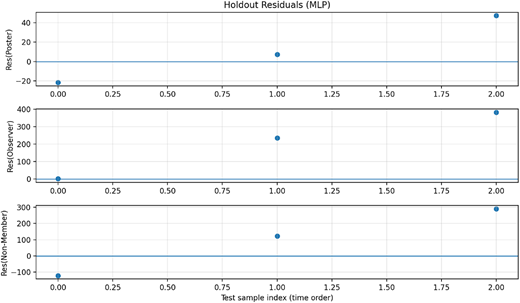
To examine whether a nonlinear deep model can capture more complex relationships among presence indicators, a multi-output MLP was trained on Weeks 1–10 and evaluated on the holdout period (Weeks 11–13). Table 12 reports performance metrics, while Figures 13–15 illustrate optimisation behaviour (training/validation loss) and residual errors, highlighting generalisation limitations under scarce data. The MLP performed poorly across all targets and evaluation settings (Table 12). The Observer R2 of −751.39 and Non-Member R2 of −2728.34 indicate catastrophic overfitting: the model fitted Week 1–10 patterns so tightly that it predicted values far outside the plausible range on the holdout. With only 10 training observations, a three-layer MLP with hundreds of parameters has far more capacity than the data can support. This result confirms that deep models are not suitable for datasets of this size, regardless of their theoretical expressiveness.
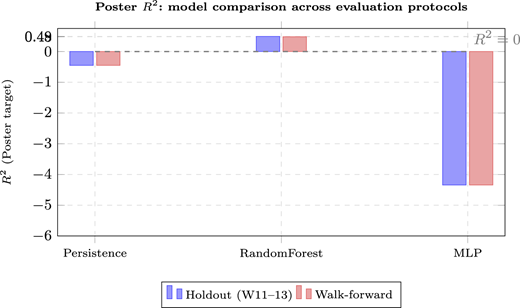
Figure 16 provides a direct visual comparison of R2 values for Poster across the three models and both evaluation protocols.
4.5 Interpretability
4.5.1 Feature importance
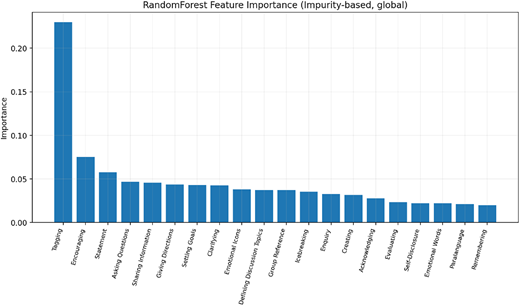
To better understand which indicators contribute most to prediction, feature relevance was examined using two complementary approaches. Impurity-based importance (Figure 17) provides a global view derived from the average reduction in split impurity across trees, but it can be biased under multicollinearity. Permutation importance (Figure 18) evaluates test-time influence by measuring performance degradation when a feature is randomly shuffled.
Acknowledging a Teaching Presence indicator appears next. Instructor posts that tag individual students may stimulate those students and their peers to become more active, although the correlational nature of this finding prevents a causal interpretation.
4.5.2 Sensitivity analysis
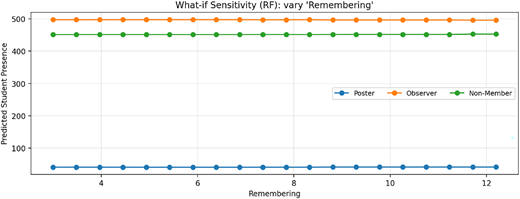
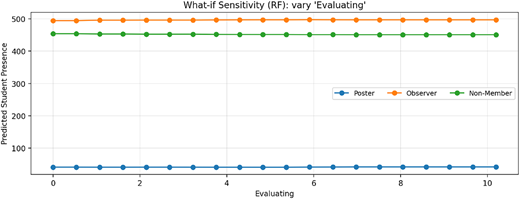
The sensitivity curves for Remembering show a non-linear relationship with Poster predictions: as Remembering counts increase from the 10th to the 90th percentile, predicted Poster counts rise and then plateau (Figures 19–20). A similar pattern appears for Evaluating. These curves suggest that moderate levels of cognitive discourse are associated with increases in posting, but gains taper off at high counts. This may reflect a ceiling effect: a class discussion can only sustain a limited number of active contributors regardless of how rich the cognitive content becomes.
4.6 Synthesis
Five findings emerge from the combined descriptive and predictive analysis.
Social Presence is enquiry-driven and assessment-sensitive, peaking when deadlines approach and declining in low-pressure weeks.
Teaching Presence is reactive and frontloaded: instructors provide information and break the ice in early weeks, but do not proactively structure discourse across the semester.
Cognitive Presence is shallow, concentrated in remembering and analysing, with limited evidence of evaluating or creating.
Student participation is consumption-heavy: the Observer role dominates throughout, and posting spikes selectively near assessment events rather than growing steadily.
Random Forest predicts Poster behaviour with positive R2 on both evaluation protocols, but Observer and Non-Member remain difficult due to structural coupling and slow within-semester change.
These findings converge on a practical implication: the presence indicators contain enough signal to predict active posting one to three weeks ahead with moderate accuracy, but they do not reliably predict passive participation levels. For instructors, this means the framework is most useful as an early-warning system for low Poster activity, not as a complete monitoring tool for all forms of participation.
5. Limitations and future directions
The study has several limitations that bound the generalisability and precision of its findings. The dataset contains only 13 weekly observations. At this scale, each R2 value is estimated from three test points (holdout) or seven to eight points (walk-forward), making the metrics sensitive to individual anomalous weeks. Standard errors and confidence intervals on R2 would require bootstrapping procedures that are not feasible with 13 total observations.
The data come from a single platform (Facebook), a single institution (The University of Queensland), and a single discipline (engineering). Facebook groups have specific structural and normative characteristics (e.g. visible likes, informal register, public posts by default) that may not generalise to other platforms such as discussion boards, Slack workspaces, or Microsoft Teams. Coding was performed by a single team, and inter-rater reliability statistics would strengthen confidence in the indicator definitions.
The weekly aggregation level obscures within-week dynamics. A student who posts on Monday of a high-Enquiry week and a student who posts on Friday contribute equally to the weekly Poster count, even though the causal mechanism linking the discourse to their posting decisions may differ.
Future work should address these limitations through several avenues. Collecting data from multiple cohorts and courses would provide the sample sizes needed for more stable estimates and cross-context comparisons. Introducing lagged variables (e.g. last week's Poster count as a predictor) would allow the model to exploit temporal autocorrelation explicitly. Modelling at the individual student level, where the target is a binary “did this student post this week” indicator, would enable a richer analysis and support targeted intervention design. Sequence models (e.g. LSTM or temporal convolutional networks) could be explored once larger longitudinal datasets are available.
6. Conclusion
This study proposed and tested an extended Community of Inquiry framework for monitoring and predicting online peer learning participation in a social media context. The framework integrates four dimensions: Social Presence, Teaching Presence, Cognitive Presence, and Student Presence, and couples a theory-grounded coding scheme with a data-driven analytics pipeline.
The coding scheme operationalises 24 indicators across three presence dimensions and defines three Student Presence roles (Poster, Observer, Non-Member) as observable weekly targets. Applied to two first-year engineering course Facebook groups over 13 weeks, the scheme produced a structured dataset that is small but theoretically rich. Descriptive analysis showed that Social Presence was enquiry-driven, Teaching Presence was reactive, Cognitive Presence was shallow, and student participation was consumption-oriented.
On the predictive side, Random Forest achieved a consistent Poster R2 of approximately 0.48–0.49 on both holdout and walk-forward evaluation, outperforming the persistence baseline and confirming that the coded indicators carry predictive signal for active participation. Observer and Non-Member targets remained difficult to forecast, primarily because their structural interdependence and slow temporal dynamics leave little residual signal for a model to exploit. The MLP failed entirely under data scarcity, reinforcing the importance of selecting model capacity proportional to dataset size.
Permutation importance identified Remembering and Evaluating as the most influential predictors of posting behaviour. Although this finding is exploratory given the small holdout, it offers a plausible pedagogical interpretation: weeks in which students engage cognitively with course content, even at lower cognitive levels, tend to be weeks of higher active participation.
The framework demonstrates that theory-grounded indicator coding can be combined with transparent machine learning to produce actionable and interpretable insights from social media learning data. With appropriate extensions (more cohorts, individual-level modelling, lagged features), the approach has potential to inform real-time monitoring systems that give instructors timely, evidence-based signals about participation dynamics.